
94% of researchers rate our articles as excellent or good
Learn more about the work of our research integrity team to safeguard the quality of each article we publish.
Find out more
ORIGINAL RESEARCH article
Front. Plant Sci., 24 March 2021
Sec. Plant Breeding
Volume 12 - 2021 | https://doi.org/10.3389/fpls.2021.642955
 Yuefeng Ruan1*†
 Bianyun Yu2*†
 Ron E. Knox1
 Wentao Zhang2
 Asheesh K. Singh1‡
 Richard Cuthbert1
 Pierre Fobert3
 Ron DePauw1‡
 Samia Berraies1Andrew Sharpe2‡
 Bin Xiao Fu4Jatinder Sangha1
Grain protein concentration (GPC) is an important trait in durum cultivar development as a major determinant of the nutritional value of grain and end-use product quality. However, it is challenging to simultaneously select both GPC and grain yield (GY) due to the negative correlation between them. To characterize quantitative trait loci (QTL) for GPC and understand the genetic relationship between GPC and GY in Canadian durum wheat, we performed both traditional and conditional QTL mapping using a doubled haploid (DH) population of 162 lines derived from Pelissier × Strongfield. The population was grown in the field over 5 years and GPC was measured. QTL contributing to GPC were detected on chromosome 1B, 2B, 3A, 5B, 7A, and 7B using traditional mapping. One major QTL on 3A (QGpc.spa-3A.3) was consistently detected over 3 years accounting for 9.4–18.1% of the phenotypic variance, with the favorable allele derived from Pelissier. Another major QTL on 7A (QGpc.spa-7A) detected in 3 years explained 6.9–14.8% of the phenotypic variance, with the beneficial allele derived from Strongfield. Comparison of the QTL described here with the results previously reported led to the identification of one novel major QTL on 3A (QGpc.spa-3A.3) and five novel minor QTL on 1B, 2B and 3A. Four QTL were common between traditional and conditional mapping, with QGpc.spa-3A.3 and QGpc.spa-7A detected in multiple environments. The QTL identified by conditional mapping were independent or partially independent of GY, making them of great importance for development of high GPC and high yielding durum.
Durum wheat [Triticum turgidum L. subsp. durum (Desf.) Husn.], is an economically important crop owing to its unique characteristics contributing to semolina for the production of pasta products and other traditional foods such as flat breads, couscous and bulgur (Giraldo et al., 2016). Grain protein concentration (GPC) is an important trait in durum wheat cultivar development. It is a major determinant of the nutritional value of grain, rheological properties of the dough for pasta making, and end-use product quality, and thus the economic value of the crop. GPC is a complex quantitative trait controlled by multiple genomic loci that interact with each other (Nigro et al., 2019). Selection for high GPC in durum wheat is also confounded by the interference of environmental effects at varying degrees. Therefore, multiple combinations of genotype and environment are required for screening GPC in breeding programs. Simultaneous selection of GPC and grain yield (GY) is difficult due to a negative correlation often observed between these two traits in most genetic backgrounds and growing environments (Blanco et al., 2002, 2006; Groos et al., 2003; Bogard et al., 2011). However, shifting the negative correlation has been demonstrated by selecting simultaneously for both GPC and GY (DePauw et al., 2007).
Understanding the genetic basis of GPC in cultivars in their target environment is the key to the deployment of marker assisted selection (MAS) in durum breeding programs for the maintenance or improvement of grain quality. Studies conducted to dissect the genetic basis of GPC in durum wheat have identified quantitative trait loci (QTL) on almost all chromosomes as summarized by Kumar et al. (2018). Among the reported QTL, a few showed major effects while many produced minor effects. Also, most of the identified QTL were environmentally dependent and not stable across various environments. A well-known QTL for GPC is Gpc-B1 on chromosome 6BS. The high GPC allele of this QTL was identified from a wild tetraploid (Triticum turgidum L. ssp. dicoccoides) accession FA-15-3 originating in Israel (Avivi, 1978). Gpc-B1 was mapped on chromosome 6BS accounting for 66% of the variance in GPC (Joppa et al., 1997; Olmos et al., 2003). The ancestral wild allele of GPC-B1 encodes a NAC transcription factor (NAM-B1) and is associated with increased grain protein, Zn, and Fe concentration and also accelerates senescence of flag leaves in wheat (Uauy et al., 2006). Modern wheat varieties carry a non-functional NAM-B1 allele and the functional Gpc-B1 allele has been introgressed into elite cultivars of durum and bread wheat (Chee et al., 2001; Tabbita et al., 2017; Bokore et al., 2019). However, wild type GPC-B1 allele has larger negative effects on yield components in durum wheat, in addition to the undesirable effect of increasing semolina ash concentration (Tabbita et al., 2017).
QTL mapping analysis of GPC was often conducted without considering GY and yield components. However, some recent studies, taking into account GY and yield components simultaneously, have led to the identification of GPC loci without negative effects on yield-related traits (Blanco et al., 2002, 2012; Suprayogi et al., 2009; Rapp et al., 2018; Nigro et al., 2019). For example, a few studies identified GPC QTL without negative effects on GY by mapping grain protein deviation (GPD) derived from the regression of GPC and yield in the diverse durum panel (Rapp et al., 2018; Nigro et al., 2019). Such loci are useful for simultaneous genetic improvement of GPC and GY. A statistical procedure proposed by Zhu (1995) was used for analyzing conditional genetic effects for single developmental traits, which applies the same statistical principle as GPD approach (Rapp et al., 2018; Nigro et al., 2019) to analyze correlated traits including grain protein and yield. This conditional analysis is used to estimate the trait values based on no variation in genetically correlated traits, a method that is very similar to the estimation of adjusted values in a covariance analysis eliminating the influence of correlated traits on the genetic effects of the QTL for targeted traits (Zhao et al., 2006). This model has been further developed to analyze the contribution of each component trait to a complex trait and also to dissect the genetic interrelationship between closely related traits. Conditional QTL mapping has been successfully used for evaluating QTL effects on the target traits conditional on their component traits such as grain yield in rice (Guo et al., 2005) and spike extension length on plant height in wheat (Li C. et al., 2020). Genetic relationship between related traits at QTL level were investigated for oil content in rapeseed with respect to protein content (Zhao et al., 2006), popping expansion volume of maize conditional on grain weight per plant and 100-grain weight (Li et al., 2008), GPC conditional on grain starch content in wheat (Deng et al., 2015), and protein content and oil content in soybean (Li X. et al., 2020). In addition, conditional QTL mapping has been used to elucidate environmental effects on QTL expression based on trait values conditioned on different environments (Xu et al., 2014; Fan et al., 2019). Conditional analysis was performed to study the effects of nitrogen (N) and phosphorus (P) fertilization on the expression of QTL for yield and nitrogen-related traits (Xu et al., 2014) and low N-stress induced QTL in wheat (Fan et al., 2019). Furthermore, conditional QTL mapping can identify additional QTL that are undetectable in traditional mapping.
Using conditional mapping, we expected to identify QTL for GPC that are independently expressed from GY, which can facilitate simultaneous selection of high protein concentration and high GY in durum breeding. Therefore, the objectives of this study were to: (1) identify QTL underlying GPC in Canadian durum wheat in particular those that are stable QTL across multiple environments, (2) specify the QTL for GPC without negative correlated effects on GY by conditional QTL analysis.
A durum population of 162 doubled haploid (DH) lines derived from Pelissier × Strongfield was used in this study. Strongfield is a registered Canada Western Amber Durum variety with strong gluten, high GPC, and low cadmium developed at the Swift Current Research and Development Centre, Swift Current, SK (Clarke et al., 2005). Pelissier, a selection from an Algerian landrace introduced by way of the United States of America, is a founder parent in the Canadian durum wheat gene pool (Clarke et al., 2010). It has high cadmium and lipoxygenase. The DH lines, along with their two parents and controls were tested in field trials at the South Farm of SCRDC (latitude: 50°17′N; longitude: 107°41′W; elevation 825 m) on a Swinton loam (Orthic Brown Chernozem) in four-row plots (2.74 m2/plot) as a randomized complete block design with two replicates. Each trial was grown at two seeding dates with a 1-week interval (early, E; late, L) each year from 2014 to 2016, and only the early seeding date in 2017 and 2018. Each seeding date trial was grown at a different plot-land. Plots were harvested into individual bags using a plot combine. The GY of each plot was measured by a weighing balance and expressed in kg ha−1. The semolina GPC was measured using Near Infrared (NIR) Spectroscopy (Foss NIR 6500) and expressed as a percentage at a 13.5% moisture basis. For phenotypic data analysis and QTL mapping, each seeding date in each year was considered as one environment providing a total of eight environments labeled as E14, L14, E15, L15, E16, L16, E17 and E18. Pre-plant soil testing was conducted each year to determine the rate of fertilizer application. The fertilizers were applied to target 112 kg ha−1 for nitrogen, 70 kg ha−1 for phosphorus and 22.4 kg ha−1 for sulfur. The soil is naturally high in potassium and did not require additional application.
The statistical summary and Shapiro-Wilk normality test were conducted in R (R3.3.2, https://www.r-project.org/). Pairwise phenotypic correlations between environments and between traits were calculated using the Pearson correlation coefficient in the R package Hmisc (version 4.2-0, http://cran.r-project.org/web/packages/Hmisc/index.html).
Analysis of variance (ANOVA) and heritability estimate were performed using the PROC MIXED procedure of SAS 9.3 (SAS Institute, Cary, NC, USA) as described by Ruan et al. (2020). In the mixed model, DH lines (genotypes, G) were considered as fixed effects, while environments (E), genotype × environment (G × E) interactions and replications nested in environments were considered as random effects. The heritability of GPC was calculated as the ratio of the genetic variance and the phenotypic variance across environments using /( + /y + /yr), where , , and were estimates of genotype (G), genotype × environment (G × E) interaction, and residual variance (error), respectively, and y and r represented the numbers of environment and replication. The heritability of GPC in each environment was calculated by using /( + /r), where and were estimates of genotype and residual variance, respectively, and r represented the numbers of replication. For the estimations of the heritability, all effects were considered random.
QTL mapping was performed using the genetic map of Pelissier × Strongfield reported by Ruan et al. (2020). The Infinium iSelect Wheat 90K SNP chip was used for genotyping. A total of 1,212 polymorphic SNP markers with <30% missing data were used for genetic map construction, which lead to the identification of 25 linkage groups (LGs). LGs were assigned to chromosomes based on comparison with an existing high-density SNP-based consensus map of durum wheat (Maccaferri et al., 2019). Mean values of GPC from two replicates in each environment were used for the detection of QTL. Outliers of trait values were detected and removed using a Z-score transformation with a threshold of 3. QTL detection was performed using composite interval mapping (CIM) in WinQTL Cartographer v.2.5 software (Wang S. et al., 2012) (http://statgen.ncsu.edu/qtlcart/WQTLCart.htm). The same parameters as described by Ruan et al. (2020) were used for CIM. QTL detected in different environments were considered the same if the confidence intervals (CI) overlapped and the additive effect was contributed by the same parent. QTL mapped in at least one environment explaining more than 20% of the phenotypic variance or mapped in at least two environments with PVE ≥ 10% were considered as major QTL (Raihan et al., 2016; Zhao et al., 2016). The QTL detected in two or more environments are considered as stable QTL. Graphical representation of linkage groups and QTL on genetic map was performed using MapChart 2.2 software (Voorrips, 2002). Haplotypes were assigned using R package Haplotyper.
The conditional GPC values [GPC|GY, GPC conditional on grain yield (GY)] from each environment were calculated using QGA Station 2.0 (Zhu, 1995) (http://ibi.zju.edu.cn/software/qga/v2.0/index.htm). The conditional phenotypic values (GPC|GY) are the net trait values of GPC independent of variation in GY. QTL mapping for conditional GPC values was performed using the same method as above for the traditional QTL mapping. The QTL identified were defined as conditional QTL. When the QTL identified by the two methods (traditional and conditional) had overlapping CIs, they were assumed to be identical. All reported QTL were designated according to the Recommended Rules for Gene Symbolization in Wheat (http://wheat.pw.usda.gov/ggpages/wgc/98).
Best linear unbiased prediction (BLUP) is a popular method used for analyzing multi-environment trials (Xiao et al., 2016; Choudhury et al., 2019). To eliminate the influence of environmental effects on phenotypic variation, BLUP value of GPC for each line across all environments was estimated using the linear model in R package lme4 (Bates et al., 2015). The BLUP values of DH lines were used as trait data for QTL mapping across all environments as described by Xiao et al. (2016).
Sequences of the 90K SNPs were downloaded from the Kansas University SNP marker database (http://wheatgenomics.plantpath.ksu.edu/snp/). Sequences of SSR markers were retrieved from the GrainGenes database (https://wheat.pw.usda.gov/GG3/). Sequences of DArT markers were downloaded from DArT P/L website (https://www.diversityarrays.com/technology-and-resources/sequences). Physical map positions of SNP, SSR and DArT markers on the genome of durum wheat cv. Svevo (Maccaferri et al., 2019) were aligned using BLASTn at the Svevo portal (https://d-data.interomics.eu). QTL reported in the literature and identified in this study were projected onto the genome of durum cv. Svevo by projecting a single marker closest to the QTL peak position. QTL markers on the physical map of Svevo were drawn using PhenoGram software (http://visualization.ritchielab.org/phenograms/plot).
Figure 1 shows the frequency distribution of GPC in the DH population derived from Pelissier × Strongfield across eight environments from 2014 to 2018. Summary statistics including mean values and standard deviation (SD) of the population mean, minimum and maximum values, range and the probability associated with Student's t-test for the parental means in each environment is shown in Table 1. The distribution of GPC was normal across all environments except environment E16 as indicated by the p-value of the Shapiro-Wilk normality test. The parental line, Strongfield, had significantly higher GPC than Pelissier across all environments except in E16 (Table 1). The individual DH lines had extreme GPC values in all environments and displayed bi-directional transgressive segregation for GPC, as shown by the maximum and minimum values relative to the parents. The mean GPC of the DH population was closer to the parent Strongfield than to the parent Pelissier in most environments. The GPC of the population had the highest mean value in environment E18 (mean = 14.5%) and the lowest mean value in E14 (mean = 12.1%). The largest GPC range was observed in environment E16 and smallest was observed in E17. Moderate Pearson correlation coefficients (0.3–0.67) were observed among DH lines across environments (Supplementary Figure 1). Significant negative correlations from −0.16 to −0.84 were observed between GPC and GY in multiple environments except for E17 and E18 (Figure 2). In general, the higher the grain yield, the stronger the negative correlation between GPC and GY.
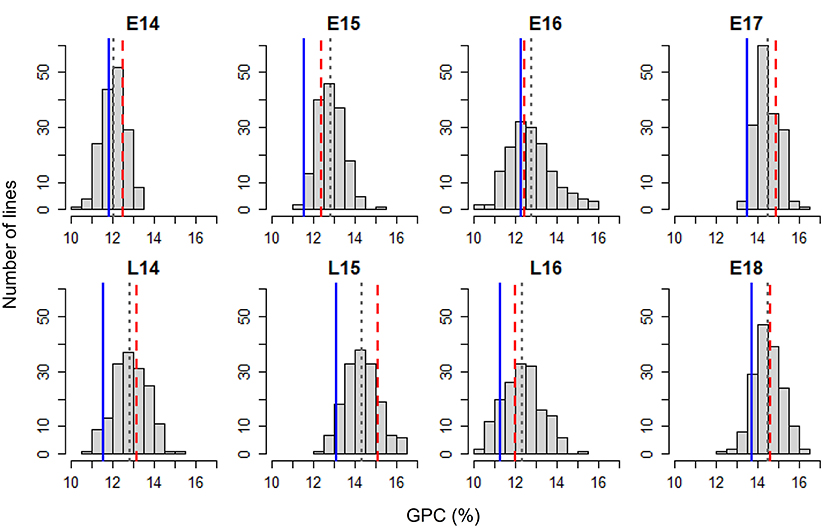
Figure 1. Frequency distribution of grain protein concentration (GPC) in the Pelissier × Strongfield population from 2014 to 2018 field trials with two seeding dates in each year (early, E; late, L) during 2014–2016 and only early seeding date in 2017–2018. Blue solid lines represent Pelissier; red dashed lines represent Strongfield; gray dotted lines indicate mean values of the population.
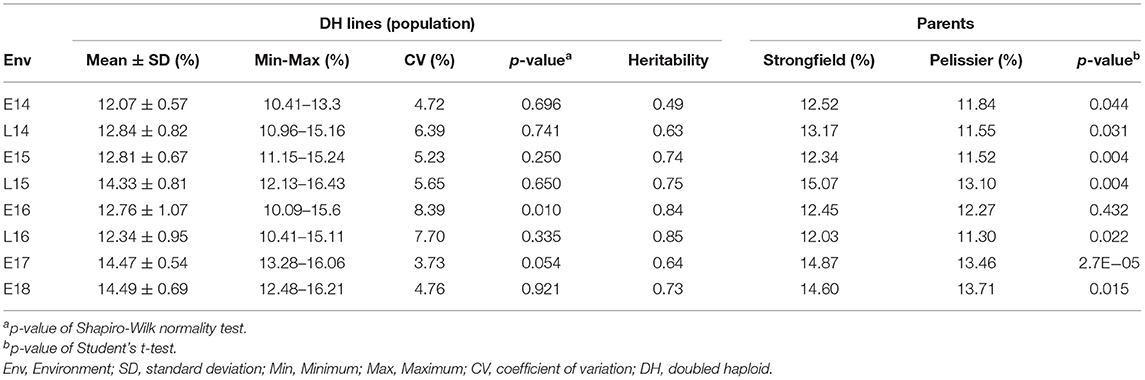
Table 1. Mean, standard deviation, minimum and maximum, coefficient of variation, probability associated with the Shapiro-Wilk normality test of grain protein concentration (GPC) across environments for the Pelissier × Strongfield population, heritability in each environment, GPC mean of the parents and the p-value of Student's t-test for significance between the two parents.
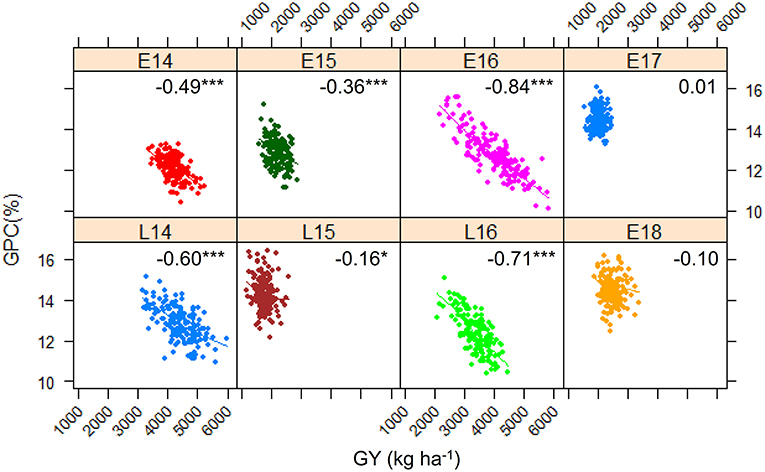
Figure 2. Scatterplot and Pearson correlation coefficient between grain protein concentration (GPC) and grain yield (GY) of the Pelissier × Strongfield population in eight environments. Symbol *indicates significance p < 0.05 and ***p < 0.001.
Although a high broad sense heritability of 0.87 was observed for GPC, genotype × environment interactions was significant as revealed by ANOVA (Table 2). Therefore, QTL analysis was first performed for GPC in each environment. Two to three QTL were detected in each environment (Table 3 and Figure 3). A total of 11 QTL were detected across eight environments, seven of which were specific for a single environment. Both parental lines contributed favorable alleles to different QTL (three by Strongfield and eight by Pelissier). Two QTL were detected in at least four environments with slight shifts in the peak position. The most stable QTL, QGpc.spa-3A.3, located on chromosome 3A, was detected in five environments with a LOD score range of 5.5–10.7 and explaining 9.4–18.1% of the phenotypic variance (R2) in each individual environment. Pelissier contributed the higher GPC allele to QGpc.spa-3A.3. Another stable QTL, QGpc.spa-7A, was detected on chromosome 7A across four environments, explaining up to 14.8% of the phenotypic variance, with the higher GPC allele derived from Strongfield. Two QTL on chromosome 2B, QGpc.spa-2B.1 and QGpc.spa-2B.2, were detected in two out of eight environments. QGpc.spa-2B.1 explained 15–16% of the phenotypic variance and QGpc.spa-2B.2 explained 9–13% of the phenotypic variance, with higher GPC allele from Pelissier at both QTL. In addition, seven QTL, on 1B (QGpc.spa-1B.1), 2B (QGpc.spa-2B.3), 3A (QGpc.spa-3A.1, QGpc.spa-3A.2 and QGpc.spa-3A.4), 5B (QGpc.spa-5B), and 7B (QGpc.spa-7B), were detected in a single environment with R2 values ranging from 4.9 to 6.9%. Pelissier and Strongfield contributed trait increasing alleles to five and two QTL detected in a single environment.
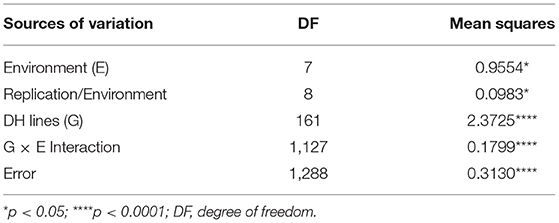
Table 2. Analysis of variance (ANOVA) of grain protein concentration (GPC) across environments.
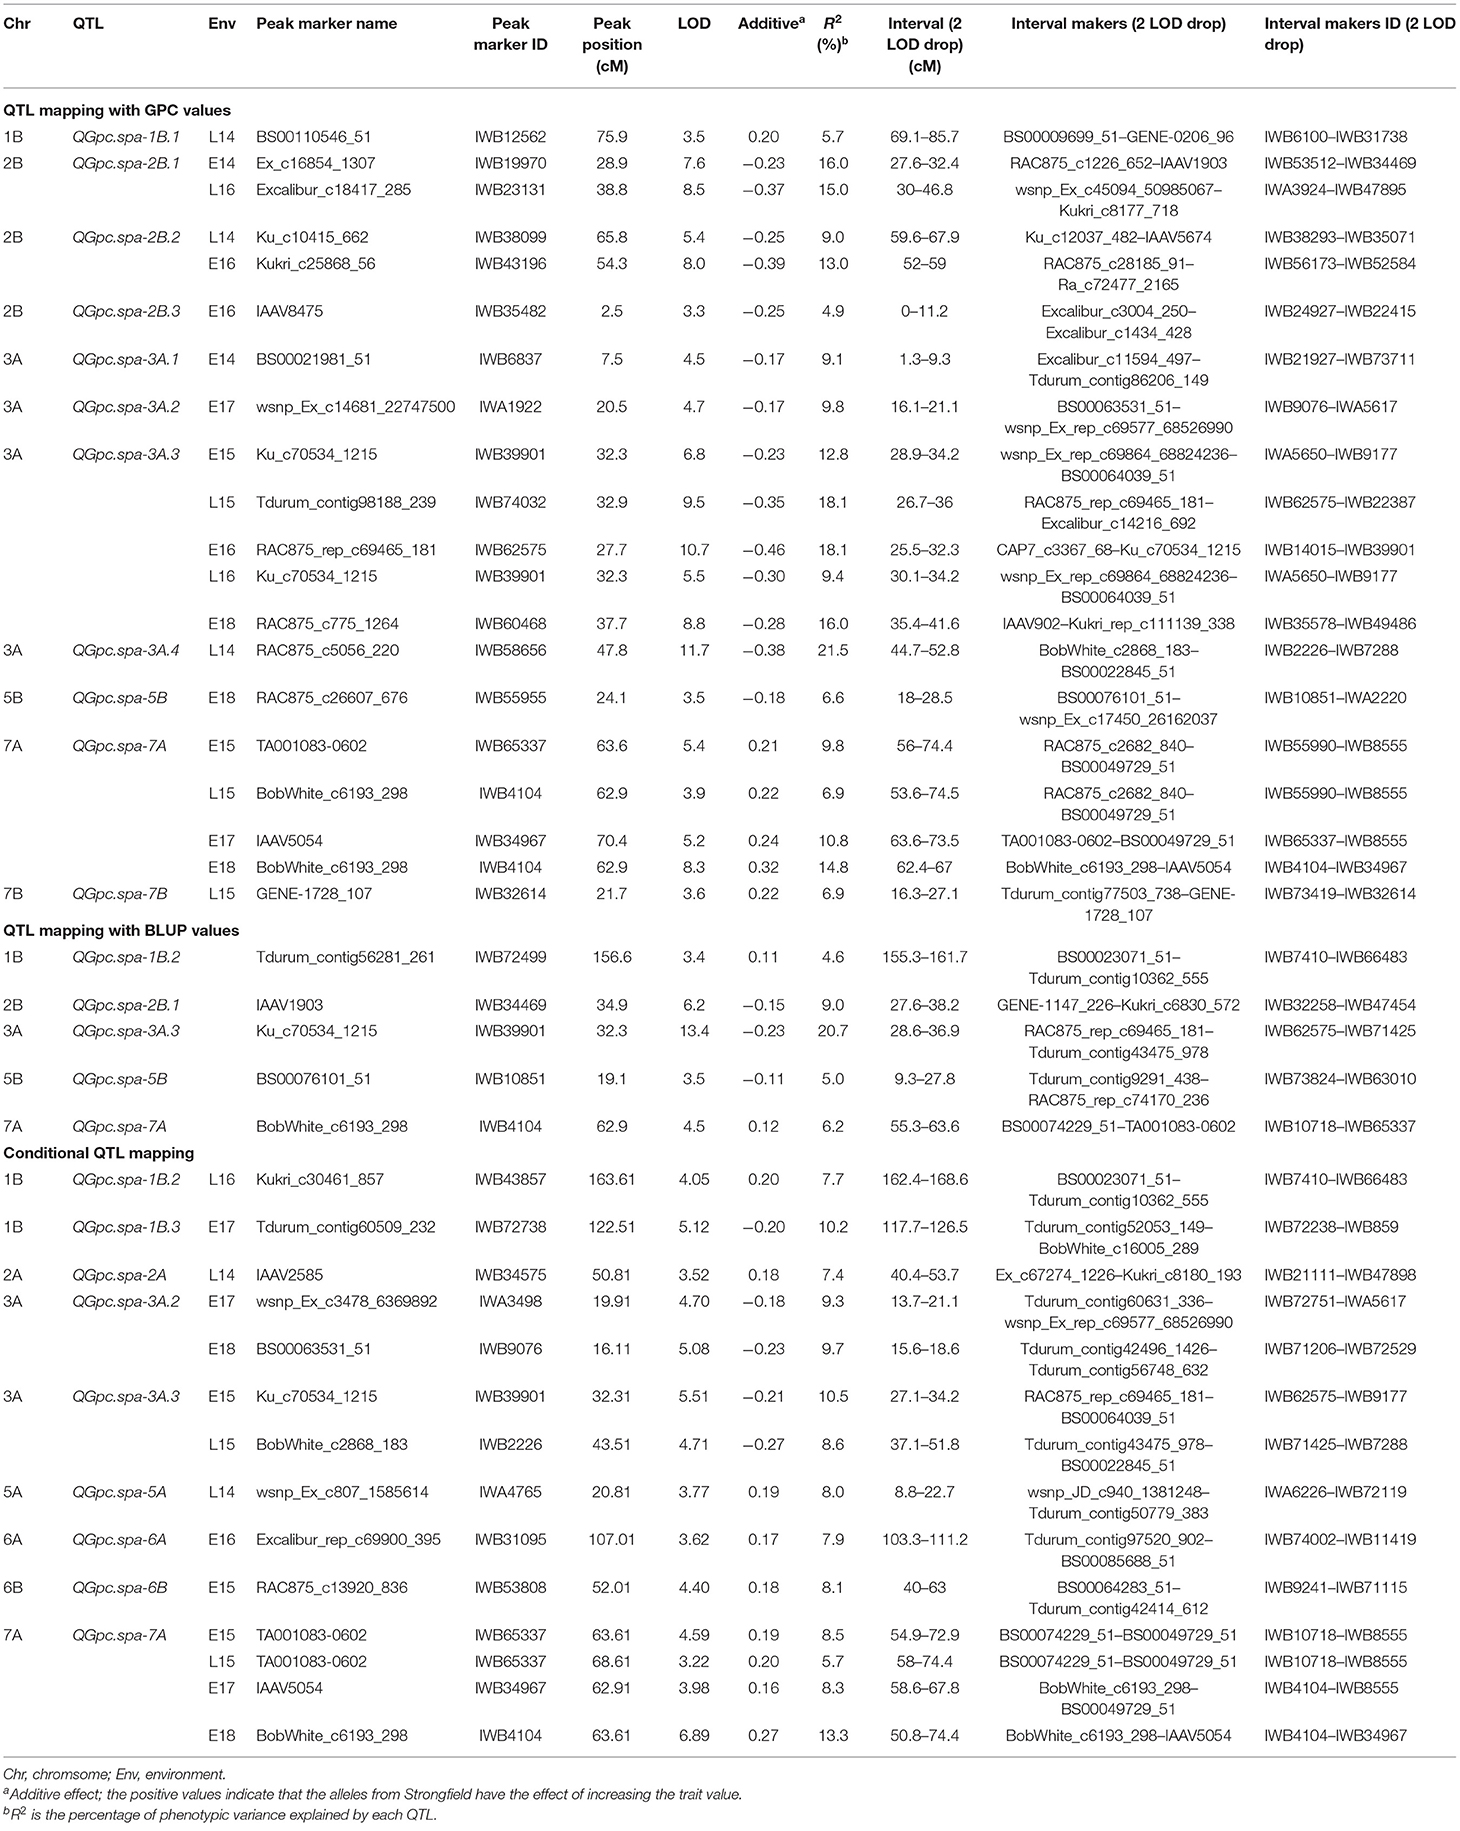
Table 3. Quantitative trait loci (QTL) identified for grain protein concentration (GPC) in the Pelissier × Strongfield population in each environment using GPC values and conditional mapping, and using best linear unbiased prediction (BLUP) values across eight environments, the marker at the peak LOD, peak LOD value, the additive effect, R2, and interval in which the LOD score dropped by 2 points from the peak LOD value.
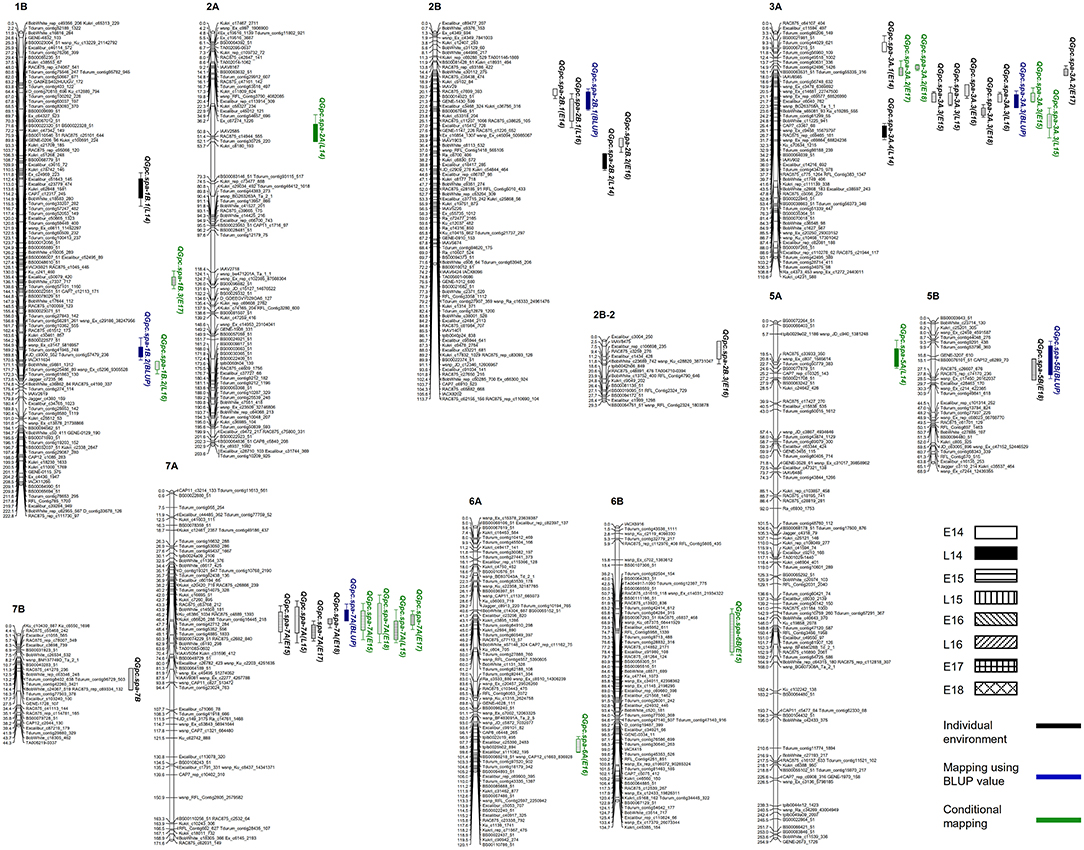
Figure 3. Distribution of quantitative trait loci (QTL) for grain protein concentration (GPC) detected in each environment, by using best linear unbiased prediction (BLUP) values and conditional mapping.
When QTL mapping was conducted using BLUP values across all environments, a total of five QTL were detected on chromosomes 1B, 2B, 3A, 5B and 7A. The phenotypic variance explained by each QTL ranged from 4.6 to 20.7% (Table 3). It is noteworthy that four (QGpc.spa-2B.1, QGpc.spa-3A.3, QGpc.spa-5B, and QGpc.spa-7A) out of five QTL were also detected by QTL mapping in individual environments. The QTL on 1B, 2B, 3A, and 7B that mapped only in one environment using GPC values were not detected using BLUP values. One additional QTL, QGpc.spa-1B.2, was mapped on chromosome 1B using BLUP values with the trait increasing allele attributed to Strongfield.
Nine QTL were detected on seven chromosomes using conditional QTL mapping (Table 3). These QTL explained 5.7–13.3% of the phenotypic variance with LOD values of 3.2–6.9. Six out of nine QTL had trait increasing alleles from Strongfield, while the other three QTL had favorable alleles from Pelissier. Among the conditional QTL identified, four (QGpc.spa-1B.2, QGpc.spa-3A.2, QGpc.spa-3A.3, and QGpc.spa-7A) were also detected by traditional QTL mapping. Particularly important, QGpc.spa-7A was detected in the same four environments by both conditional and traditional QTL mapping. QGpc.spa-3A.2 was detected in two environments (E17 and E18) while it was detected only in E17 by traditional mapping. In contrast, QGpc.spa-3A.3 was detected in two environments (E15 and L15) yet in these two, plus three additional, environments by traditional mapping. QTL detected on chromosome 2B, 5B and 7B by traditional analysis were not identified by conditional mapping. However, five additional QTL on chromosomes 1B (QGpc.spa-1B.3), 2A (QGpc.spa-2A), 5A (QGpc.spa-5A), 6A (QGpc.spa-6A), and 6B (QGpc.spa-6B) were only identified using the conditional mapping.
To investigate the accumulated effects across multiple QTL of the favorable alleles on GPC, the combined haplotype analysis performed on QTL detected using BLUP values and identified in two or more environments using traditional and conditional mapping was restricted to QGpc.spa-3A.3 and QGpc.spa-7A. The SNPs in the 2 LOD interval of each QTL were used for haplotype analysis. Four different haplotypes (Hap1 to Hap4) were identified at different frequencies, with each haplotype represented in 23–41 DH lines (Figure 4A). The DH lines with Hap2 had the best combination of all favorable alleles at each QTL, as evidenced by the highest GPC across all environments although there was no significant difference between Hap 2 and Hap3 in E14, L14, E16, and L16. The lines with Hap4 had the least favorable combination of the alleles. Significant differences were observed for GPC in the lines with these two haplotype groups Hap2 and Hap4 across all environments. Significant differences between the lines with Hap1 and Hap4 for GPC were also observed across all environments. Except in E14 and E17, GPC was significantly different between the lines carrying Hap3 and Hap4 (Figure 4B). We did preliminary assessment of the effectiveness for MAS using the peak marker Ku_c70534_1215 (IWB39901) in QTL QGpc.spa-3A.3 and the peak marker BobWhite_c6193_298 (IWB4104) in QTL QGpc.spa-7A in a total of 131 elite durum lines that have been phenotyped for GPC and genotyped with the same SNP chip as used for the DH lines in this study. Based on the genotypes of the peak marker in the QTL region, the elite lines were separated into two groups with significantly different GPC means (t-test, p < 0.01) (Figure 4C). Negative correlation between GPC and GY in different haplotype groups was indicated by the regression lines (Supplementary Figure 2). The regression line of GPC on GY from Hap4 had the largest slope, intercept and R2, while the regression line of Hap3, carrying favorable allele derived from Pelissier at QGpc.spa-3A.3, showed the smallest slope, intercept and R2. The regression line of Hap 1, carrying favorable allele contributed by Strongfield at QGpc.spa-7A, had reduced slope, intercept and R2 compared with the regression line of Hap4.
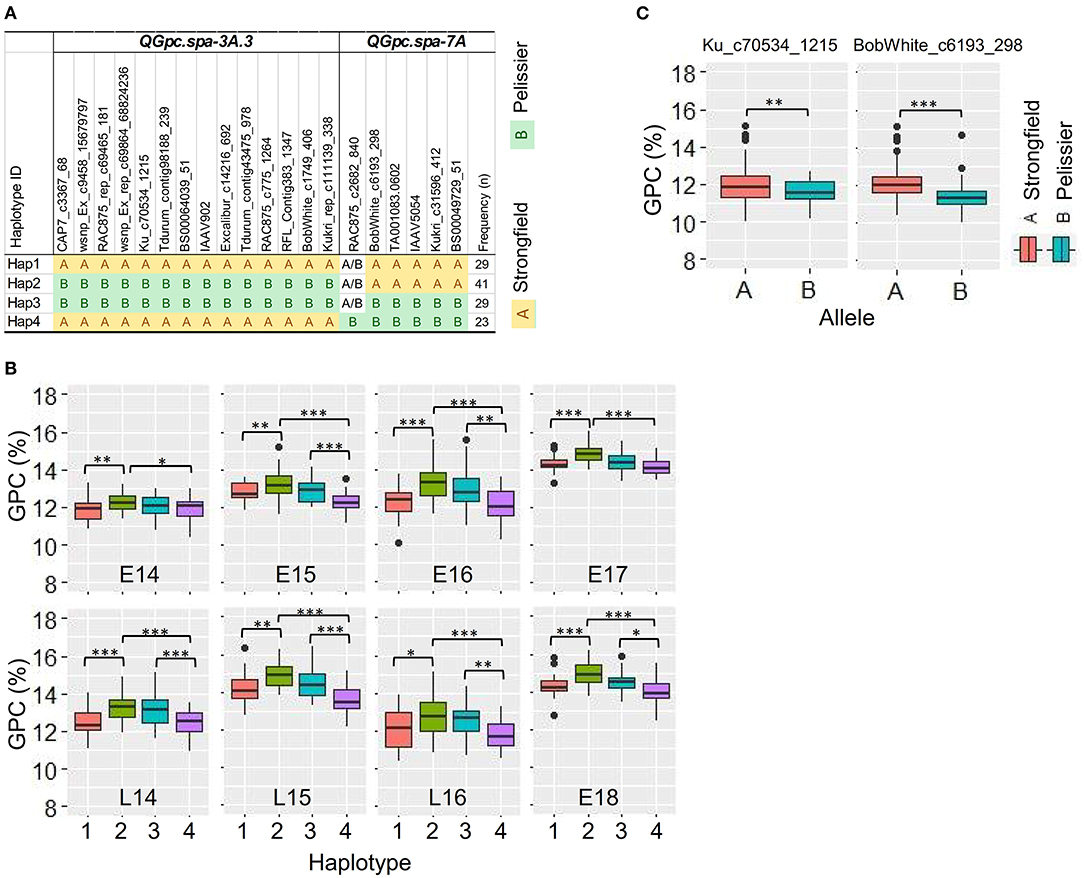
Figure 4. Haplotype analysis of two quantitative trait loci (QTL) in a 2 LOD interval which were detected using best linear unbiased prediction (BLUP) values and identified in two or more environments using traditional and conditional mapping. (A) Haplotype block based on SNP markers in each QTL region. (B) Boxplots of the phenotypic values corresponding to four different haplotype groups in each environment. Haplotypes containing < 3 DH lines were omitted from the table. The DH lines with undetermined haplotype were not shown. (C) Boxplots of GPC values in two groups of elite durum lines (n = 131) separated on the genotype of the peak marker Ku_c70534_1215 in QTL QGpc.spa-3A.3 and the peak marker BobWhite_c6193_298 in QTL QGpc.spa-7A. GPC, grain protein concentration. *p < 0.05; **p < 0.01; ***p < 0.001 of t-test.
When we projected QTL for GPC identified in this study and those reported in the literature onto the reference genome of durum wheat cv. Svevo, we were able to compare the proximity of each (Supplementary Table 1 and Figure 5). The QTL QGpc.spa-1B.1 (M3, IWB12562) was projected on the short arm of chromosome 1B of durum wheat physical map, ~34.4 Mb away from the QTL (M2, wPt-0655) reported by Giraldo et al. (2016) and 35.3 Mb from SSR marker barc18 (M4) associated with GPC reported by Suprayogi et al. (2009). QTL QGpc.spa-1B.2 (M8, IWB72499) on the long arm of chromosome 1B is 29.7 Mb away from the QTL (M7, D1112546) identified by Rapp et al. (2018) and 30.9 Mb from the QTL (M9, IWB60663) reported by Fatiukha et al. (2020) in durum wheat.
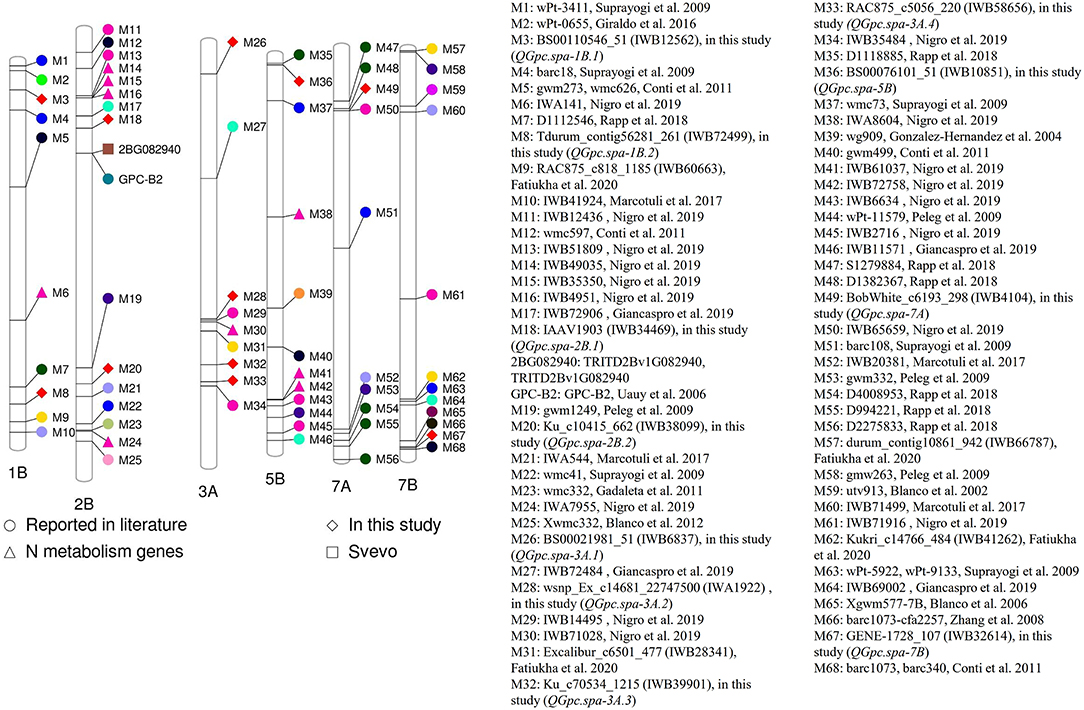
Figure 5. Projection of quantitative trait loci (QTL) for grain protein concentration (GPC) reported in the literature and the QTL identified in two or more environments using traditional and conditional mapping, and using best linear unbiased prediction (BLUP) values in this study onto the reference genome of durum wheat cv. Svevo.
In the present study, QGpc.spa-2B.1 was identified on the short arm while QGpc.spa-2B.2 on the long arm of chromosome 2B. Among the QTL reported by previous studies, the closest QTL to QGpc.spa-2B.1 is the one (M18, IWB72906) with a distance of 22 Mb reported by Giancaspro et al. (2019). QGpc.spa-2B.2 (M20, IWB38099) is 27.7 Mb from the QTL (M19, gwm1249) reported by Peleg et al. (2009) and 22.6 Mb from the QTL (M21, IWA544) reported by Marcotuli et al. (2017). On the short arm of 3A, Giancaspro et al. (2019) reported a QTL (M27, IWB72484) associated with GPC that is 187.6 Mb apart from peak marker of QGpc.spa-3A.1 (M26, IWB6837) detected in this study. The QTL QGpc.spa-3A.3 (M32, IWB39901) on the long arm of chromosome 3A detected in this study and the QTL (M31, IWB28341) reported by Fatiukha et al. (2020) are separated by a physical distance of 59.5 Mb. QGpc.spa-3A.4 (M33, IWB58656) is ~7.8 Mb away from SNP (M34, IWB35484) reported to be associated with GPC in durum wheat by Nigro et al. (2019). QGpc.spa-5B (M36, IWB10851) (M35, D1118885) on 5B is in close proximity of about 3.15 Mb to the QTL reported by Rapp et al. (2018). QGpc.spa-7A (M49, IWB4104) on chromosome 7A is in a distance of 2.24 Mb to the QTL (M48, D1382367) reported by Rapp et al. (2018) and 2.94 Mb to the QTL (M50, IWB65659) reported by Nigro et al. (2019).
In the present study, high broad sense heritability was observed for GPC which is similar to the previously published study (Conti et al., 2011), indicating GPC is mainly controlled by genetic factors. The moderate correlations observed among various environments again suggested a substantial genetic component to the variation of GPC. The 11 QTL detected for GPC using traditional mapping indicates the complex quantitative inheritance of many small-to-medium effect QTL. The four QTL, QGpc.spa-2B.1, QGpc.spa-2B.2, QGpc.spa-3A.3, and QGpc.spa-7A, were repeatedly detected in two or more environments although additive effects of these QTL diverged in the magnitude among different environments. Similarly, QTL × environment interaction was reported for GPC in durum wheat (Conti et al., 2011). The fact that two of these QTL, QGpc.spa-3A.3 and QGpc.spa-7A, were also mapped by using BLUP values suggests they expressed stably across environments. Given that genotype × environment interaction has great effect on durum wheat GPC, the QTL that expressed stably across environments should be valuable in maintaining GPC under selection for germplasm enhancement.
The physical distance of QGpc.spa-1B.1 (M3, IWB12562) of ~34.4 Mb from the QTL peak marker, wPt-0655 (M2), reported by Giraldo et al. (2016) and 35.3 Mb from SSR marker, barc18 (M4), reported by Suprayogi et al. (2009) would suggest they are different loci. But due to the poor resolution of mapping, the possibility that the same gene is functioning in all studies cannot be ruled out. The proximity of QTL QGpc.spa-1B.2 (M8, IWB72499) 29.7 Mb away from the QTL (M7, D1112546) identified by Rapp et al. (2018) and 30.9 Mb from the QTL (M9, IWB60663) reported by Fatiukha et al. (2020) would again suggest different controlling loci. The physical mapping does suggest QGpc.spa-1B.1 is different from QGpc.spa-1B.2. TRITD2Bv1G082940, likely encoding NAM-B2—a paralogous copy of NAM-B1, resides in the interval of QGpc.spa-2B.1 (156,604,237–231,697,558 bp). TRITD2Bv1G082940 has four splicing transcripts and encodes the protein with 95.3–99.2% identity with NAM-B2 from Triticum turgidum L. subsp. durum (Desf.) Husn. (GenBank ABI94355.1) (Supplementary Figure 3).
The 187.6 Mb physical distance between QGpc.spa-3A.1 (M26, IWB6837) and the QTL reported by Giancaspro et al. (2019) (M27, IWB72484) indicates these two QTL are different. Because QGpc.spa-3A.2 is only 3.21 Mb from the QTL peak marker, IWB14495 (M29), reported by Nigro et al. (2019), they are most likely the same QTL. Nitrogen metabolism related SNP IWB71028 (M30) (Nigro et al., 2019) is at a distance of 5.33 Mb to QGpc.spa-3A.2. The QGpc.spa-3A.3 peak marker, IWB39901 (M32), was separated by a physical distance of 59.5 Mb from peak marker IWB28341 (M31) reported by Fatiukha et al. (2020), therefore QGpc.spa-3A.3 is likely a novel QTL. Given the close proximity of QGpc.spa-3A.4 peak marker IWB58656 (M33) detected in this study of ~7.8 Mb from SNP IWB35484 (M34) reported to be associated with GPC in durum wheat by Nigro et al. (2019), they are likely the same QTL.
QGpc.spa-5B (M36, IWB10851) on the short arm of chromosome 5B identified in our study is likely the same QTL as the one reported in the previous study by Rapp et al. (2018) because of their close physical distance. The very close proximity (2.724 kb) of QGpc.spa-7A (M49, IWB4104) to the SNP (M50, IWB65659) associated with GPC (Nigro et al., 2019) indicates these two QTL are the same. Likewise, QGpc.spa-7A might be the same QTL as the one (M48, D1382367) identified by Rapp et al. (2018) since the distance between the peak markers of these two QTL is 3.0 Mb. In addition, on the long arm of chromosome 7B, QGpc.spa-7B (M67, IWB32614) is likely the same as the QTL reported by Zhang et al. (2008) and Conti et al. (2011) due to the close proximity of 2.24 Mb and 2.94 Mb to these two reported QTL. A few genes such as Aspartic proteinases involved in amino acid and protein metabolism are in close proximity to QGpc.spa-2B.1 and QGpc.spa-3A.3. Aspartic proteinases have been reported to be involved in proteolytic processing and maturation of storage proteins (Simões and Faro, 2004).
The negative correlation between GY, yield components and GPC in durum wheat and bread wheat is well-documented (DePauw et al., 2007; Suprayogi et al., 2009; Blanco et al., 2012; Bogard et al., 2013). Similarly, in the present study, moderate negative correlations between these two traits were observed in most of the environments. Most of previous studies focused only on the phenotypic correlation of these traits. By comparing traditional and conditional QTL, we tried to elucidate the genetic relationships at individual QTL between these two correlated traits to identify QTL for GPC independent of GY.
When GPC values conditional to GY were used for QTL mapping, eight out of eleven initially mapped QTL for GPC on 1B (QGpc.spa-1B.1), 2B (QGpc.spa-2B.1, QGpc.spa-2B.2, QGpc.spa-2B.3), 3A (QGpc.spa-3A.1, QGpc.spa-3A.4), 5B (QGpc.spa-5B), and 7B (QGpc.spa-7B) were not detected. This indicates that the expression of these QTL likely depends on GY. Genetic or physiological association might exist between GPC and GY such as a dilution effect of the protein by carbohydrate. A similar observation was reported by Blanco et al. (2012). Some of their initially detected QTL for GPC failed to show significant effects when the GPC values were adjusted against yield components (thousand-kernel weight, grain yield per spike, kernels per spike) then were used for mapping. Such QTL were suggested to represent genes involved in carbohydrate biosynthesis and thus contributing to total grain mass, however, with indirect effect on GPC (Blanco et al., 2012).
The results of the conditional mapping in this study showed a few GPC QTL with no pleiotropic effect on GY, indicating these QTL are independent or partially independent of GY and would have little or no negative effect on GY when selecting for high GPC. The three QTL, QGpc.spa-3A.2 and QGpc.spa-3A.3 on chromosome 3A, and QGpc.spa-7A on 7A, were detected in conditional mapping but with reduced or slightly reduced effects. This suggested that they function, at least to some degree, independently of GY. The partial independence of the expression of QGpc.spa-3A.3 and QGpc.spa-7A was also reflected by the smaller slope of the regression lines of GPC on GY observed for Hap1 and Hap3 compared with Hap4. It is worth noting that QGpc.spa-7A was detected in the same environments by both traditional and conditional mapping with a small reduction in effects, indicating this QTL controls GPC more independently from GY. Both QGpc.spa-3A.2 and QGpc.spa-3A.3 were detected only in the environments where no significant (E17 and E18) or weak to moderate (E15 and L15) correlation was observed between GPC and GY. Relatively lower GY was also observed in these environments reflecting the partial dependence on GY for the expression of these GPC QTL. These QTL detected in conditional mapping are of great importance for durum wheat breeding as their incorporation will allow the improvement of GPC without significant compromise on GY.
Five additional QTL for GPC were detected in conditional mapping while they were not detected in traditional mapping. The expression of these QTL may have been masked by GY and was below the detection threshold in traditional GPC mapping; hence, their effects could only be detected with the removal of the confounding effect of GY. A similar observation was reported in a previous study that two additional QTL were detected when GPC values were adjusted to yield components in durum wheat (Blanco et al., 2012). Similarly in bread wheat, three more QTL for GPC were identified by using conditional GPC values on GY and its components (Wang L. et al., 2012).
The results in this study provide a further understanding of genetic control of GPC in Canadian durum wheat and genetic relationship between GPC and GY. Comparison of the QTL described here with the results previously reported led to the identification of one novel major QTL on 3A (QGpc.spa-3A.3) and five novel minor QTL on 1B, 2B and 3A. The conditional and stable QTL (QGpc.spa-3A.3 and QGpc.spa-7A) identified for GPC were partially affected by or independently expressed of GY. These QTL are of great importance and their closely linked markers are useful for MAS for high GPC without concomitant trade-off on GY.
All datasets generated for this study have been included in the article/Supplementary Material, further inquiries can be directed to the corresponding author/s.
YR and RK conceptualized this study. YR, RK, AKS, RD, and RC generated the population and contributed to seed increase of this population. YR, RD, RC, SB, and JS implemented the field trials and phenotyping of the population. WZ, AS, and PF provided the genotyping platform. BY and YR analyzed the data, interpreted results, and contributed to data management and visualization. RK, RD, BXF, and JS contributed to the result interpretation. BY and YR wrote the original manuscript. BY, YR, RK, RD, AKS, BXF, and PF contributed to the review and editing of the manuscript. YR was the principal investigator and supervised the project. All authors contributed to the article and approved the submitted version.
Financial support was received from the National Wheat Improvement Program and the Canadian Agricultural Partnership with support from Agriculture and Agri-Food Canada, Western Grains Research Foundation, Alberta Wheat Commission, Saskatchewan Wheat Development Commission, and Manitoba Crop Alliance. The work was also supported by the Canadian Wheat Improvement Flagship program which was the National Research Council Canada's contribution to the Canadian Wheat Alliance, and the Saskatchewan Agriculture Development Fund.
The authors declare that the research was conducted in the absence of any commercial or financial relationships that could be construed as a potential conflict of interest.
The handling editor and reviewer FB declared a past co-authorship with several of the authors RK and AKS.
We gratefully acknowledge the support of Agriculture and Agri-Food Canada (AAFC), National Research Council Canada (NRC), Western Grain Research Foundation (WGRF), Alberta Wheat Commission, Saskatchewan Wheat Development Commission, Manitoba Crop Alliance, and Saskatchewan Agriculture Development Fund in carrying out this study. We thank Christine Sidebottom and Janet Condie at NRC for technical assistance with DNA extraction and genotyping using the Infinium iSelect Wheat 90K SNP chip. The technical support of the Wheat Breeding Group at the Swift Current Research and Development Centre is sincerely appreciated.
The Supplementary Material for this article can be found online at: https://www.frontiersin.org/articles/10.3389/fpls.2021.642955/full#supplementary-material
Avivi, L. (1978). “High grain protein content in wild tetraploid wheat Triticum dicoccoides Korn,” in Proc. 5th Int. Wheat Genet. Symp (New Delhi), 372–380.
Bates, D., Mächler, M., Bolker, B. M., and Walker, S. C. (2015). Fitting linear mixed-effects models using lme4. J. Stat. Softw. 67, 1–48. doi: 10.18637/jss.v067.i01
Blanco, A., Mangini, G., Giancaspro, A., Giove, S., Colasuonno, P., Simeone, R., et al. (2012). Relationships between grain protein content and grain yield components through quantitative trait locus analyses in a recombinant inbred line population derived from two elite durum wheat cultivars. Mol. Breed. 30, 79–92. doi: 10.1007/s11032-011-9600-z
Blanco, A., Pasqualone, A., Troccoli, A., Di Fonzo, N., and Simeone, R. (2002). Detection of grain protein content QTLs across environments in tetraploid wheats. Plant Mol. Biol. 48, 615–623. doi: 10.1023/A:1014864230933
Blanco, A., Simeone, R., and Gadaleta, A. (2006). Detection of QTLs for grain protein content in durum wheat. Theor. Appl. Genet. 112, 1195–1204. doi: 10.1007/s00122-006-0221-6
Bogard, M., Allard, V., Martre, P., Heumez, E., Snape, J. W., Orford, S., et al. (2013). Identifying wheat genomic regions for improving grain protein concentration independently of grain yield using multiple inter-related populations. Mol. Breed. 31, 587–599. doi: 10.1007/s11032-012-9817-5
Bogard, M., Jourdan, M., Allard, V., Martre, P., Perretant, M. R., Ravel, C., et al. (2011). Anthesis date mainly explained correlations between post-anthesis leaf senescence, grain yield, and grain protein concentration in a winter wheat population segregating for flowering time QTLs. J. Exp. Bot. 62, 3621–3636. doi: 10.1093/jxb/err061
Bokore, F. E., Knox, R. E., DePauw, R. M., Cuthbert, R. D., Valerio, I. P., Clarke, F. R., et al. (2019). Validation of the effects of the Gpc-B1 high grain protein concentration locus from Lillian hard red spring wheat (Triticum aestivum L.) using locus specific markers. Euphytica 215:2. doi: 10.1007/s10681-018-2322-0
Chee, P. W., Elias, E. M., Anderson, J. A., and Kianian, S. F. (2001). Evaluation of a high grain protein QTL from Triticum turgidum L. var. dicoccoides in an adapted durum wheat background. Crop Sci. 41, 295–301. doi: 10.2135/cropsci2001.412295x
Choudhury, S., Larkin, P., Xu, R., Hayden, M., Forrest, K., Meinke, H., et al. (2019). Genome wide association study reveals novel QTL for barley yellow dwarf virus resistance in wheat. BMC Genomics 20:891. doi: 10.1186/s12864-019-6249-1
Clarke, J. M., Clarke, F. R., and Pozniak, C. J. (2010). Forty-six years of genetic improvement in Canadian durum wheat cultivars. Can. J. Plant Sci. 90, 791–801. doi: 10.4141/cjps10091
Clarke, J. M., McCaig, T. N., DePauw, R. M., Knox, R. E., Clarke, F. R., Fernandez, M. R., et al. (2005). Strongfield durum wheat. Can. J. Plant Sci. 85, 651–654. doi: 10.4141/P04-119
Conti, V., Roncallo, P. F., Beaufort, V., Cervigni, G. L., Miranda, R., Jensen, C. A., et al. (2011). Mapping of main and epistatic effect QTLs associated to grain protein and gluten strength using a RIL population of durum wheat. J. Appl. Genet. 52, 287–298. doi: 10.1007/s13353-011-0045-1
Deng, Z., Hu, S., Chen, F., Li, W., Chen, J., Sun, C., et al. (2015). Genetic dissection of interaction between wheat protein and starch using three mapping populations. Mol. Breed. 35:12. doi: 10.1007/s11032-015-0216-6
DePauw, R. M., Knox, R. E., Clarke, F. R., Wang, H., Fernandez, M. R., Clarke, J. M., et al. (2007). Shifting undesirable correlations. Euphytica 157, 409–415. doi: 10.1007/s10681-007-9379-5
Fan, X., Cui, F., Ji, J., Zhang, W., Zhao, X., Liu, J. J., et al. (2019). Dissection of pleiotropic QTL regions controlling wheat spike characteristics under different nitrogen treatments using traditional and conditional QTL mapping. Front. Plant Sci. 10, 1–13. doi: 10.3389/fpls.2019.00187
Fatiukha, A., Filler, N., Lupo, I., Lidzbarsky, G., Klymiuk, V., Korol, A. B., et al. (2020). Grain protein content and thousand kernel weight QTLs identified in a durum × wild emmer wheat mapping population tested in five environments. Theor. Appl. Genet. 133, 119–131. doi: 10.1007/s00122-019-03444-8
Giancaspro, A., Giove, S. L., Zacheo, S. A., Blanco, A., and Gadaleta, A. (2019). Genetic Variation for Protein Content and Yield-Related Traits in a Durum Population Derived From an Inter-Specific Cross Between Hexaploid and Tetraploid Wheat Cultivars. Front. Plant Sci. 10:1509. doi: 10.3389/fpls.2019.01509
Giraldo, P., Royo, C., González, M., Carrillo, J. M., and Ruiz, M. (2016). Genetic diversity and association mapping for agromorphological and grain quality traits of a structured collection of durum wheat landraces including subsp. durum, turgidum and diccocon. PLoS ONE 11:e0166577. doi: 10.1371/journal.pone.0166577
Groos, C., Robert, N., Bervas, E., and Charmet, G. (2003). Genetic analysis of grain protein-content, grain yield and thousand-kernel weight in bread wheat. Theor. Appl. Genet. 106, 1032–1040. doi: 10.1007/s00122-002-1111-1
Guo, L. B., Xing, Y. Z., Mei, H. W., Xu, C. G., Shi, C. H., Wu, P., et al. (2005). Dissection of component QTL expression in yield formation in rice. Plant Breed. 124, 127–132. doi: 10.1111/j.1439-0523.2005.01093.x
Joppa, L. R., Du, C., Hart, G. E., and Hareland, G. A. (1997). Mapping gene(s) for grain protein in tetraploid wheat (Triticum turgidum L.) using a population of recombinant inbred chromosome lines. Crop Sci. 37, 1586–1589. doi: 10.2135/cropsci1997.0011183X003700050030x
Kumar, A., Jain, S., Elias, E. M., Ibrahim, M., and Sharma, L. K. (2018). “An Overview of QTL Identification and Marker-Assisted Selection for Grain Protein Content in Wheat BT - Eco-friendly Agro-biological Techniques for Enhancing Crop Productivity,” in eds. R. S. Sengar and A. Singh (Singapore: Springer Singapore), 245–274. doi: 10.1007/978-981-10-6934-5_11
Li, C., Tang, H., Luo, W., Zhang, X., Mu, Y., Deng, M., et al. (2020). A novel, validated, and plant height-independent QTL for spike extension length is associated with yield-related traits in wheat. Theor. Appl. Genet. 133, 3381–3393. doi: 10.1007/s00122-020-03675-0
Li, X., Xue, H., Zhang, K., Li, W., Fang, Y., Qi, Z., et al. (2020). Mapping QTLs for protein and oil content in soybean by removing the influence of related traits in a four-way recombinant inbred line population. J. Agric. Sci. 158:254. doi: 10.1017/S0021859620000519
Li, Y. L., Dong, Y. B., Cui, D. Q., Wang, Y. Z., Liu, Y. Y., Wei, M. G., et al. (2008). The genetic relationship between popping expansion volume and two yield components in popcorn using unconditional and conditional QTL analysis. Euphytica 162, 345–351. doi: 10.1007/s10681-007-9513-4
Maccaferri, M., Harris, N. S., Twardziok, S. O., Pasam, R. K., Gundlach, H., Spannagl, M., et al. (2019). Durum wheat genome highlights past domestication signatures and future improvement targets. Nat. Genet. 51, 885–895. doi: 10.1038/s41588-019-0381-3
Marcotuli, I., Gadaleta, A., Mangini, G., Signorile, A. M., Zacheo, S. A., Blanco, A., et al. (2017). Development of a high-density SNP-based linkage map and detection of QTL for β-Glucans, Protein Content, Grain yield per spike and heading time in durum wheat. Int. J. Mol. Sci. 18:1329. doi: 10.3390/ijms18061329
Nigro, D., Gadaleta, A., Mangini, G., Colasuonno, P., Marcotuli, I., Giancaspro, A., et al. (2019). Candidate genes and genome-wide association study of grain protein content and protein deviation in durum wheat. Planta 249, 1157–1175. doi: 10.1007/s00425-018-03075-1
Olmos, S., Distelfeld, A., Chicaiza, O., Schlatter, A. R., Fahima, T., Echenique, V., et al. (2003). Precise mapping of a locus affecting grain protein content in durum wheat. Theor. Appl. Genet. 107, 1243–1251. doi: 10.1007/s00122-003-1377-y
Peleg, Z., Cakmak, I., Ozturk, L., Yazici, A., Jun, Y., Budak, H., et al. (2009). Quantitative trait loci conferring grain mineral nutrient concentrations in durum wheat × wild emmer wheat RIL population. Theor. Appl. Genet. 119, 353–369. doi: 10.1007/s00122-009-1044-z
Raihan, M. S., Liu, J., Huang, J., Guo, H., Pan, Q., and Yan, J. (2016). Multi-environment QTL analysis of grain morphology traits and fine mapping of a kernel-width QTL in Zheng58 × SK maize population. Theor. Appl. Genet. 129, 1465–1477. doi: 10.1007/s00122-016-2717-z
Rapp, M., Lein, V., Lacoudre, F., Lafferty, J., Müller, E., Vida, G., et al. (2018). Simultaneous improvement of grain yield and protein content in durum wheat by different phenotypic indices and genomic selection. Theor. Appl. Genet. 131, 1315–1329. doi: 10.1007/s00122-018-3080-z
Ruan, Y., Yu, B., Knox, R. E., Singh, A. K., DePauw, R., Cuthbert, R., et al. (2020). High Density Mapping of Quantitative Trait Loci Conferring Gluten Strength in Canadian Durum Wheat. Front. Plant Sci. 11:170. doi: 10.3389/fpls.2020.00170
Simões, I., and Faro, C. (2004). Structure and function of plant aspartic proteinases. Eur. J. Biochem. 271, 2067–2075. doi: 10.1111/j.1432-1033.2004.04136.x
Suprayogi, Y., Pozniak, C. J., Clarke, F. R., Clarke, J. M., Knox, R. E., and Singh, A. K. (2009). Identification and validation of quantitative trait loci for grain protein concentration in adapted Canadian durum wheat populations. Theor. Appl. Genet. 119, 437–448. doi: 10.1007/s00122-009-1050-1
Tabbita, F., Pearce, S., and Barneix, A. J. (2017). Breeding for increased grain protein and micronutrient content in wheat: ten years of the GPC-B1 gene. J. Cereal Sci. 73, 183–191. doi: 10.1016/j.jcs.2017.01.003
Uauy, C., Distelfeld, A., Fahima, T., Blechl, A., and Dubcovsky, J. (2006). A NAC gene regulating senescence improves grain protein, zinc, and iron content in wheat. Science 314, 1298–1301. doi: 10.1126/science.1133649
Voorrips, R. E. (2002). MapChart: software for the graphical presentation of linkage maps and QTLs. J. Hered. 93, 77–78. doi: 10.1093/jhered/93.1.77
Wang, L., Cui, F., Wang, J., Jun, L., Ding, A., Zhao, C., et al. (2012). Conditional QTL mapping of protein content in wheat with respect to grain yield and its components. J. Genet. 91, 303–312. doi: 10.1007/s12041-012-0190-2
Wang, S., Basten, C. J., and Zeng, Z. B. (2012). Windows QTL Cartographer 2.5. Raleigh; NC: Department of Statistics; North Carolina State University. Available online at: http://statgen.ncsu.edu/qtlcart/WQTLCart.htm
Xiao, Y., Tong, H., Yang, X., Xu, S., Pan, Q., Qiao, F., et al. (2016). Genome-wide dissection of the maize ear genetic architecture using multiple populations. New Phytol. 210, 1095–1106. doi: 10.1111/nph.13814
Xu, Y., Wang, R., Tong, Y., Zhao, H., Xie, Q., Liu, D., et al. (2014). Mapping QTLs for yield and nitrogen-related traits in wheat: Influence of nitrogen and phosphorus fertilization on QTL expression. Theor. Appl. Genet. 127, 59–72. doi: 10.1007/s00122-013-2201-y
Zhang, W., Chao, S., Manthey, F., Chicaiza, O., Brevis, J. C., Echenique, V., et al. (2008). QTL analysis of pasta quality using a composite microsatellite and SNP map of durum wheat. Theor. Appl. Genet. 117, 1361–1377. doi: 10.1007/s00122-008-0869-1
Zhao, J., Becker, H. C., Zhang, D., Zhang, Y., and Ecke, W. (2006). Conditional QTL mapping of oil content in rapeseed with respect to protein content and traits related to plant development and grain yield. Theor. Appl. Genet. 113, 33–38. doi: 10.1007/s00122-006-0267-5
Zhao, W., Wang, X., Wang, H., Tian, J., Li, B., Chen, L., et al. (2016). Genome-wide identification of QTL for seed yield and yield-related traits and construction of a high-density consensus map for QTL comparison in Brassica napus. Front. Plant Sci. 7, 1–14. doi: 10.3389/fpls.2016.00017
Keywords: conditional mapping, quantitative trait loci, grain protein concentration, durum wheat, grain yield
Citation: Ruan Y, Yu B, Knox RE, Zhang W, Singh AK, Cuthbert R, Fobert P, DePauw R, Berraies S, Sharpe A, Fu BX and Sangha J (2021) Conditional Mapping Identified Quantitative Trait Loci for Grain Protein Concentration Expressing Independently of Grain Yield in Canadian Durum Wheat. Front. Plant Sci. 12:642955. doi: 10.3389/fpls.2021.642955
Received: 17 December 2020; Accepted: 26 February 2021;
Published: 24 March 2021.
Edited by:
Luigi Cattivelli, Council for Agricultural and Economics Research, ItalyReviewed by:
Filippo Maria Bassi, International Center for Agricultural Research in the Dry Areas (ICARDA), MoroccoCopyright © 2021 Ruan, Yu, Knox, Zhang, Singh, Cuthbert, Fobert, DePauw, Berraies, Sharpe, Fu and Sangha. This is an open-access article distributed under the terms of the Creative Commons Attribution License (CC BY). The use, distribution or reproduction in other forums is permitted, provided the original author(s) and the copyright owner(s) are credited and that the original publication in this journal is cited, in accordance with accepted academic practice. No use, distribution or reproduction is permitted which does not comply with these terms.
*Correspondence: Bianyun Yu, Ymlhbnl1bi55dUBucmMtY25yYy5nYy5jYQ==; Yuefeng Ruan, eXVlZmVuZy5ydWFuQGNhbmFkYS5jYQ==
†These authors have contributed equally to this work
‡Present address: Asheesh K. Singh, Department of Agronomy, Iowa State University, Ames, IA, United States
Ron DePauw, Advancing Wheat Technologies, Calgary, AB, Canada
Andrew Sharpe, The Global Institute for Food Security, Saskatoon, SK, Canada
Disclaimer: All claims expressed in this article are solely those of the authors and do not necessarily represent those of their affiliated organizations, or those of the publisher, the editors and the reviewers. Any product that may be evaluated in this article or claim that may be made by its manufacturer is not guaranteed or endorsed by the publisher.
Research integrity at Frontiers
Learn more about the work of our research integrity team to safeguard the quality of each article we publish.