- 1Institute of Biosciences and Bioresources, National Research Council of Italy, Portici, Italy
- 2Sequentia Biotech SL, Barcelona, Spain
Isolation of nuclei tagged in specific cell types (INTACT) is a method developed to isolate cell-type-specific nuclei that are tagged through in vivo biotin labeling of a nuclear targeting fusion (NTF) protein. In our work, INTACT was used to capture nuclei of meiocytes and to generate a meiotic transcriptome in Arabidopsis. Using the promoter of AtDMC1 recombinase to label meiotic nuclei, we generated transgenic plants carrying AtDMC1:NTF along with biotin ligase enzyme (BirA) under the constitutive ACTIN2 (ACT2) promoter. AtDMC1-driven expression of biotin-labeled NTF allowed us to collect nuclei of meiocytes by streptavidin-coated magnetic beads. The nuclear meiotic transcriptome was obtained by RNA-seq using low-quantity input RNA. Transcripts grouped into different categories according to their expression levels were investigated by gene ontology enrichment analysis (GOEA). The most enriched GO term “DNA demethylation” in mid/high-expression classes suggests that this biological process is particularly relevant to meiosis onset. The majority of genes with established roles in meiosis were distributed in the classes of mid/high and high expression. Meiotic transcriptome was compared with public available transcriptomes from other tissues in Arabidopsis. Bioinformatics analysis by expression network identified a core of more than 1,500 genes related to meiosis landmarks.
Introduction
Meiosis is a complex process critical to sexual reproduction. In plants, meiosis appears to be influenced by environmental cues (reviewed in De Storme and Geelen, 2014; Si et al., 2015). Within this context, global climate change is expected to have an impact on crop production with consequences for food security (Parry et al., 1999). To face the new challenges, a fundamental understanding of meiosis is required in model, crop, and non-model plants (Lambing and Heckmann, 2018). Molecular knowledge of plant meiosis has primarily advanced through understanding the function of single genes involved in key steps being benefited by the conserved pathways across model species (reviewed in Mercier et al., 2015). Thereafter, transcriptome studies of specific cell types improved our understanding of the gene-expression landscape during meiosis (reviewed in Dubowic-Shulze and Chen, 2014). However, the isolation of plant meiocytes is challenging due to the difficulty in accessing the germline cells. Pollen mother cells and embryo sac mother cells are enclosed by sporophytic tissues, i.e., anthers and ovules inside the flower buds. Over the last decade, different techniques were established for targeted isolation of meiocytes by micromanipulation (Chen et al., 2010; Libeau et al., 2011; Yang et al., 2011; Nelms and Walbot, 2019) and laser microdissection (Tang et al., 2010; Schmidt et al., 2011; Barra et al., 2012; Yuan et al., 2018).
An alternative method that achieves the isolation of nuclei tagged in specific cell types (INTACT) was developed by Deal and Henikoff (2011). INTACT overcomes the limitation of time-consuming manual dissection generally associated with contamination of undesired cells. Therefore, INTACT allows rapid and efficient nucleus isolation with the advantage of not requiring specialized and expensive equipment (Deal and Henikoff, 2010). INTACT is based on in vivo biotin labeling of a nuclear targeting fusion (NTF) protein which consists of three parts corresponding to (1) a unique target peptide of biotin ligase recognition (BLRP), (2) a domain from Arabidopsis RAN GTPASE ACTIVATING PROTEIN 1 (RanGAP1) for nuclear envelope localization (Rose and Meier, 2001), and (3) green fluorescent protein (GFP) for visualization. BLRP acts as a substrate for the BirA biotin ligase enzyme from Escherichia coli (Beckett et al., 1999). BirA and NTF need to be co-expressed in the same cell.
So far, INTACT has been used in combination with transcriptomic, epigenomic, and proteomic studies in different species including plants (Amin et al., 2014; Agrawal et al., 2019; Del Toro-De León and Köhler, 2019). However, in plants, a broad use of INTACT across different cell types remains challenging since it requires a cell-type marker and a method for genetic transformation for the species of interest. A peculiarity of INTACT is that it provides nuclear RNAs which could differ from cytosolic RNAs depending on the selective compartment enrichment of RNAs influenced by mechanisms such as nuclear retention and posttranscriptional regulation (Reynoso et al., 2018). For instance, the comparison between nuclear and total RNAs furnished additional insights into the transcriptome regulation in the early Arabidopsis embryo (Palovaara et al., 2017). In the future, INTACT could contribute to the elucidation of the transcriptome reorganization occurring in meiosis, particularly at the prophase I expression transitions that were recently defined in maize by single-cell RNA sequencing (Nelms and Walbot, 2019).
In this work, we applied the INTACT-based approach to obtain purified meiocyte nuclei from the total cell pool of floral bud in Arabidopsis thaliana. To label meiotic nuclei, we used the promoter of AtDMC1 recombinase (Klimyuk and Jones, 1997; De Muyt et al., 2009). The AtDMC1-driven expression of biotin-labeled NTF allowed us to isolate meiocyte nuclei using streptavidin-coated magnetic beads. The meiotic nuclear transcriptome was obtained by RNA-seq and validated through analysis of the expression of known meiotic genes and the comparison with other tissues. Finally, expression network analysis was performed to find new candidate genes involved in the meiotic process.
Materials and Methods
Plant Material, Transformation, and Growth Conditions
The transgenic line expressing ACT2:BirA, kindly given by Prof. R. Deal (Emory University, United States), and the reference ecotype Col-0 of A. thaliana (NASC stock N60000) were used in this work. The transgenic line was transformed by Agrobacterium tumefaciens (GV3101) according to floral dip method (Clough and Bent, 1998) to obtain plants carrying DMC1:NTF along with ACT2:BirA. About 1,500 seeds obtained after transformation were sterilized with 70% ethanol for 1 min., and bleach solution (10% commercial bleach and 0.05% Tween 20) for 10 min., finally washed with sterile water three times. Sterilized seeds were sown on a selective modified MS (Murashige and Skoog, 1962) medium containing hygromycin (50 mg/l) and 0.8% agar, kept for 2–3 days at 4°C, and germinated under long-day conditions (16 h light/8 h darkness) at 24°C. Seedlings transferred to pots were grown in a controlled growth chamber under long-day conditions. The ADMC1:NTF/ACT2:BirA double homozygous transgenic line (D.1) was selected from ten T2 independent transformant lines. About 200 plants from the D.1 line were grown as above reported for subsequent experiments.
PCR and RT-qPCR
To confirm transgene insertion, PCR was conducted on the hygromycin resistance gene used as a selectable marker. Genomic DNA was extracted from leaf tissue of transgenic plants using the DNeasy Plant Mini Kit (Qiagen)1 according to the manufacturer’s instructions. PCR reactions were performed on genomic DNA using primers listed in Supplementary Table 1. RT-qPCR was performed to verify expression of target BirA gene under the constitutive promoter ACT2 in the floral buds. Total RNA from transgenic ACT2:BirA plants was extracted using RNeasy plant minikit (QIAGEN) following the manufacturer’s instructions. mRNA was retrotranscribed to cDNA using Superscript III reverse transcriptase (Thermo Fisher Scientific, United States) and oligo dT(20) following the manufacturer’s conditions, and relative expression was verified by real-time qPCR. The experiment was performed on a QIAGEN Rotorgene 6,000 qRT-PCR machine, using Power Sybr Green real time mix (Thermo Fisher Scientific, United States). The reaction conditions were as follows: one cycle at 95°C for 10 min, and 40 cycles of 95°C × 10″ denaturation and 60°C × 45″ annealing and extension. The melting curve was run to verify the specificity of the primers. The ADENINE PHOSPHORIBOSYL TRANSFERASE 1 (APT1) gene was used as a housekeeping internal control. Target and housekeeping primers are listed in Supplementary Table 2.
Construct for INTACT, Nucleus Isolation, and Microscopy
The fusion gene NTF carried in the vector ADF8-NTF, kindly given by Prof. R. Deal (Emory University, United States), and the AtDMC1 promoter carried in the vector SLJ7753, kindly given by Prof. J.D.G. Jones (The Sainsbury Laboratory, Norwich, United Kingdom), were amplified with specific primers carrying GATEWAY adapters. Subsequently, they were cloned into Gateway vectors pDONR/Zeo and pDONR/P4P1R, respectively (Thermo Fisher Scientific). Generated entry clones were recombined with multisite GATEWAY reaction into destination vector pH7m24GW,32, and the final expression clone, named pEXPR-DMC1-NTF, was generated. All gateway reactions were performed following the manufacturer’s standard protocols. Primers used for vector construction are listed in Supplementary Table 3.
Flower buds of the size corresponding to male meiotic stage (Smyth et al., 1990) were collected, fixed with 1% formaldehyde solution, and stored at −80°C. Nuclei were purified from 1.5 g of frozen and homogenized tissue as described previously by Wang and Deal (2015) with some minor modifications. In particular, the tissue immersed in 40 ml of Nuclei Purification Buffer solution (NPBf) containing 20 mM MOPS (pH 7), 40 mM NaCl, 90 mM KCl, 2 mM EDTA, 0.5 mM EGTA, 0.5 mM spermidine, 0.2 mM spermine, 1% (v/v) formaldehyde was incubated in 50 ml tube under vacuum glass desiccator for 10 min., and vacuum release for 2 min. The procedure was repeated once. Then, glycine was added to a final concentration of 0.125 M under vacuum for 7 min. After NPBf solution elimination, the tissue was washed three times with water. Isolated nuclei were resuspended into RNAlater buffer, and RNA extraction was performed immediately.
Laser-scanning confocal microscopy imaging was performed using a confocal Zeiss LSM 510. Isolated nuclei were observed using a Florescence Microscope (Leitz Aristoplan).
RNA Extraction and Sequencing
Total RNA was extracted from three replicates of isolated nuclei using an RNeasy Extraction Mini Kit (Qiagen, see text footnote 1) according to the manufacturer’s instructions. Isolated nuclei derived from the same population of inflorescences where the buds different from stage 9 (Smyth et al., 1990) had been manually dissected. Quantification was performed on a QUBIT fluorometer.
RNA sequencing was performed by IGA Technology Services Srl3. The libraries were produced using retrotranscribed cDNA previously amplified by Ovation Ultralow Library System V2 (NuGEN Technologies, Inc.). Library size and integrity were assessed using the Agilent Bioanalyzer (Santa Clara, CA) or Caliper GX (PerkinElmer, MA). Sequencing was performed by Illumina HiSeq 2,500 (Illumina, San Diego, CA) and 30-M paired-end reads (2 × 125) per replicate were generated.
Bioinformatics
Raw sequencing data (FASTQ files) were quality checked using the software FASTQC v0.11.54, then low-quality bases and adapter sequences were removed with the software BBDuk v35 (Bushnell et al., 2017) setting 35 bp as the minimum read length after trimming. The read length ranged from 35 to 125 bp after trimming. More than 98% of the final reads had a length of 125 bp since adapter contamination was very low. The trimmed reads were then mapped against the A. thaliana reference genome (Araport11) (Cheng et al., 2016) using STAR v2.7.3a with the option – alignEndsProtrude 100 DiscordantPair. The statistics from the mapping step were produced with Qualimap v2.2.1 (Okonechnikov et al., 2016). Kallisto v0.46.0 was used to obtain transcript expression quantification levels, as estimated counts and TPMs, which were then summarized as gene expression values using the R package “tximport” (Soneson et al., 2016).
The correlation analysis of the samples was performed using the R in-built function “cor,” and the results were plotted with the function “corrplot.” The classification of the gene classes and the saturation analysis were performed with the R package “NOISeq” (Tarazona et al., 2015). Genes were classified based on their average expression levels using the following criteria: “undetected” if the expression was 0 across all the replicates, “Low” if log2 average TPM ≤ 1.252, “Low_Mid” if log2 average TPM > 1.252 and ≤ 2.207, “Mid_High” if log2 average TPM > 2.207 and ≤ 4.169, and “High” if log2 average TPM > 4.169. The abovementioned values correspond to the 25th, 50th, and 75th percentiles of the log2 average TPM distributions, respectively.
In order to compare the expression profile of the meiocytes against other datasets, TPM values from the following datasets were downloaded from EBI: E-GEOD-38612, E-GEOD-55866, and E-MTAB-4202 (Supplementary Table 4). In addition, gene expression profiles from pollen and tapetum cells were obtained from Loraine et al. (2013) and Li et al. (2017). When multiple replicates of the same tissue were available, an average was calculated. Similarly, when multiple developmental stages of the same tissue were available, the average was calculated. The only exception consisted of the tapetum datasets kept separate because the two available stages were highly different. Finally, a complete expression matrix was obtained by merging all the datasets and the ARSyN function from the NOISeq package was used to remove the batch effect. A PCA analysis was then performed with the in-built “prcomp” function in R and the results plotted with “ggplot2.”
A gene expression network was generated using the expression matrix obtained after the ARSyN correction, following the Aracne algorithm implemented in the R package “parmigene” (Sales and Romualdi, 2011). Cytoscape v3.8.1 was then used to plot the network and select only the first neighbors of known meiotic genes in order to find new candidates. The gene ontology (GO) analysis of the obtained genes was then performed using the Cytoscape app named “BinGO” using the hypergeometric test as a statistical test and an FDR lower than 0.05 as threshold. All the heat maps were generated using Clustvis (Metsalu and Vilo, 2015).
Gene ontology enrichment analysis (GOEA) were performed using in-house scripts based on the method described in Tian et al. (2017) and setting a minimum FDR threshold of 0.05.
Results
Generation of Transgenic Material and Isolation of Nuclei From Meiocytes Using INTACT in Arabidopsis
In order to isolate meiocyte nuclei by the INTACT method for RNA-seq analysis in Arabidopsis, we generated transgenic material carrying a NTF protein under the meiosis-specific AtDMC1 promoter (Klimyuk and Jones, 1997) along with the biotinilase BirA under a constitutive ACTIN2 (ACT2) promoter. The promoter of ACT2 (At3g18780) was used by Deal and Henikoff (2011) to drive expression of BirA in root cell types (An et al., 1996). Following detection of ACT2:BirA expression in floral buds (not shown), we used the same transgenic line generated by Deal and Henikoff (2011) as starting material. In this line, we introduced the new construct carrying the AtDMC1:NTF expression cassette. Although AtDMC1 (At3g22880) was expected to drive NTF expression in both male and female meiocytes (Klimyuk and Jones, 1997), we restricted our confocal microscopy analysis to anthers and male meiocytes. Indeed, the flower buds were collected at a stage corresponding to male meiosis which occurs earlier than female meiosis (Schneitz et al., 1995). Confocal microscopic examination of the AtDMC1:NTF/ACT2:BirA line showed that NTF was expressed in the expected cell type. Indeed, we detected GFP-positive male meiocytes during prophase I stage, arguably before the nuclear envelope breakdown (NEBD; Figure 1). To purify labeled nuclei from meiocytes, we extracted total nuclei from whole inflorescences with buds at floral stage 9 (Smyth et al., 1990) in the AtDMC1:NTF/ACT2:BirA line. Then, the nuclei were incubated with streptavidin-coated magnetic beads according to INTACT protocols (Deal and Henikoff, 2011; Wang and Deal, 2015). After nucleus isolation, we used a fluorescence microscope to observe the complex DAPI-stained nuclei/beads (Figure 2).
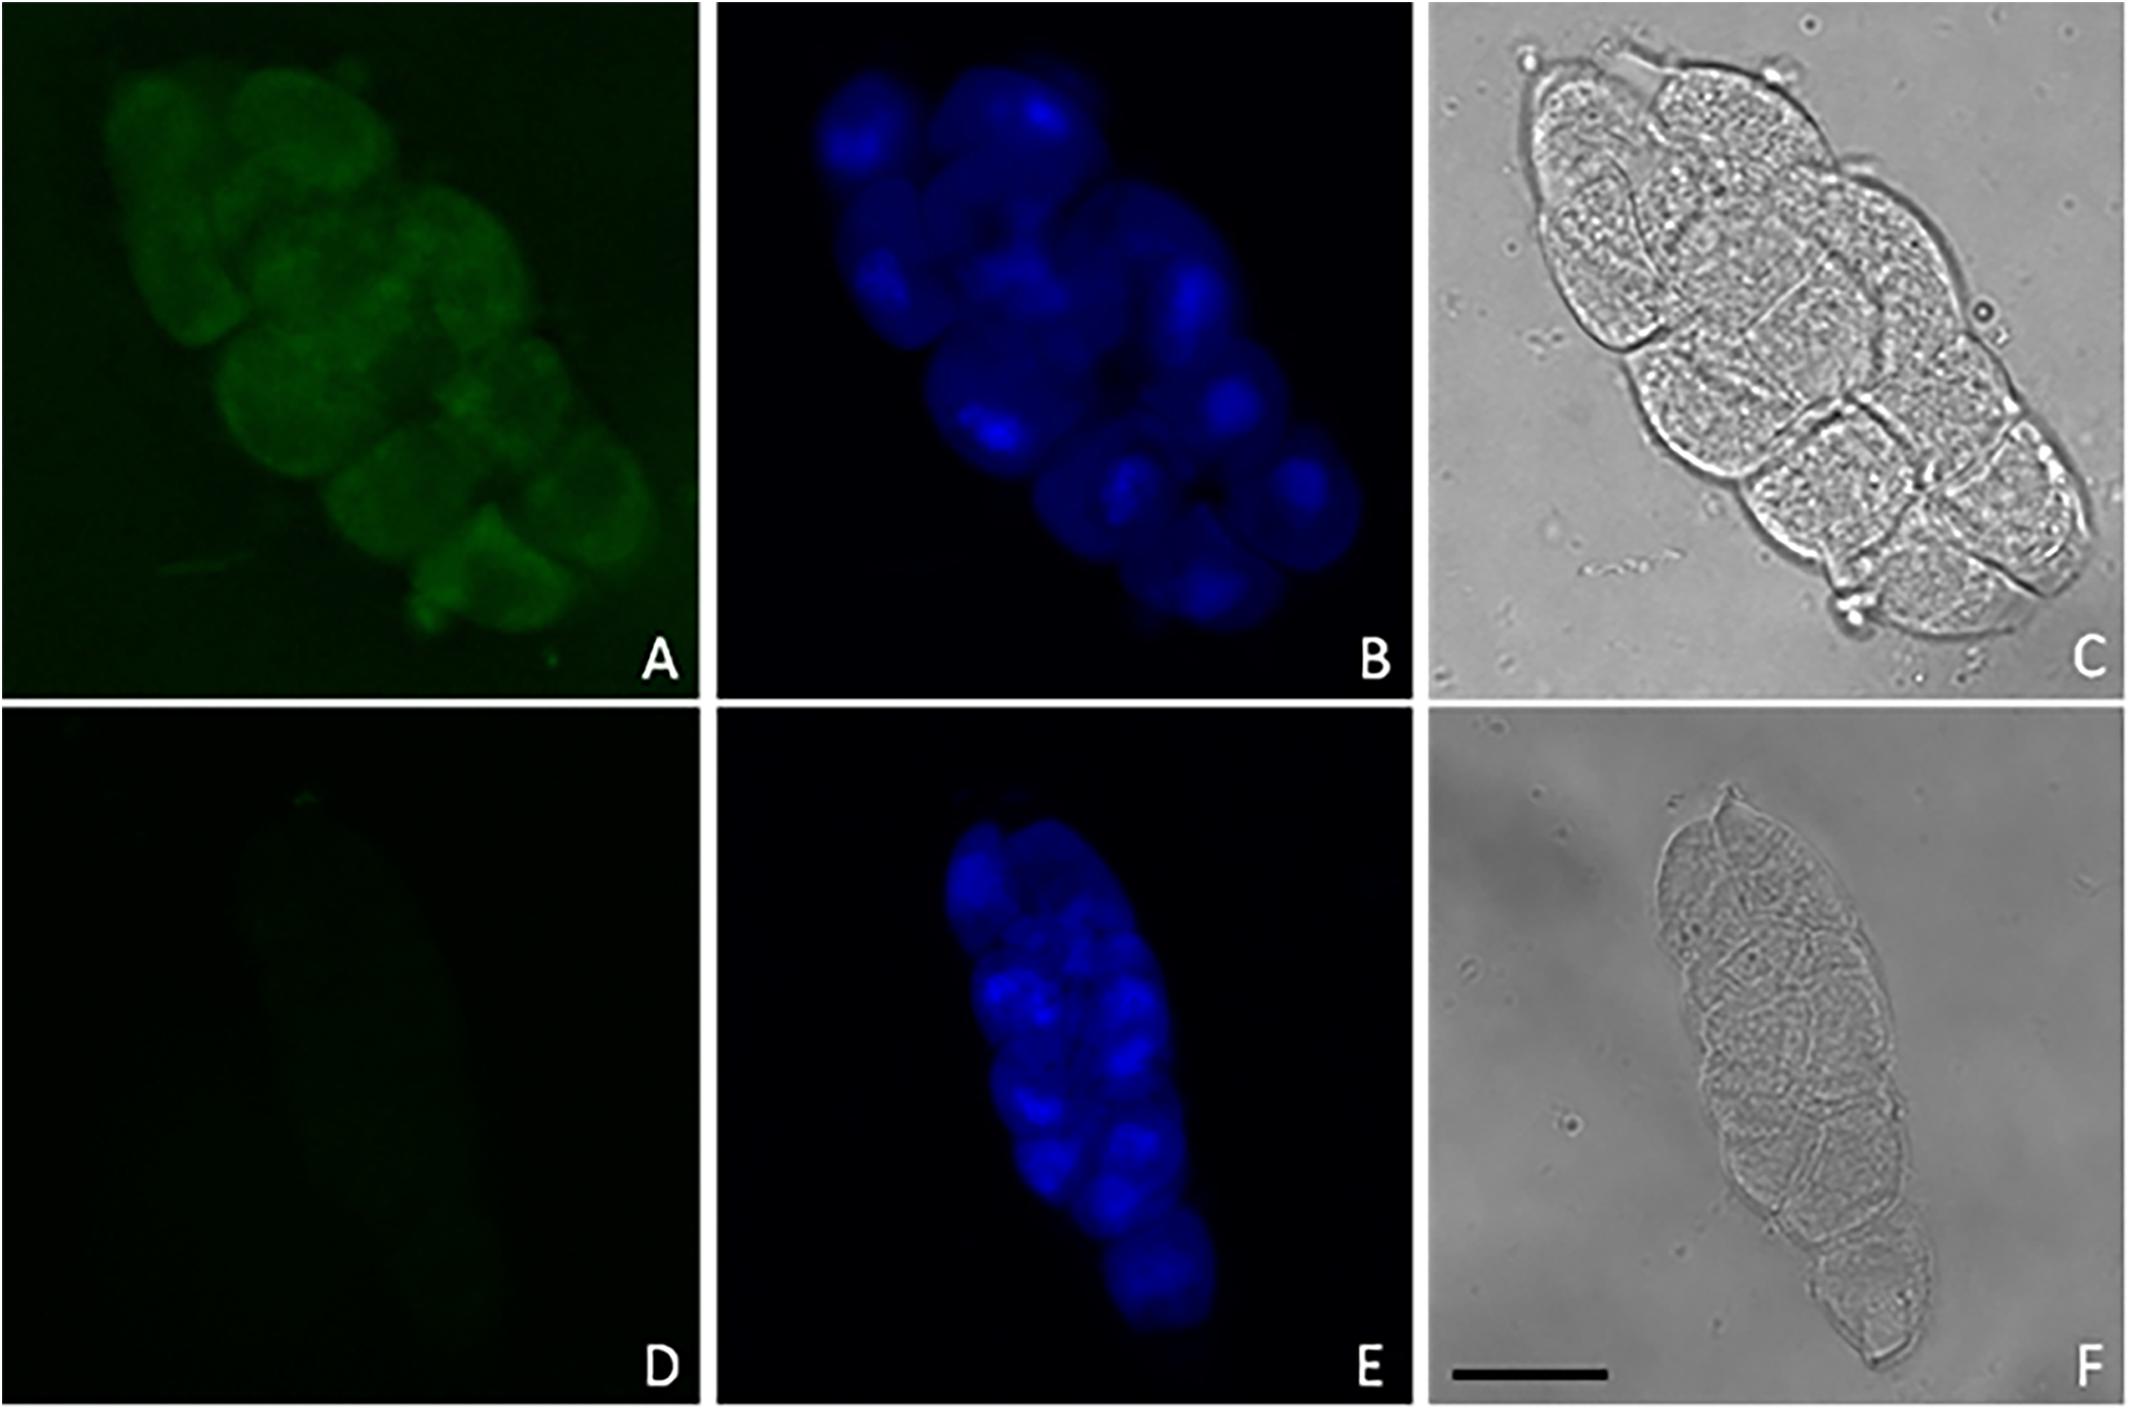
Figure 1. Representative confocal images of GFP (A,D) and DAPI (B,E) fluorescence in male meiocytes along with phase contrast observations (C,F) from AtDMC1:NTF/ACT2:BirA line (A–C) and wild type (D–F). Nuclei (blue) were stained by DAPI (10 μg/ml) to visualize DNA. Scale bar: 10 μm.
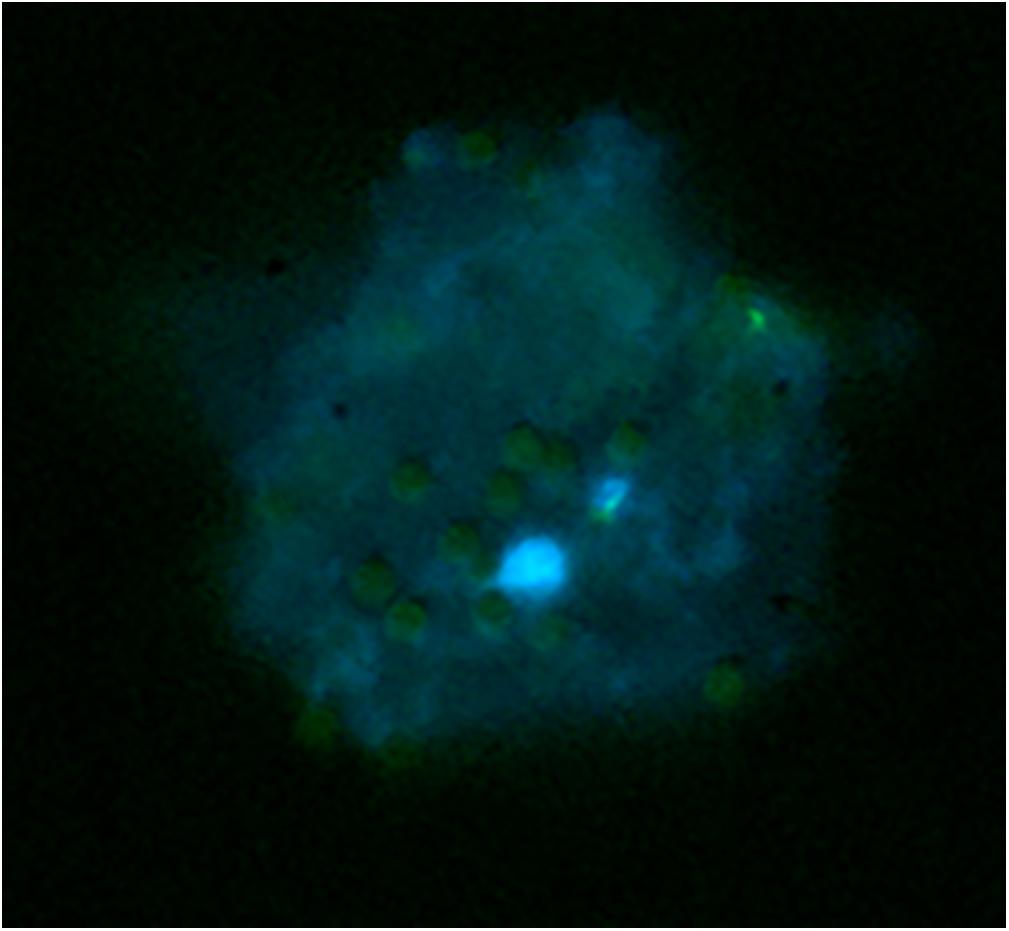
Figure 2. Capture of biotinylated nuclei from meiocytes in the AtDMC1:NTF/ACT2:BirA line using streptavidin-coated magnetic beads. Nuclei (blue) stained with DAPI are surrounded by 2–8-μm spherical beads (pale green).
RNA-seq From Isolated Nuclei of the Meiocytes
To obtain the meiotic nuclear transcriptome, RNA sequencing (RNA-seq) was performed downstream of INTACT. RNA extracted from isolated nuclei of meiocytes in three replicates was sequenced by using the Illumina technology following an amplification step. Pearson’s correlation coefficient indicated the reliability of the experiment (Supplementary Figure 1). After trimming, an average of 85,927,325 reads per replicate were obtained (Supplementary Table 5). About 77% of these reads were mapped onto the Arabidopsis genome (Supplementary Table 6). The percentages (calculated as average of the replicates) of the uniquely mapped reads located in known exons, introns, and intergenic regions are 38, 26, and 36%, respectively (Supplementary Figure 2). Given the high percentage of reads that mapped to multiple positions (Supplementary Table 6), the gene expression, measured as TPM (Transcript Per Million), was calculated by a specific algorithm (Kallisto) which is able to process multiple mapping reads (Supplementary Table 7). A frequency ranging between 75.2 and 81.3% of the genes (total no. 32,833) was detected across the replicates (Supplementary Figure 3). Transcript types of each replicate are summarized in Figure 3 showing the distribution of expression profiles for the different gene classes. Ribosomal RNA appeared the most abundant class whereas lncRNA is the less expressed class. This result is consistent with a recent study in barley in which 65% of the downregulated DEGs were lncRNAs in leptotene/zygotene vs. pre-meiosis comparison (Barakate et al., 2020).
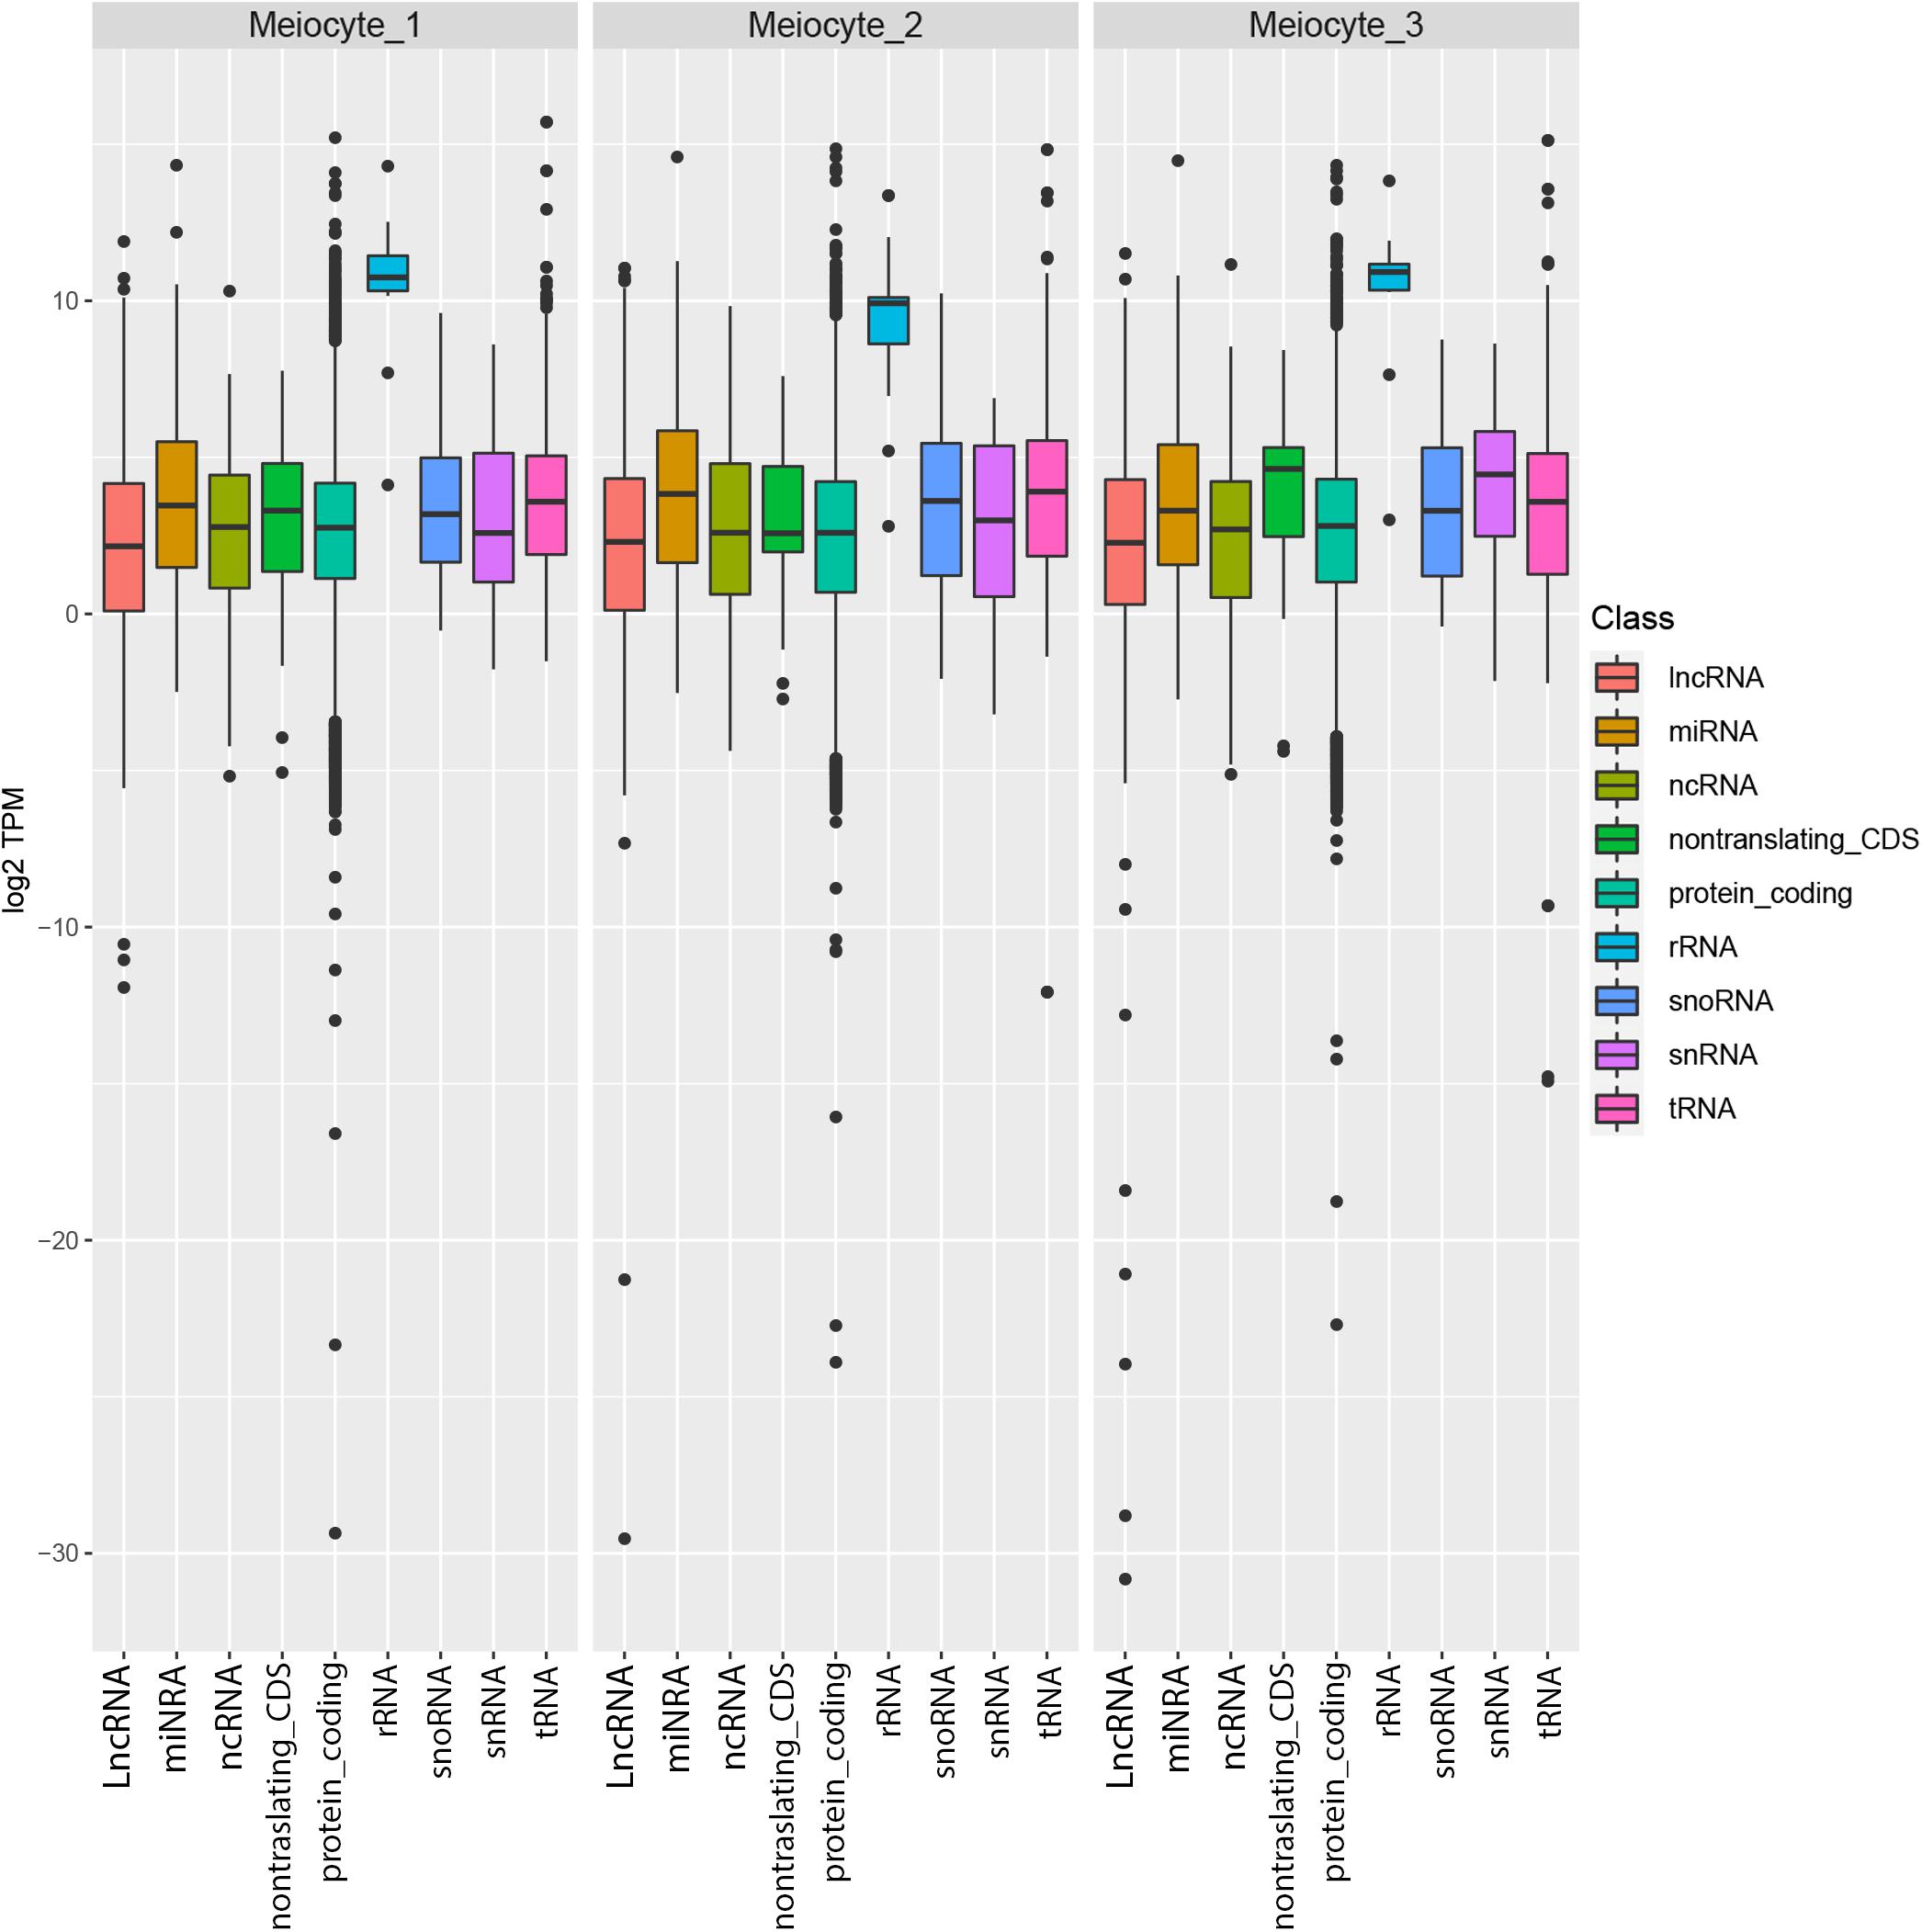
Figure 3. Distribution of the expression levels of Arabidopsis thaliana genes in the meiocytes. Genes are divided in multiple biotypes according to the official annotation, and for each one the distribution of log2 TPM values is represented as box plots.
Transcripts were grouped into four classes according to their expression levels from low to high (Supplementary Figure 4). GOEA was performed to identify enriched (i.e., over-represented) GO terms associated with the different expression classes (Supplementary Figures 5A–D). The most enriched GO terms, such as “DNA demethylation” in the mid/high-expression class and “RNA stabilization” in the high expression class, suggest that these biological processes are particularly relevant to meiosis. To assess the reliability of our results, we surveyed the genes with documented functions in Arabidopsis meiosis. A list of 197 meiotic genes was implemented using GO terms GO:0051321 (meiotic cell cycle) and GO:0140013 (meiotic nuclear division) (Supplementary Table 8). The majority of meiotic genes were distributed in the classes of mid/high and high expression while a small number were in the low-expression class (Figure 4). By comparison, this class was the third most represented for the total of transcripts (Supplementary Figure 4).
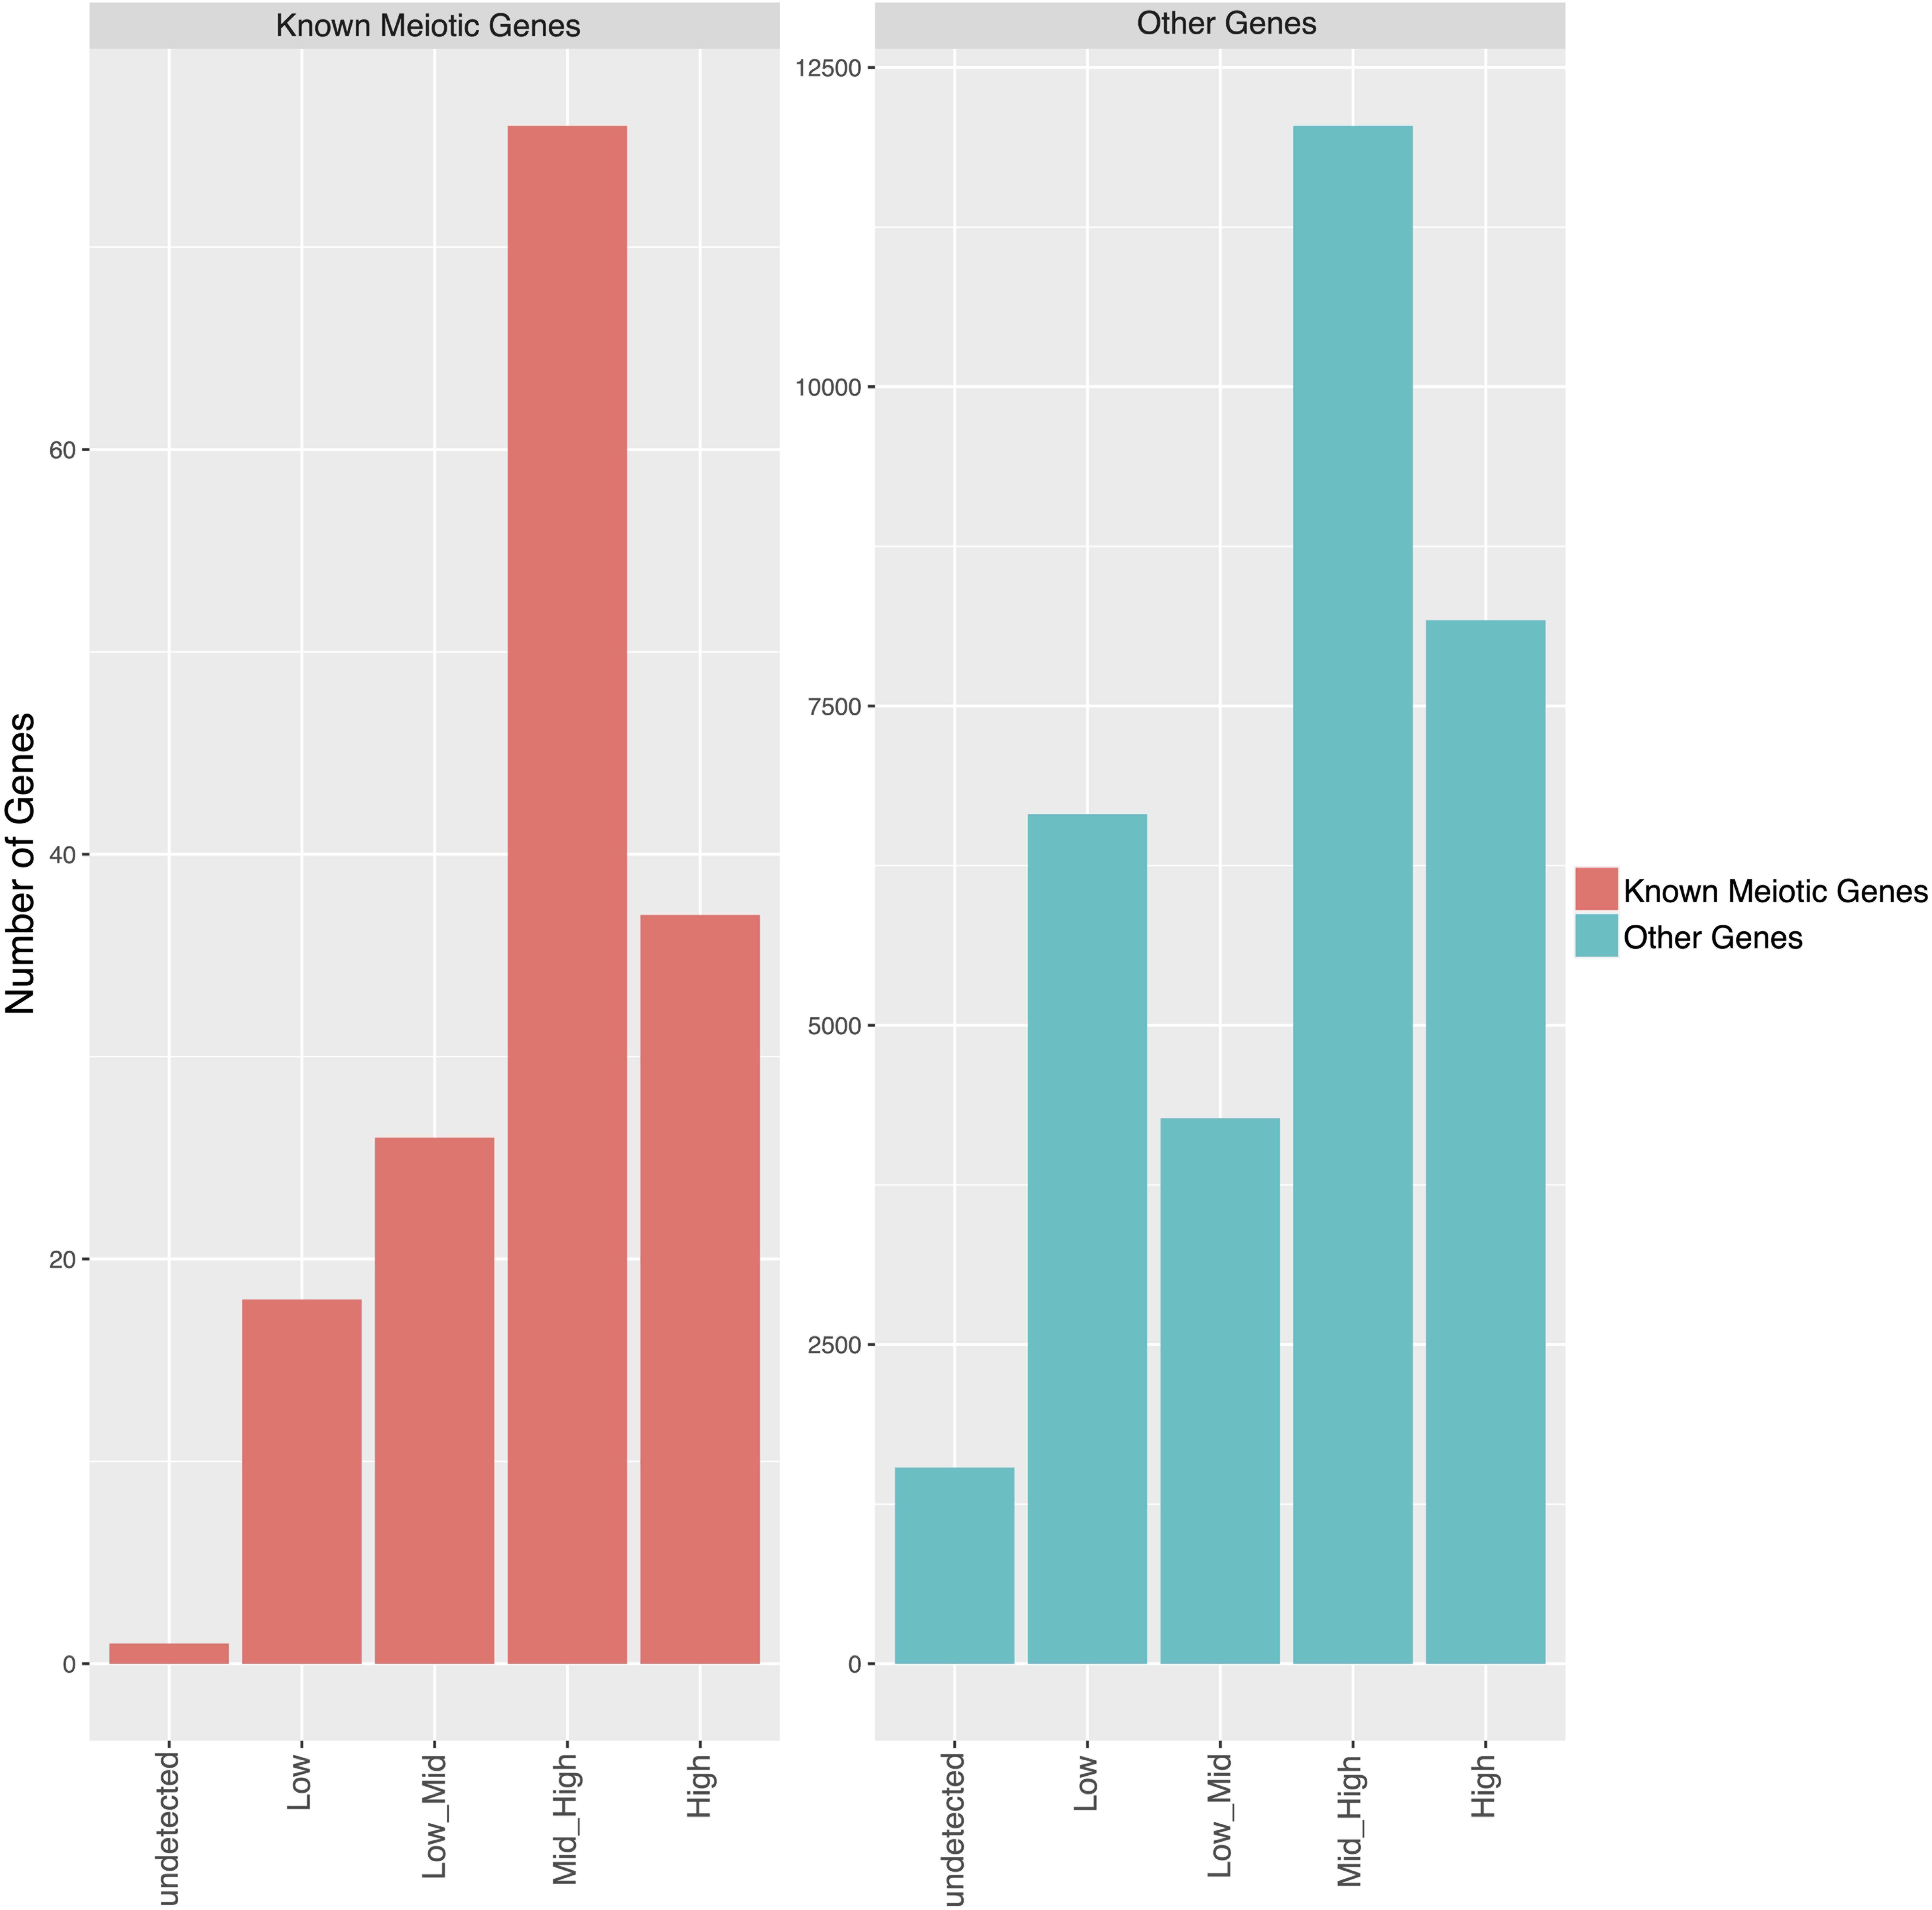
Figure 4. Bar plot showing the number of genes classified in expression ranges in the meiotic cells. Genes were classified based on their average expression levels using the following criteria: “undetected” if the expression level was 0 in all the replicates, “Low” if log2 average TPM ≤ 1.252, “Low_Mid” if log2 average TPM > 1.252 and ≤ 2.207, “Mid_High” if log2 average TPM > 2.207 and ≤ 4.169, and “High” if log2 average TPM > 4.169. Genes were divided into known meiotic genes (left) and other genes (right).
Transcriptome Comparison Between Male Meiocytes and Other Tissues
To further characterize our meiotic transcriptome, we compared it with publicly available transcriptomic data from other specific tissues and cell types of Arabidopsis. Initially, we planned to compare our RNA-seq data with those from male meiocytes isolated by micromanipulation in Arabidopsis (Chen et al., 2010; Yang et al., 2011) but, unfortunately, these datasets are not available.
Based on the low expression of AtDMC1 (Supplementary Figure 6), we discarded replicate 1 in all the subsequent analyses. Principal component analysis (PCA) performed with meiocytes (current study), meristem, leaf, root, flower buds, tapetum (from two different developmental stages), pollen, and silique revealed that meiocytes clustered close to flower buds, as expected, but also to tapetum and pollen (Figure 5). We evaluated the expression profile of genes (list reported in Supplementary Table 9) considered to be specific for these two types of cells (Loraine et al., 2013; Li et al., 2017). The heat map revealed expression patterns specific for meiocytes, tapetum, and pollen (Figure 6). On the other hand, a hierarchical sample dendrogram showed that meiocyte sample groups together with tapetum 6–7 as well as pollen with tapetum 8–10 equivalent to a later stage.
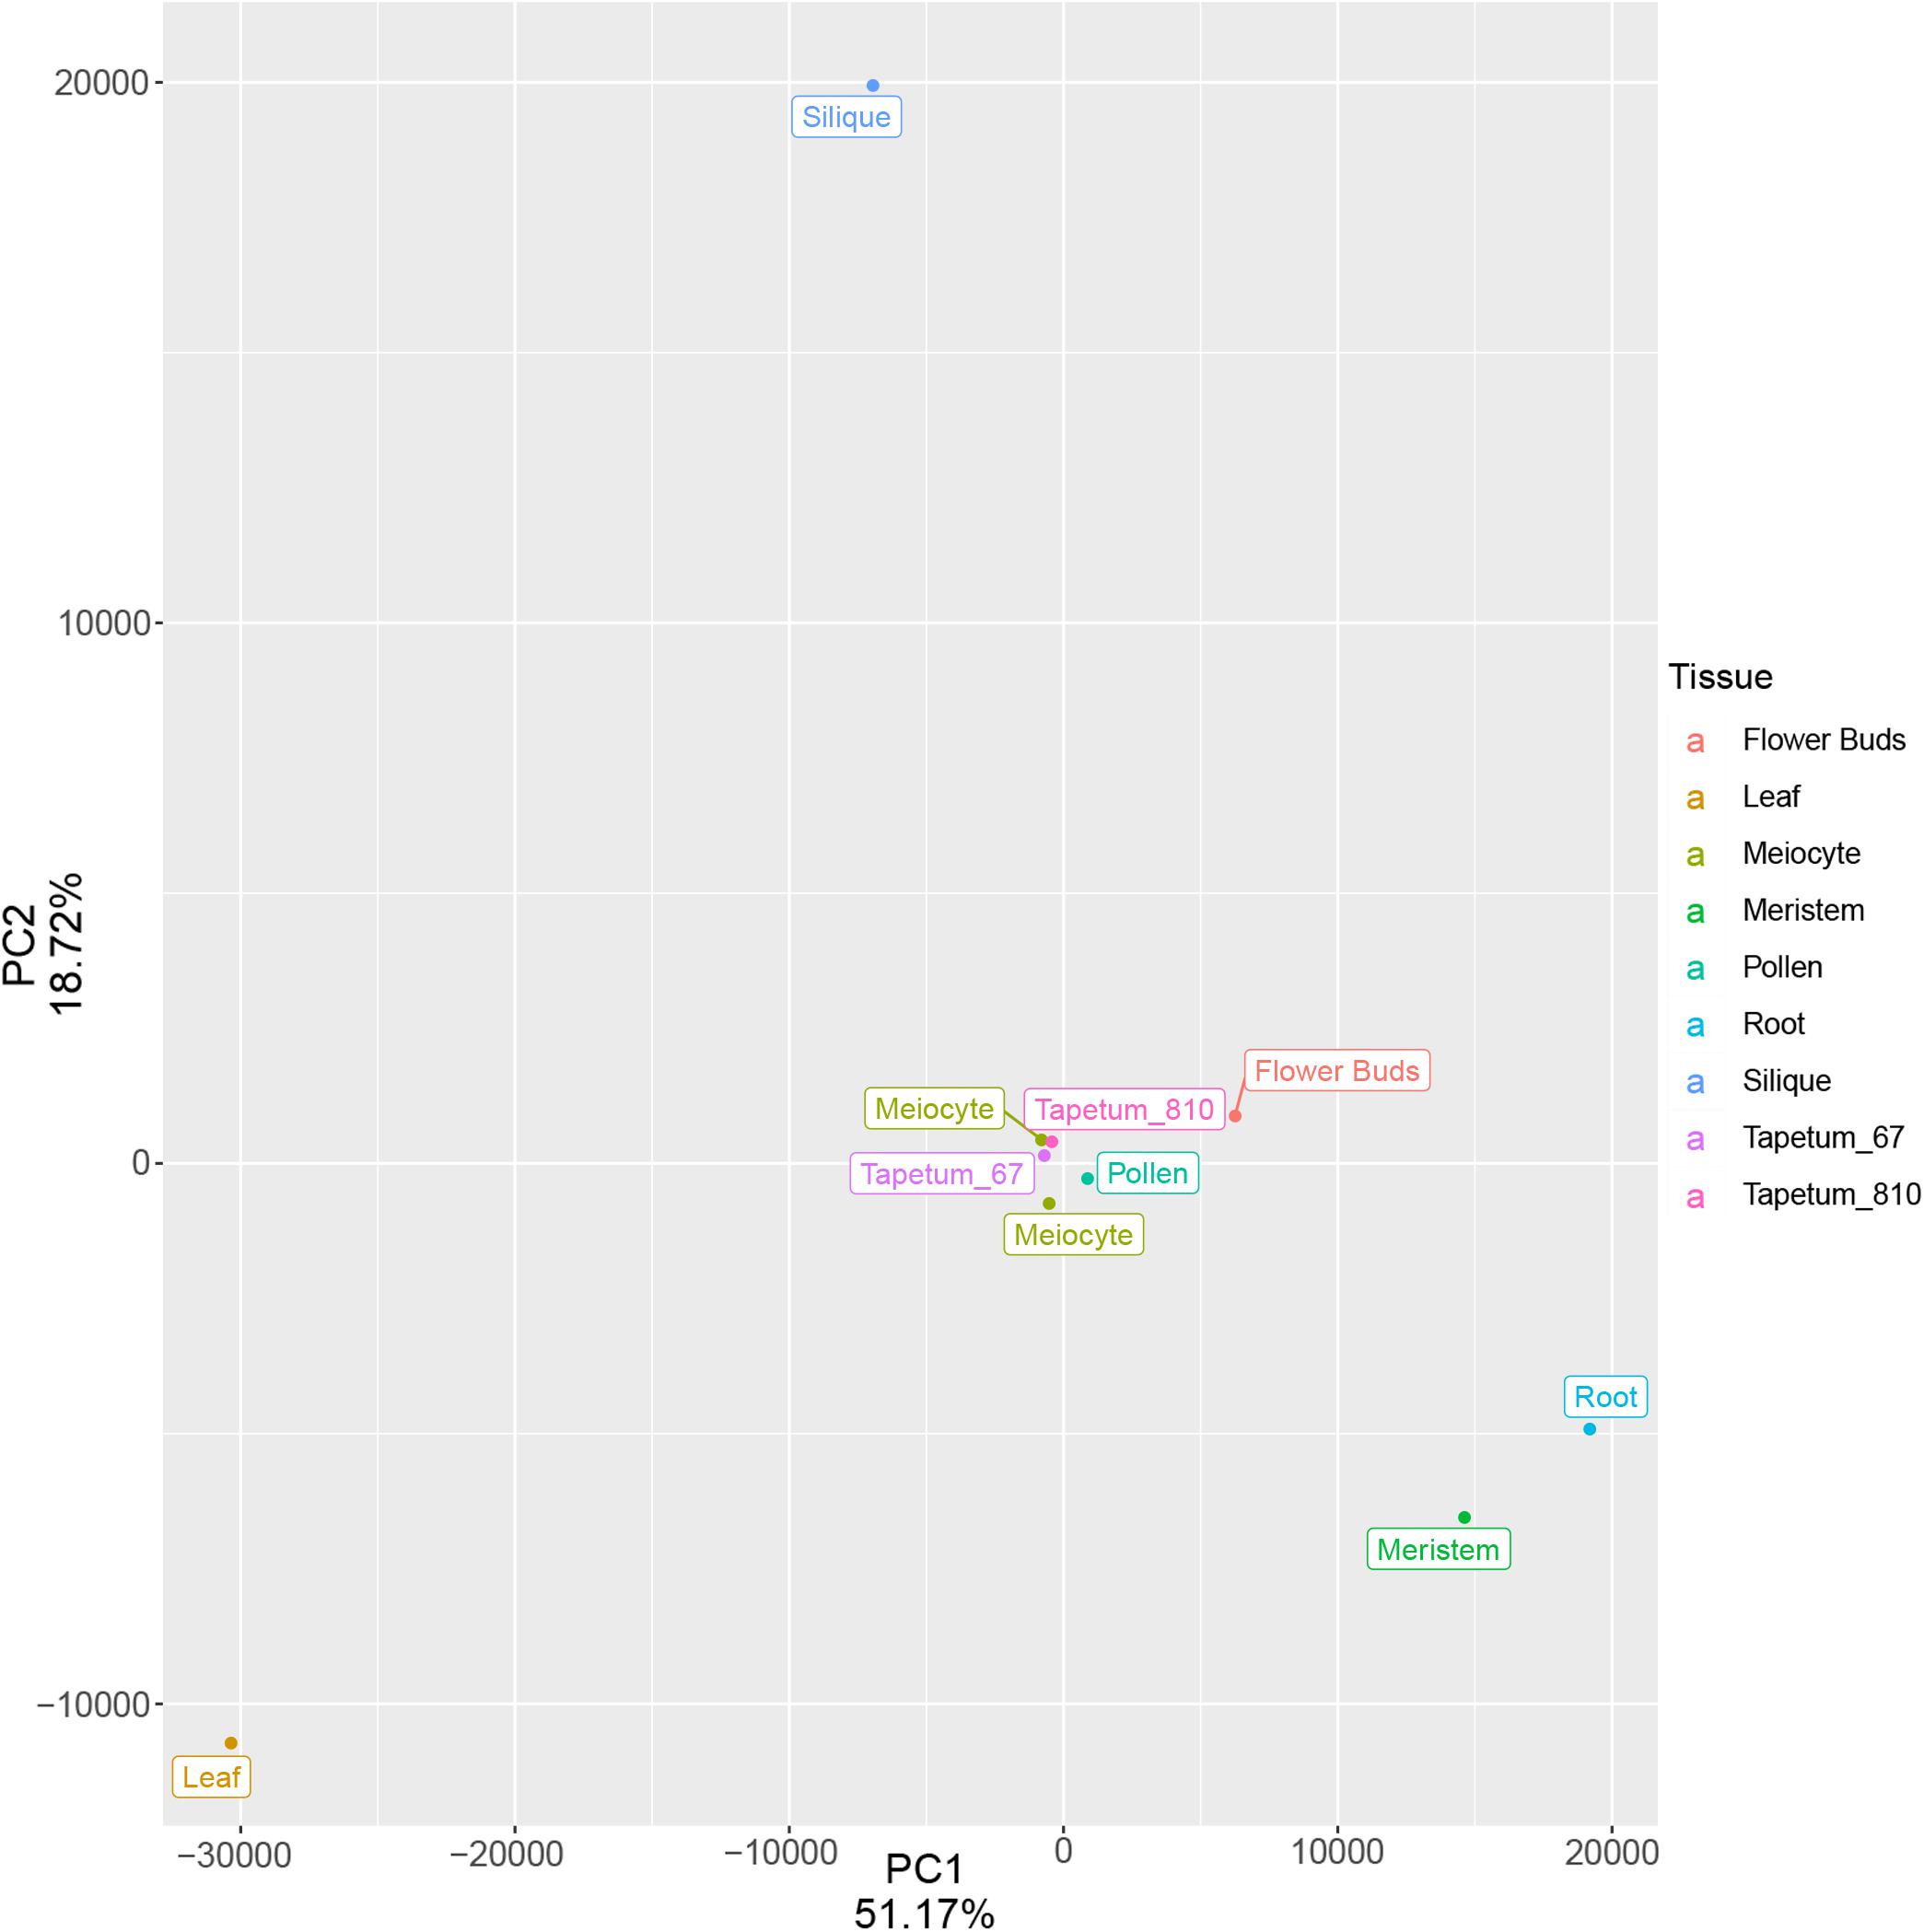
Figure 5. Principal component analysis of meiocytes (current study) and multiple Arabidopsis tissues after batch correction of the TPM values. The variance associated with each PC is shown in the plot. Each point represents a tissue/cell type.
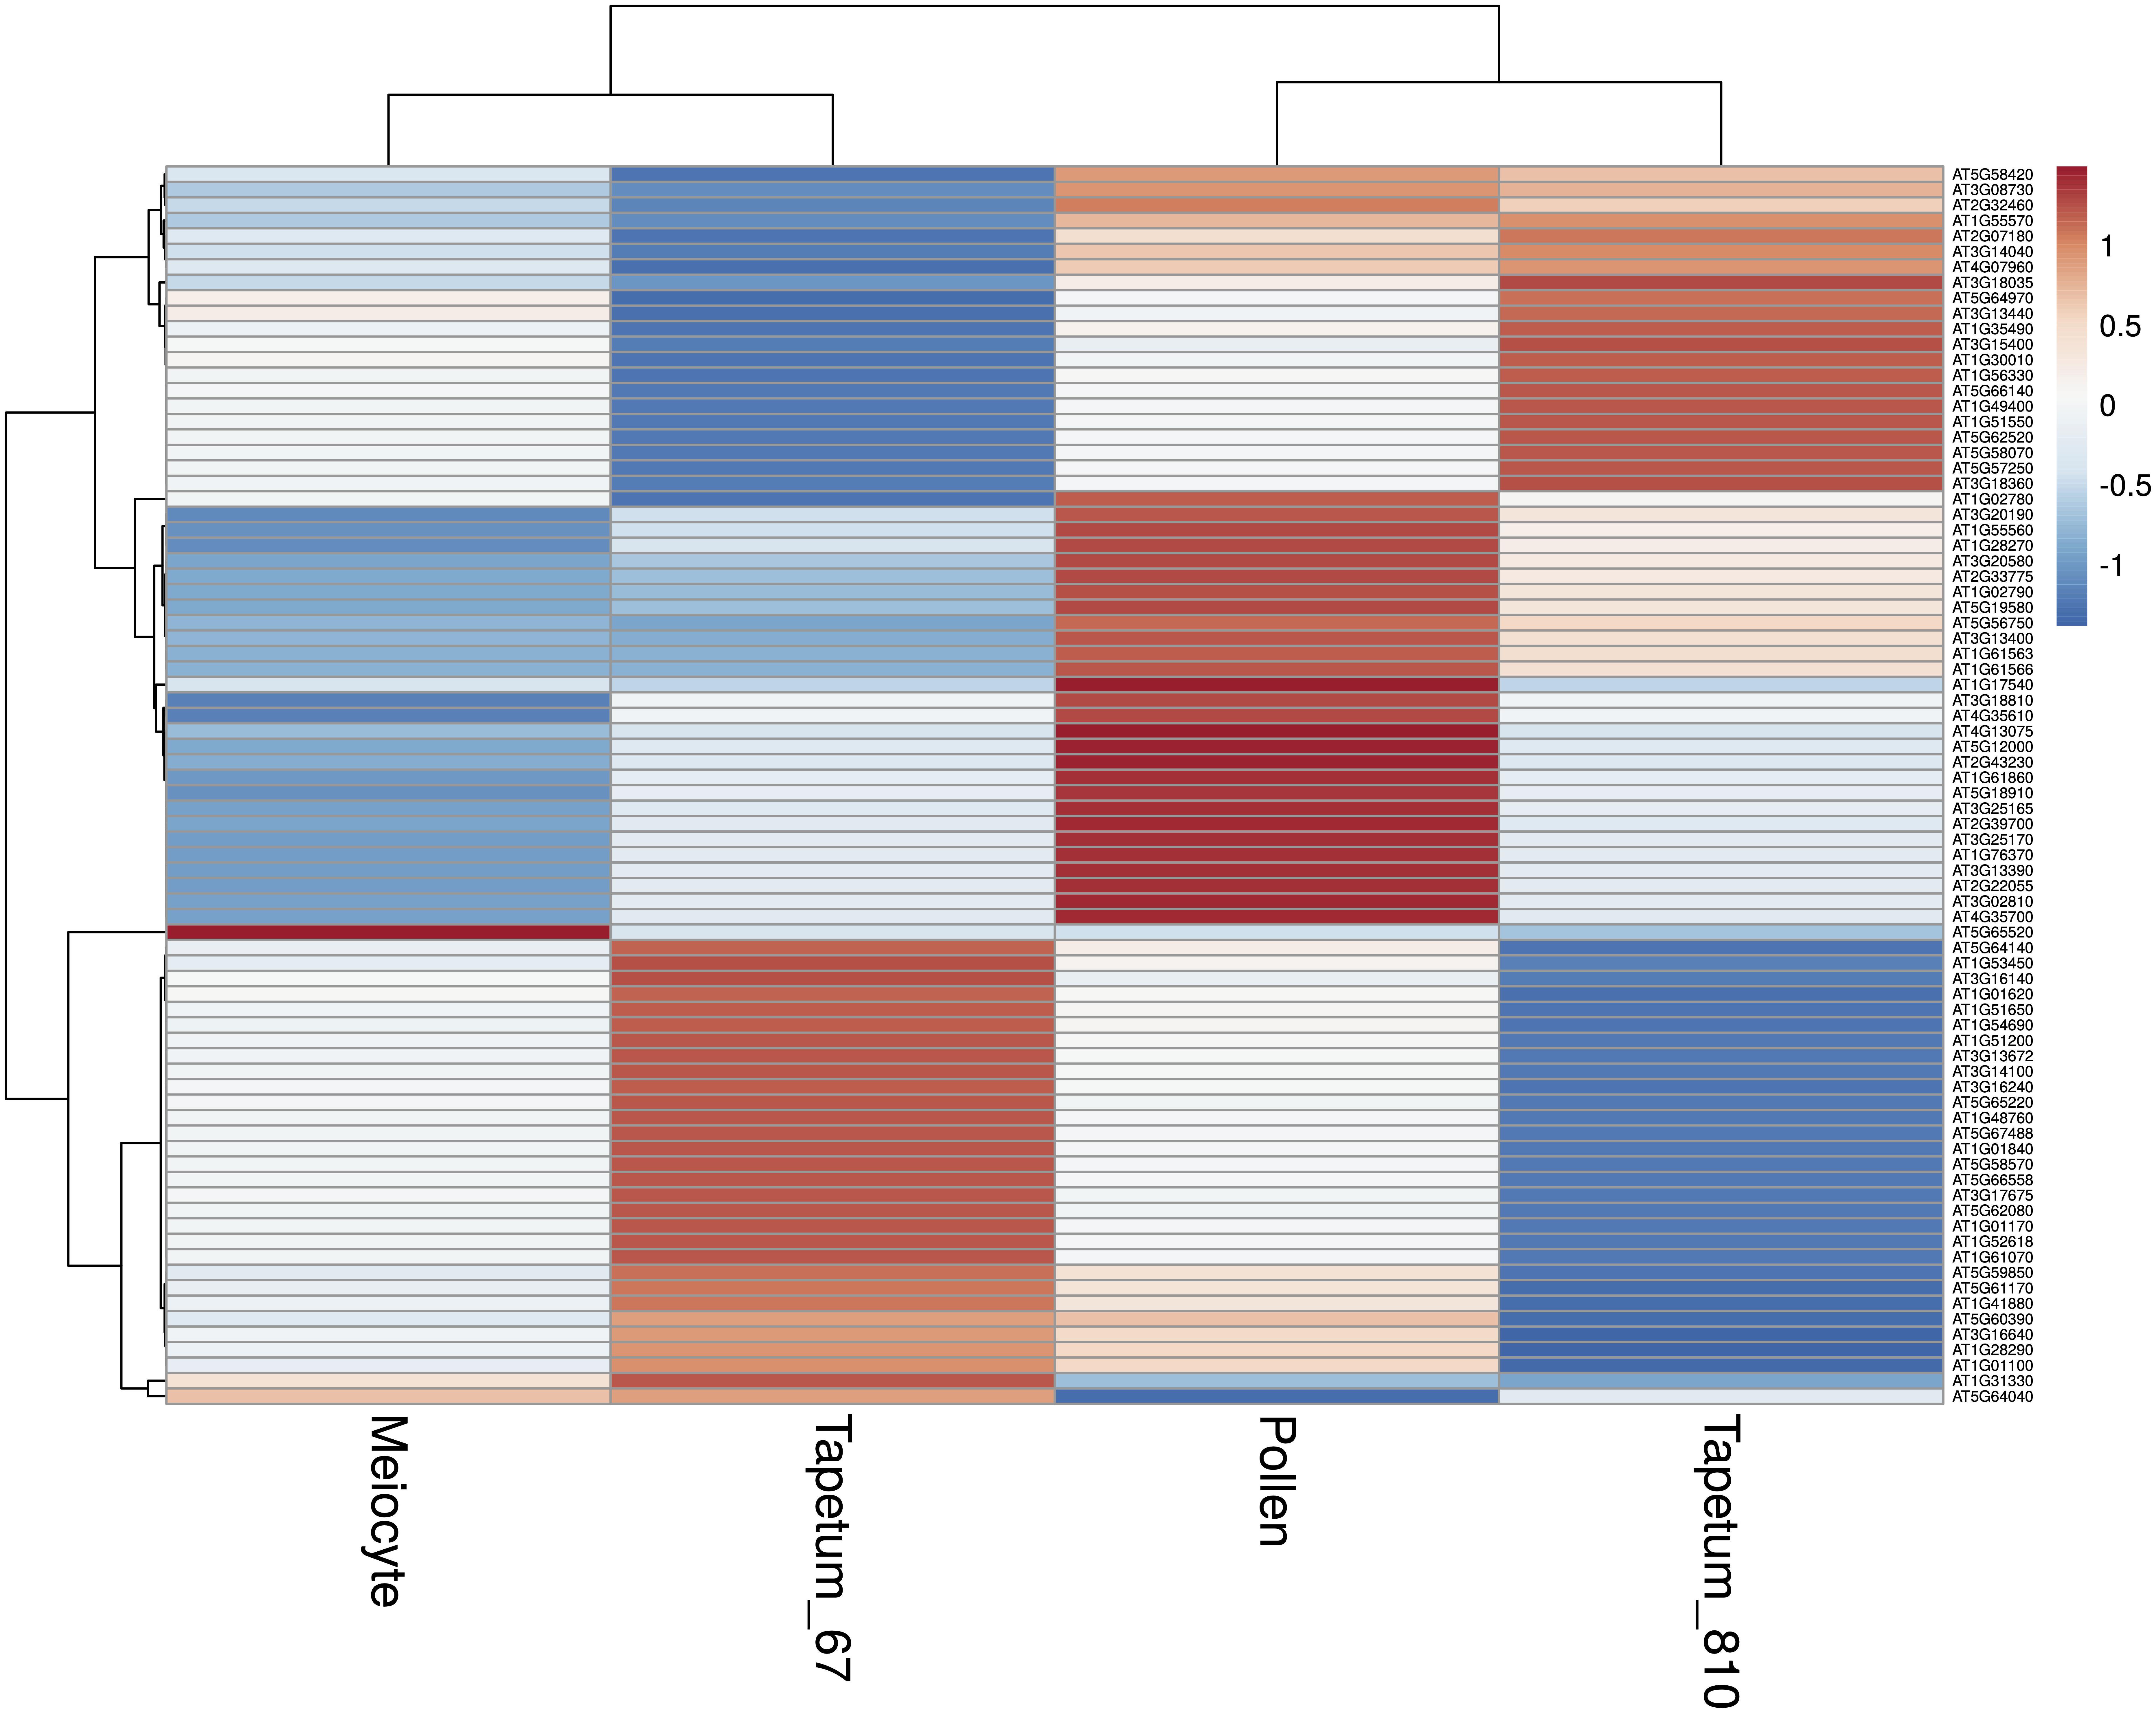
Figure 6. Heat map showing the expression profile of genes considered to be pollen or tapetum specific. Each line represents a gene; the gradient of color was obtained after scaling of the TPM values and after batch correction of the expression data. The meiocyte data corresponds to the average of the two replicates. The genes and the samples are grouped applying a hierarchical clusterization on the Pearson correlation values as shown by the hierarchical tree on the left and on the top.
Afterward, we assessed the overall gene expression of meiotic genes (list reported in Supplementary Table 8) and of the other transcripts in meiocytes and multiple tissues (Figure 7). The analysis revealed that the median expression value of meiotic genes was higher in isolated meiocytes when compared to the other tissues/cell types with the exception of floral bud and meristem samples. This result is not surprising since the meiocytes are included in floral buds and they share cell-cycle genes with the meristem. The median expression value of the other transcripts was basically steady across the different tissues (Figure 7). Considering the meiotic gene expression fold changes between meiocytes and the other tissues/cell types, the heat map revealed a pattern in agreement with the above reported analysis (Figure 8 and Supplementary Table 10).
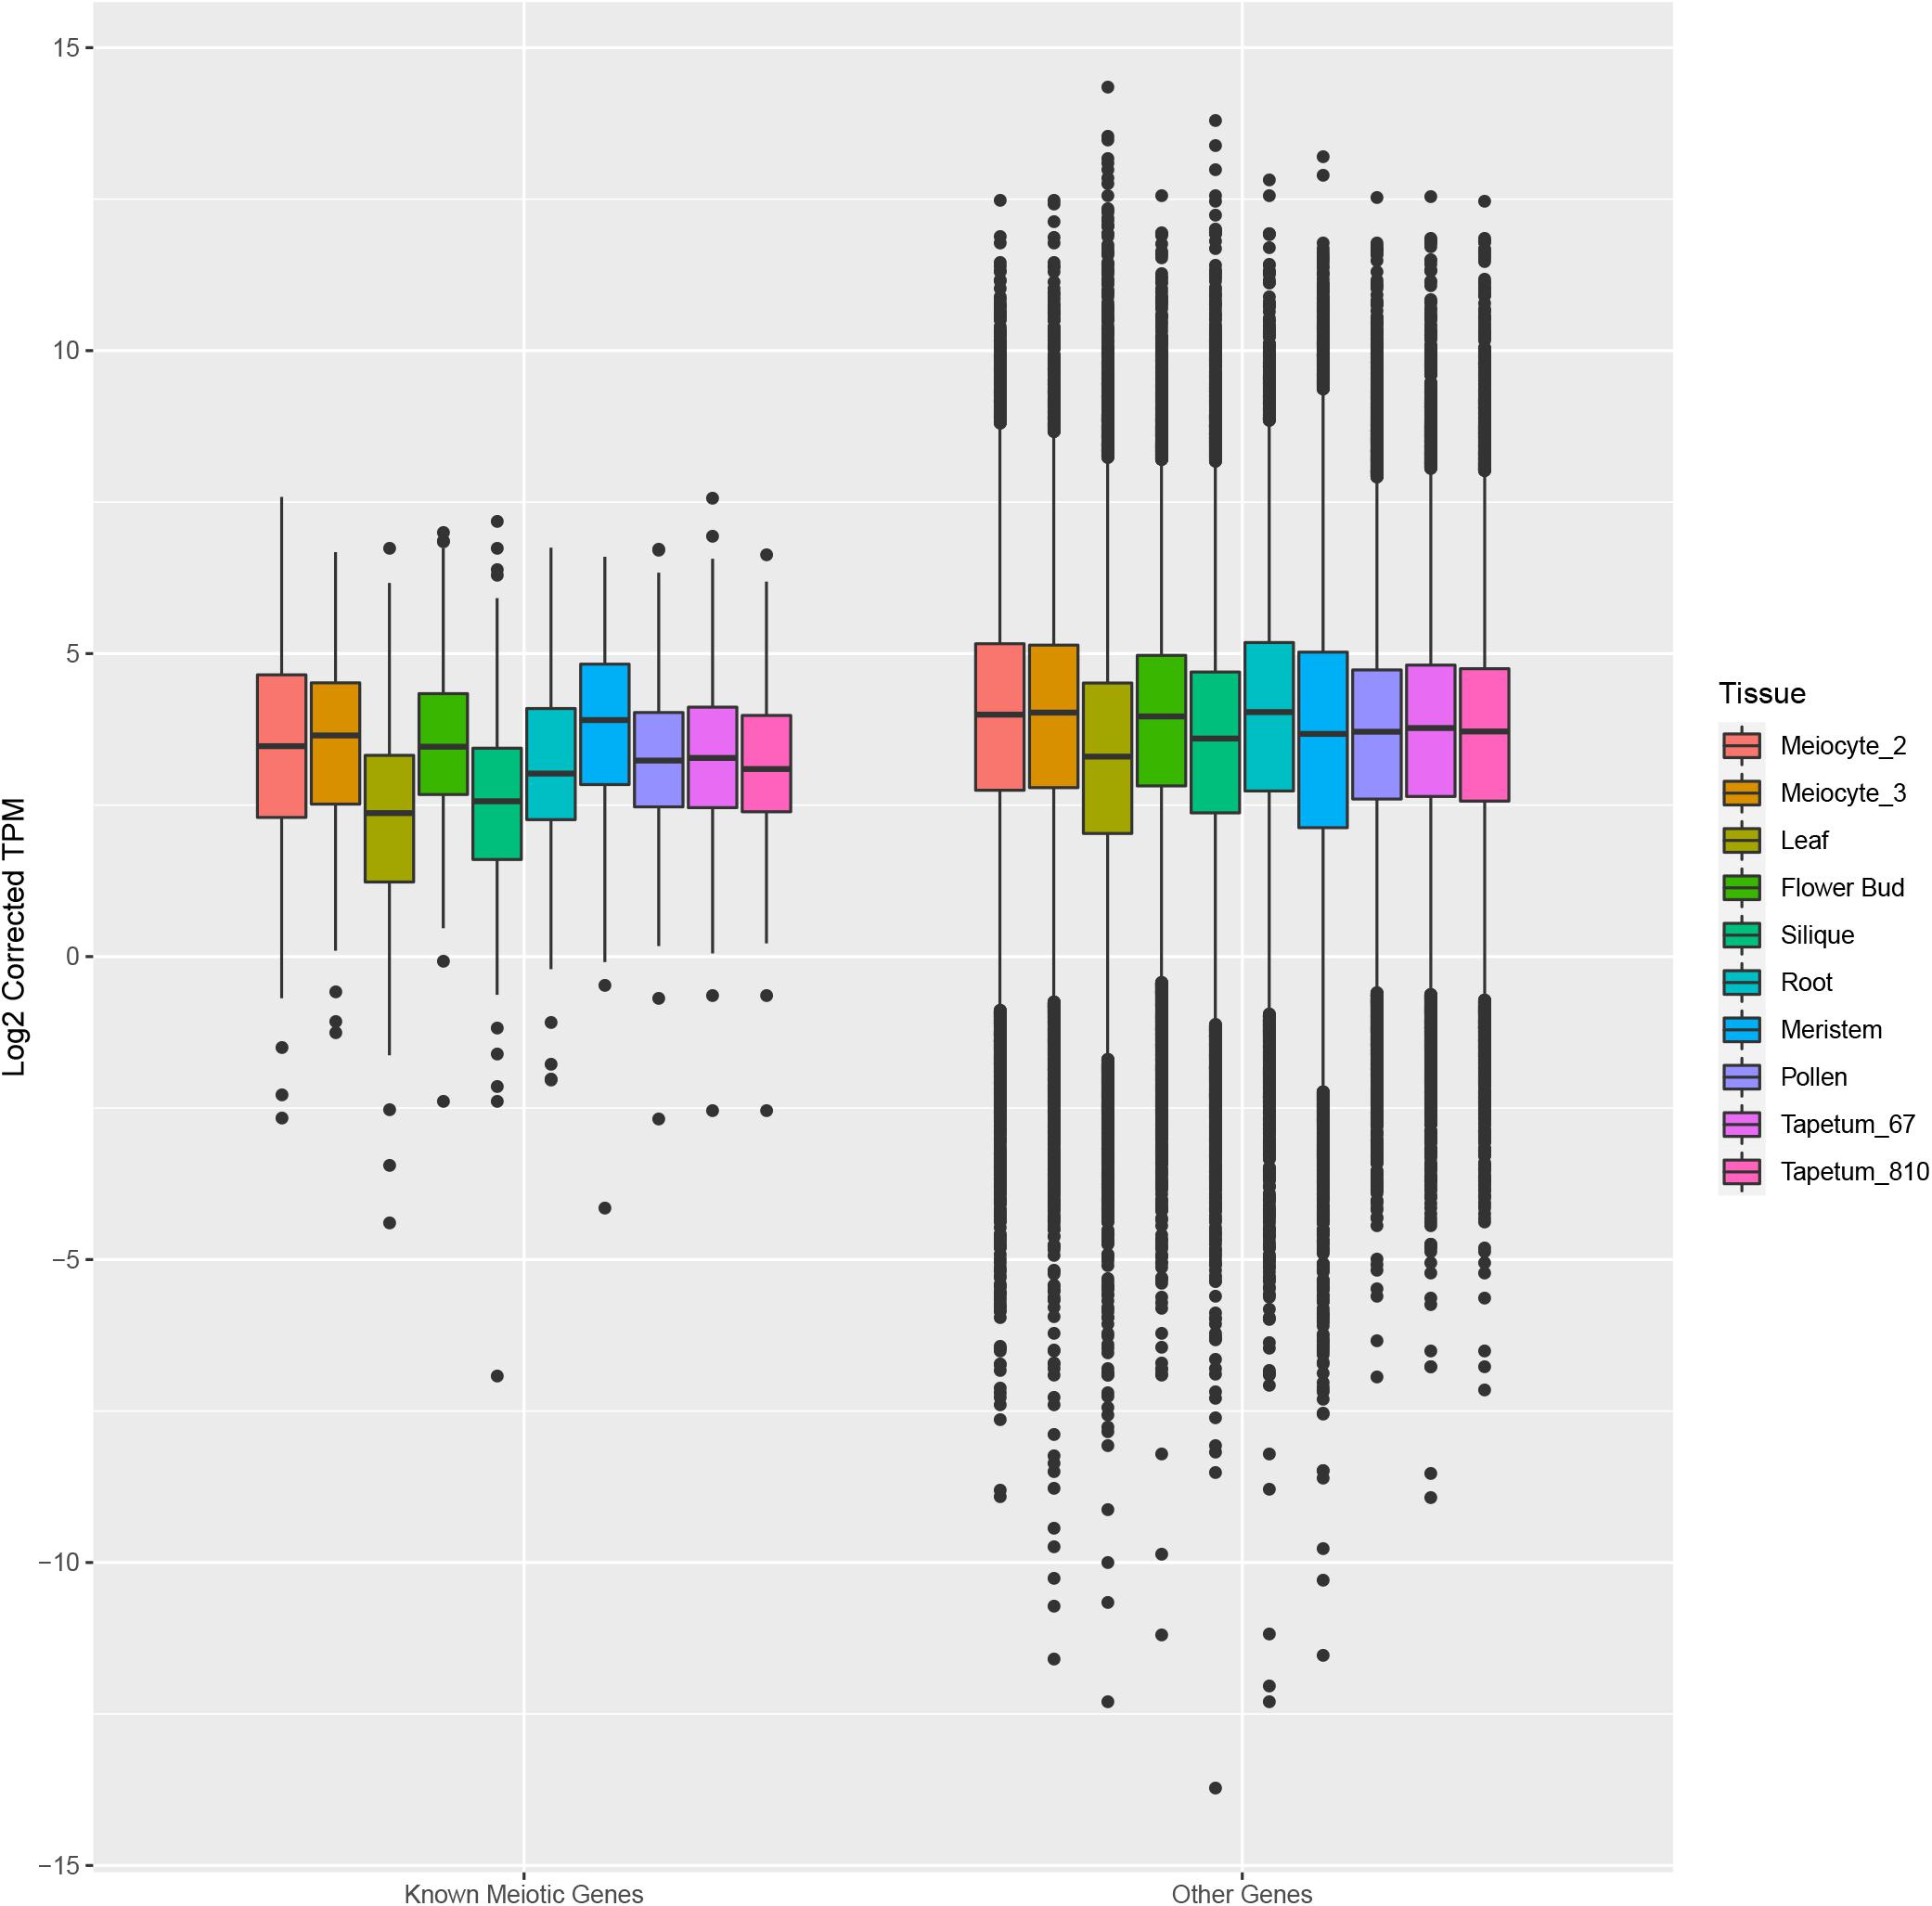
Figure 7. Box plots showing the distribution of expression values of known meiotic genes (left) and other genes (right) in meiocytes (current study) and multiple Arabidopsis tissues. The box corresponds to the interquartile range (IQR), and the black line inside each box represents the median. The upper whisker extends from the hinge to the largest value no further than 1.5 * IQR from the hinge. The lower whisker extends from the hinge to the smallest value at most 1.5 * IQR of the hinge. Data beyond the end of the whiskers are called “outlying” points and are plotted individually.
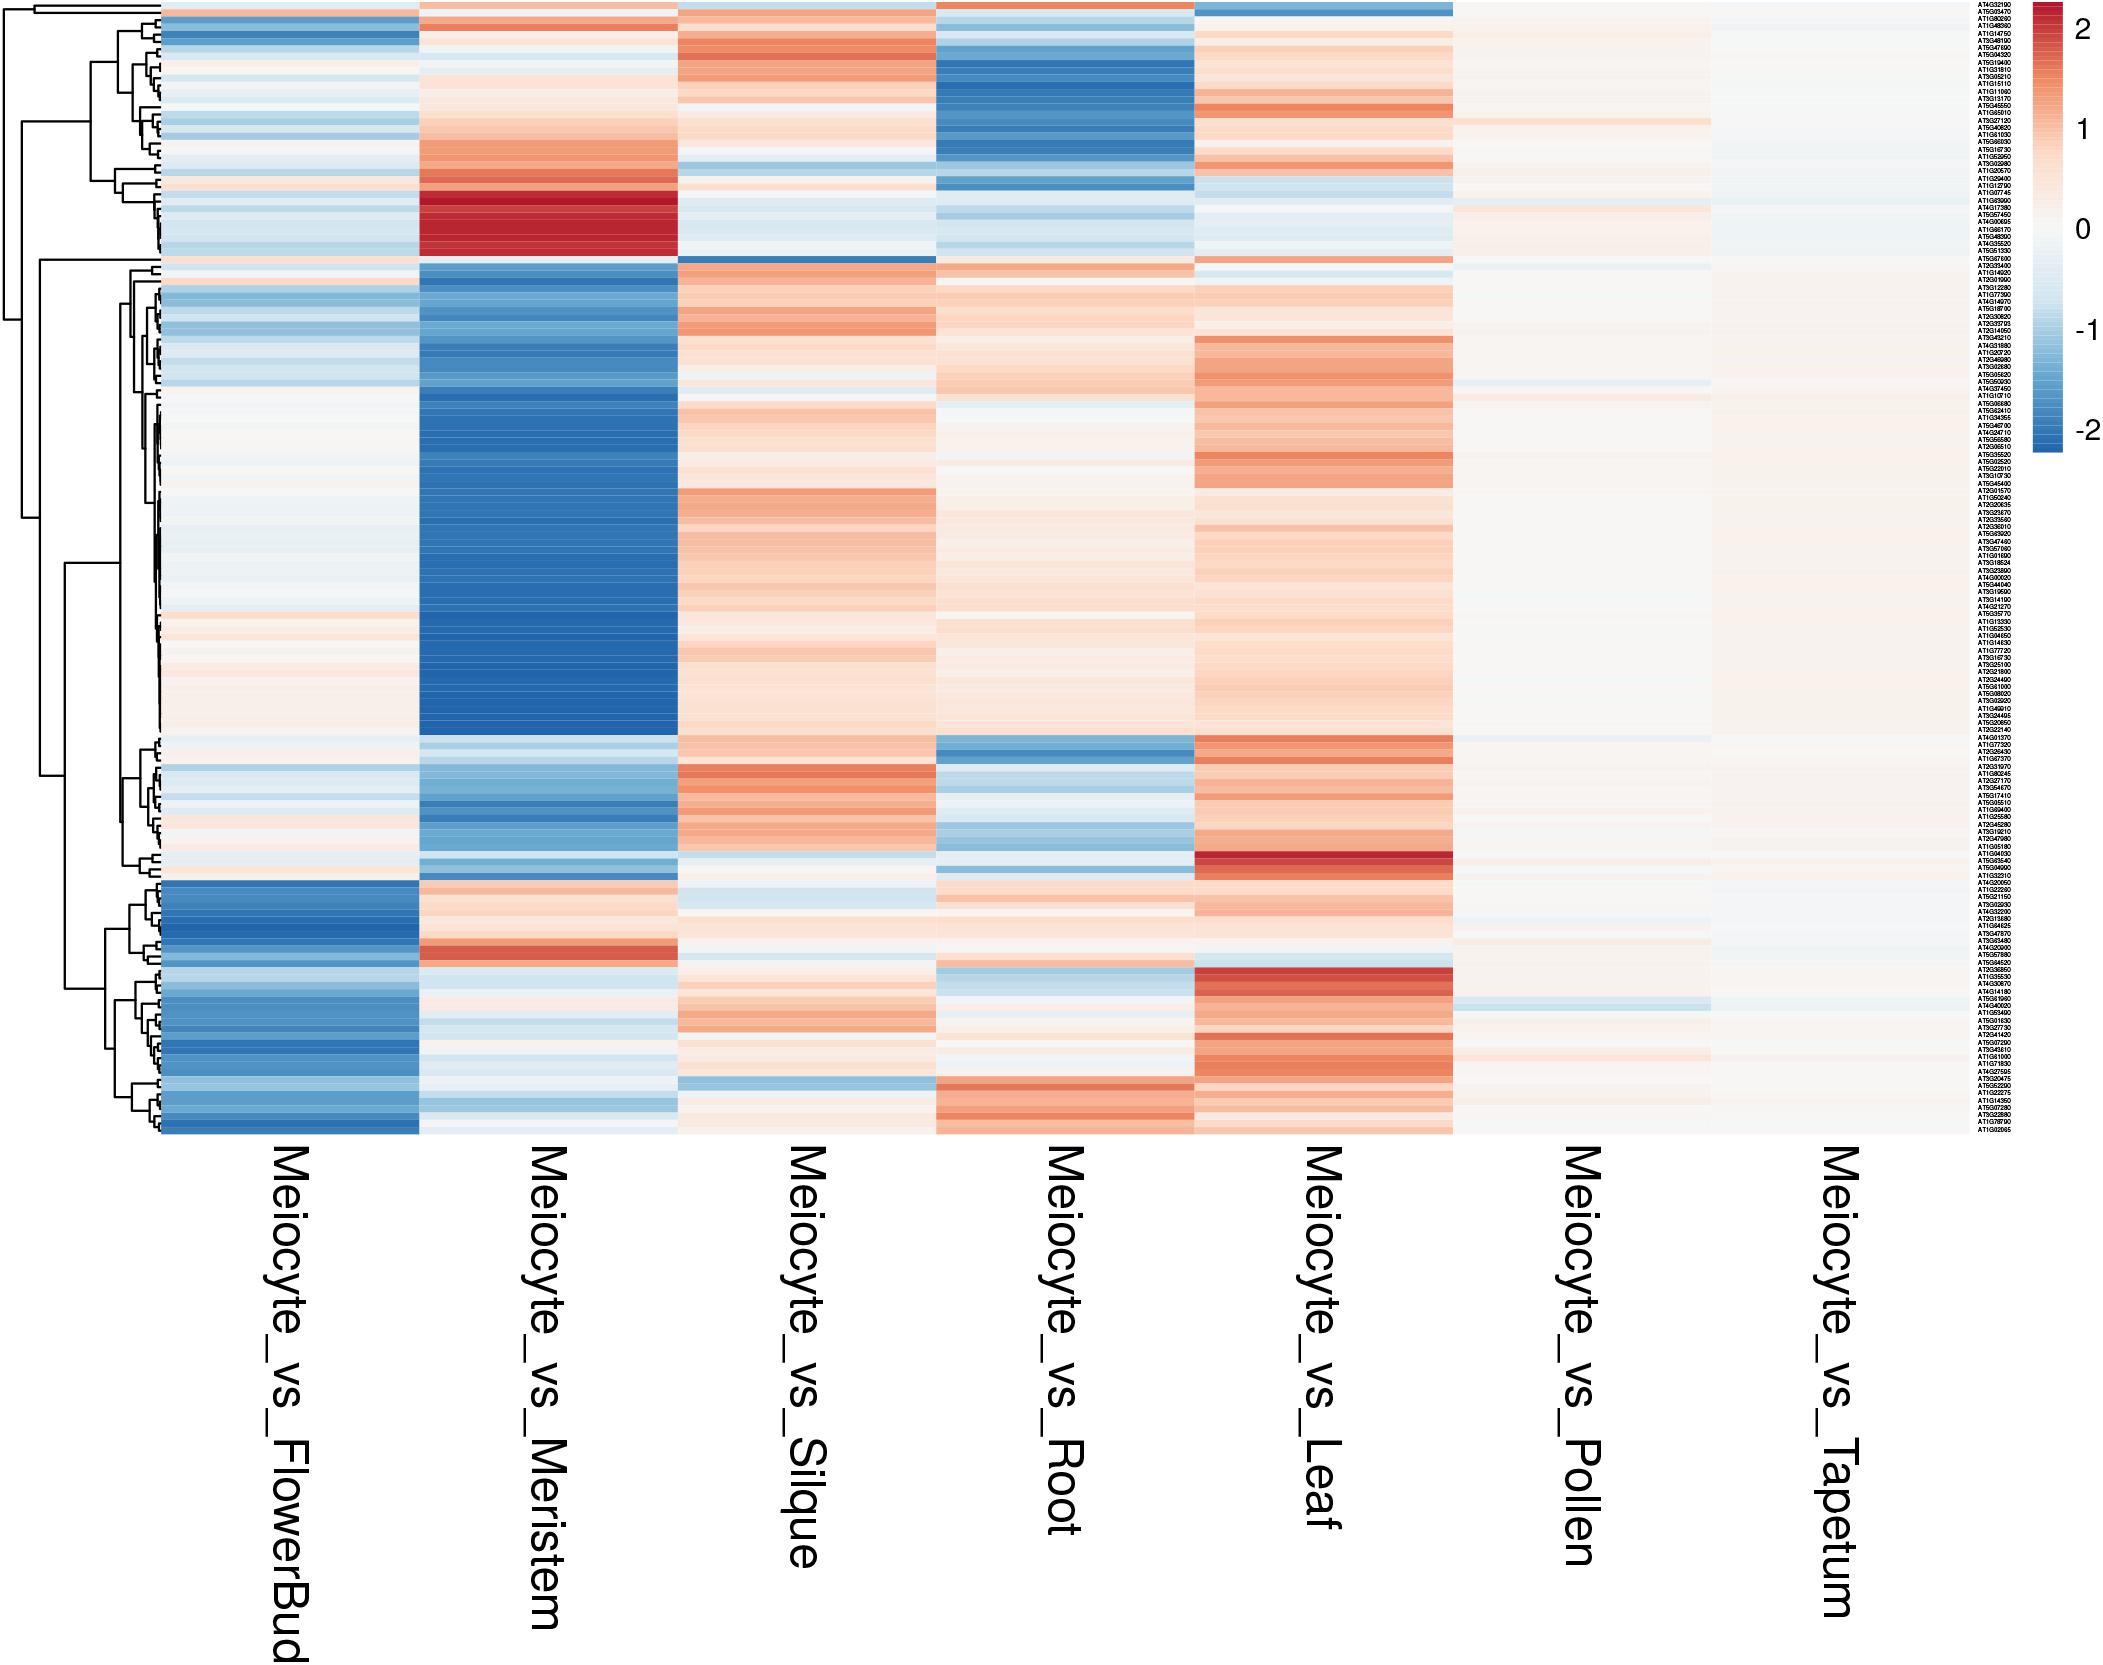
Figure 8. Heat map showing the gene expression fold changes between meiocytes and multiple Arabidopsis tissues. Each line represents a gene; the gradient of color was obtained after scaling of the log2 fold changes and after batch correction of the expression data. The genes are grouped applying a hierarchical clustering on the Pearson correlation values as shown by the hierarchical tree on the left.
Meiotic Gene Network
To identify new candidate genes with a meiotic function, we generated a gene expression network based on the genes known to be involved in meiosis (Supplementary Table 8). By selecting the first neighbors of the known meiotic genes, we found 1,503 genes with a total of 7,607 connections (Figure 9 and Supplementary Table 11). The network is characterized by a very large cluster, thereby suggesting that the known meiotic genes and their neighbors are all highly connected as also indicated by an average degree of 4.95 connections. The most connected genes with 435 and 323 connections have a documented role in meiosis. In particular, FIDGETIN-LIKE-1 INTERACTING PROTEIN (FLIP, AT1G04650) forms a protein complex with FIDGETIN-LIKE-1 (FIGL1) that is conserved from Arabidopsis to human, and it regulates meiotic crossover formation via RAD51 and DMC1 (Fernandes et al., 2018). The other gene, AXR1 (AT1G05180), is involved in the neddylation/rubylation protein modification pathway and TE methylation in meiocytes (Jahns et al., 2014; Christophorou et al., 2020). AXR1 plays a significant role in DNA repair (Martinez-Garcia et al., 2020). Collectively, this finding reinforces the reliability of the analysis performed in this study. New candidates which could play a role in meiosis are two transcription factors (TFs), AT1G06070 and AT1G02220, with 64 and 30 connections, respectively. These two genes belong to the bZIP and NAC TF families, and their function in meiosis has not been documented. Although with less connections than the genes reported above, AT1G04200, described as Dymeclin (DYM, Dyggve–Melchior–Clausen syndrome protein), is an interesting candidate for a possible meiotic function. Indeed, the mouse DYM homolog has a high expression in testis (Yue et al., 2014) and has a proved interaction with FANCD2, a component of the Fanconi anemia DNA repair pathway (Zhang et al., 2017).
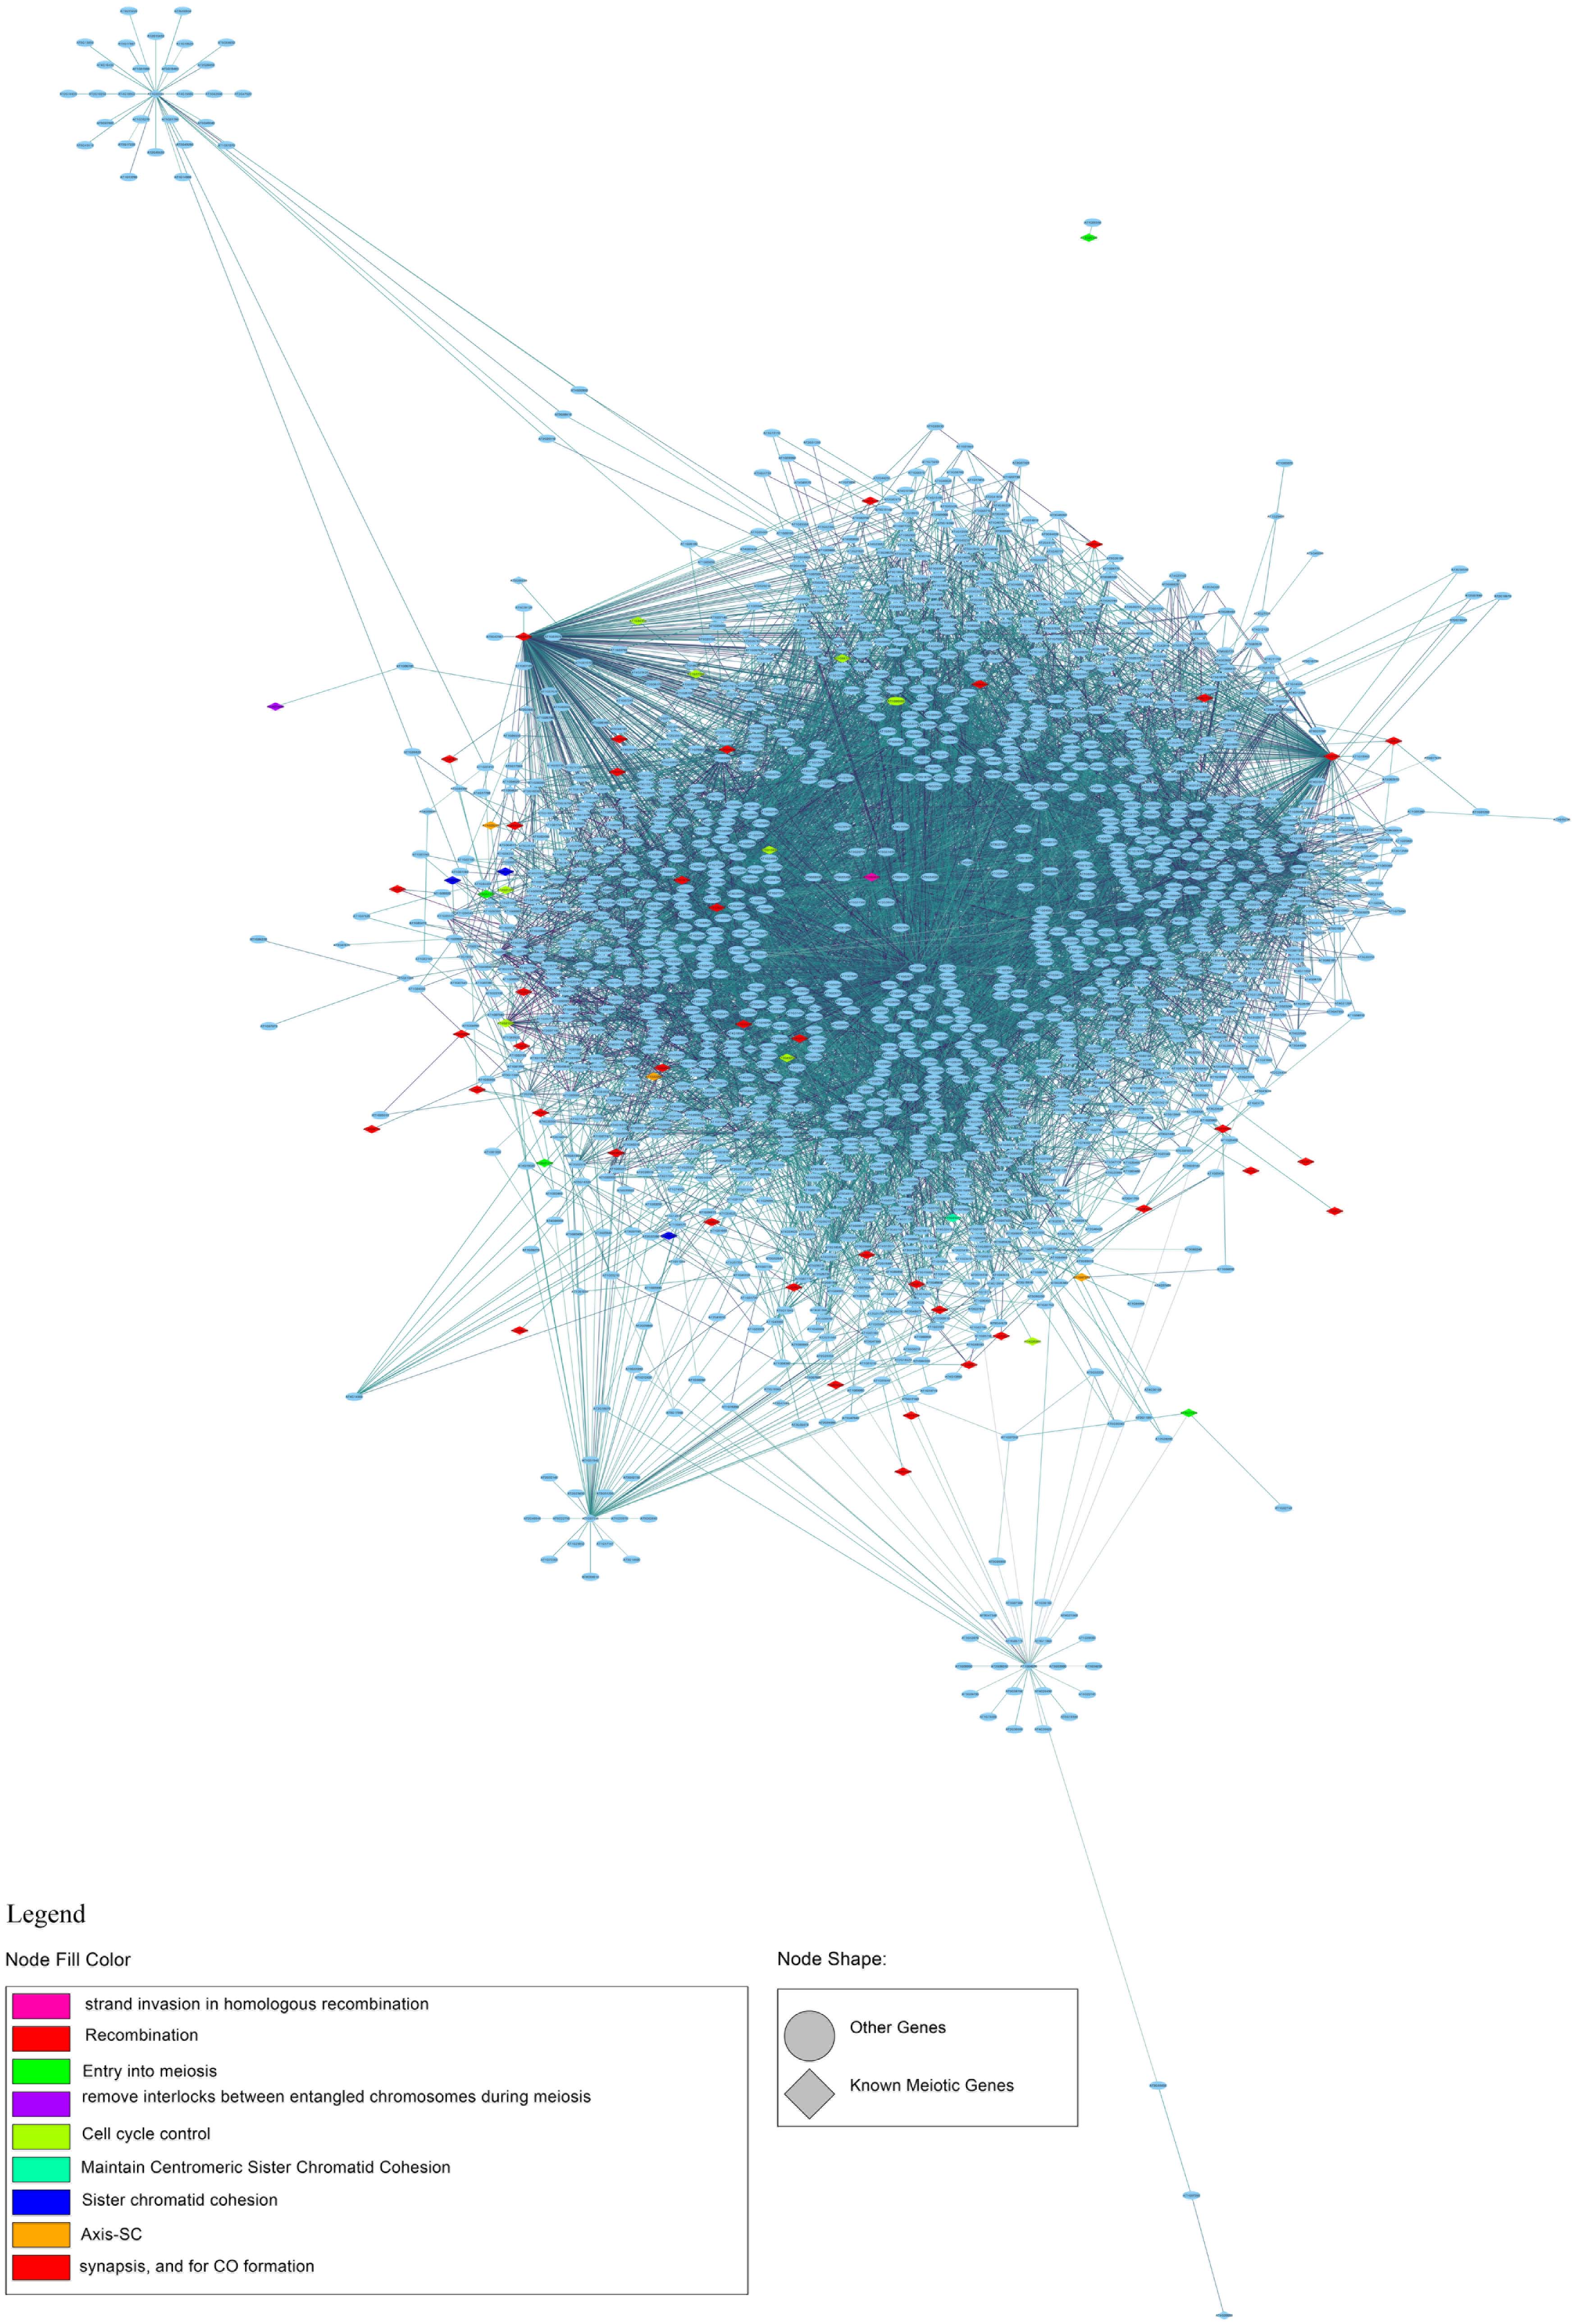
Figure 9. First-neighbor meiotic gene network of co-expression. The legend shows the node fill colors associated with a different meiotic function and the node shape: rhomboidal shape for known meiotic gene and ellipsoidal shape for other genes.
A GO analysis performed using the genes identified by the network analysis revealed GO targets associated with meiotic processes and, particularly, to Meiosis I such as recombination, synapsis, chiasma assembly, and meiotic chromosome segregation (Figure 10 and Supplementary Table 12).
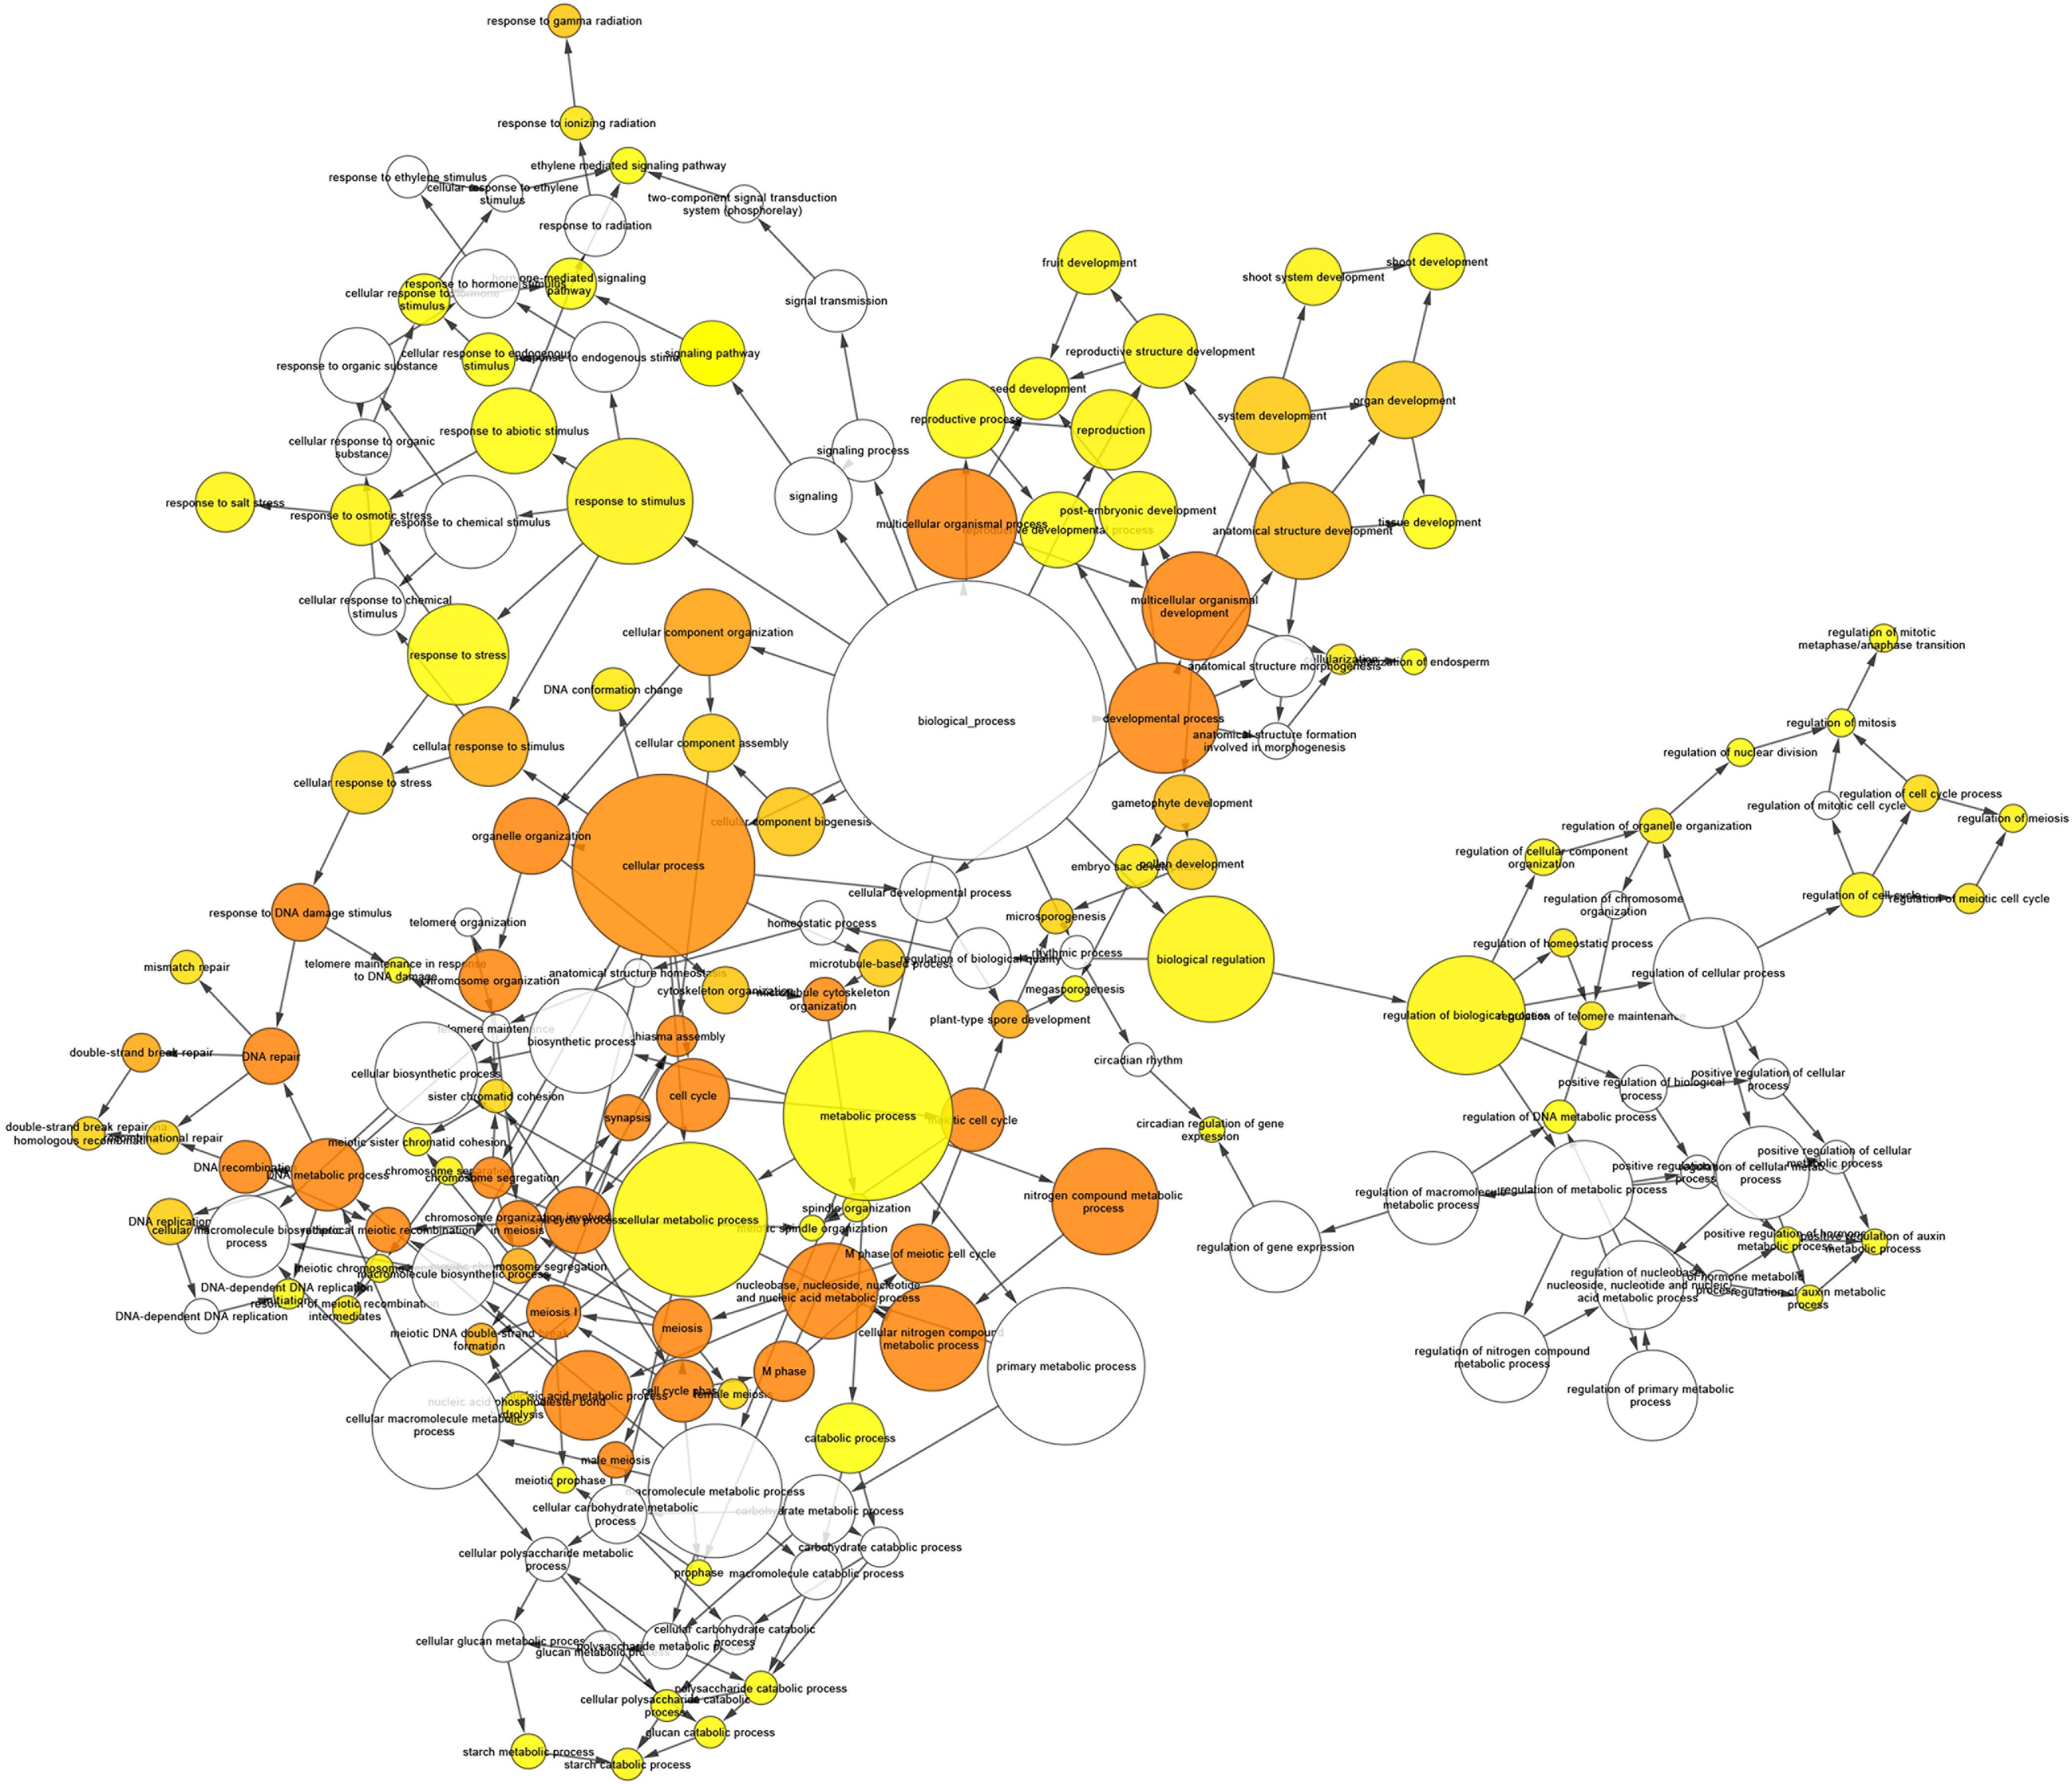
Figure 10. Gene ontology (GO) Enrichment Network of the first neighbors of known meiotic genes obtained by Cytoscape’s BinGO. Each node represents a GO category. The size of the node is proportional to the number of genes in the corresponding GO category. The color of the nodes from yellow to orange is associated with increasing level of significance in the enrichment while white nodes mean no significance.
Discussion
In this work, we reported the application of the INTACT method in meiocyte isolation in A. thaliana. INTACT entails the use of a transgene that can be driven by spatially and/or temporally regulated promoters enabling the isolation of nuclei from specific cell types (Deal and Henikoff, 2010). In our experiment, because of a limited number of effective meiotically active promoters available, we employed the established AtDMC1 promoter widely used in meiotic studies (Li et al., 2012). AtDMC1 is a recombinase involved in Double Strand Break (DSB) repair and expressed during early prophase I in both male and female meiotic cells in anthers and carpels, respectively (Klimyuk and Jones, 1997; De Muyt et al., 2009). However, AtDMC1 activity is not restricted only to meiotic cells. Indeed, AtDMC1 has been observed in embryonic cell culture (Doutriaux et al., 1998) and in young seedlings (Orel et al., 2003). On the other hand, AtDMC1 was not expressed in the meiocyte’s neighboring somatic cells (Klimyuk and Jones, 1997; Li et al., 2012). Our analysis has been restricted to male meiocytes collected from floral buds at a stage corresponding to microsporogenesis (Smyth et al., 1990). However, it cannot be excluded that female meiocytes also occur in our sample.
Isolation of nuclei tagged in specific cell types allowed us to obtain a nuclear meiotic transcriptome from meiocytes of A. thaliana based on RNA-seq data. On average, we detected the expression of about 25,000 genes corresponding to 76% of total genes. Similarly, approximately 22,000 and 24,000 genes were found to be expressed in Arabidopsis male meiocytes isolated in previous studies based on RNA-seq (Chen et al., 2010; Yang et al., 2011). Consistently, 60% or more of all genes in the genome were estimated to be expressed in rice and Arabidopsis male meiocytes (Schmidt et al., 2012). In Arabidopsis, the male meiotic transcriptome shows the largest overlap (approximately 67%) with tissues having cells in active division, including floral buds, anthers, and shoot apex (Yang et al., 2011). The number of reads in our RNA-seq experiment, and particularly the number of uniquely mapped reads, was higher in our study compared to that previously published (56 vs. 33%) (Yang et al., 2011). In addition, we applied a specific algorithm (Kallisto) to multiple mapping reads (17% on average), thereby quantifying the expression of the genes more precisely. In our experiment, we observed an unexpected proportion of unmapped reads (23% on average) that was likely caused by the library preparation kit for RNA-seq using low-quantity input RNA. Indeed, a performance evaluation study of five methods evidenced that Ovation RNA-seq System V2 from NuGEN (the kit used in our study) generated fewer raw/mapped reads (Song et al., 2018).
Importantly, a distinct feature of our dataset compared to those reported in previous studies (Chen et al., 2010; Yang et al., 2011) is that INTACT provides RNAs occurring within the nucleoplasm. A strong correlation between nuclear RNA and total mRNA was reported in Arabidopsis embryo and endosperm (Palovaara et al., 2017; Del Toro-De León and Köhler, 2019). However, in our study, the comparison with total mRNAs from previous RNA-seq experiments in male meiocytes (Chen et al., 2010; Yang et al., 2011) was prevented due to the unavailability of latter datasets.
Meiosis involves two rounds of cell divisions and the nuclear envelope (NE) undergoes breakdown (NEBD) and reformation twice (Pradillo et al., 2019). In particular, the NEBD occurs at late prophases I and II. Since INTACT requires a NTF transgene which carries a domain for NE localization (Deal and Henikoff, 2010), INTACT does not operate during NEBD. On the other hand, the expression pattern and immunolocalization of AtDMC1 (Klimyuk and Jones, 1997; De Muyt et al., 2009) point out a potential early prophase I-specificity of AtDMC1. For these reasons, we expected the isolated meiocytes to provide a subset of meiotic genes enriched in processes related to early prophase I substages. Apparently, however, the high number of transcripts and the fact that genes involved in later meiotic stages are expressed in our dataset seem to not support our expectations. For instance, the AtPS1 (Parallel Spindle 1, AT1G34355) involved in the orientation of the spindles in Meiosis II (d’Erfurth et al., 2008) was present in the mid-high expression class in our dataset. This finding can be justified by different explanations. First, AtDMC1 could be expressed in other meiotic stages besides prophase I. Second, timing of the gene expression is not strictly associated with timing of the encoded protein function, as evidenced in maize prophase I (Nelms and Walbot, 2019). Finally, the transcriptional basis relevant for meiosis is already set up before its onset, as reported in rice and maize (Tang et al., 2010; Yuan et al., 2018). In the future, other prophase I-expressed genes could be used to build more INTACT lines. For this purpose, we suggest as candidates some meiosis-specific genes with established roles in prophase I identified in mid/high- and high-expression classes of our dataset (Supplementary Table 13). These genes exhibit a very low expression in the other tissues (leaf, root, meristem, flower bud, pollen, tapetum, and silique). In addition, they appear to be expressed also in maize at early prophase I as evidenced by the single-cell RNA-seq experiment (Nelms and Walbot, 2019).
The question whether all genes in meiotic transcriptome are essential for meiosis or whether the large number of transcripts is the result of a global de-repression of chromatin during meiosis remains to be answered (Lambing and Heckmann, 2018). Our study evidenced the prevalence of the biological process “DNA demethylation” when we considered the mid/highly expressed genes. Consistently, the upregulation of transposons (TEs) has been reported to be a prominent feature in Arabidopsis male meiocytes (Chen et al., 2010; Yang et al., 2011), and it supports the suggestion that DNA methylation decreases at meiosis onset (Kawashima and Berger, 2014). Methylome analysis showed that meiocytes have higher CG and CHG methylation but lower CHH methylation in comparison to somatic tissues (Walker et al., 2018). Therefore, it is likely that DNA demethylation engages the CHH context which, on the other hand, is interconnected with TEs. This view is reinforced by the methylome analysis of meiocytes in axr1 mutant (Christophorou et al., 2020). Indeed, this mutation, which affects general DNA methylation in plants, showed a specific increase in meiocytes for CHH methylation in TEs. Remarkably, gene expression network analysis performed in our work identified AXR1 as a relevant hub thereby confirming its important roles in meiosis (Jahns et al., 2014; Christophorou et al., 2020; Martinez-Garcia et al., 2020). Furthermore, DNA demethylation could have a profound influence on gene expression through TEs (Wang and Baulcombe, 2020). TEs can act in cis to affect expression of adjacent genes as observed in male meiocytes by Yang et al. (2011). Finally, our co-expression network revealed different gene modules related to meiosis as well as novel candidate genes with a potential meiotic role. The functional analysis of the candidate meiotic genes will contribute to our understanding of meiosis.
Data Availability Statement
Raw sequencing data obtained by the INTACT experiment was deposited in the Sequence Read Archive (SRA) database of NCBI within the BioProject PRJNA668331.
Author Contributions
LB and PT performed the experiments. PT designed the main experiments. RAC performed the bioinformatics analysis. GC performed the cytological analysis. RP and CL assisted with the experiments. PT, RAC, and GC contributed to the manuscript editing. CC conceived the study and wrote the grant. CC, LB, and FC wrote the manuscript. All authors contributed to the article and approved the submitted version.
Funding
This work was funded by the Epigenomics Flagship Project (EPIGEN) from the Italian Ministry of University and Research (MUR) and the National Research Council of Italy (CNR).
Conflict of Interest
RAC was employed by company Sequentia Biotech SL.
The remaining authors declare that the research was conducted in the absence of any commercial or financial relationships that could be construed as a potential conflict of interest.
Acknowledgments
The authors thank M. Rankenburg for proofreading and R. Nocerino for technical assistance in plant growth condition control.
Supplementary Material
The Supplementary Material for this article can be found online at: https://www.frontiersin.org/articles/10.3389/fpls.2021.638051/full#supplementary-material
Footnotes
- ^ https://www.qiagen.com/
- ^ https://gateway.psb.ugent.be/search
- ^ appliedgenomics.org
- ^ https://www.bioinformatics.babraham.ac.uk/projects/fastqc/
References
Agrawal, P., Chung, P., Heberlein, U., and Kent, C. (2019). Enabling cell-type-specific behavioral epigenetics in Drosophila: a modified high-yield INTACT method reveals the impact of social environment on the epigenetic landscape in dopaminergic neurons. BMC Biol. 17:30. doi: 10.1186/s12915-019-0646-4
Amin, N. M., Greco, T. M., Kuchenbrod, L. M., Rigney, M. M., Wallingford, J. B., et al. (2014). Proteomic profiling of cardiac tissue by isolation of nuclei tagged in specific cell types (INTACT). Development 141, 962–973. doi: 10.1242/dev.098327
An, Y.-Q., McDowell, J. M., Huang, S., McKinney, E. C., Chambliss, S., and Meagher, R. B. (1996). Strong, constitutive expression of the Arabidopsis ACT2/ACT8 actin subclass in vegetative tissues. Plant J. 10, 107–121. doi: 10.1046/j.1365-313x.1996.10010107.x
Barakate, A., Orr, J., Schreiber, M., Colas, I., Lewandowska, D., McCallum, N., et al. (2020). Time-resolved transcriptome of barley anthers and meiocytes reveals robust and largely stable gene expression changes at meiosis entry. bioRxiv [preprint] doi: 10.1101/2020.04.20.051425
Barra, L., Aiese-Cigliano, R., Cremona, G., De Luca, P., Zoppoli, P., Bressan, R. A., et al. (2012). Transcription profiling of laser microdissected microsporocytes in an Arabidopsis mutant (Atmcc1) with enhanced histone acetylation. J. Plant Biol. 55, 281–289. doi: 10.1007/s12374-011-0268-z
Beckett, D., Kovaleva, E., and Schatz, P. J. (1999). A minimal peptide substrate in biotin holoenzyme synthetase-catalyzed biotinylation. Protein Sci. 8, 921–929. doi: 10.1110/ps.8.4.921
Bushnell, B., Rood, J., and Singer, E. (2017). BBMerge – Accurate paired shotgun read merging via overlap. PLoS One 12:e0185056. doi: 10.1371/journal.pone.0185056
Chen, C., Farmer, A., Langley, R., Mudge, J., Crow, J., May, G., et al. (2010). Meiosis-specific gene discovery in plants: RNA-Seq applied to isolated Arabidopsis male meiocytes. BMC Plant Biol. 10:280. doi: 10.1186/1471-2229-10-280
Cheng, C. Y., Krishnakumar, V., Chan, A. P., Thibaud-Nissen, F., Schobel, S., and Town, C. D. (2016). Araport11: a complete reannotation of the Arabidopsis thaliana reference genome. Plant J. 89, 789–804. doi: 10.1111/tpj.13415
Christophorou, N., She, W., Long, J., Hurel, A., Beaubiat, S., Idir, Y., et al. (2020). AXR1 affects DNA methylation independently of its role in regulating meiotic crossover localization. PLoS Genet. 16:e1008894. doi: 10.1371/journal.pgen.1008894
Clough, S. J., and Bent, A. F. (1998). Floral dip: a simplified method for agrobacterium-mediated transformation of Arabidopsis thaliana. Plant J. 16, 735–743. doi: 10.1046/j.1365-313x.1998.00343.x
De Muyt, A., Pereira, L., Vezon, D., Chelysheva, L., Gendrot, G., Chambon, A., et al. (2009). A high throughput genetic screen identifies new early meiotic recombination functions in Arabidopsis thaliana. PLoS Genet. 5:e1000654. doi: 10.1371/journal.pgen.1000654
De Storme, N., and Geelen, D. (2014). The impact of environmental stress on male reproductive development in plants: biological processes and molecular mechanisms. Plant Cell Environ. 37, 1–18. doi: 10.1111/pce.12142
Deal, R. B., and Henikoff, S. (2010). A simple method for gene expression and chromatin profiling of individual cell types within a tissue. Dev. Cell 18, 1030–1040. doi: 10.1016/j.devcel.2010.05.013
Deal, R. B., and Henikoff, S. (2011). The INTACT method for cell type-specific gene expression and chromatin profiling in Arabidopsis thaliana. Nat. Protoc. 6, 56–68. doi: 10.1038/nprot.2010.175
Del Toro-De León, G., and Köhler, C. (2019). Endosperm-specific transcriptome analysis by applying the INTACT system. Plant Reprod. 32, 55–61. doi: 10.1007/s00497-018-00356-3
d’Erfurth, I., Jolivet, S., Froger, N., Catrice, O., Novatchkova, M., Simon, M., et al. (2008). Mutations in AtPS1 (Arabidopsis thaliana parallel spindle 1) lead to the production of diploid pollen grains. PLoS Genet. 4:e1000274. doi: 10.1371/journal.pgen.1000274
Doutriaux, M. P., Couteau, F., Bergounioux, C., and White, C. (1998). Isolation and characterisation of the RAD51 and DMC1 homologs from Arabidopsis thaliana. Mol. General Genet. 257, 283–291. doi: 10.1007/s004380050649
Dubowic-Shulze, S., and Chen, C. (2014). The meiotic transcriptome architecture of plants. Front. Plant Sci. 5:220. doi: 10.3389/fpls.2014.00220
Fernandes, J. B., Duhamel, M., Seguéla-Arnaud, M., Froger, N., Girard, C., Choinard, S., et al. (2018). FIGL1 and its novel partner FLIP form a conserved complex that regulates homologous recombination. PLoS Genet. 14:e1007317. doi: 10.1371/journal.pgen.1007317
Jahns, M. T., Vezon, D., Chambon, A., Pereira, L., Falque, M., Martin, O. C., et al. (2014). Crossover localisation is regulated by the neddylation posttranslational regulatory pathway. PLoS Biol. 12:e1001930. doi: 10.1371/journal.pbio.1001930
Kawashima, T., and Berger, F. (2014). Epigenetic reprogramming in plant sexual reproduction. Nat. Rev. Genet. 15, 613–624. doi: 10.1038/nrg3685
Klimyuk, V. I., and Jones, J. D. (1997). AtDMC1, the Arabidopsis homologue of the yeast DMC1 gene: characterization, transposon-induced allelic variation and meiosis-associated expression. Plant J. 11, 1–14. doi: 10.1046/j.1365-313x.1997.11010001.x
Lambing, C., and Heckmann, S. (2018). Tackling plant meiosis: from model research to crop improvement. Front. Plant Sci. 9:829. doi: 10.3389/fpls.2018.00829
Li, D.-D., Xue, J.-S., Zhu, J., and Yang, Z.-N. (2017). Gene regulatory network for tapetum development in Arabidopsis thaliana. Front. Plant Sci. 8:1559. doi: 10.3389/fpls.2017.01559
Li, J., Farmer, A. D., Lindquist, I. E., Dukowic-Schulze, S., Mudge, J., Li, T., et al. (2012). Characterization of a set of novel meiotically-active promoters in Arabidopsis. BMC Plant Biol. 12:104. doi: 10.1186/1471-2229-12-104
Libeau, P., Durandet, M., Granier, F., Marquis, C., Berthome, R., Renou, J. P., et al. (2011). Gene expression profiling of Arabidopsis meiocytes. Plant Biol. 13, 784–793. doi: 10.1111/j.1438-8677.2010.00435.x
Loraine, A. E., McCormick, S., Estrada, A., Patel, K., and Qin, P. (2013). RNA-seq of Arabidopsis pollen uncovers novel transcription and alternative splicing. Plant Physiol. 162, 1092–1109. doi: 10.1104/pp.112.211441
Martinez-Garcia, M., Fernández-Jiménez, N., Santos, J. L., and Pradillo, M. (2020). Duplication and divergence: new insights into AXR1 and AXL functions in DNA repair and meiosis. Sci. Rep. 10:8860. doi: 10.1038/s41598-020-65734-2
Mercier, R., Mézard, C., Jenczewski, E., Macaisne, N., and Grelon, M. (2015). The molecular biology of meiosis in plants. Annu. Rev. Plant Biol. 66, 297–327. doi: 10.1146/annurev-arplant-050213-035923
Metsalu, T., and Vilo, J. (2015). ClustVis: a web tool for visualizing clustering of multivariate data using principal component analysis and heatmap. Nucleic Acids Res. 43, W566–W570. doi: 10.1093/nar/gkv468
Murashige, T., and Skoog, F. (1962). A revised medium for rapid growth and bio-assays with tobacco tissue cultures. Physiol. Plantarum 15, 473–497. doi: 10.1111/j.1399-3054.1962.tb08052.x
Nelms, B., and Walbot, V. (2019). Defining the developmental program leading to meiosis in maize. Science 364, 52–56. doi: 10.1126/science.aav6428
Okonechnikov, K., Conesa, A., and García-Alcalde, F. (2016). Qualimap 2: advanced multi-sample quality control for high-throughput sequencing data. Bioinformatics 32, 292–294. doi: 10.1093/bioinformatics/btv566
Orel, N., Kyryk, A., and Puchta, H. (2003). Different pathways of homologous recombination are used for the repair of double-strand breaks within tandemly arranged sequences in the plant genome. Plant J. 35, 604–612. doi: 10.1046/j.1365-313X.2003.01832.x
Palovaara, J., Saiga, S., Wendrich, J. R., Wout Hofland, N., Schayck, J. P., Hater, F., et al. (2017). Transcriptome dynamics revealed by a gene expression atlas of the early Arabidopsis embryo. Nat. Plants 3, 894–904. doi: 10.1038/s41477-017-0035-3
Parry, M., Rosenzweig, C., Iglesias, A., Fischer, G., and Livermore, M. (1999). Climate change and world food security: a new assessment. Global Environ. Chang. 9, S51–S67. doi: 10.1016/S0959-3780(99)00018-7
Pradillo, M., Evans, D., and Graumann, K. (2019). The nuclear envelope in higher plant mitosis and meiosis. Nucleus 10, 55–66. doi: 10.1080/19491034.2019.1587277
Reynoso, M. A., Pauluzzi, G. C., Kajala, K., Cabanlit, S., Velasco, J., Bazin, J., et al. (2018). Nuclear transcriptomes at high resolution using retooled INTACT. Plant Physiol. 176, 270–281. doi: 10.1104/pp.17.00688
Rose, A., and Meier, I. (2001). A domain unique to plant RanGAP is responsible for its targeting to the plant nuclear rim. Proc. Natl. Acad. Sci. U S A. 26, 15377–15382. doi: 10.1073/pnas.261459698
Sales, G., and Romualdi, C. (2011). Parmigene—a parallel R package for mutual information estimation and gene network reconstruction. Bioinformatics 13, 1876–1877. doi: 10.1093/bioinformatics/btr274
Schmidt, A., Schmid, M. W., and Grossniklaus, U. (2012). Analysis of plant germline development by high-throughput RNA profiling: technical advances and new insights. Plant J. 70, 18–29. doi: 10.1111/j.1365-313X.2012.04897
Schmidt, A., Wuest, S. E., Vijverberg, K., Baroux, C., Kleen, D., and Grossniklaus, U. (2011). Transcriptome analysis of the Arabidopsis megaspore mother cell uncovers the importance of RNA helicases for plant germline development. PLoS Biol. 9:e1001155. doi: 10.1371/journal.pbio.1001155
Schneitz, K., Hulskamp, M., and Pruitt, R. E. (1995). Wild type ovule development in Arabidopsis thaliana - a light microscope study of cleared whole mount tissue. Plant J. 7, 731–749. doi: 10.1046/j.1365-313X.1995.07050731.x
Si, W., Yuan, Y., Huang, J., Zhang, X., Zhang, Y., Zhang, Y., et al. (2015). Widely distributed hot and cold spots in meiotic recombination as shown by the sequencing of rice F2 plants. New Phytol. 206, 1491–1502. doi: 10.1111/nph.13319
Smyth, D. R., Bowman, J. L., and Meyerowitz, E. M. (1990). Early flower development in Arabidopsis. Plant Cell 8, 755–767. doi: 10.1105/tpc.2.8.755
Soneson, C., Love, M. I., and Robinson, M. D. (2016). Differential analyses for RNA-seq: transcript-level estimates improve gene-level inferences. F1000 Research 4, 1521–1531. doi: 10.12688/f1000research.7563.2
Song, Y., Milon, B., Ott, S., Zhao, X., Sadzewicz, L., Shetty, A., et al. (2018). A comparative analysis of library prep approaches for sequencing low input translatome samples. BMC Genomics 19:696. doi: 10.1186/s12864-018-5066-2
Tang, X., Zhang, Z. Y., Zhang, W. J., Zhao, X. M., Li, X., Zhang, D., et al. (2010). Global gene profiling of laser-captured pollen mother cells indicates molecular pathways and gene subfamilies involved in rice meiosis. Plant Physiol. 154, 1855–1870. doi: 10.1104/pp.110.161661
Tarazona, S., Furió-Tarí, P., Turrà, D., Di Pietro, A., Nueda, M. J., Ferrer, A., et al. (2015). Data quality aware analysis of differential expression in RNA-seq with NOISeq R/Bioc package. Nucleic Acids Res. 43:e140. doi: 10.1093/nar/gkv711
Tian, T., Liu, Y., Yan, H., You, Q., Yi, X., Du, Z., et al. (2017). AgriGO v2.0: a GO analysis toolkit for the agricultural community, 2017 update. Nucleic Acids Res. 45, W122–W129. doi: 10.1093/nar/gkx382
Walker, J., Gao, H., Zhang, J., Aldridge, B., Vickers, M., Higgins, J. D., et al. (2018). Sexual-lineage-specific DNA methylation regulates meiosis in Arabidopsis. Nat. Genet. 50, 130–137. doi: 10.1038/s41588-017-0008-5
Wang, D., and Deal, R. B. (2015). Epigenome profiling of specific plant cell types using a streamlined INTACT protocol and ChIP-seq. Methods Mol. Biol. 1284, 3–25. doi: 10.1007/978-1-4939-2444-8_1
Wang, Z., and Baulcombe, D. C. (2020). Transposon age and non-CG methylation. Nat. Commun. 11, 1221–1229. doi: 10.1038/s41467-020-14995-6
Yang, H., Pingli, Lu, P., Wang, Y., and Ma, H. (2011). The transcriptome landscape of Arabidopsis male meiocytes from high-throughput sequencing: the complexity and evolution of the meiotic process. Plant J. 65, 503–516. doi: 10.1111/j.1365-313X.2010.04439.x
Yuan, T. L., Huang, W. J., He, J., Zhang, D., and Tang, W. H. (2018). Stage-Specific gene profiling of germinal cells helps delineate the mitosis/meiosis transition. Plant Physiol. 176, 1610–1626. doi: 10.1104/pp.17.01483
Yue, F., Cheng, Y., Breschi, A., Vierstra, J., Wu, W., Ryba, T., et al. (2014). A comparative encyclopedia of DNA elements in the mouse genome. Nature 515, 355–364. doi: 10.1038/nature13992
Keywords: meiosis, meiocyte, tagged nuclei, RNA-seq, meiotic transcriptome
Citation: Barra L, Termolino P, Aiese Cigliano R, Cremona G, Paparo R, Lanzillo C, Consiglio MF and Conicella C (2021) Meiocyte Isolation by INTACT and Meiotic Transcriptome Analysis in Arabidopsis. Front. Plant Sci. 12:638051. doi: 10.3389/fpls.2021.638051
Received: 04 December 2020; Accepted: 01 February 2021;
Published: 04 March 2021.
Edited by:
Olivier Da Ines, Université Clermont Auvergne, FranceReviewed by:
Wei-Hua Tang, Shanghai Institutes for Biological Sciences (CAS), ChinaJosh T. Cuperus, University of Washington, United States
Copyright © 2021 Barra, Termolino, Aiese Cigliano, Cremona, Paparo, Lanzillo, Consiglio and Conicella. This is an open-access article distributed under the terms of the Creative Commons Attribution License (CC BY). The use, distribution or reproduction in other forums is permitted, provided the original author(s) and the copyright owner(s) are credited and that the original publication in this journal is cited, in accordance with accepted academic practice. No use, distribution or reproduction is permitted which does not comply with these terms.
*Correspondence: Clara Conicella, Y29uaWNlbGxAdW5pbmEuaXQ=
†These authors have contributed equally to this work and share first authorship
 Lucia Barra
 Pasquale Termolino
 Riccardo Aiese Cigliano
 Gaetana Cremona
 Rosa Paparo
 Carmine Lanzillo
 Maria Federica Consiglio
 Clara Conicella