 Kaihui Zhao
 Lianqiang Li1†
 Junbo Yang
 Zhihua Liao
94% of researchers rate our articles as excellent or good
Learn more about the work of our research integrity team to safeguard the quality of each article we publish.
Find out more
ORIGINAL RESEARCH article
Front. Plant Sci. , 13 January 2021
Sec. Plant Systematics and Evolution
Volume 11 - 2020 | https://doi.org/10.3389/fpls.2020.605793
Zanthoxylum L. is an economic crop with a long history of cultivation and domestication and has important economic, ecological, and medicinal value. To solve the classification problems caused by the similar morphological characteristics of Zanthoxylum and establish a credible phylogenetic relationship, we sequenced and annotated six Zanthoxylum chloroplast (cp) genomes (Z. piasezkii, Z. armatum, Z. motuoense, Z. oxyphyllum, Z. multijugum, and Z. calcicola) and combined them with previously published genomes for the Zanthoxylum species. We used bioinformatics methods to analyze the genomic characteristics, contraction, and expansion of inverted repeat (IR) regions; differences in simple sequence repeats (SSRs) and long repeat sequences; species pairwise Ka/Ks ratios; divergence hotspots; and phylogenetic relationships of the 14 Zanthoxylum species. The results revealed that cp genomes of Zanthoxylum range in size from 158,071 to 158,963 bp and contain 87 protein-coding, 37 tRNA, and 8 rRNA genes. Seven mutational hotspots were identified as candidate DNA barcode sequences to distinguish Zanthoxylum species. The phylogenetic analysis strongly supported the genus Fagara as a subgenus of Zanthoxylum and proposed the possibility of a new subgenus in Zanthoxylum. The availability of these genomes will provide valuable information for identifying species, molecular breeding, and evolutionary analysis of Zanthoxylum.
Zanthoxylum L. belongs to the Rutoideae subfamily of the Rutaceae family. Zanthoxylum is widely distributed in tropical and subtropical regions and consists of approximately 250 species (Huang, 1997). Owing to its important economic and medicinal value, Zanthoxylum has a long history of cultivation and domestication in Asia. The Chinese pharmacopeia (2015 Edition) records that the dried and mature peel of Zanthoxylum schinifolium Sieb. et Zucc. and Zanthoxylum bungeanum Maxim. have the effects of warming the middle-jiao to alleviate pain, destroying parasites, and relieving itching, and can be used to treat cold pain of the gastric cavity and abdomen, vomiting and diarrhea, and abdominal pain due to parasitic infestation. The pericarp of Z. armatum, Z. bungeanum, and other Zanthoxylum species has a strong fragrance and is one of the traditional Chinese “eight major condiments.” In addition, owing to its economic potential, Zanthoxylum has been planted to restore farmland to forests and has high ecological value for soil and fertilizer preservation (Hu et al., 2012).
Due to the high medicinal and culinary value of the Zanthoxylum genus plants, there are some phenomena of homonym, heteronym, or defective products that are substituted for the qualified ones in the market (Shen et al., 2004). The traditional classification and identification of Zanthoxylum relied on its morphological characteristics, such as leaf morphology, fruit color, fruit maturity, leaf gland points, and leaf thorns (Tu et al., 2001), however, the morphological characteristics are easily affected by the growth environment. Also, many Zanthoxylum plants are similar in morphology and difficult to identify, which restricts the progress and development of the Zanthoxylum industry. Furthermore, inappropriate selection of cultivars in agricultural production of Zanthoxylum may cause economic losses to farmers (Feng et al., 2017). Chaotic use of Zanthoxylum medicinal materials also directly affects the safety and efficacy of clinical medications. Therefore, reliable and distinguishable genetic markers are urgently needed for the healthy development of the Zanthoxylum industry. Although Zanthoxylum is widely distributed in China, the systematic breeding of Zanthoxylum varieties has not been carried out on a large scale. The classification and naming of the existing Zanthoxylum varieties are based on historical, customary names inherited by the local people and lack an authoritative and unified naming.
To solve the problem of Zanthoxylum species identification, Li et al., developed simple sequence repeats (SSRs) markers for the chloroplast (cp) genome of Z. bungeanum. Li et al. (2019) showed that SRs can be used for genetic diversity analysis among different Zanthoxylum species and used cpSSRs to distinguish between Z. bungeanum, Z. armatum, and Z. piperitum. Feng et al. (2017) developed SSR markers to identify Z. bungeanum based on transcriptome data. Wang et al. (2016) used the internal transcribed spacer 2 (ITS2) to identify Zanthoxylum plants and found that ITS2 could not completely distinguish all of the Zanthoxylum species they selected. However, using the combined barcode of ITS2 and psbA-trnH derived from the cp genome, five species of Zanthoxylum were distinguished (Wang et al., 2016). This result is consistent with the results of Xin-Ye et al. (2014). The research on molecular markers of Zanthoxylum is confined to a few species in some regions only. We are committed to annotating further Zanthoxylum complete cp genomes to compare variation and discover additional molecular markers that are applicable to a wider range of Zanthoxylum for identification and breeding. The cp genome is characterized by a typical quadripartite structure that contains a pair of inverted repeat (IR) regions separated by a large single-copy (LSC) and a small single-copy (SSC) region (Bendich, 2004). A full cp genome is a valuable resource of information for studying plant taxonomy, phylogenetic reconstruction, and historical biogeographic inference (Liu et al., 2018). The plant cp genome, a research hotspot for screening DNA barcoding sequences, can also be used as a super-barcode for phylogenetic and species identification studies (Jansen et al., 2007). The use of cp genomes to solve the problem of classification of related species is of enormous significance for species identification of herbal medicine and the entire plant community.
In this study, we sequenced and assembled six Zanthoxylum whole cp genomes and combined this data with eight previously published Zanthoxylum cp genomes to perform a comprehensive analysis, including genome features, repeats, selective pressures, divergence hotspots, and phylogenetic relationships. Our goals in this study were to: (1) present the complete cp genome sequence of six new assembled Zanthoxylum species and compare the global structures with another eight previously published Zanthoxylum species; (2) examine variations of long repeat sequence and SSRs in 14 Zanthoxylum cp genomes; (3) identify divergence hotspots as potential genetic markers for DNA barcoding; and (4) reconstruct the phylogeny of Zanthoxylum species using protein-coding sequences of cp genomes and infer their phylogenetic location within Rutaceae.
The plant materials of Z. piasezkii, Z. armatum, Z. motuoense, and Z. oxyphyllum were collected from Nyingchi (Tibet, China); Z. multijugum and Z. calcicola were obtained from Kunming (Yunnan, China). Fresh, healthy leaves were directly dried with silica gel after collection. Total genomic DNA was isolated using a modified CTAB method (Li et al., 2013). The DNA integrity and concentration were measured using agarose gel electrophoresis and a NanoDrop 2000 Spectrophotometer (Thermo Scientific, Carlsbad, CA, United States). Purified DNA was randomly sheared into fragments using physical methods. Paired-end reads (150 bp) were generated on an Illumina HiSeq X 10 System (San Diego, CA, United States). Total genomic DNAs were also sent to BGI (Shenzhen, China) for library (400 bp) preparation for genome skimming sequencing. Paired-end (150 bp) sequencing was conducted on the Illumina HiSeq X-10 platform, generating ∼2 Gb data per sample. Low-quality sequences were filtered by NGS QC Toolkit v2.3.333 (Patel and Jain, 2012) with Q30 (base Phred quality score of ≥ 30) was used to obtain high-quality reads.
We assembled the chloroplast genomes with NOVOPlasty (Dierckxsens et al., 2017) using clean data, with parameters of K-mer (33), and annotated them with GeSeq1 (Tillich et al., 2017), coupled with manually edited start and stop codons in Geneious 11.1.4 software (Kearse et al., 2012). The Z. bungeanum cp genome sequence (NCBI Accession number: NC031386) was used as a reference. The annotation results were checked using DOGMA2 (Wyman et al., 2004) and CpGAVAS (Liu et al., 2012). In addition, all tRNA genes were further verified using tRNAscan-SE v1.21 (Brooks and Lowe, 2005). The boundaries of LSC, SSC, IRa, and IRb were determined through local BLAST software. Finally, the Organellar Genome DRAW tool3 (Lohse et al., 2013) was used to draw the circular gene maps of the Zanthoxylum cp genome.
IR expansion and contraction in the cp genomes of the 14 Zanthoxylum species were detected using IRscope (Amiryousefi et al., 2018). The nucleotide diversity (Pi) of coding and non-coding regions was extracted (Zhang et al., 2020) and then computed with DnaSP (Rozas et al., 2003). The variable, parsimony informative, conserved sites of DNA barcode sequences were identified using DnaSP software (Rozas et al., 2003).
MISA4 was used to identify SSRs in each species with the minimum numbers of repeats set to 8, 5, 3, 3, 3, and 3 for mono-, di-, tri-, tetra-, penta-, and hexanucleotides, respectively (Thiel et al., 2003). The long repetitive sequences containing forward, palindromic, reverse, and complementary repeats were analyzed using the software REPuter5 with a 30 bp minimum repeat size and a Hamming distance of 3 (Kurtz et al., 2001).
We used the KaKs calculator program (Zhang et al., 2006) with the NG model to calculate the rates of non-synonymous substitutions (Ka), synonymous substitutions (Ks), and their ratio (Ka/Ks). When Ks = 0, the value cannot be computed and was represented by ∗. When Ka = 0 and Ks = 0, the value was represented by NaN. The Sapindales species Z. bungeanum (NC031386.1) was used as a reference.
The genome sequences of 20 plastomes of the Rutaceae species were downloaded from the National Center for Biotechnology Information Search database (Supplementary Table 5), and six newly assembled Zanthoxylum cp genomes were used to reconstruct phylogenetic relationships; Xylocarpus rumphii (NC038199.1) was used as the outgroup in the phylogenetic analysis. A total of 76 protein-coding genes (Supplementary Table 6), shared by the cp genomes of 30 Rutaceae species, were selected to construct maximum likelihood (ML) and Bayesian trees. A total of 76 gene sequence alignments were deposited into MAFFT 7.0 (Osaka University, Suita, Japan; Katoh and Standley, 2013) and were adjusted manually where necessary. Phylogenetic trees were constructed using IQ-TREE (Nguyen et al., 2015) and MrBayes 3.2.6 software (Ronquist et al., 2012; Zhang et al., 2020). The Bayesian Inference tree was constructed under the GTRGAMMA model (two parallel runs, 2,000,000 generations), with the initial 25% of sampled data discarded as burn-in. We selected the GTRGAMMA model of nucleotide substitution for ML analysis (Nguyen et al., 2015).
The cp genomes of Z. piasezkii (2.1 Gb), Z. armatum (2.5 Gb), Z. motuoense (1.9 Gb), Z. oxyphyllum (2.3 Gb), Z. multijugum (2.1 Gb), and Z. calcicola (2.2 Gb) were sequenced with approximately 2.0 Gb of paired-end reads, respectively. We obtained the clean reads by removing adaptors and low-quality read pairs. The recovered clean reads for Z. piasezkii, Z. armatum, Z. motuoense, Z. oxyphyllum, Z. multijugum, and Z. calcicola were 1,604,681, 986,037, 804,684, 1,135,946, 1,267,505, and 997,026, respectively (Supplementary Table 1). We obtained complete cp genome maps (Figure 1) of Z. piasezkii, Z. armatum, Z. motuoense, Z. oxyphyllum, Z. multijugum, and Z. calcicola through de novo genome sequencing and assembly with the reference Z. bungeanum (NC031386) genome. The coverage depth of the final assembled chloroplast genome ranged from 104.2X (Z. motuoense) to 322.4X (Z. piasezkii) (Supplementary Table 1).
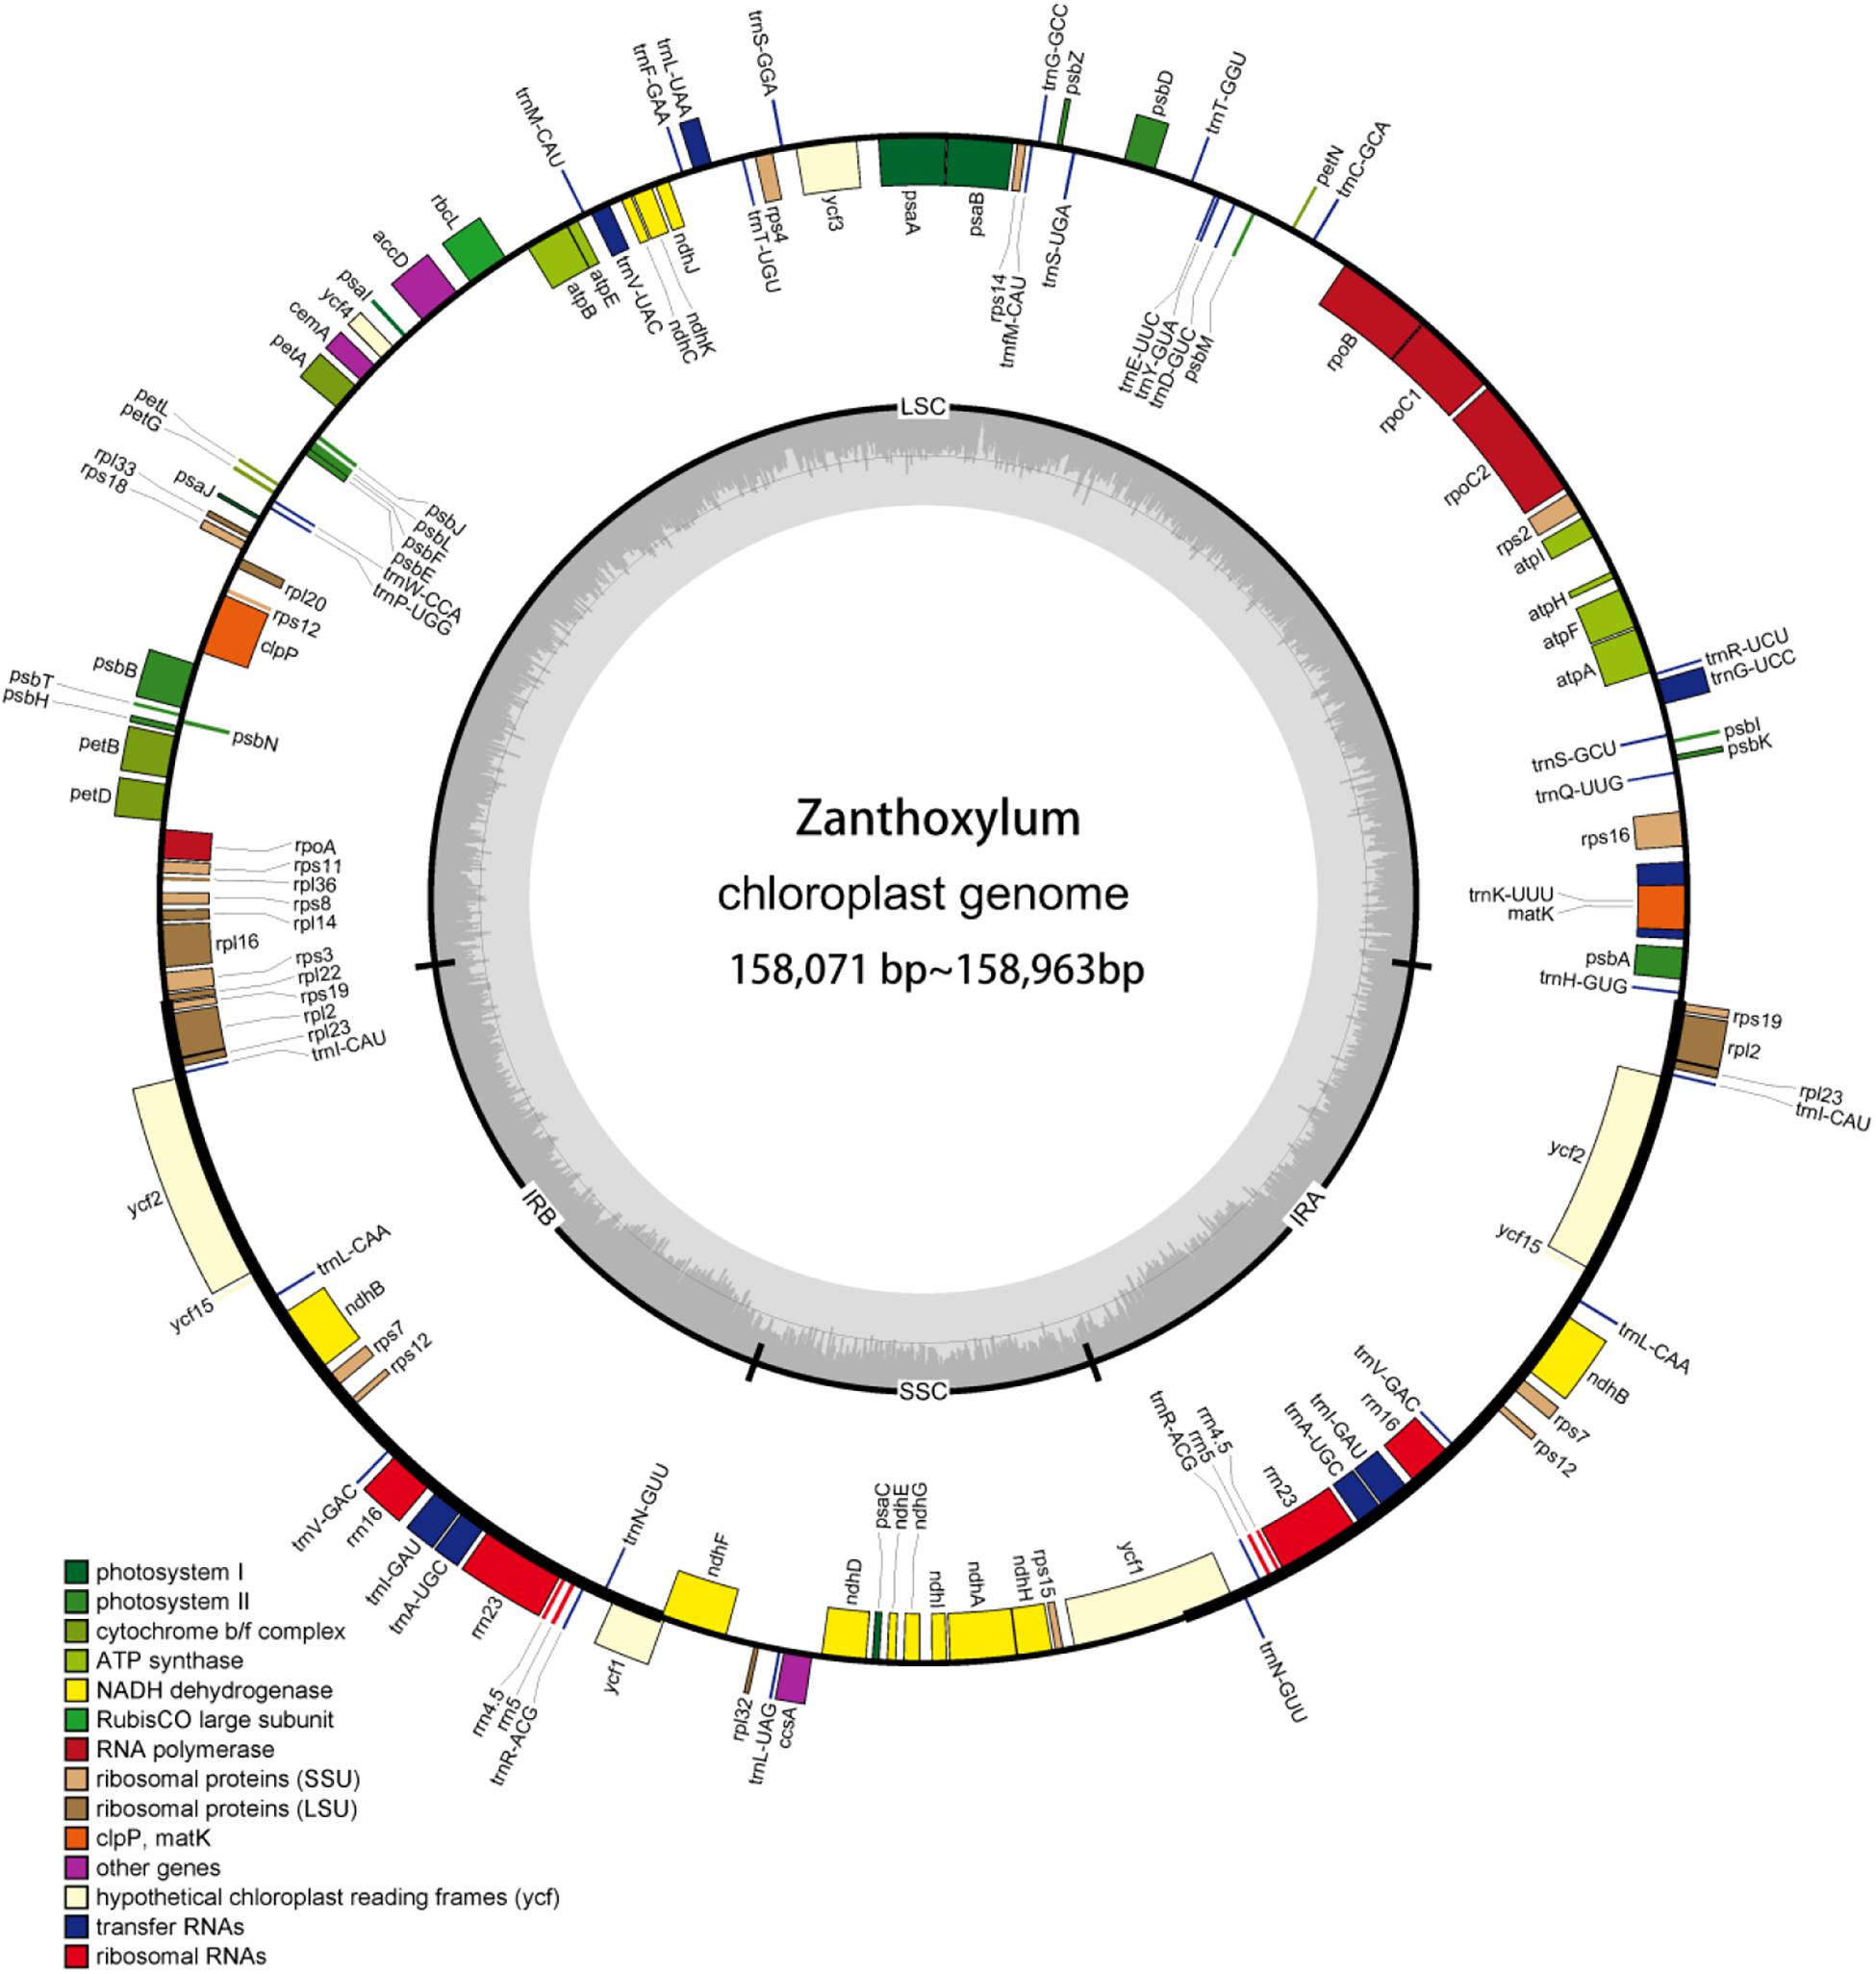
Figure 1. cp genome map of Zanthoxylum. Genes in the circle are transcribed clockwise, while the rest are transcribed counterclockwise. Dark gray shading in the inner circle indicates the GC content.
The cp genomes of the 14 Zanthoxylum species, their sizes, GC content, number of genes, and other information are shown in Supplementary Table 1. The 14 Zanthoxylum cp genomes ranged in size from 158,071 bp for Z. madagascariense to 158,963 bp for Z. schinifolium (Figure 1 and Supplementary Table 1). The differences between the lengths of the Zanthoxylum cp genomes were no greater than 892 bp (Supplementary Table 1). The 14 Zanthoxylum cp genomes displayed a typical quadripartite structure, consisting of a pair of IRs (26,955–27,679 bp) separated by one LSC (85,340–86,528 bp) and one SSC (17,526–18,301 bp) region.
The cp genomes of the Zanthoxylum species were shown to contain 132 genes, including 87 protein-coding, 37 tRNA, and 8 rRNA genes (Table 1 and Supplementary Table 1). There were 18 duplicated genes, including 4 rRNA genes, and 14 other genes (ycf2, ycf15, trnV-GAC, trnR-ACG, trnN-GUU, trnI-CAU, trnL-CAA, trnA-UGC, rps7, rps12, rps19, rpl2, rpl23, and ndhB), were repeated once. There were 16 genes with one intron, including 10 coding genes (ndhA, ndhB, rps12, rps16, rpoC1, atpF, petB, petD, rpl16, and rpl2) and 6 tRNAs (trnK-UUU, trnL-UAA, trnV-UA, trnI-GAU, trnA-UGC, and trnG-UCC). Two coding genes (ycf3 and clpP) had 2 introns (Table 1). Six newly assembled cp genomes with gene annotations have been submitted to NCBI under GenBank accession numbers MT990979 for Z. piasezkii, MT990984 for Z. armatum, MT990981 for Z. motuoense, MT990980 for Z. oxyphyllum, MT990982 for Z. multijugum, and MT990983 for Z. calcicola.
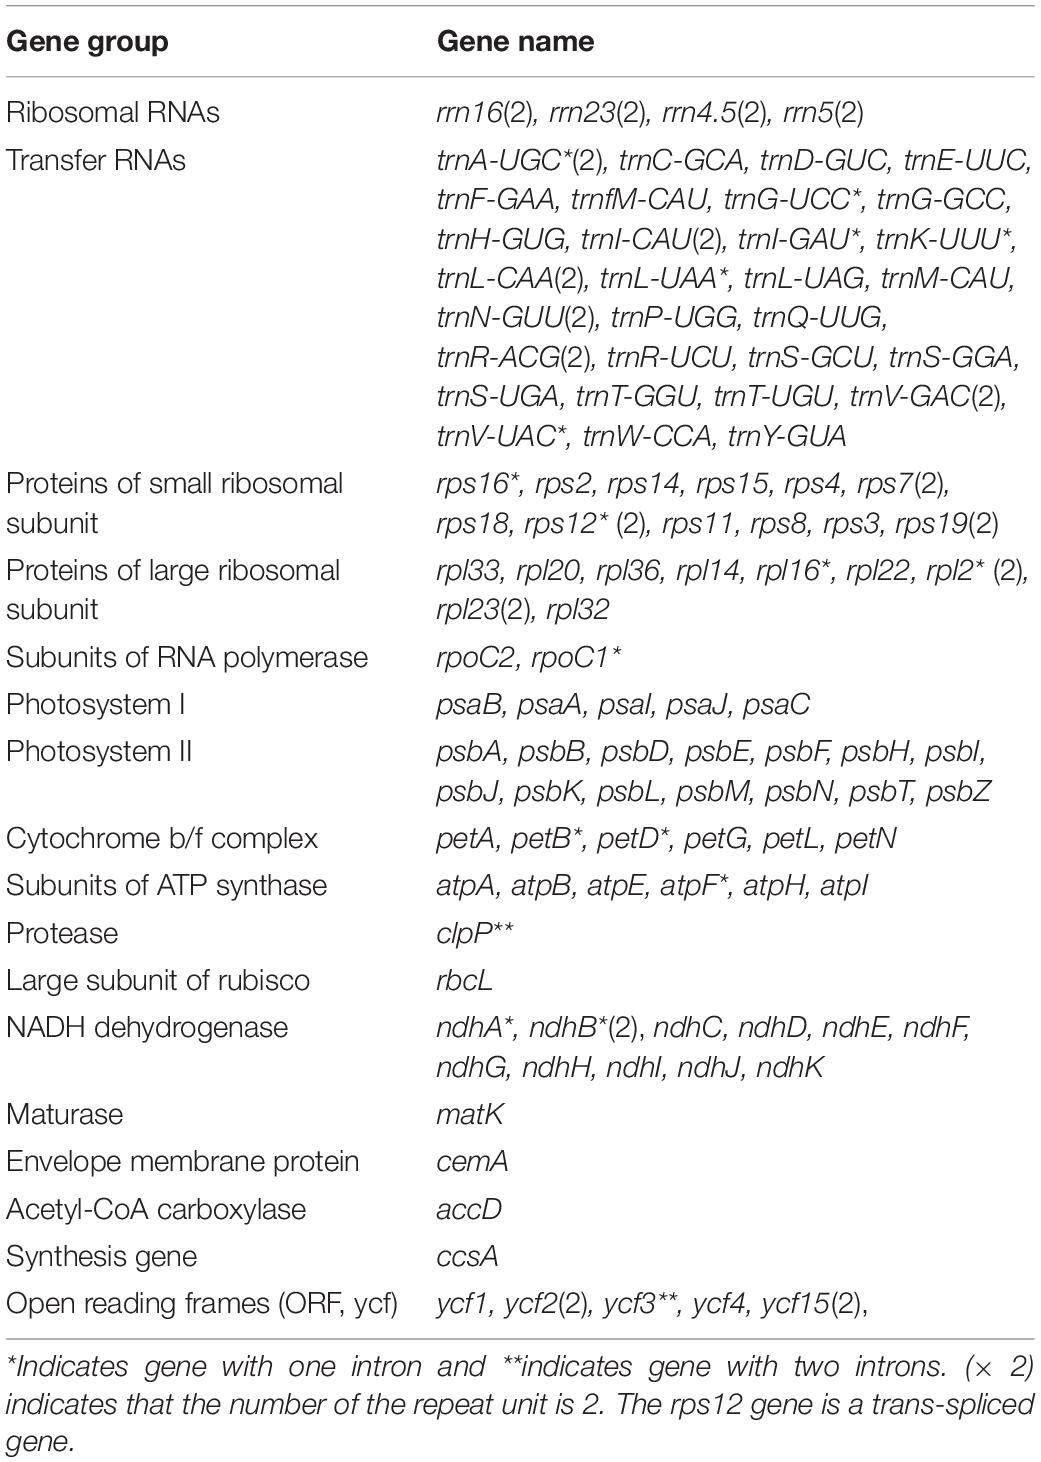
Table 1. List of annotated genes in Zanthoxylum chloroplast genomes.
The contraction and expansion of IR regions is the main contributor to the size variation in cp genomes and alters the evolutionary rate of the cp genome (Zhang et al., 2013). We compared the IR boundaries in 14 Zanthoxylum species and found that the IR boundary regions varied slightly (Figure 2). The IRa/LSC boundaries were located downstream of the rps19 gene. The ycf1 gene crossed over the IRa/SSC border and extended into the IRa region; the length of the ycf1 gene extending into the IRa region ranged from 1,085 to 1,704 bp. At the IRb/SSC border, 23 bp of the ndhF gene was located within the IRb while the remainder was situated in the SSC regions, except in Z. oxyphyllum, Z. multijugum, Z. calcicoca, Z. pinnatum, Z. madagascariense, Z. schinifolium, Z. paniculatum, and Z. tragodes, where the ndhF gene was fully present within the SSC region, indicating that these species may have a closer genetic relationship.
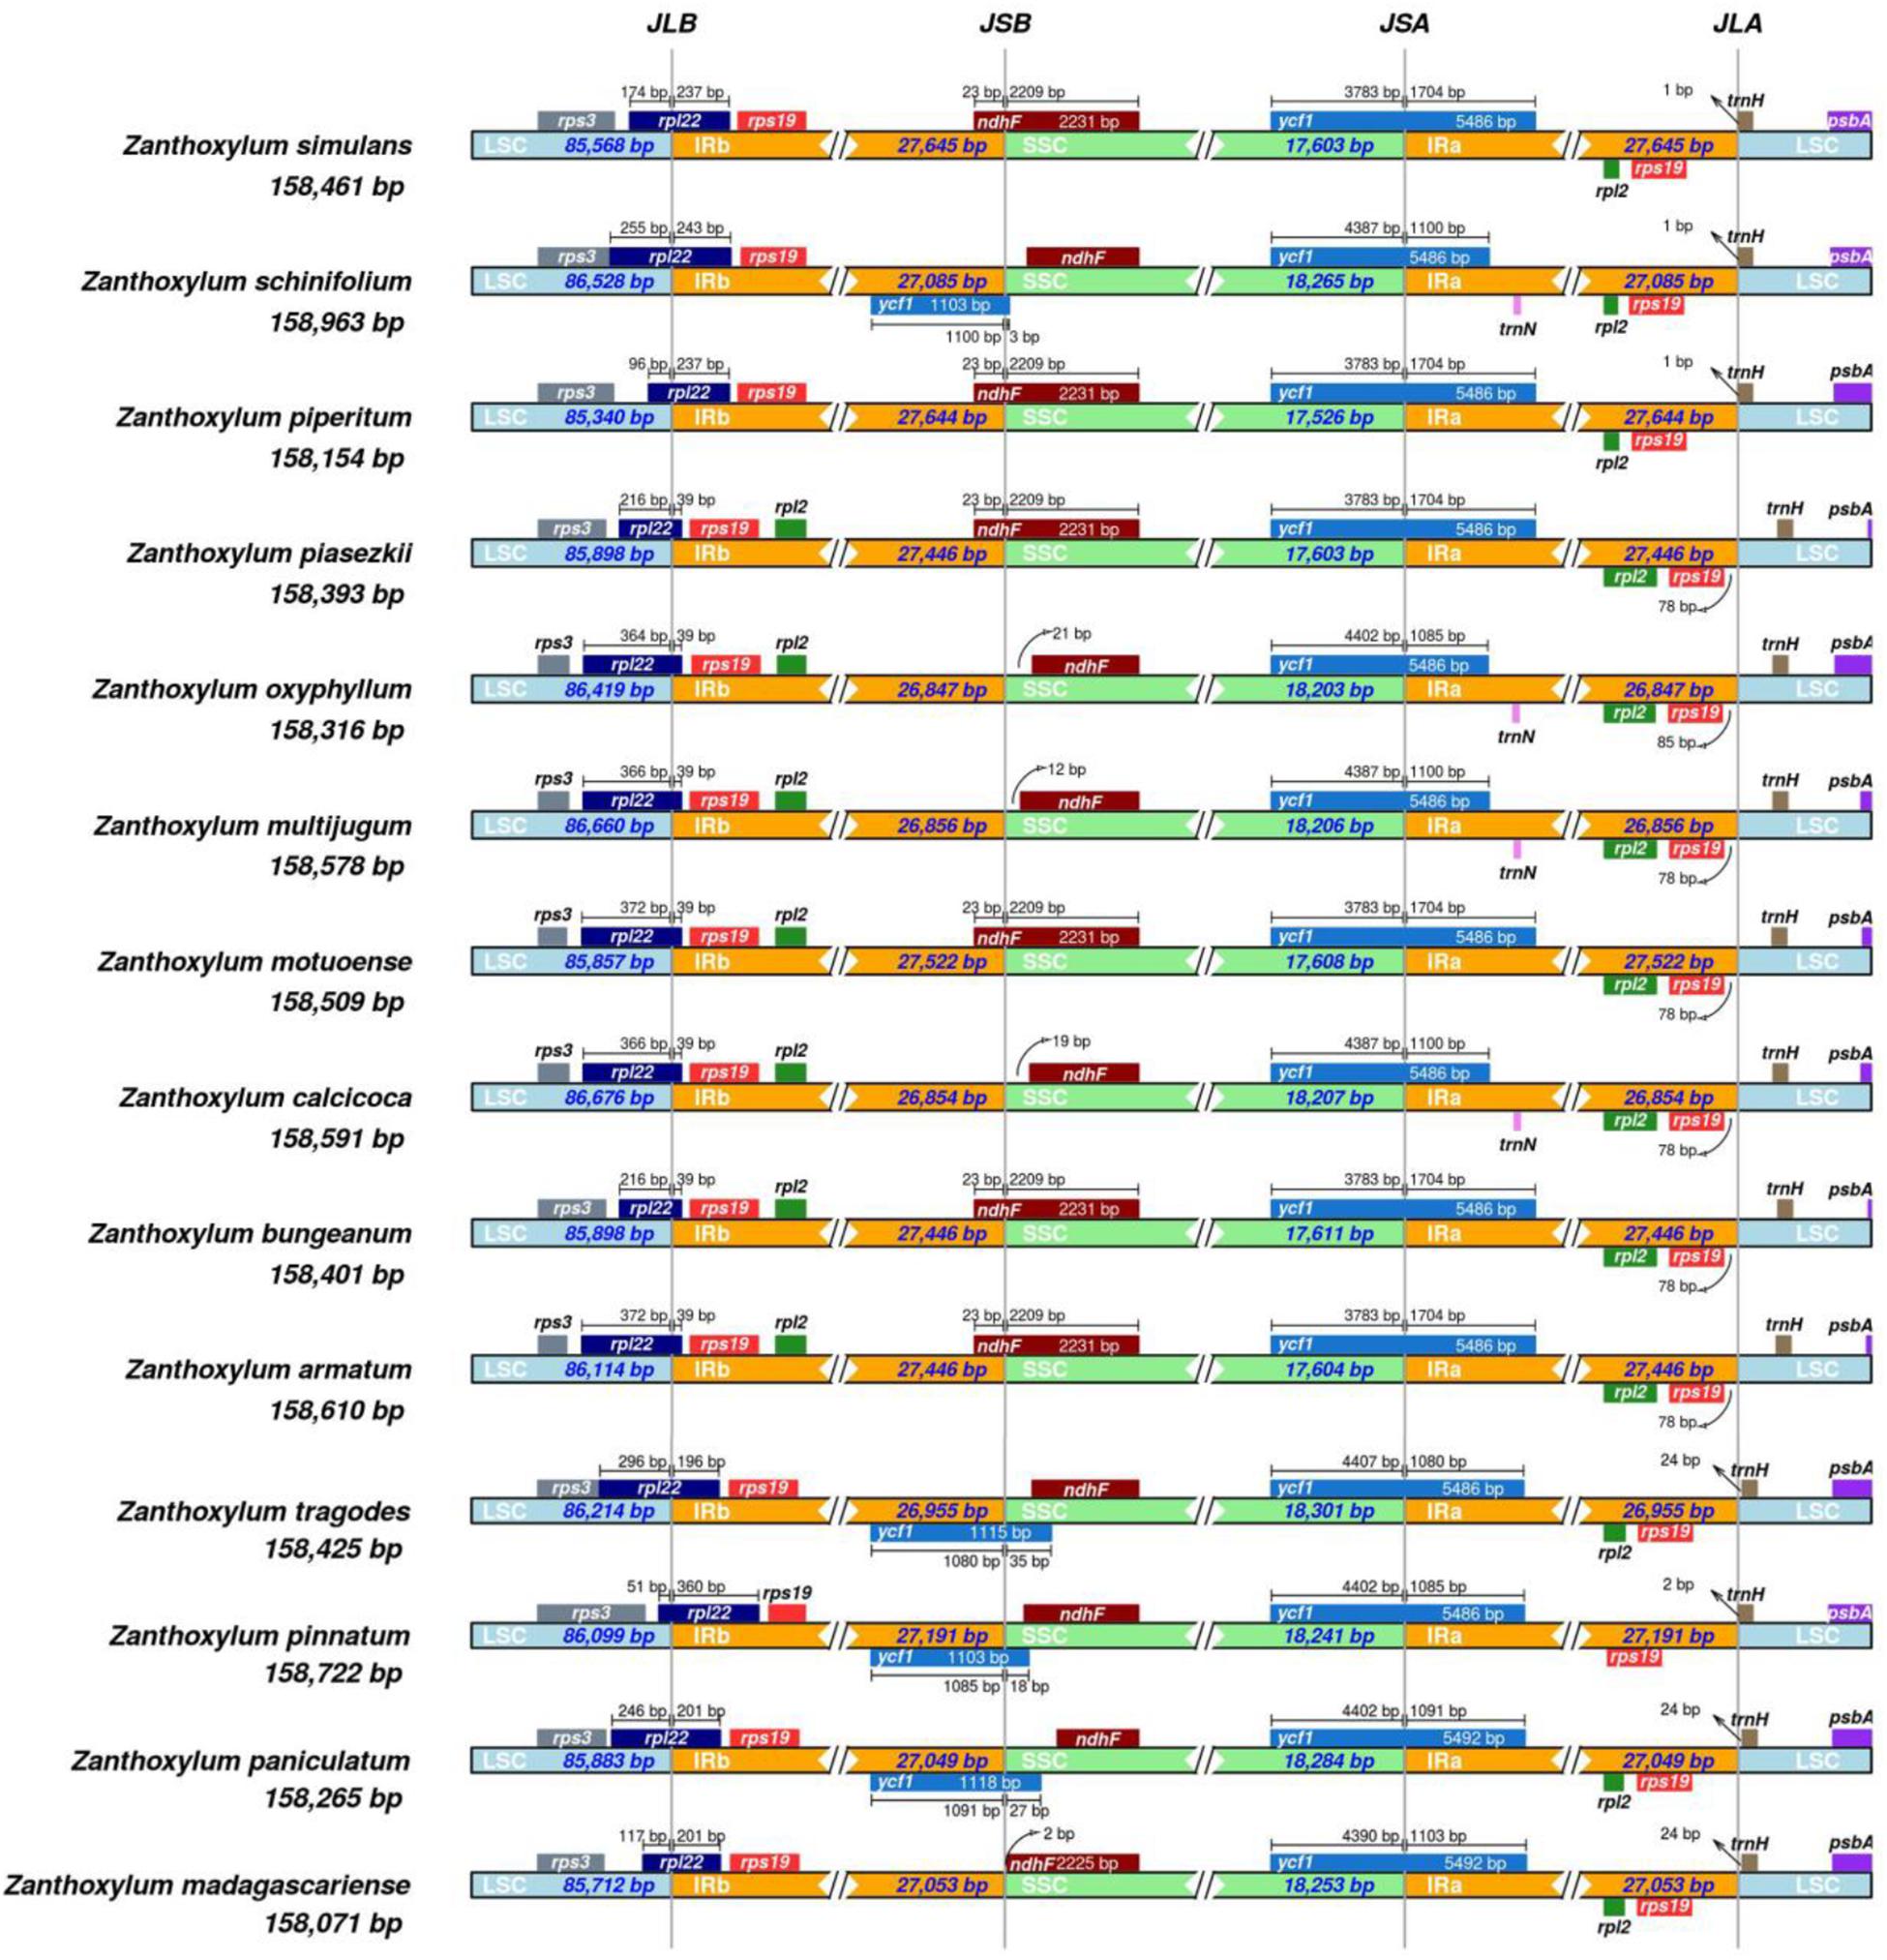
Figure 2. Comparison of the junctions of the LSC, SSC, and IR regions in the cp genomes of 14 Zanthoxylum species. JLB denotes the LSC/IRb junction, JSB denotes the SSC/IRb junction, JSA denotes the SSC/IRa junction, and JLA denotes the LSC/IRa junction.
Repeat sequences in Zanthoxylum cp genomes were detected by REPuter, with the criterion of a copy size of 30 bp or longer. A total of 379 long repeats consisting of 159 forward repeats, 192 palindromic repeats, 20 reverse repeats, and 8 complement repeats were detected (Figure 3 and Supplementary Table 2). These long repeats ranged from 30 to 73 bp in length. The long repeat length of 30 bp was found the most frequently and existed in all 14 Zanthoxylum cp genomes (Figure 3A and Supplementary Table 2). Long repeat lengths of 35 and 46 bp were found the least often and only existed in Z. pinnatum and Z. motuoense cp genomes, respectively (Figure 3A and Supplementary Table 2). Among the 14 Zanthoxylum species, Z. schinifolium had the largest number of long repeats with 47, and Z. bungeanum had the smallest number of long repeats with 17 (Figure 3B and Supplementary Table 2). The number of forward repeats varied between 8 (Z. bungeanum) and 24 (Z. schinifolium), and the number of palindromic repeats varied from 9 (Z. bungeanum) to 21 (Z. schinifolium) (Figure 3B and Supplementary Table 2). Reverse repeats did not exist in all Zanthoxylum species; Z. calcicola had the most reverse repeats with 4, and Z. bungeanum, Z. madagascariense, Z. paniculatum, Z. pinnatum, Z. piperitum, and Z. simulans did not have any reverse repeats. There was only one complement repeat in Z. calcicola, Z. multijugum, Z. madagascariense, Z. paniculatum, Z. schinifolium, and Z. tragodes cp genomes, Z. pinnatum had two complement repeats, and the remainder of the Zanthoxylum cp genomes did not have complement repeats (Figure 3B and Supplementary Table 2).
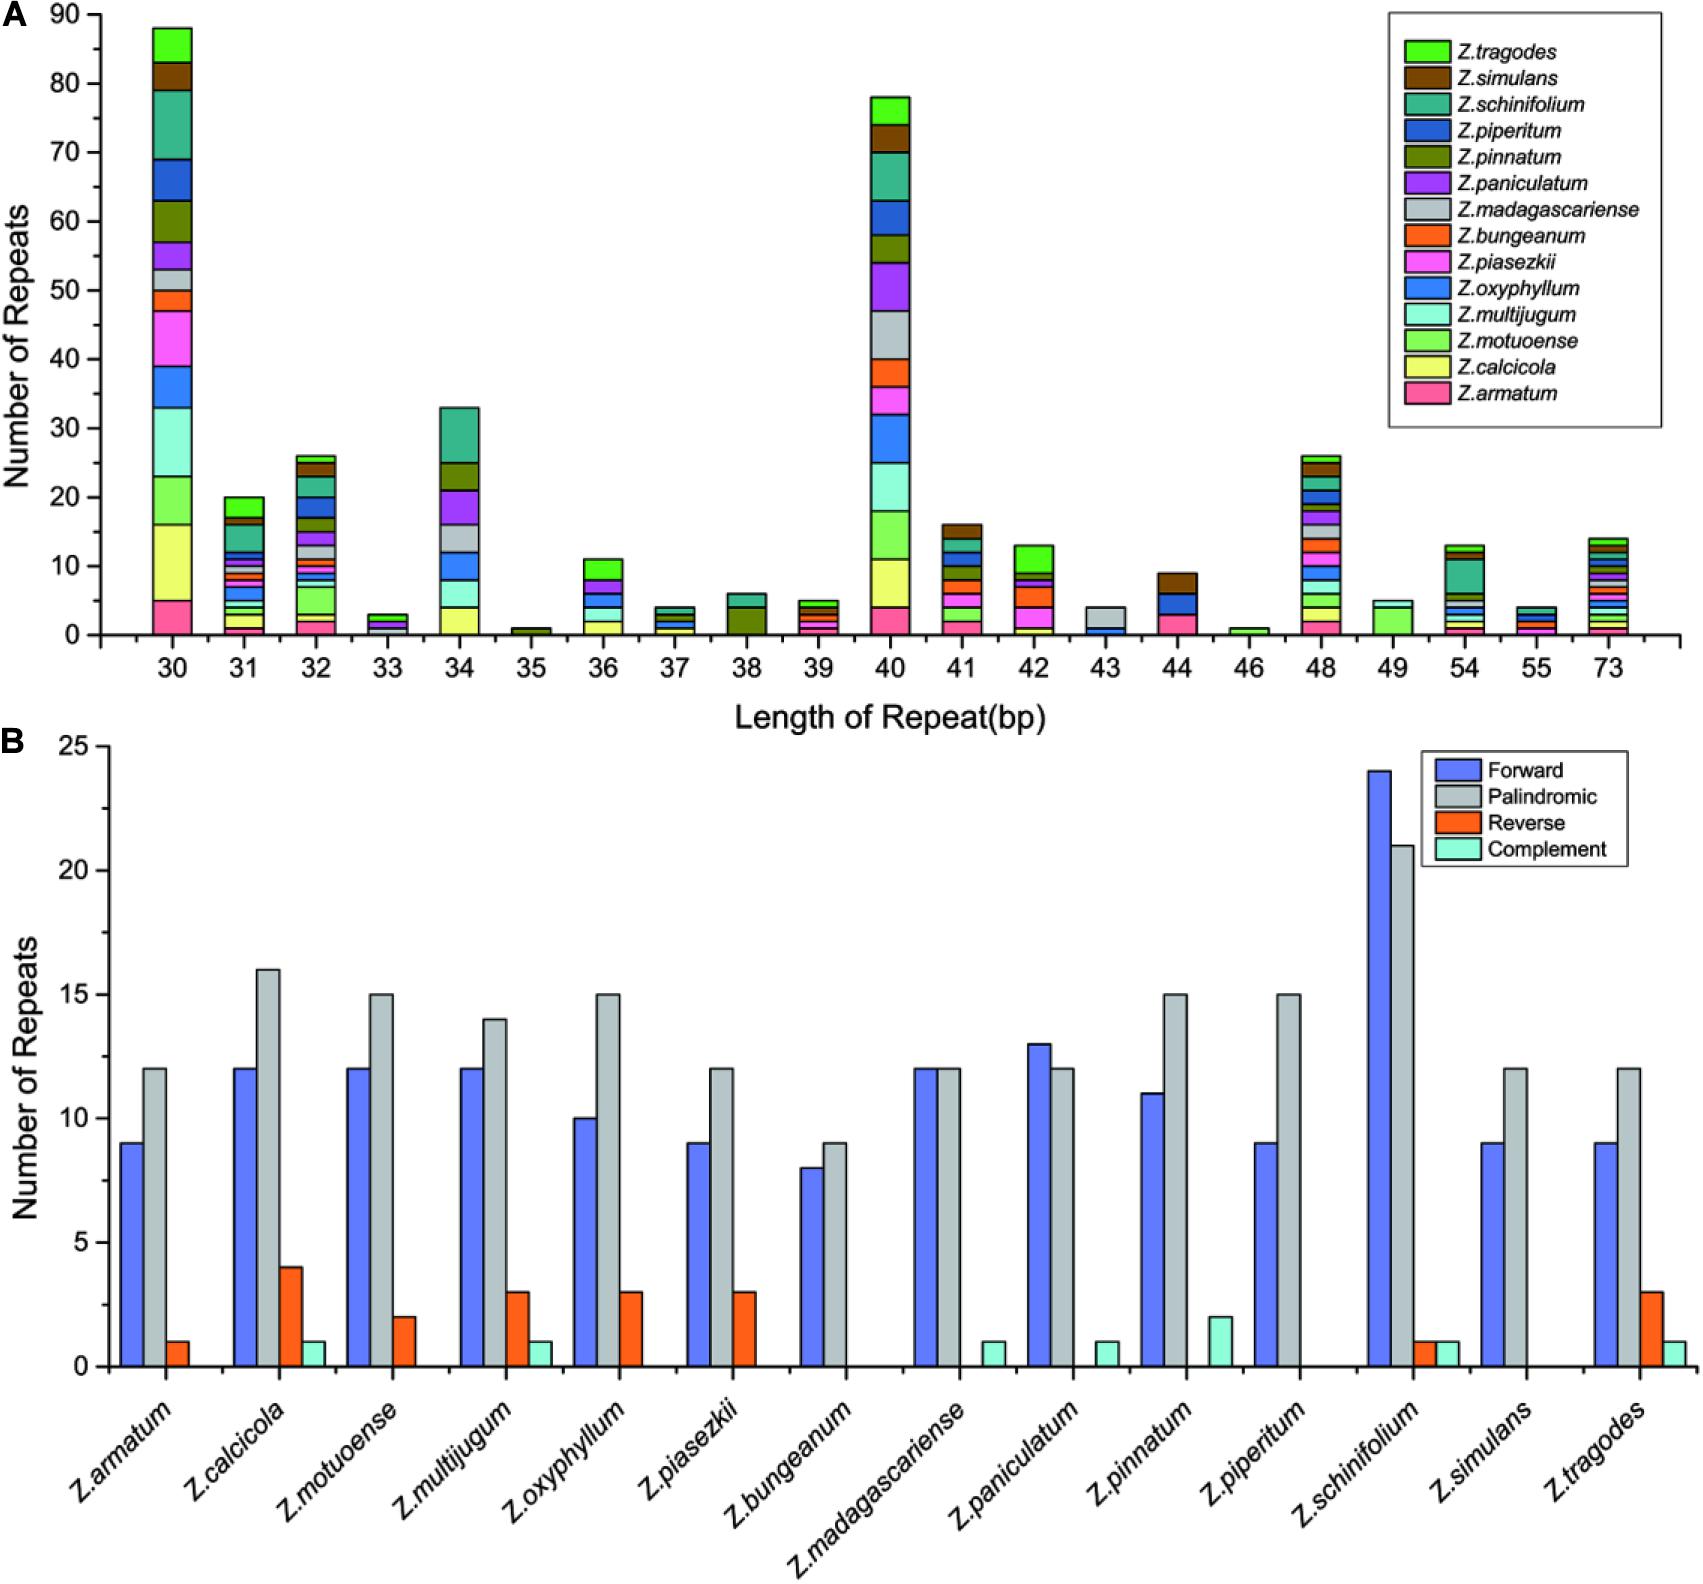
Figure 3. The number of long repeats in the whole cp genome sequence of the 14 Zanthoxylum species. (A) Frequency of repeats more than 30 bp long. (B) Frequency of repeat type.
SSRs are important genetic markers to identify closely related species (Zhao et al., 2020; Zheng et al., 2020). Here, SSRs in the cp genomes of 14 Zanthoxylum species were detected using MISA software. The number of SSRs in the 14 Zanthoxylum species ranged from 244 (Z. tragodes) to 268 (Z. simulans); no significant differences were found in SSR numbers in the 14 Zanthoxylum species (Figure 4A and Supplementary Table 3). In our study, mononucleotide to tetranucleotide SSRs were found in all species. Pentanucleotide repeats were found in Z. madagascariense, Z. schinifolium, and Z. oxyphyllum cp genomes, and hexanucleotide repeats were also found in Z. paniculatum and Z. madagascariense (Figure 4B and Supplementary Table 3). Among these SSRs, mononucleotide repeats were the most common (Figures 4A,B). Only a small proportion consisted of dinucleotide, trinucleotide, tetranucleotide, pentanucleotide, and hexanucleotide repeat motifs (Figures 4A,B and Supplementary Table 3). These newly detected SSRs will contribute to the development of genetic markers for the Zanthoxylum species in future studies.
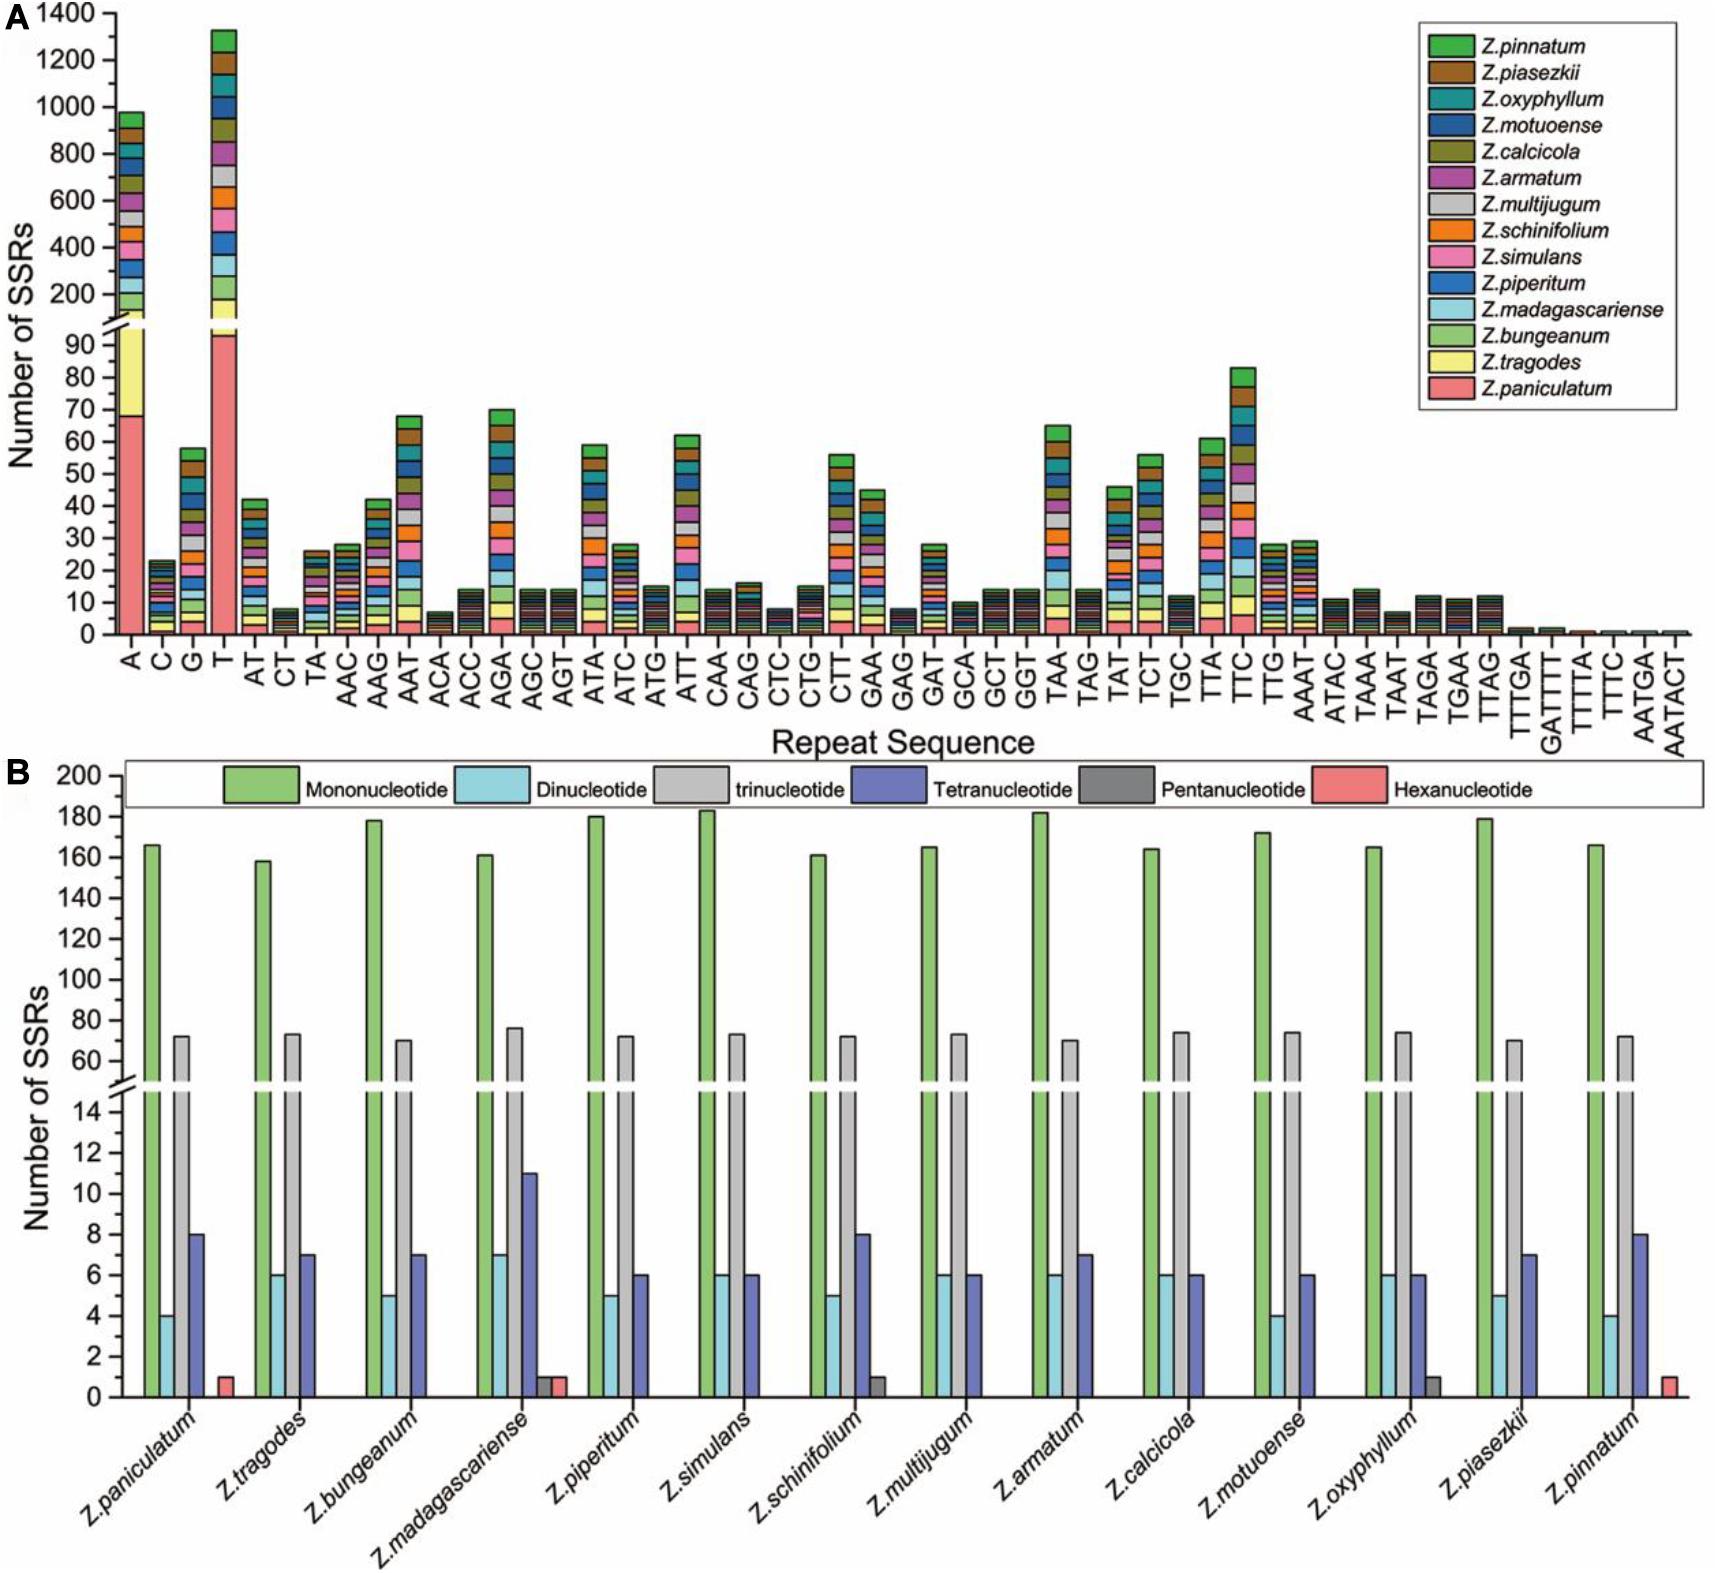
Figure 4. Analysis of SSRs in the 14 Zanthoxylum cp genomes. (A) Frequency of common motifs in the 14 Zanthoxylum cp genomes. (B) Number of different SSR types detected in the 14 Zanthoxylum cp genomes.
We analyzed the nucleotide diversity (Pi) values to measure the divergence level in protein-coding genes and intergenic regions of the 14 Zanthoxylum species. The level of sequence divergence among protein-coding genes was more conserved than in intergenic regions. In 76 protein-coding genes, the average Pi value was 0.00456. Based on a considerably higher Pi value of > 0.01, we found four highly variable regions (psbT, ndhF, matK, and atpH), and the matK gene had the highest divergence value of 0.01253 (Figure 5A). Within the intergenic regions, trnR-UCU-atpA, psbZ-trnG-GCC, trnH-GUG-psbA, ccsA-ndhD, ycf4-cemA, rpl32-trnL-UAG, and psbK-psbI showed a significantly higher Pi value of > 0.02. The trnR-UCU-atpA region had the highest divergence value of 0.06304 (Figure 5B).
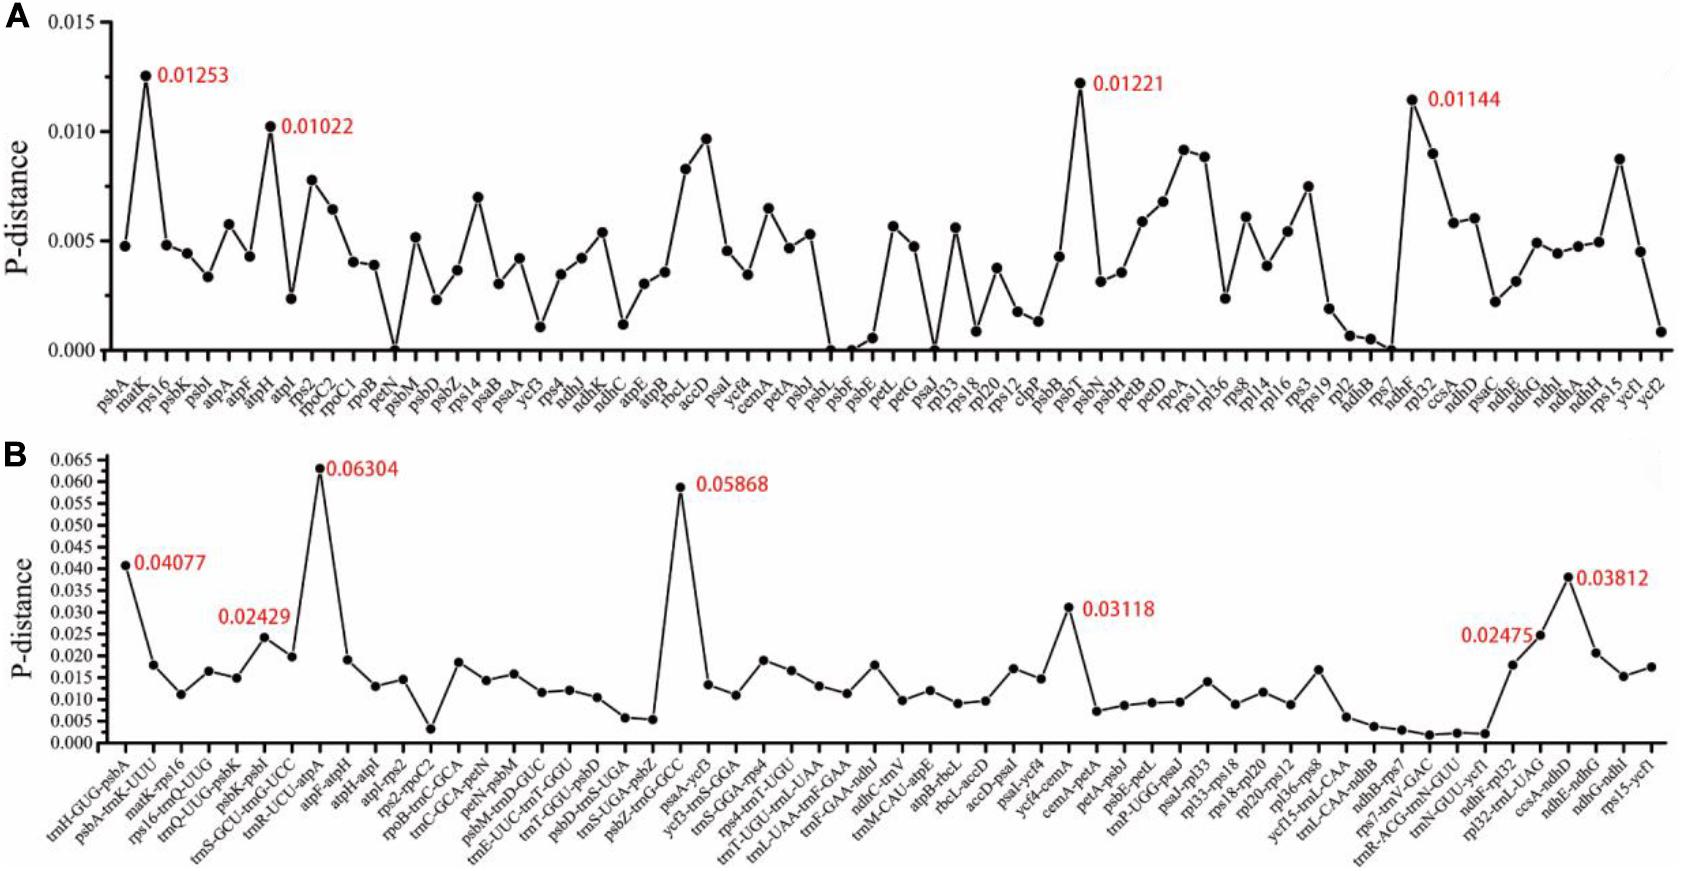
Figure 5. Nucleotide variability (Pi) values were calculated in the 14 Zanthoxylum cp genomes. (A) Protein-coding genes. (B) Intergenic regions. These regions were arranged according to their locations in the cp genome.
We analyzed sequence characteristics such as sequence length range, GC content, and the average number of mutation sites of the seven candidate barcode sequences (Table 2). ndhF had the longest sequence length (2,211∼2,229 bp), ccsA-ndhD had the shortest sequence length (224∼304 bp). The region with the most average number of mutation sites is rpl32-trnL-UAG (13.6%), and the region with the least is ndhF (4.4%). From the sequence length and the percentage of parsimony informative sites, trnH-GUG-psbA, rpl32-trnL-UAG, and ccsA-ndhD contained approximately equal numbers of parsimony informative sites (Table 2).
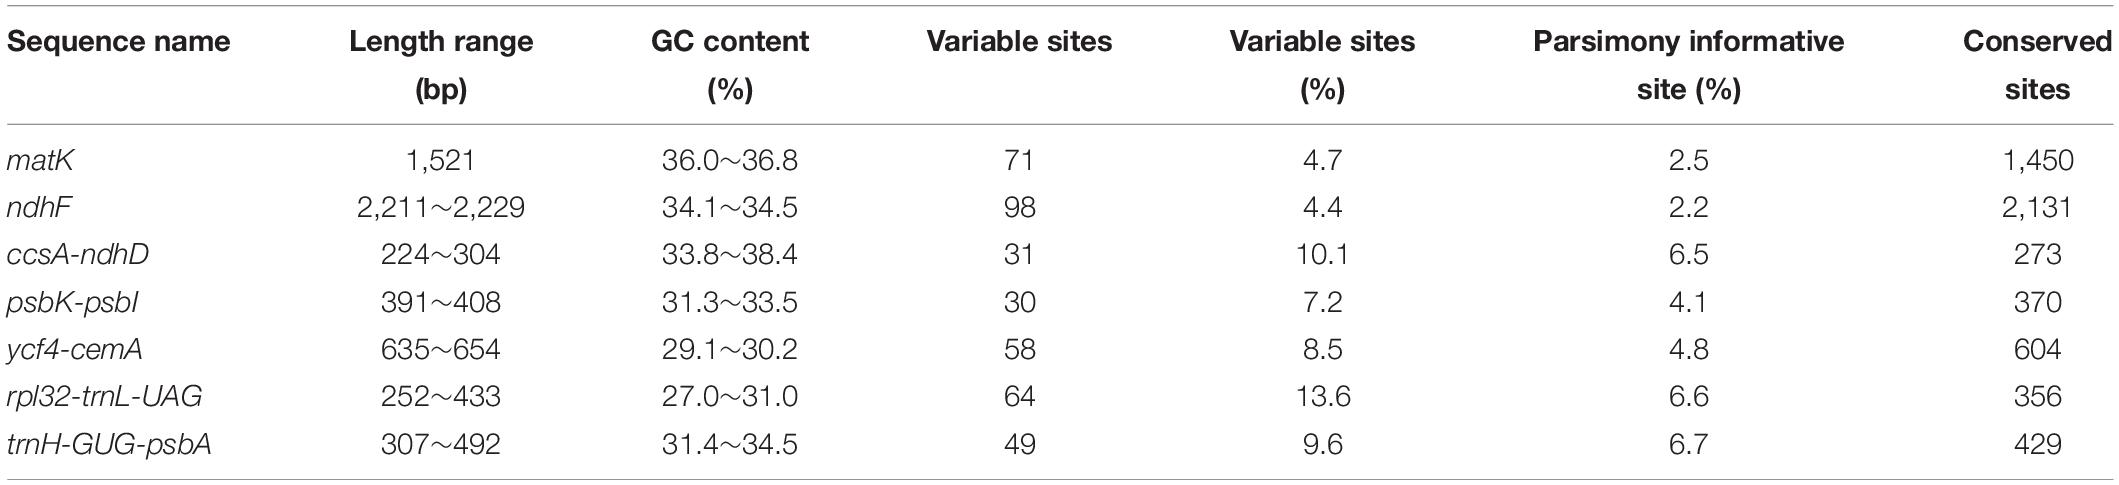
Table 2. Basic information of potential DNA barcode sequences.
Among these high nucleotide diversity regions, we selected seven regions (matK, ndhF, ccsA-ndhD, psbK-psbI, ycf4-cemA, rpl32-trnL-UAG, and trnH-GUG-psbA) with suitable lengths and low sequence identities as candidate barcode sequences. To evaluate the ability of the seven selected sequences to identify Zanthoxylum plants, we constructed the ML tree separately based on each sequence (Supplementary Figure 1). The number of species successfully identified in the ML tree is used to evaluate the resolution power of the sequence (Zheng et al., 2020). When the value of the node is lower than 50, the species on the branch cannot be distinguished (Zheng et al., 2020). matK and rpl32-trnL-UAG had the same highest resolution power (identification success rate) of 93%, followed by trnH-GUG-psbA with 86%, and ycf4-cemA with 79%. CcsA-ndhD had the lowest resolution power of 57% (Table 3). Additionally, we examined the tree topology of the constructed ML trees based on each region (Figure 6). The tree topology of the constructed ML tree based on the matK gene is closest to the evolutionary tree, which was constructed based on the protein-coding genes (Figure 6 and Supplementary Figure 1).
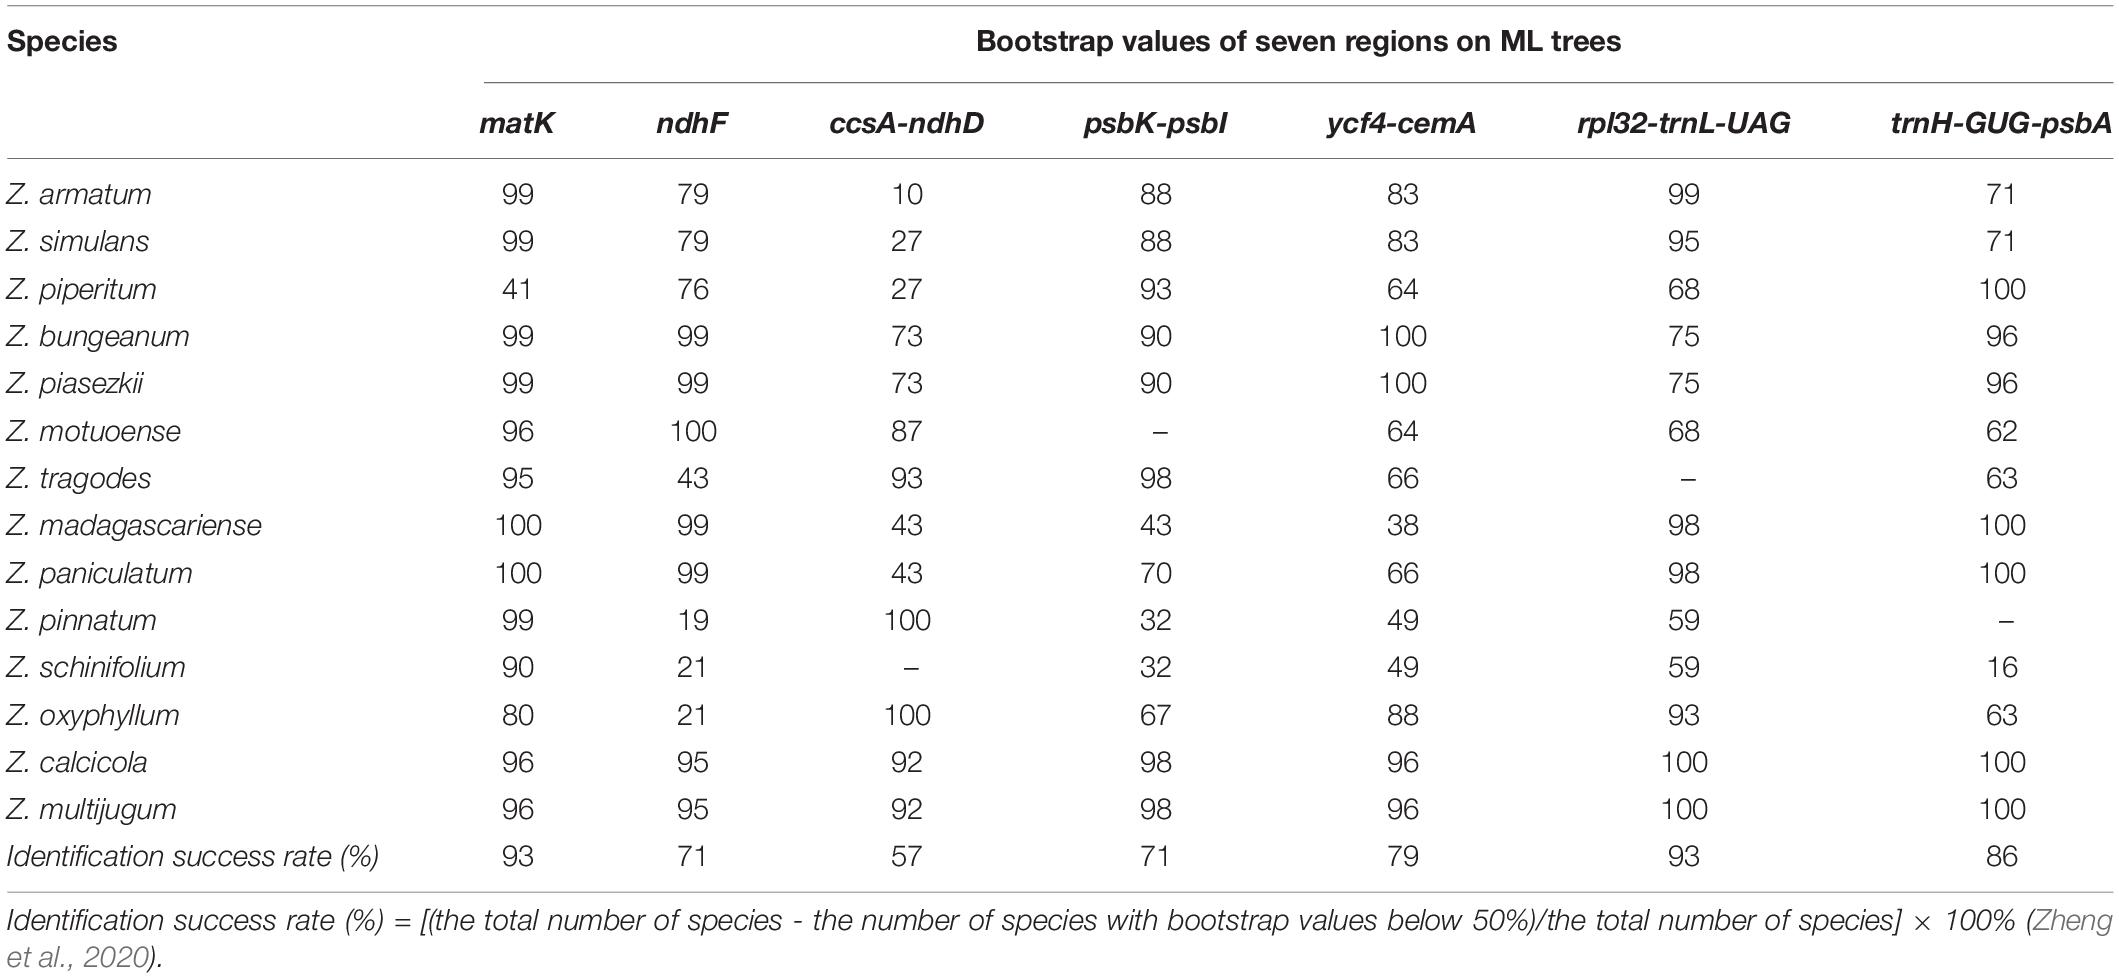
Table 3. Evaluation of the identification power of seven regions in Zanthoxylum.
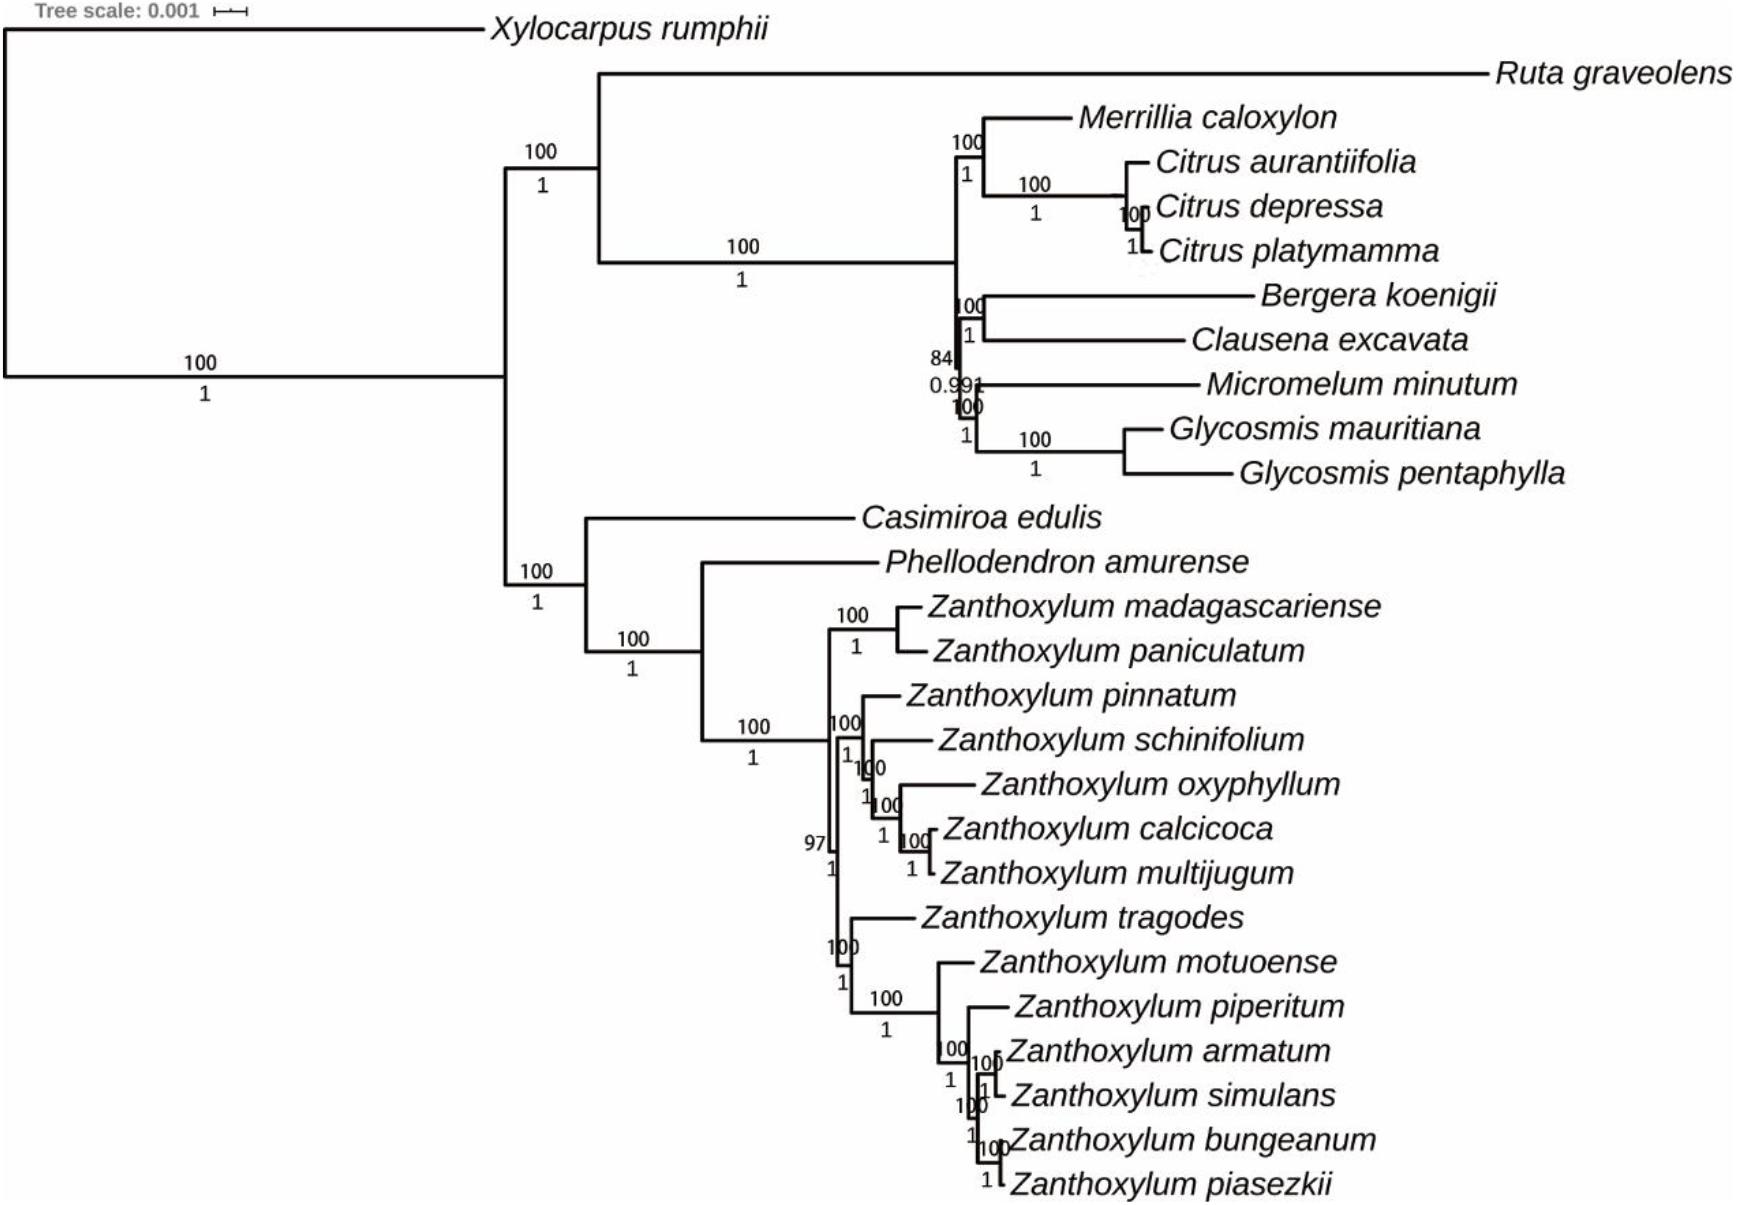
Figure 6. The phylogenetic tree was reconstructed based on 76 protein-coding genes of 27 Rutaceae species cp genomes using IQ-TREE and MrBayes. Xylocarpus rumphii was used as the outgroup. Numbers at the nodes denote bootstrap values and posterior probabilities.
We analyzed the synonymous and non-synonymous change rates of 68 protein-coding genes in Sapindales (Supplementary Table 4). Eight genes (ccsA, cemA, matK, psaI, psbK, psbM, rps12, and rps16) were identified under positive selection (Ka/Ks ratio > 1; Supplementary Table 4). This shows that although Sapindales face relatively weak selection pressure, some are undergoing essential adaptations to their environment. Among the eight genes, rps16, psbK, matK, ccsA, cemA, and rps12 showed high rates for one species. The genes psbM and psaI presented high rates for two and five species, respectively.
A total of 30 Rutaceae cp genomes were selected to perform phylogenetic analysis. Xylocarpus rumphii (NC038199.1) was used as the outgroup. The phylogenetic tree was constructed using the ML and Bayesian inference (BI) methods and resulted in similar phylogenetic trees based on 76 protein-coding sequences. Seven Subgen. Fagara and five Subgen. Zanthoxylum species were clustered together to form a single clade, which is consistent with the record in Flora of China (Huang, 1997). However, it is noteworthy that Z. madagascariense and Z. paniculatum clustered together to form a single clade and then gather with other Zanthoxylum species. The traditional classification system of Zanthoxylum mainly relies on the differentiation of calyx and petals. The existing classification of Zanthoxylum may be imperfect. Therefore, we speculate that Z. madagascariense and Z. paniculatum may constitute a new subgenus.
In the present study, we sequenced and annotated the cp genomes of six Zanthoxylum species, compared genomic features among the species of Zanthoxylum, identified SSR, tandem repeats and suitable polymorphic loci for designing of suitable molecular markers. Our results have laid the foundation for future studies on the molecular identification of Zanthoxylum species.
The cp genome of most angiosperm species contains 74 protein-coding genes, while a few species contain another five protein-coding genes (Millen et al., 2001; Bock and Knoop, 2012). In this study, the 14 Zanthoxylum cp genomes contain 87 protein-coding genes (79 unigenes were protein-coding), 37 tRNA genes, and 8 rRNA genes, which is similar to Citrus (Carbonellcaballero et al., 2015). Although there is one less protein-coding gene in Z. piperitum compared with other Zanthoxylum, after careful proofreading, we found that the original author missed an annotation for the rps12 gene (Lee et al., 2015).
Cp genomes are typically 120–160 kb in size since IR regions expand and contract (Wicke et al., 2011). The cp genomes of the 14 Zanthoxylum are ∼158 kb, and the length does not change significantly. Although IR boundary regions have no significant changes in Zanthoxylum, we found most of the ndhF genes of Subgen. Zanthoxylum have 23 bp located in the SSC regions, which indicates that the location information of the genes in the IR region can indicate the distance between species to a certain extent.
In addition to identifying closely related species, the variation in SSR copy numbers in the cp genome is an efficient marker for the study of plant population genetics, polymorphism investigations, and evolutionary history (Xue et al., 2012, 2019; He et al., 2012; Wheeler et al., 2014). Li et al. (2019) developed SSR markers derived from cp genomes that can effectively distinguish Z. bungeanum, Z. armatum, and Z. piperitum and used the SSR markers to analyze the genetic diversity among different species of Zanthoxylum. The number of Poly (A)/(T) SSRs in the Zanthoxylum cp genome is much greater than that of poly(G)/(C), which is consistent with the results of previous studies (Xue et al., 2019; Zhao et al., 2020). The abundant SSRs we found in the cp genomes of the 14 Zanthoxylum species laid the foundation for the identification of assays detecting polymorphisms at the population level of Zanthoxylum.
Since the whole cp genome contains abundant mutation sites, it can be used directly as a super barcode for species identification., on the other hand, hypervariable regions can be screened out as potential molecular markers for species identification (Nock et al., 2011; Li et al., 2015). Recently, researchers have successfully identified plants such as Amomum (Cui et al., 2019) and Ligularia (Chen et al., 2018) based on the whole cp genome. Hollingsworth et al., proposed using the rbcL + matK gene combination derived from the cp genome as the core barcode for land plant identification (Hollingsworth et al., 2009). In this research, we selected seven regions (matK, ndhF, ccsA-ndhD, psbK-psbI, ycf4-cemA, rpl32-trnL-UAG, and trnH-GUG-psbA) as candidate barcode sequences to identify Zanthoxylum. Although the protein-coding genes of cp genomes are relatively conservative and are mainly used for the study of higher classification levels, they also have applications in lower classification levels. The matK gene is a good identifier for plants of Apocynaceae (Cabelin and Alejandro, 2016), Dipterocarpaceae (Hu et al., 2019), and Juniperus (Hong et al., 2014). Given the excellent performance of the matK gene in the construction of the evolutionary tree of Zanthoxylum, we recommend that the matK gene be used to reconstruct phylogenetic relationships of Zanthoxylum where there is a lack of genomic information. Although the psbT gene in Zanthoxylum cp genomes has a high Pi value, the length of the psbT gene is too short (102 bp) to provide sufficient mutation sites, so we believe that psbT is not suitable as a barcode gene. Similarly, the rpl22 gene has a high Pi value in Zanthoxylum cp genomes mainly due to the variation in the rpl22 gene length, making it difficult to design universal primers and so rpl22 is not suitable as a barcode gene. Due to less selective pressure, non-coding sequences have higher evolutionary rates than coding regions and so provide more systematically significant information sites (Borsch and Quandt, 2009). trnH-psbA and rpl32-trnL are often used in genus level and subgenus level relationships, phylogenetic location, and species identification research. In our study, trnH-psbA and rpl32-trnL had excellent species identification success rates in Zanthoxylum. We recommend matK, trnH-psbA, and rpl32-trnL sequences as potential molecular markers for the identification and marker-assisted breeding of Zanthoxylum. In previous studies, the construction of Zanthoxylum phylogeny was mostly based on SSR markers (Feng et al., 2016), random amplified polymorphic DNA (Hong et al., 2008), sequence-related amplified polymorphism markers (Feng et al., 2015), and single-copy nuclear genes (Feng et al., 2017). The lack of genomic information hinders the accurate evolutionary analysis of Zanthoxylum and its related species (Feng et al., 2017). Since the cp genome sequence is relatively conservative and is less affected by paralogous genes such as nuclear genes when constructing phylogenetic trees, it has often been used in angiosperm phylogeny construction and speculation of species evolution history in recent years (Dong et al., 2017; Zhang et al., 2017; Zhao et al., 2020).
In our study, 14 Zanthoxylum species were represented with strongly supported phylogenetic trees using ML and BI analysis. The results of our phylogenetic analysis strongly support the genus Fagara as a subgenus of Zanthoxylum, and proposes the possibility of a new subgenus in Zanthoxylum. Z. bungeanum and Z. schinifolium recorded in the Chinese Pharmacopeia belong to a different subgenus and are relatively distantly related, consistent with the research of Wang et al. (2016). Overall, the phylogenetic position of Zanthoxylum revealed by our phylogenetic tree is more credible than in previous studies given the higher number of cp genomes analyzed in our research.
The cp genome sequences of Zanthoxylum species were submitted on the National Center for Biotechnology Information (NCBI) and the accession numbers were: MT990979, MT990984, MT990981, MT990980, MT990982, and MT990983.
KZ, LL, and XL conceived and designed the work. HQ and JY collected the samples. KZ, LL, and ZZ performed the experiments and analyzed the data. KZ and LL wrote the manuscript. XL and ZL revised the manuscript. All authors have read and agreed to the published version of the manuscript.
This work was financially supported by the Budget Project of Tibet Autonomous Region Level:2019 Collaborative Innovation Project for the Research and Development of Tibetan Special Agricultural and Animal Husbandry Resources (Tibetan Medicinal Materials) (2019-44), Tibet Autonomous Region Major Special Science and Technology Project (No. XZ201901-GA-04), The Forth National Survey of Traditional Chinese Medicine Resources, Chinese or Tibet Medicinal Resources Investigation in Tibet Autonomous Region (State Administration of Chinese Traditional Medicine 20200501-542329), the Large-scale Scientific Facilities of the Chinese Academy of Sciences (Grant No. 2017-LSF-GBOWS-02), and Key Project at Central Government Level: The Ability Establishment of Sustainable Use for Valuable Chinese Medicine Resources (No. 2060302-1704-09).
The authors declare that the research was conducted in the absence of any commercial or financial relationships that could be construed as a potential conflict of interest.
The Supplementary Material for this article can be found online at: https://www.frontiersin.org/articles/10.3389/fpls.2020.605793/full#supplementary-material
Supplementary Figure 1 | ML trees constructed based on seven regions.
Supplementary Table 1 | Summary of the characteristics of the 14 Zanthoxylum cp genomes.
Supplementary Table 2 | The number of long repeats in the whole cp genome sequence of 14 Zanthoxylum species.
Supplementary Table 3 | SSRs comparison of 14 Zanthoxylum species.
Supplementary Table 4 | The rates of Ka, Ks, and KaKs of 68 genes among 13 Sapindales species.
Supplementary Table 5 | List of species used for phylogenetic tree construction.
Supplementary Table 6 | List of 76 protein-coding genes used for phylogenetic tree construction.
Amiryousefi, A., Hyvönen, J., and Poczai, P. (2018). Irscope: an online program to visualize the junction sites of chloroplast genomes. Bioinformatics 34, 3030–3031. doi: 10.1093/bioinformatics/bty220
Bendich, A. J. (2004). Circular chloroplast chromosomes: the grand illusion. Plant Cell. 16, 1661–1666. doi: 10.1105/tpc.160771
Bock, R., and Knoop, V. (2012). Genomics of chloroplasts and mitochondria. Adv. Photosynthesis Respiration 35, 89–102.
Borsch, T., and Quandt, D. (2009). Mutational dynamics and phylogenetic utility of noncoding chloroplast DNA. Plant Systematics Evol. 282, 169–199. doi: 10.1007/s00606-009-0210-8
Brooks, A., and Lowe, T. (2005). The tRNAscan-SE, snoscan and snoGPS web servers for the detection of tRNAs and snoRNAs. Nucleic Acids Res. 33, 686–689. doi: 10.1093/nar/gki366
Cabelin, V. L. D., and Alejandro, G. J. D. (2016). Efficiency of matk, rbcl, trnh-psba, and trnl-f (cpdna) to molecularly authenticate philippine ethnomedicinal apocynaceae through DNA barcoding. Pharmacogn Mag. 12, 384–388. doi: 10.4103/0973-1296.185780
Carbonellcaballero, J., Alonso, R., Ibanez, V., Terol, J., Talon, M., and Dopazo, J. (2015). A phylogenetic analysis of 34 chloroplast genomes elucidates the relationships between wild and domestic species within the genus citrus. Mol. Biol. Evol. 32, 2015–2035. doi: 10.1093/molbev/msv082
Chen, X. L., Zhou, J. G., Cui, Y. X., Wang, Y., Duan, B. Z., and Yao, H. (2018). Identification of ligularia herbs using the complete chloroplast genome as a super-barcode. Front. Pharmacol. 9:695. doi: 10.3389/fphar.2018.00695
Cui, Y., Chen, X., Nie, L., Sun, W., Hu, H., Lin, Y., et al. (2019). Comparison and phylogenetic analysis of chloroplast genomes of three medicinal and edible amomum species. Int. J. Mol. Sci. 20:4040. doi: 10.3390/ijms20164040
Dong, W., Xu, C., Li, W., Xie, X., Lu, Y., Liu, Y., et al. (2017). Phylogenetic resolution in juglans based on complete chloroplast genomes and nuclear DNA sequences. Front. Plant Sci. 8:1148. doi: 10.3389/fpls.2017.01148
Dierckxsens, N., Mardulyn, P., and Smits, G. (2017) NOVOPlasty: de novo assembly of organelle genomes from whole genome data. Nucleic. Acids. Res. 45:e18. doi: 10.1093/nar/gkw955
Feng, S., Liu, Z., Chen, L., Hou, N., Yang, T., and Wei, A. (2016). Phylogenetic relationships among cultivated zanthoxylum species in china based on cpdna markers. Tree Genet. Genomes 12:45. doi: 10.1007/s11295-016-1005-z
Feng, S., Yang, T., Liu, Z., Chen, L., Hou, N., Wang, Y., et al. (2015). Genetic diversity and relationships of wild and cultivated zanthoxylum germplasms based on sequence-related amplified polymorphism (srap) markers. Genetic Resources Crop Evol. 62, 1193–1204. doi: 10.1007/s10722-015-0222-x
Feng, S., Zhao, L., Liu, Z., Liu, Y., Yang, T., and Wei, A. (2017). De novo transcriptome assembly of zanthoxylum bungeanum using illumina sequencing for evolutionary analysis and simple sequence repeat marker development. Sci. Rep. 7:16754. doi: 10.1038/s41598-017-15911-7
He, S., Wang, Y., Volis, S., Li, D., and Ye, T. (2012). Genetic diversity and population structure: implications for conservation of wild soybean (glycine soja sieb. Et zucc) based on nuclear and chloroplast microsatellite variation. Int. J. Mol. Sci. 13, 12608–12628. doi: 10.3390/ijms131012608
Hollingsworth, M. L., Andra, C. A., Forrest, L. L., Richardson, J., Pennington, R. T., Long, D. G., et al. (2009). Selecting barcoding loci for plants: evaluation of seven candidate loci with species-level sampling in three divergent groups of land plants. Mol. Ecol. Resources 9, 439–457. doi: 10.1111/j.1755-0998.2008.02439.x
Hong, J. K., Yang, J. C., Oh, S. H., and Lee, Y. M. (2014). Molecular phylogenetic study of section sabina (genus juniperus) in korea based on chloroplast DNA matk and psba-trnh sequences data. Korean J. Plant Taxonomy 44, 51–58. doi: 10.11110/kjpt.2014.44.1.51
Hong, P. D., Jie, X. U., Feng, C., and Qin, Z. S. (2008). Morphological and molecular identification on genetic diversity of zanthoxylum armatum var. novemfolius. Acta Botanica Boreali-Occidentalia Sinica 28, 2103–2109. doi: 10.1007/s11767-006-0112-7
Hu, J., Liu, Z., Ci, X., and Li, J. (2019). Use of DNA barcoding in identifying tropical trees from dipterocarpaceae. Chinese Bull. Botany 054, 350–359.
Hu, X. J., Liu, S., and An, M. (2012). Experimental study of zanthoxylum seed oil refining process. Trans. Chinese Soc. Agricult. Eng. 28, 322–325. doi: 10.3969/j.issn.1002-6819.2012.z1.054
Jansen, R. K., Cai, Z., Raubeson, L. A., Daniell, H., Depamphilis, C. W., Leebensmack, J., et al. (2007). Analysis of 81 genes from 64 plastid genomes resolves relationships in angiosperms and identifies genome-scale evolutionary patterns. Proc. Natl. Acad. Sci. U S A. 104, 19369–19374. doi: 10.1073/pnas.0709121104
Katoh, K., and Standley, D. M. (2013). Mafft multiple sequence alignment software version 7, Improvements in performance and usability. Mol. Biol. Evol. 30, 772–780. doi: 10.1093/molbev/mst010
Kearse, M., Moir, R., Wilson, A., Stones-Havas, S., and Drummond, A. (2012). Geneious basic: an integrated and extendable desktop software platform for the organization and analysis of sequence data. Bioinformatics 28, 1647–1649. doi: 10.1093/bioinformatics/bts199
Kurtz, S., Choudhuri, J. V., Ohlebusch, E., Schleiermacher, C., Stoye, J., and Giegerich, R. (2001). Reputer: the manifold applications of repeat analysis on a genomic scale. Nucleic Acids Res. 29, 4633–4642. doi: 10.1093/nar/29.22.4633
Lee, J. H., Lee, H. J., Kim, K., Lee, S. C., Sung, S. H., and Yang, T. J. (2015). The complete chloroplast genome sequence of zanthoxylum piperitum. Mitochondrial Dna Part A. 27, 3525–3526. doi: 10.3109/19401736.2015.1074201
Li, J. L., Wang, S., Yu, J., Wang, L., and Zhou, S. L. (2013). A modified ctab protocol for plant DNA extraction. Chinese Bull. Botany 48, 72–78. doi: 10.3724/SP.J.1259.2013.00072
Li, S. Q., Wei, Y., Liu, H. Y., Zhang, Z. D., Zhang, Y., Wang, L. H., et al. (2019). Development of chloroplast ssr markers of Zanthoxylum bungeanum and their generality for interspecies and intraspecies. J. Zhejiang A&F University 36:1241.
Li, X., Yang, Y., Henry, R. J., Rossetto, M., Wang, Y., and Chen, S. (2015). Plant DNA barcoding: from gene to genome. Biol. Rev. Cambridge Philos. Soc. 90, 157–166. doi: 10.1111/brv.12104
Liu, C., Shi, L., Zhu, Y., Chen, H., Zhang, J., Lin, X., et al. (2012). Cpgavas: an integrated web server for the annotation, visualization, analysis, and genbank submission of completely sequenced chloroplast genome sequences. Bmc Genom. 13:715. doi: 10.1063/1.2745082
Liu, W., Kong, H., Zhou, J., Fritsch, P. W., Hao, G., and Gong, W. (2018). Complete chloroplast genome of cercis chuniana (fabaceae) with structural and genetic comparison to six species in caesalpinioideae. Int. J. Mol. Sci. 19:1286. doi: 10.3390/ijms19051286
Lohse, M., Drechsel, O., Kahlau, S., and Bock, R. (2013). Organellargenomedraw—a suite of tools for generating physical maps of plastid and mitochondrial genomes and visualizing expression data sets. Nucleic Acids Res. 41, 575–581. doi: 10.1093/nar/gkt289
Millen, R. S., Olmstead, R. G., Adams, K. L., Palmer, J. D., Lao, N. T., Heggie, L., et al. (2001). Many parallel losses of infa from chloroplast DNA during angiosperm evolution with multiple independent transfers to the nucleus. Plant Cell. 13, 645–658. doi: 10.1105/tpc.13.3.645
Nguyen, L. T., Schmidt, H. A., von Haeseler, A., and Minh, B. Q. (2015). Iq-tree: a fast and effective stochastic algorithm for estimating maximum-likelihood phylogenies. Mol. Biol. Evol. 32, 268–274. doi: 10.1093/molbev/msu300
Nock, C. J., Waters, D. L., Edwards, M. A., Bowen, S. G., Rice, N., Cordeiro, G. M., et al. (2011). Chloroplast genome sequences from total DNA for plant identification. Plant Biotechnol. J. 9, 328–333. doi: 10.1111/j.1467-7652.2010.00558.x
Patel, R. K., and Jain, M. K. (2012). Ngs qc toolkit: a toolkit for quality control of next generation sequencing data. PLoS One 7:e30619. doi: 10.1371/journal.pone.0030619
Ronquist, F., Teslenko, M., Der Mark, P. V., Ayres, D. L., Darling, A. E., Hohna, S., et al. (2012). Mrbayes 3.2: efficient bayesian phylogenetic inference and model choice across a large model space. Systematic Biol. 61, 539–542. doi: 10.1093/sysbio/sys029
Rozas, J., Sanchezdelbarrio, J. C., Messeguer, X., and Rozas, R. (2003). Dnasp: DNA polymorphism analyses by the coalescent and other methods. Bioinformatics 19, 2496–2497. doi: 10.1093/bioinformatics/btg359
Shen, J., Ding, X. Y., Zhang, W. M., Bao, S. L., Chang, J., and Tang, F. (2004). Characteristics of cpdna trnl-f sequences of zanthexylum bungeanum maxim. and authentication from its forgeries by those sequences. Chinese Wild Plant Resources 03, 29–32.
Thiel, T., Michalek, W., Varshney, R. K., and Graner, A. (2003). Exploiting est databases for the development and characterization of gene-derived ssr-markers in barley (hordeum vulgare l.). Theoretical Appl. Genet. 106, 411–422. doi: 10.1007/s00122-002-1031-0
Tillich, M., Lehwark, P., Pellizzer, T., Ulbricht-Jones, E. S., Fischer, A., Bock, R., et al. (2017). GeSeq - versatile, and accurate annotation of organelle genomes. Nucleic Acids Res. 45, W6–W11. doi: 10.1093/nar/gkx391
Tu, Y. L., Wei, C. S., Zuo, Z. L., and Lu, Y. M. (2001). A new Zanthoxylum Genus—Z. planipinum var. dingtanensis and the research of its species classification. Guizhou Sci. 19, 77–80.
Wang, F., Yan, K. W., Mei, G. R., Lu, J. Y., Pan, H. H., Chen, H. P., et al. (2016). Authentication of homology of medicine and food huajiao by DNA barcoding sequences. ence Technol. Food Industry 37, 138–141.
Wheeler, G. L., Dorman, H. E., Buchanan, A., Challagundla, L., and Wallace, L. E. (2014). A review of the prevalence, utility, and caveats of using chloroplast simple sequence repeats for studies of plant biology. Appl. Plant ences 2:1400059. doi: 10.3732/apps.1400059
Wicke, S., Schneeweiss, G. M., Depamphilis, C. W., Muller, K. F., and Quandt, D. (2011). The evolution of the plastid chromosome in land plants: gene content, gene order, gene function. Plant Mol. Biol. 76, 273–297. doi: 10.1007/s11103-011-9762-4
Wyman, S. K., Jansen, R. K., and Boore, J. L. (2004). Automatic annotation of organellar genomes with dogma. Bioinformatics 20, 3252–3255. doi: 10.1093/bioinformatics/bth352
Xin-Ye, M. A., Feng, L., Ruo-Ting, Z., Zheng-Zhou, H., and Wei-Wen, C. (2014). Identification of zanthoxylum nitidum and its adulterants and related species through DNA barcodes. J. Southern Agricult. 45, 12–17.
Xue, J., Wang, S., and Zhou, S. L. (2012). Polymorphic chloroplast microsatellite loci in nelumbo (nelumbonaceae). Am. J. Botany 99, e240–e244. doi: 10.3732/ajb.1100547
Xue, S., Shi, T., Luo, W., Ni, X., Iqbal, S., Ni, Z., et al. (2019). Comparative analysis of the complete chloroplast genome among prunus mume, p. Armeniaca, and p. Salicina. Hortic Res. 6, 89–89. doi: 10.1038/s41438-019-0171-1
Zhang, D., Gao, F., Jakovlic, I., Zou, H., Zhang, J., Li, W. X., et al. (2020). Phylosuite: an integrated and scalable desktop platform for streamlined molecular sequence data management and evolutionary phylogenetics studies. Mol. Ecol. Resources 20, 348–355. doi: 10.1111/1755-0998.13096
Zhang, H., Li, C., Miao, H., and Xiong, S. (2013). Insights from the complete chloroplast genome into the evolution of sesamum indicum L. PLoS One 8:e80508. doi: 10.1371/journal.pone.0080508
Zhang, S., Jin, J., Chen, S. Y., Chase, M. W., Soltis, D. E., Li, H. T., et al. (2017). Diversification of rosaceae since the late cretaceous based on plastid phylogenomics. New Phytol. 214, 1355–1367. doi: 10.1111/nph.14461
Zhang, Z., Li, J., Zhao, X. Q., Wang, J., Wong, G. K., and Yu, J. (2006). Kaks_calculator: calculating ka and ks through model selection and model averaging. Genom. Proteom. Bioinform. 4, 259–263. doi: 10.1016/S1672-0229(07)60007-2
Zhao, K., Li, L., Lu, Y., Yang, J., Zhang, Z., Zhao, F., et al. (2020). Characterization and comparative analysis of two rheum complete chloroplast genomes. Biomed. Res. Int. 2020, 1–11. doi: 10.1155/2020/6490164
Zheng, G., Wei, L., Ma, L., Wu, Z., Gu, C., and Chen, K. (2020). Comparative analyses of chloroplast genomes from 13 lagerstroemia (lythraceae) species: identification of highly divergent regions and inference of phylogenetic relationships. Plant Mol. Biol. 102, 659–676. doi: 10.1007/s11103-020-00972-6
Keywords: Zanthoxylum, chloroplast genome, divergent hotspots, DNA barcode sequence, phylogeny
Citation: Zhao K, Li L, Quan H, Yang J, Zhang Z, Liao Z and Lan X (2021) Comparative Analyses of Chloroplast Genomes From 14 Zanthoxylum Species: Identification of Variable DNA Markers and Phylogenetic Relationships Within the Genus. Front. Plant Sci. 11:605793. doi: 10.3389/fpls.2020.605793
Received: 13 September 2020; Accepted: 18 December 2020;
Published: 13 January 2021.
Edited by:
Hui Yao, Chinese Academy of Medical Sciences and Peking Union Medical College, ChinaReviewed by:
Jiang Xu, China Academy of Chinese Medical Sciences, ChinaCopyright © 2021 Zhao, Li, Quan, Yang, Zhang, Liao and Lan. This is an open-access article distributed under the terms of the Creative Commons Attribution License (CC BY). The use, distribution or reproduction in other forums is permitted, provided the original author(s) and the copyright owner(s) are credited and that the original publication in this journal is cited, in accordance with accepted academic practice. No use, distribution or reproduction is permitted which does not comply with these terms.
*Correspondence: Xiaozhong Lan, bGFueGlhb3pob25nQDE2My5jb20=
†These authors have contributed equally to this work
Disclaimer: All claims expressed in this article are solely those of the authors and do not necessarily represent those of their affiliated organizations, or those of the publisher, the editors and the reviewers. Any product that may be evaluated in this article or claim that may be made by its manufacturer is not guaranteed or endorsed by the publisher.
Research integrity at Frontiers
Learn more about the work of our research integrity team to safeguard the quality of each article we publish.