
95% of researchers rate our articles as excellent or good
Learn more about the work of our research integrity team to safeguard the quality of each article we publish.
Find out more
ORIGINAL RESEARCH article
Front. Plant Sci. , 03 December 2020
Sec. Plant Pathogen Interactions
Volume 11 - 2020 | https://doi.org/10.3389/fpls.2020.596271
This article is part of the Research Topic Oxylipins: The Front Line of Plant Interactions View all 13 articles
 Maarten Ameye1,2*
 Lieven Van Meulebroek3
 Bianca Meuninck1
 Lynn Vanhaecke3
 Guy Smagghe2
 Geert Haesaert1
 Kris Audenaert1*
The activation and priming of plant defense upon perception of green leaf volatiles (GLVs) have often been reported. However, information as to which metabolic pathways in plants are affected by GLVs remains elusive. We report the production of reactive oxygen species in the tip of young wheat leaves followed by activation of antioxidant-related enzyme activity. In this study, we aimed to uncover metabolic signatures upon exposure to the GLV Z-3-hexenyl acetate (Z-3-HAC). By using an untargeted metabolomics approach, we observed changes in the phenylpropanoid pathways which yield metabolites that are involved in many anti-oxidative processes. Furthermore, exposure to GLV, followed by infection with Fusarium graminearum (Fg), induced significantly greater changes in the phenylpropanoid pathway compared to a sole Z-3-HAC treatment. Fragmentation of a selection of metabolites, which are significantly more upregulated in the Z-3-HAC + Fg treatment, showed D-glucose to be present as a substructure. This suggests that Z-3-HAC induces early glycosylation processes in plants. Additionally, we identified the presence of hexenyl diglycosides, which indicates that aerial Z-3-HAC is metabolized in the leaves by glycosyltransferases. Together these data indicate that GLV Z-3-HAC is taken up by leaves and incites oxidative stress. This subsequently results in the modulation of the phenylpropanoid pathway and an induction of glycosylation processes.
The production of biogenic volatile organic compounds is one of the defense strategies that plants mount at the advent of an attack by a pathogen or insect or by wounding (Dudareva et al., 2013). Green leaf volatiles (GLVs) are quickly (within seconds to minutes) produced upon biotic stress and can subsequently be perceived by neighboring plants (Fall et al., 1999; Ameye et al., 2018). GLVs have often been described to play an important role in the defense of plants against deleterious insects (Turlings et al., 1991; Scala et al., 2013), pathogens (Nakamura and Hatanaka, 2002; Kishimoto et al., 2008) and abiotic stress (Yamauchi et al., 2015) by direct activation or by priming for enhanced defense (Engelberth et al., 2004; Ameye et al., 2015; Dombrowski et al., 2019). Being produced upon mechanical or biotic damage, GLVs have been assigned a role as long distance damage-associated molecular patterns, eliciting defense response (Quintana-Rodriguez et al., 2018). Recently, another defensive role for GLVs has been uncovered: GLV esters induce stomatal closure in several crops, thereby preventing infection by pathogens, as was shown for Pseudomonas syringae pv. tomato DC3000 in tomato (López-Gresa et al., 2018).
Despite its widespread occurrence throughout the plant kingdom, it remains enigmatic via which mechanism GLV perception and signal transduction occur (Heil, 2014; Ameye et al., 2018). However, there is evidence that GLVs influence the redox status of plants and hence induce plant stress responses (Cofer et al., 2018). Among the early reactions are plasma membrane potential depolarization, followed by an increase in cytosolic [Ca2+] which, in turn, activates respiratory burst oxidase homologs (Asai et al., 2009; Zebelo et al., 2012). A transcriptomics study showed that Z-3-HOL induced the expression of genes involved in transcriptional regulation, lipid signaling, and cell wall reinforcement in maize (Engelberth et al., 2013). In Arabidopsis, it has been reported that, following exposure to GLV E-2-hexenal, one-third of the upregulated genes were unique and unrelated to plant hormones (Mirabella et al., 2015).
In a previous work, we have demonstrated that pre-exposure of wheat to Z-3-hexenyl acetate (Z-3-HAC) leads to enhanced defense against the hemi-biotrophic fungus Fusarium graminearum (Schwabe), a causal agent of the cereal disease fusarium head blight (Ameye et al., 2015). This enhanced defense coincided with a suppression of salicylic acid (SA)-related defense during the biotrophic phase of the fungus at 24 h after inoculation (hai) and an increase in JA-related defense during the necrotrophic phase of the fungus at 48 hai. However, to better understand which defense mechanisms were influenced upon Z-3-HAC exposure, a more detailed analysis of earlier plant responses is necessary.
Omics techniques, such as proteomics and metabolomics, are indispensable to bridge the genotype–phenotype gap (Patti et al., 2012; Feussner and Polle, 2015; Hong et al., 2016). Whereas proteins can be modified post-translationally, metabolites represent intermediary and downstream biochemical products and serve as signatures of metabolic pathways (Patti et al., 2012). The application of metabolomics in plant physiology is gaining traction. However, because of the lack of annotated databases, metabolite identification remains a major limitation for non-targeted plant metabolomics (Creek et al., 2014; Feussner and Polle, 2015; Razzaq et al., 2019). Consequently, current phytometabolome pathways are mostly restricted to genome-reconstructed pathways (Kind et al., 2009; Feussner and Polle, 2015). Due to this bottleneck, many studies have, in addition to untargeted analysis, also focused on how plant metabolites from a priori chosen pathways change in response to pathogen infections (Urano et al., 2009; Ward et al., 2010; Mhlongo et al., 2016).
As plant–pathogen interactions consist of a tightly regulated dynamic and transient activation of defense pathways, an analysis of the early effects of Z-3-HAC on plant defense is designated to uncover the changes in the plant metabolome. Using an untargeted metabolomics approach, we aimed to reveal hitherto unknown priming mechanisms by Z-3-HAC, which may aid in better understanding how the plants’ metabolome changes after perceiving GLVs from the environment and how biological functionalities are controlled.
To test the effect of Z-3-HAC on plant health and reactive oxygen species (ROS) production, wheat seeds (var. Sahara, AVEVE, Belgium) were sterilized in NaOCl (14%) for 5 min and rinsed three times with distilled water and placed in 1.5 L glass jars filled with 250 mL growth medium [4.4 g L–1 MS salts with vitamins (Duchefa Biochemie, Haarlem, Netherlands), 10 g L–1 sucrose, and 8 g L–1 plant agar (Duchefa Biochemie, Haarlem, Netherlands)] at pH 5.7. After 1 week, the plants were exposed to 50 μM (corresponding to 5.9 g m–3) Z-3-HAC by pipetting 9.9 μL on a piece of sterile filter paper placed inside the pot, followed by closing the lid and sealing it off with PTFE tape. At 0, 1, 2, 6, and 8 h after exposure (hae), the plants were removed from the jars, and multispectral images were taken.
To automatically measure the effect of Z-3-HAC exposure on the health of wheat seedlings, we employed a custom-built phenotyping platform equipped with a multispectral camera (CropReporter, Phenovation, Wageningen, Netherlands). The color images and the maximum efficiency of PSII (Fv/Fm) (Baker, 2008) were measured according to the manufacturer’s specifications. To detect H2O2 accumulation, staining by 3,3-diaminobenzidine (DAB) was executed according to the protocol of Thordal-Christensen et al. (1997), with minor modifications from De Vleesschauwer et al. (2010).
The expression of genes involved in ROS production and quenching was measured using RT-qPCR. RNA from the leaf sheaths was extracted using TRI reagent (Sigma-Aldrich) according to the manufacturer’s specifications and quantified with a fluorometer (Quantus, Promega Benelux, Leiden, Netherlands). First-strand complementary DNA was synthesized from 500 ng of total RNA using the Goscript kit (Promega Benelux, Leiden, Netherlands). The primers used for quantitative reverse transcription (qRT)-PCR analysis are listed in Supplementary Table 1. RT-qPCR analysis was performed using a CFX96 system (Bio-Rad). The thermal profile consisted of an initial denaturation step for 2 min at 95°C, followed by 40 cycles of 95°C for 15 s and 60°C for 60 s. Finally, melting curve analysis was performed using a temperature profile of 95°C for 10 s, cooling to 65°C for 5 s, and subsequently heating to 95°C at a rate of 0.5°C per 10 s. Normalization of wheat defense genes was carried out using cell division control protein (Ta54227) and actin (Ta35284) as reference genes (Paolacci et al., 2009). All calculations and analyses of the quality of the reference genes were performed using qBase + software (Biogazelle, Zwijnaarde, Belgium).
Superoxide dismutase (706002, Cayman Chemical) and catalase enzyme activity (70002, Cayman Chemical) and phenolic content (K527, BioVision) were measured using colometric assays according to the manufacturer’s specifications. Enzyme activity and phenolic content were normalized to the amount of protein measured according to the manufacturer’s specifications (Roti Nanoquant, Carl Roth GmbH, Karlsruhe, Germany).
A total of 100 mg of 6–8 pooled leaf sheaths from the leaf sheath assay was crushed using liquid nitrogen. Afterward, 1 mL of cold (−20°C) modified Bieleski extraction buffer consisting of methanol, ultrapure water, and formic acid (75:20:5, v/v/v) was added. Additionally, the suspension was amended with a deuterium-labeled internal standard of 100 pg μL–1 d6-abscisic acid (OlChemIm, Olomouc, Czech Republic). The samples were vortexed and placed at −20°C for 12 h of cold extraction. The samples were centrifuged for 10 min at 10,000 rpm, and 500 μL of the supernatant was transferred to a 30 kDa Amicon® Ultra centrifugal filter unit (Merck, Millipore Corporation, MA, United States). Finally, the extract was transferred to a high-performance liquid chromatography (HPLC) vial. Samples of different treatments were placed in the ultra-HPLC coupled to high-resolution tandem mass spectrometry (UHPLC–HRMS/MS) system in a randomized manner. Finally, 10 μL was injected directly on the column for UHPLC–HRMS/MS analysis. Two quality control (QC) samples were prepared by using aliquots of 10 randomly chosen samples, representing the different treatments. QC samples were run after each set of 10 samples and were used to correct for possible chromatographic and mass spectrometric variations.
The UHPLC–HRMS/MS system consisted of an Dionex UltiMate 3000 XRS UHPLC pumping system (Thermo Fisher Scientific, San Jose, CA, United States), coupled to a Q-ExactiveTM hybrid quadrupole-Orbitrap mass spectrometer (Thermo Fisher Scientific, San Jose, CA, United States), being equipped with a heated electrospray ionization source (HESI-II) that was operated in switching polarity mode. The instrumental parameters for HESI-II ionization and mass spectrometric detection can be found in Van Meulebroek et al. (2012). Chromatographic separation of the compounds was achieved with a gradient elution program using a reversed phase Nucleodur Gravity C18 column (1.8 μm, 50 mm × 2.1 mm ID) (Macherey-Nagel, Düren, Germany). The mobile phase consisted of a binary solvent system: 0.1% formic acid in ultrapure water (solvent A) and methanol (solvent B) at a constant flow rate of 300 μL min–1. A linear gradient profile with the following proportions (v/v) of solvent A was applied: 0–1 min at 98%, 1–2.50 min from 98 to 60%, 2.50–4 min from 60 to 50%, 4–5 min from 50 to 20%, 5–7 min at 20%, 7–7.10 min from 20 to 0%, 7.10–8 min at 0%, and 8–8.01 min from 0 to 98%, followed by 2 min of re-equilibration. The column oven temperature was set at 30°C. Phytohormones were identified based on both the retention time relative to the internal standard and accurate mass (m/z) using an analytical standard (Supplementary Table 2) (OlChemIm, Olomouc, Czech Republic). Instrument control and data processing were carried out by Xcalibur 3.1 software (Thermo Fisher Scientific, San Jose, CA, United States). For HRMS-MS, parallel reaction monitoring was used. An isolation window of 0.5 m/z was used, and ions were fragmented at 35 eV in the collision cell.
In order to get an initial grasp of the pathways which are affected by the different treatments, we employed the mummichog algorithm (Li et al., 2013). This algorithm permitted to functionally characterize metabolites and map metabolite features from our HPLC-MS analysis to current metabolic models and to assess the significance and enrichment of metabolic pathways. For this, we used the MS Peaks to Pathways module in MetaboAnalyst (V4.0) (Chong et al., 2018). The molecular weight tolerance was set at 5 ppm. The P-value cutoff was 0.01, and the Kyoto Encyclopedia of Genes and Genomes (KEGG) pathway library was chosen, with Oryza sativa japonica as the model organism for monocotylydonous plants.
To identify metabolites which are differentially produced upon Z-3-HAC exposure, we employed the chemometrics strategy previously described in Van Meulebroek et al. (2015). A first step concerned the characterization of detected metabolite features in terms of retention time, m/z value, and abundance along the various samples. To this end, SieveTM 2.1 (Thermo Fisher Scientific, San Jose, CA, United States) was used. Full-scan data were provided as input, and the following settings were applied: an m/z range of 100–800 Da, an m/z width of 5 ppm, a retention time range of 1.5–9.0 min, a peak intensity threshold of 106 arbitrary units, a maximum peak width of 0.5 min, and a maximum number of 15,000 frames. This step was preceded by a peak alignment process to correct for inherent chromatographic variability, thereby allowing a maximum retention time shift of 0.2 min. This step rendered 4,310 metabolite features for the positive ionization mode and 1,145 for the negative ionization mode.
Metabolite features and their abundances were used to construct predictive models, implementing multivariate data analysis techniques such as principal component analysis (PCA) and orthogonal partial least squares discriminant analysis (OPLS-DA) using SIMCATM 15 software (Umetrics, Malmö, Sweden). Hereby Pareto scaling and log transformation were applied to standardize the range of independent X variables and induce normality, respectively. For OPLS-DA, supervised models were established to classify samples according to their treatment and time points (Table 1). Model validity was tested with CV-ANOVA (P < 0.05) and permutation testing (n = 100). Additionally, according to Triba et al. (2015), a good OPLS-DA model should have Q2(Y) > 0.5. It was concluded that the OPLS-DA models, as obtained for the positively ionized fingerprints, were valid and showed good predictability, which was not the case for the models that were constructed based on the negatively ionized metabolite features. In the following step, we selected the metabolites that contributed most to the predictability of the model by evaluating the variable importance in projection (VIP) scores (> 1), Jack-knifed confidence intervals (not across zero), and S-plots (| correlation p(corr)| > 0.5 and | covariance p| > 0.04) (Supplementary Figure 5). As such, we initially retained 103 metabolite features. We further narrowed down this selection to a final number of 13 unique metabolites representing the highest VIP and S-plot scores. Hereby we also assessed whether a particular peak was not wrongly assigned various feature identity labels by SIEVETM and whether isotopes or different adducts of the same metabolite were present. Metabolites that were only important at a single time point were also omitted from further analysis.
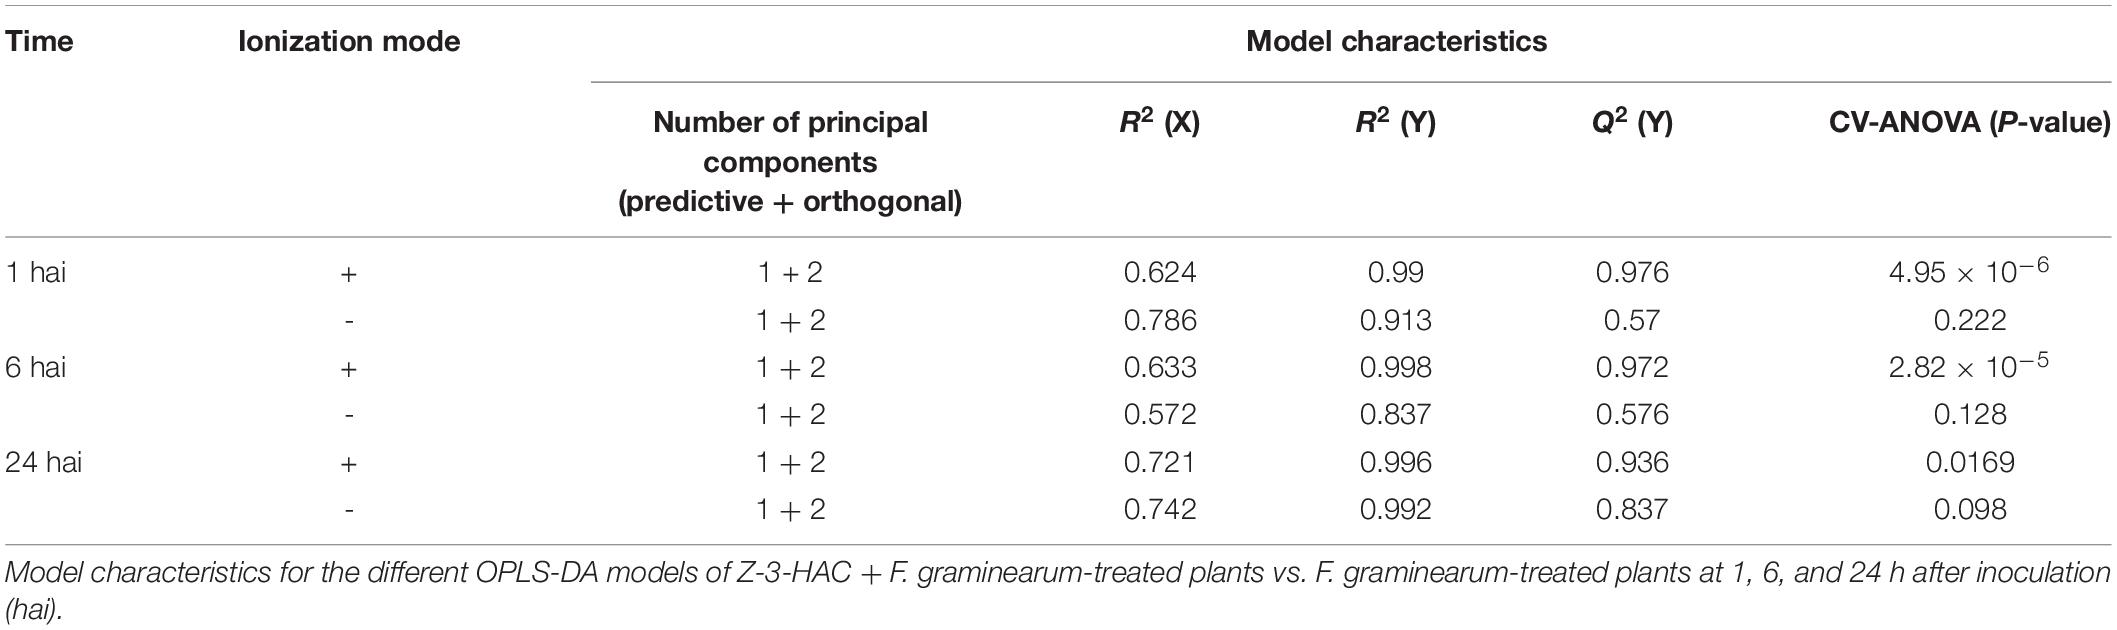
Table 1. Orthogonal partial least squares discriminant analysis (OPLS-DA) models based on the metabolite features from the positive ionization mode provide better predictability compared to the negative ionization mode.
Tentative identification of the retained selection of metabolites was performed using different data sources, i.e., isotope pattern, accurate mass (m/z), and HRMS/MS fragmentation pattern. For this purpose, Sirius software (Version 4.0.1, Jena, Germany) (Böcker and Dührkop, 2016) and the MetFrag web application (Ruttkies et al., 2016), linked to the public databases ChemSpider (Royal Society of Chemistry), PubChem (National Center for Biotechnology Information), and KEGG (Kyoto Encyclopedia of Genes and Genomes), were used.
Data were analyzed and visualized by usage of SPSS (Version 22.0, IBM Corp., Armonk, NY, United States) and R (R Core Team, 2013).
In order to study changes in the metabolome upon Z-3-HAC exposure and a subsequent F. graminearum infection, unless stated otherwise, four different treatments were used: (1) a control treatment, (2) a treatment in which wheat plants were exposed to Z-3-HAC, (3) a treatment in which Z-3-HAC-exposed wheat plants were subsequently challenged with a conidia suspension of F. graminearum, and (4) a treatment in which non-exposed plants were challenged with a conidia suspension of F. graminearum.
F. graminearum 8/1, containing a green fluorescent protein coding gene (Jansen et al., 2005), was used in this study. The strain was grown on potato dextrose agar for 10 days at 21°C under a regime of 12 h of dark and 12 h of combined UVC and UVA light (2 × TUV 8W T5 and 1 × TL 8W BLB; Philips). Macroconidia were harvested by adding 0.01% (v/v) Tween 80 to the Petri dishes and rubbing the mycelium with a sterile Drigalski spatula. Afterward, the suspension was adjusted to a final concentration of 105 conidia mL–1.
Two weeks old winter wheat seedlings (var. Sahara) were exposed overnight to Z-3-HAC using a custom-built exposure system previously described in Ameye et al. (2015). The open flow system consisted of four nalophan bags which were supplied with purified air. In two of the bags (treatment 2 + 3), 70 μL of pure Z-3-HAC (Sigma-Aldrich) was applied to a piece of filter paper, thus avoiding direct contact with the plant. In the two other bags (treatment 1 + 4), distilled water was used. As nalophan bags were consistently flushed, the aerial concentrations of Z-3-HAC reached maximum values of 100 μM, which rapidly declined within minutes. Even though wheat seedlings were exposed to a high concentration of Z-3-HAC, the aerial Z-3-HAC concentration declined very rapidly to previously reported concentrations (Wenda-Piesik et al., 2010; Piesik et al., 2011). As stated by Matsui et al. (2012), aqueous concentrations of GLVs within cells can reach values up to 1 mM. Thus, using a high concentration for a short period of time mimics GLV concentrations in damaged cells (Heil, 2014). On the following morning, the seedlings were taken out of the bags and used in the infection described in Koga et al. (2004). Leaf sheaths were carefully peeled of the stem and subsequently inoculated with 10 μL of a conidia suspension (105 conidia mL–1). At different time points, samples were taken and flash-frozen in liquid nitrogen. The samples were stored at −80°C until analysis.
Wheat seedlings were exposed in a closed environment to Z-3-HAC in order to investigate its effects on Fv/Fm values as a proxy for plant health. Two-way ANOVA revealed that there was an effect of the treatment (P < 0.001) and time after exposure (P < 0.001) and that there was an interaction between these factors (P < 0.001). Multispectral images revealed that, at 1 hae, Fv/Fm already started to decline, which continued until 8 hae (Figure 1A), of which the effect was significantly greater in Z-3-HAC-treated plants compared to the control plants. This effect on Fv/Fm values was only situated at the top of the leaves and does not further migrate downwards in the leaves (Figure 1B). Further microscopic analysis using DAB staining revealed that this decline in Fv/Fm values could be attributed to H2O2 accumulation surrounding the stomata which induced oxidative damage (Figure 1C). To examine this further in detail, we performed RT-qPCR (Figure 2A) and enzyme activity assays (Figure 2B) of genes and enzymes involved in ROS production and quenching by the wheat seedlings at 1 and 6 hae. The upper part of the leaf which showed reductions in Fv/Fm was selected. Genes TaRBOH1 and TaRBOH3, responsible for O2– production, had a 16.1-fold (P = 0.003) and 5.4-fold (P = 0.049) increase at 1 hae and 4.7-fold (P = 0.136) and 7.5-fold (P = 0.069) at 6 hae, respectively, upon Z-3-HAC exposure. Concurrently, superoxide dismutase CuSOD (P = 0.010) and MnSOD (P = 0.011), which react with 2O2– to form H2O2, were significantly downregulated at 6 hae. CAT, coding for catalase, which reacts with H2O2 to form H2O and O2, was significantly downregulated at 1 hae (P = 0.024) (Figure 2A). Additionally, the gene ascorbate peroxidase (APX) was downregulated at 1 hae (P = 0.003). Glutathione peroxidase (GPX) was significantly downregulated at 6 hae (P = 0.048) (Figure 2A). When we look at enzyme activity, for SOD, we saw a significant effect of treatment (P = 0.006) and time (P = 0.044), but no interaction using a two-way ANOVA. Post hoc analysis showed that, at 6 hae, SOD activity was significantly higher in the Z-3-HAC treatment compared to the control (+ 86.8%, P = 0.036) at 6 hae. The two-way ANOVA for CAT activity revealed a significant effect of the treatment (P = 0.02), but not of the time after exposure (P = 0.370); also no interaction between the treatment and hae was present (P = 0.144). Post hoc analysis showed a significantly higher CAT activity (+ 117%, P = 0.048) upon Z-3-HAC exposure (Figure 2B) at 6 hae. Additionally, two-way ANOVA of the phenolic content, which is also implicated in the quenching of oxidative stress, revealed an effect of treatment (P = 0.001) and time (P = 0.001), and an interaction was present between treatment and time (P = 0.018). At 6 hae, phenolics were significantly higher in seedlings exposed to Z-3-HAC at 6 hae (+ 152%, P = 0.009) compared to the control treatment, and in the Z-3-HAC treatment, phenolic content was higher at 6 hae compared to that at 1 hae (+ 153%, P = 0.009) (Figure 2B).
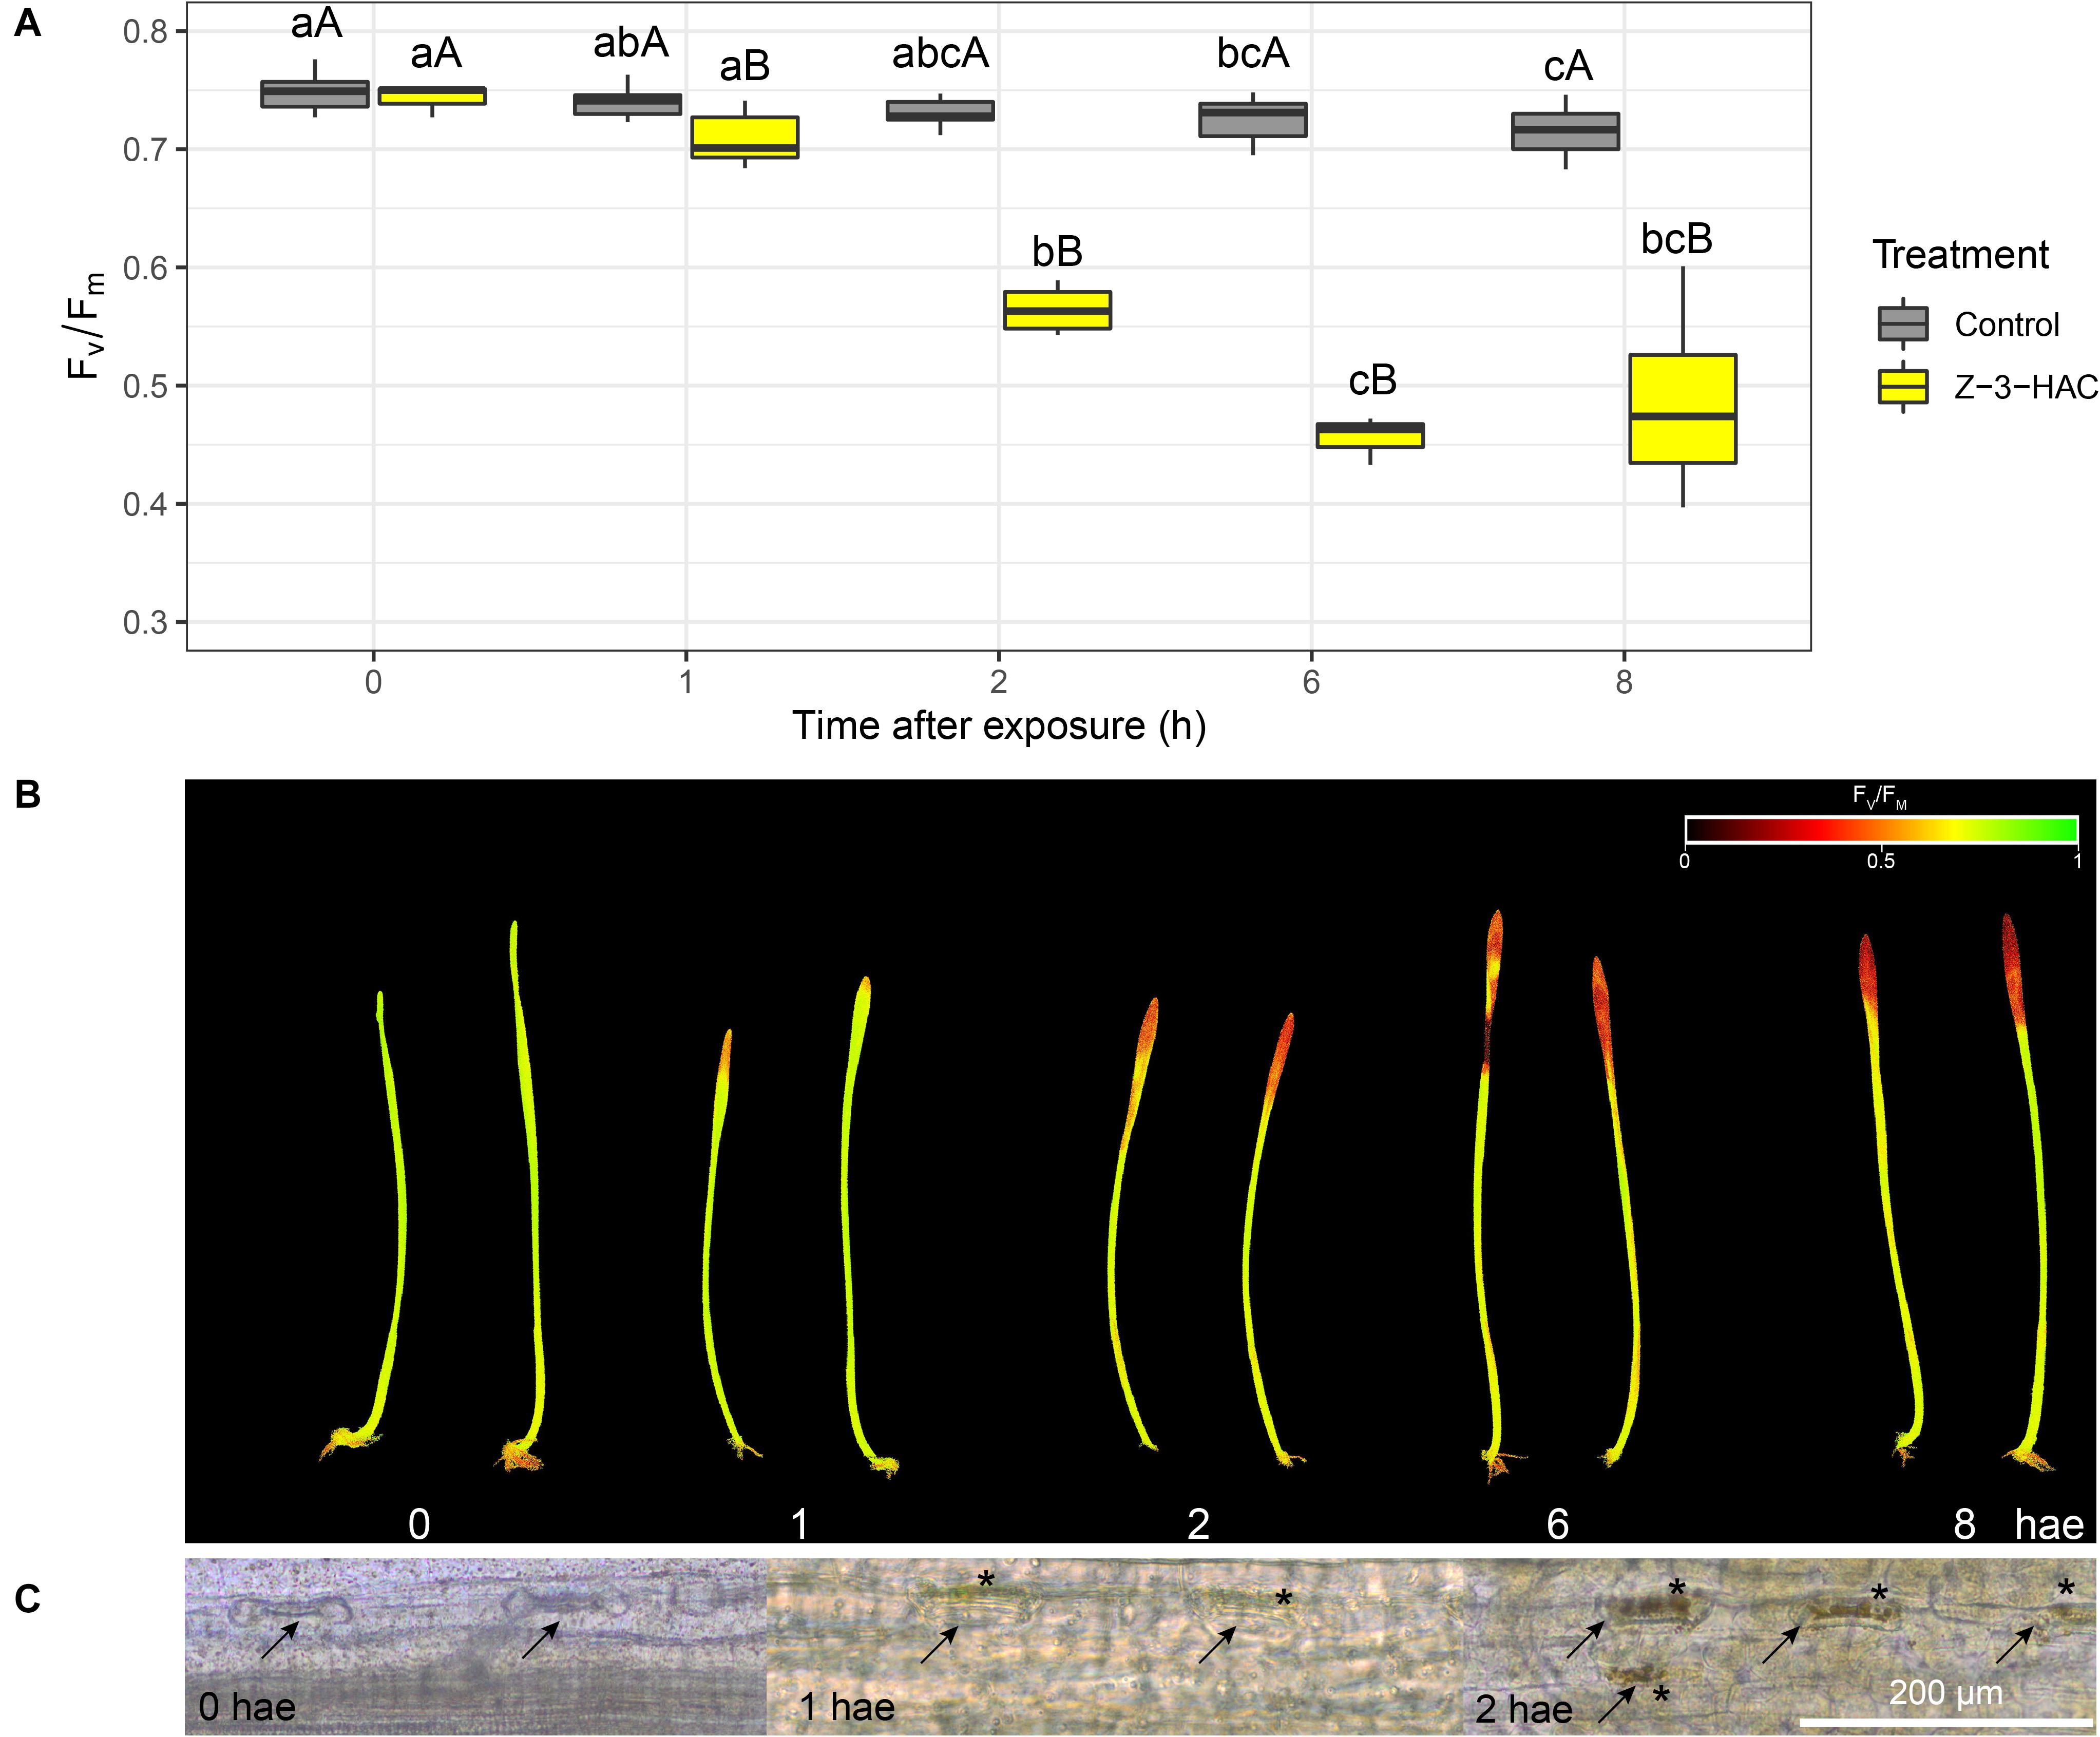
Figure 1. Exposure to 50 μM Z-3-hexenyl acetate results in an initial decline in maximum efficiency of photosystem II (Fv/Fm) in 2 weeks old wheat plants concurrent with an accumulation of H2O2 around the stomata in the top of the leaves. (A) Fv/Fm values (n = 4 per time point) at different time points. Different lowercase letters above the box plots indicate significant differences between the time points per treatment level (Tukey’s HSD test, α = 0.05). Different uppercase letters indicate significant differences between the treatments per time point (two-sample t-test, α = 0.05). (B) Corresponding images of the Z-3-HAC-treated leaves with the Fv/Fm values depicted using a continuous color scale. (C) Microscopic images of the stomata in which the H2O2 is shown to accumulate using 3,3-diaminobenzidine (DAB) staining. Arrows indicate the stomata, and asterisks depict locations of DAB accumulation.
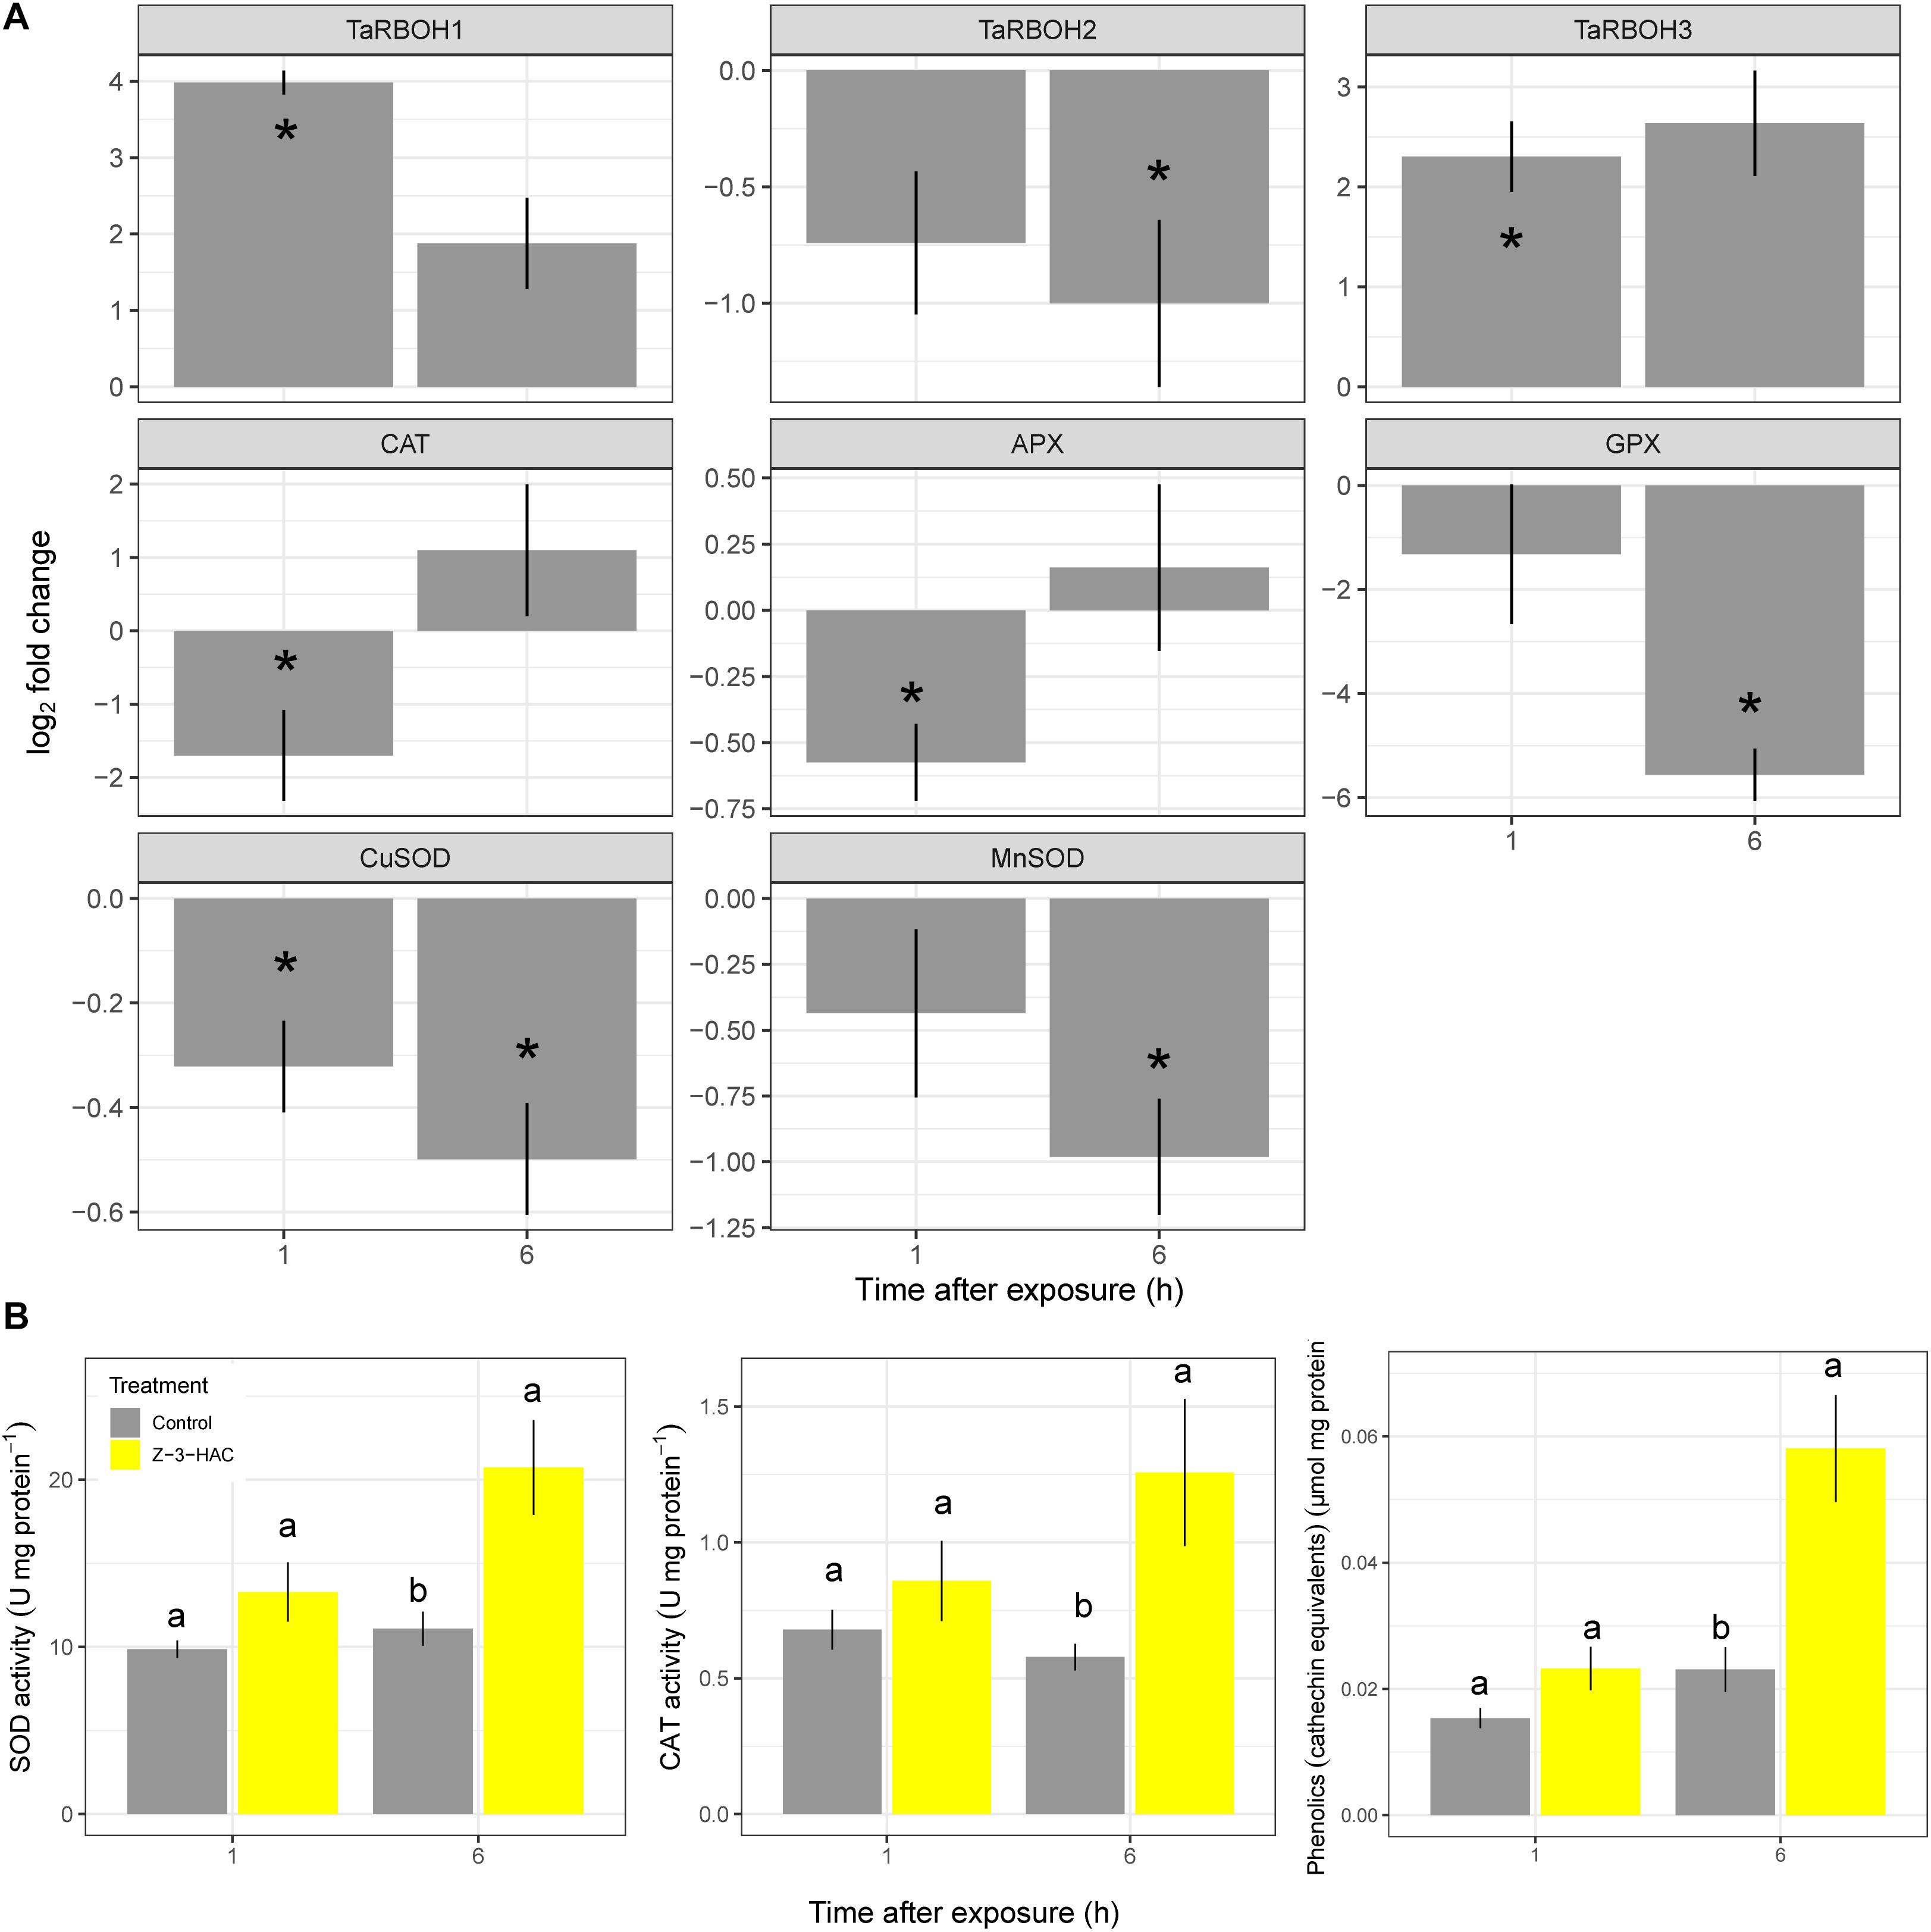
Figure 2. Gene expression (A) and enzyme activity (B) of processes involved in the production and quenching of reactive oxygen species after exposure to Z-3-HAC. (A) Bars represent the log2-transformed means of four biological replicates, each consisting of three pooled upper part of leaves showing reductions in Fv/Fm. Fold change was calculated by dividing the CNRQ values of the Z-3-HAC-treated leaves to the control leaves. Asterisks depict significant changes (one-sample t-test, α = 0.05). (B) Bars represent the means of four biological replicates from the same samples used for the RT-qPCR. Enzyme activity and phenolics content were normalized to the amount of protein present. Different uppercase letters above the box plots indicate significant differences between the time points per treatment (two-sample t-test, α = 0.05) Different lowercase letters above the box plots indicate significant differences between the treatments per time point (two-sample t-test, α = 0.05).
The previous results indirectly show the production of phenolic compounds in response to ROS accumulation. Several groups of plant metabolites have already been reported to be involved in the quenching of oxidative stress in plants such as phenolic compounds, carotenoids (Havaux, 2014), ascorbate (Caverzan et al., 2012), and glutathione (Szalai et al., 2009) among others (Škerget et al., 2005; Dai and Mumper, 2010; Akinwumi et al., 2018). However, a more holistic approach is warranted to elucidate the effects of Z-3-HAC exposure to wheat. Therefore, to uncover more detailed specific changes in the metabolome of wheat seedlings upon exposure to Z-3-HAC, we performed an untargeted metabolomics analysis. For this, the mummichog algorithm was chosen to functionally characterize unknown metabolites and assess which metabolic pathways in wheat were significantly changed. For this experiment, we used an open-flow system previously used in Ameye et al. (2015) to mimic sudden bursts in GLV production following foliar damage. At 1 hae, we observed the highest significant change in the metabolite content of compounds of the phenylpropanoid pathway, followed by ascorbate and aldarate metabolism, glutathione, stilbenoid, diarylheptanoid, and gingerol biosynthesis, and betalain biosynthesis, which are all involved in the quenching of oxidative stress in plants (Figure 3). At 6 hae, the pathways which were significantly up- or down-regulated are involved in the biosynthesis of phenylpropanoids, phenylalanine tyrosine and tryptophan, and isoquinoline alkaloids (Figure 3).
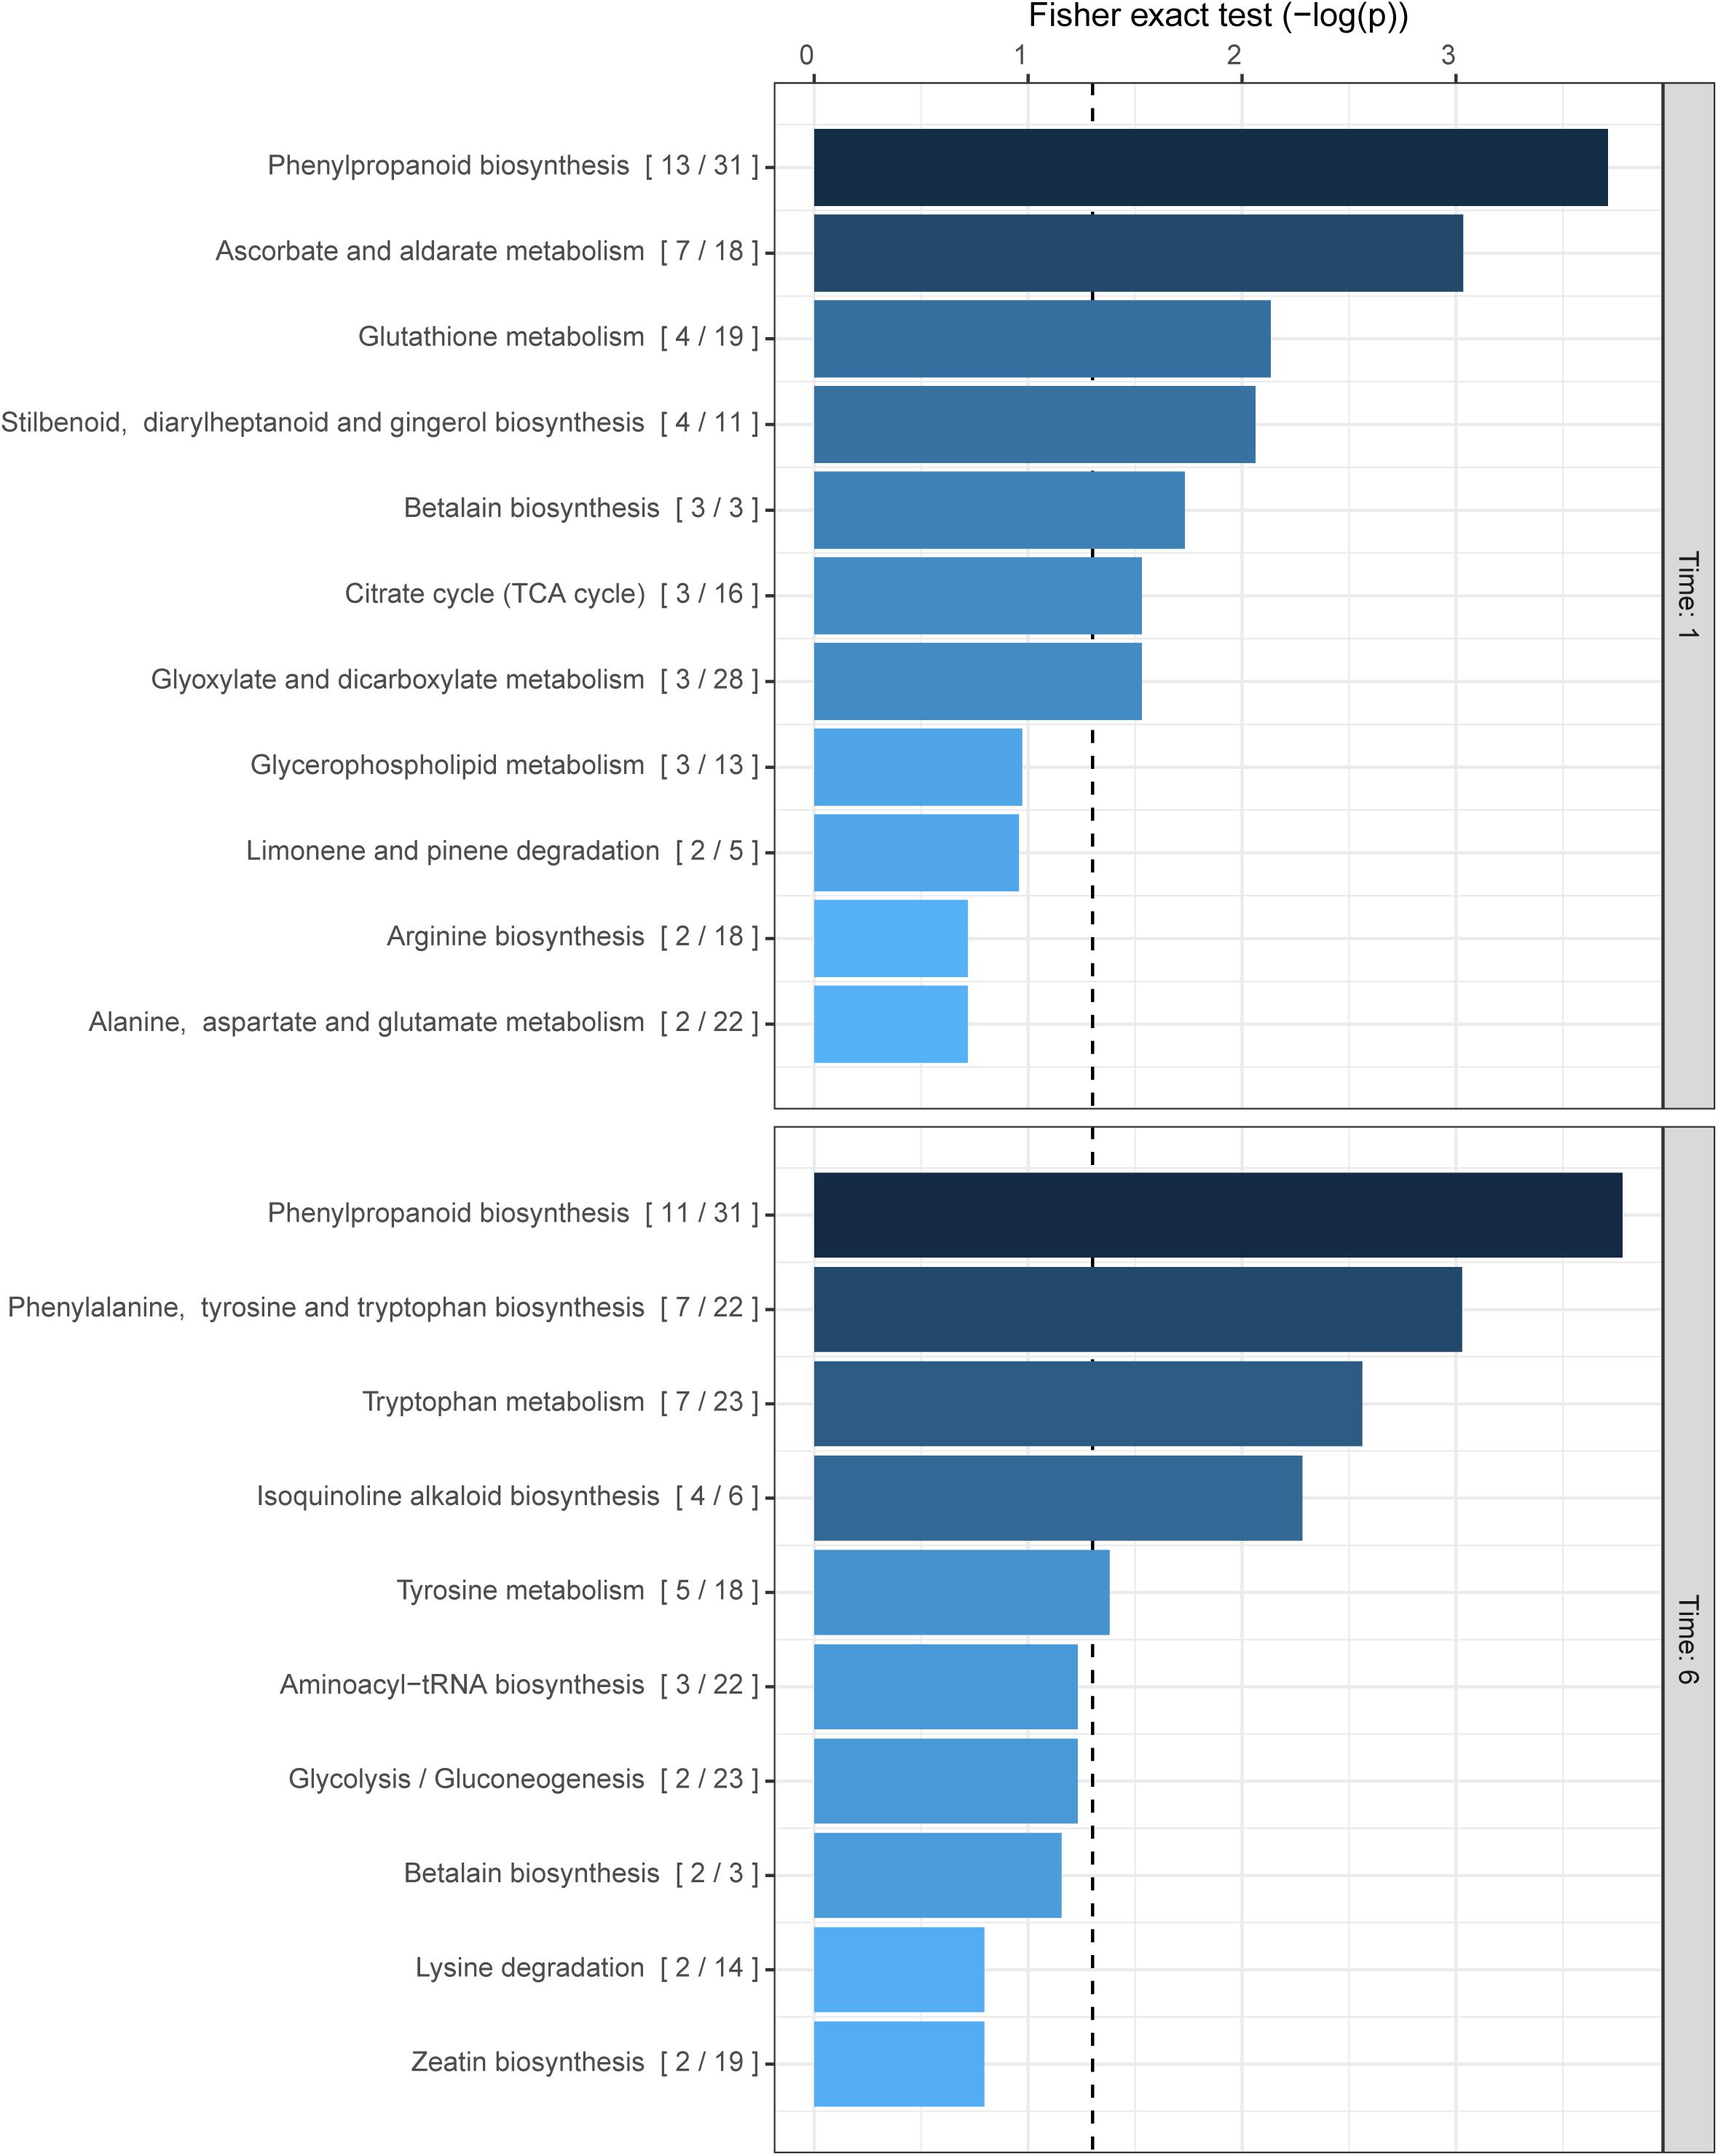
Figure 3. Biochemical pathways in wheat which are affected by exposure to Z-3-HAC after 1 and 6 h. The mummichog algorithm was used on the m/z dataset of six biological replicates per treatment per time point. The ratio in brackets represents the number of significant matches to the total number of matched compounds in the pathway. Bars next to pathways represent the p-value of the Fisher exact test which represents the significance of change in the pathway following exposure to Z-3-HAC. The dashed line represents a p-value of 0.05.
As we were primarily interested in the additional effect of pre-treating plants with Z-3-HAC on the metabolome following an infection with Fg, we compared the dataset of the Z-3-HAC + Fg treatment to the dataset of the Z-3-HAC treatment alone and the Fg treatment alone (Figure 4). This allowed us to distinguish the effects of the sole treatments Z-3-HAC and Fg, respectively, and to identify pathways which were more or less upregulated in plants that were pre-treated with Z-3-HAC and subsequently infected.
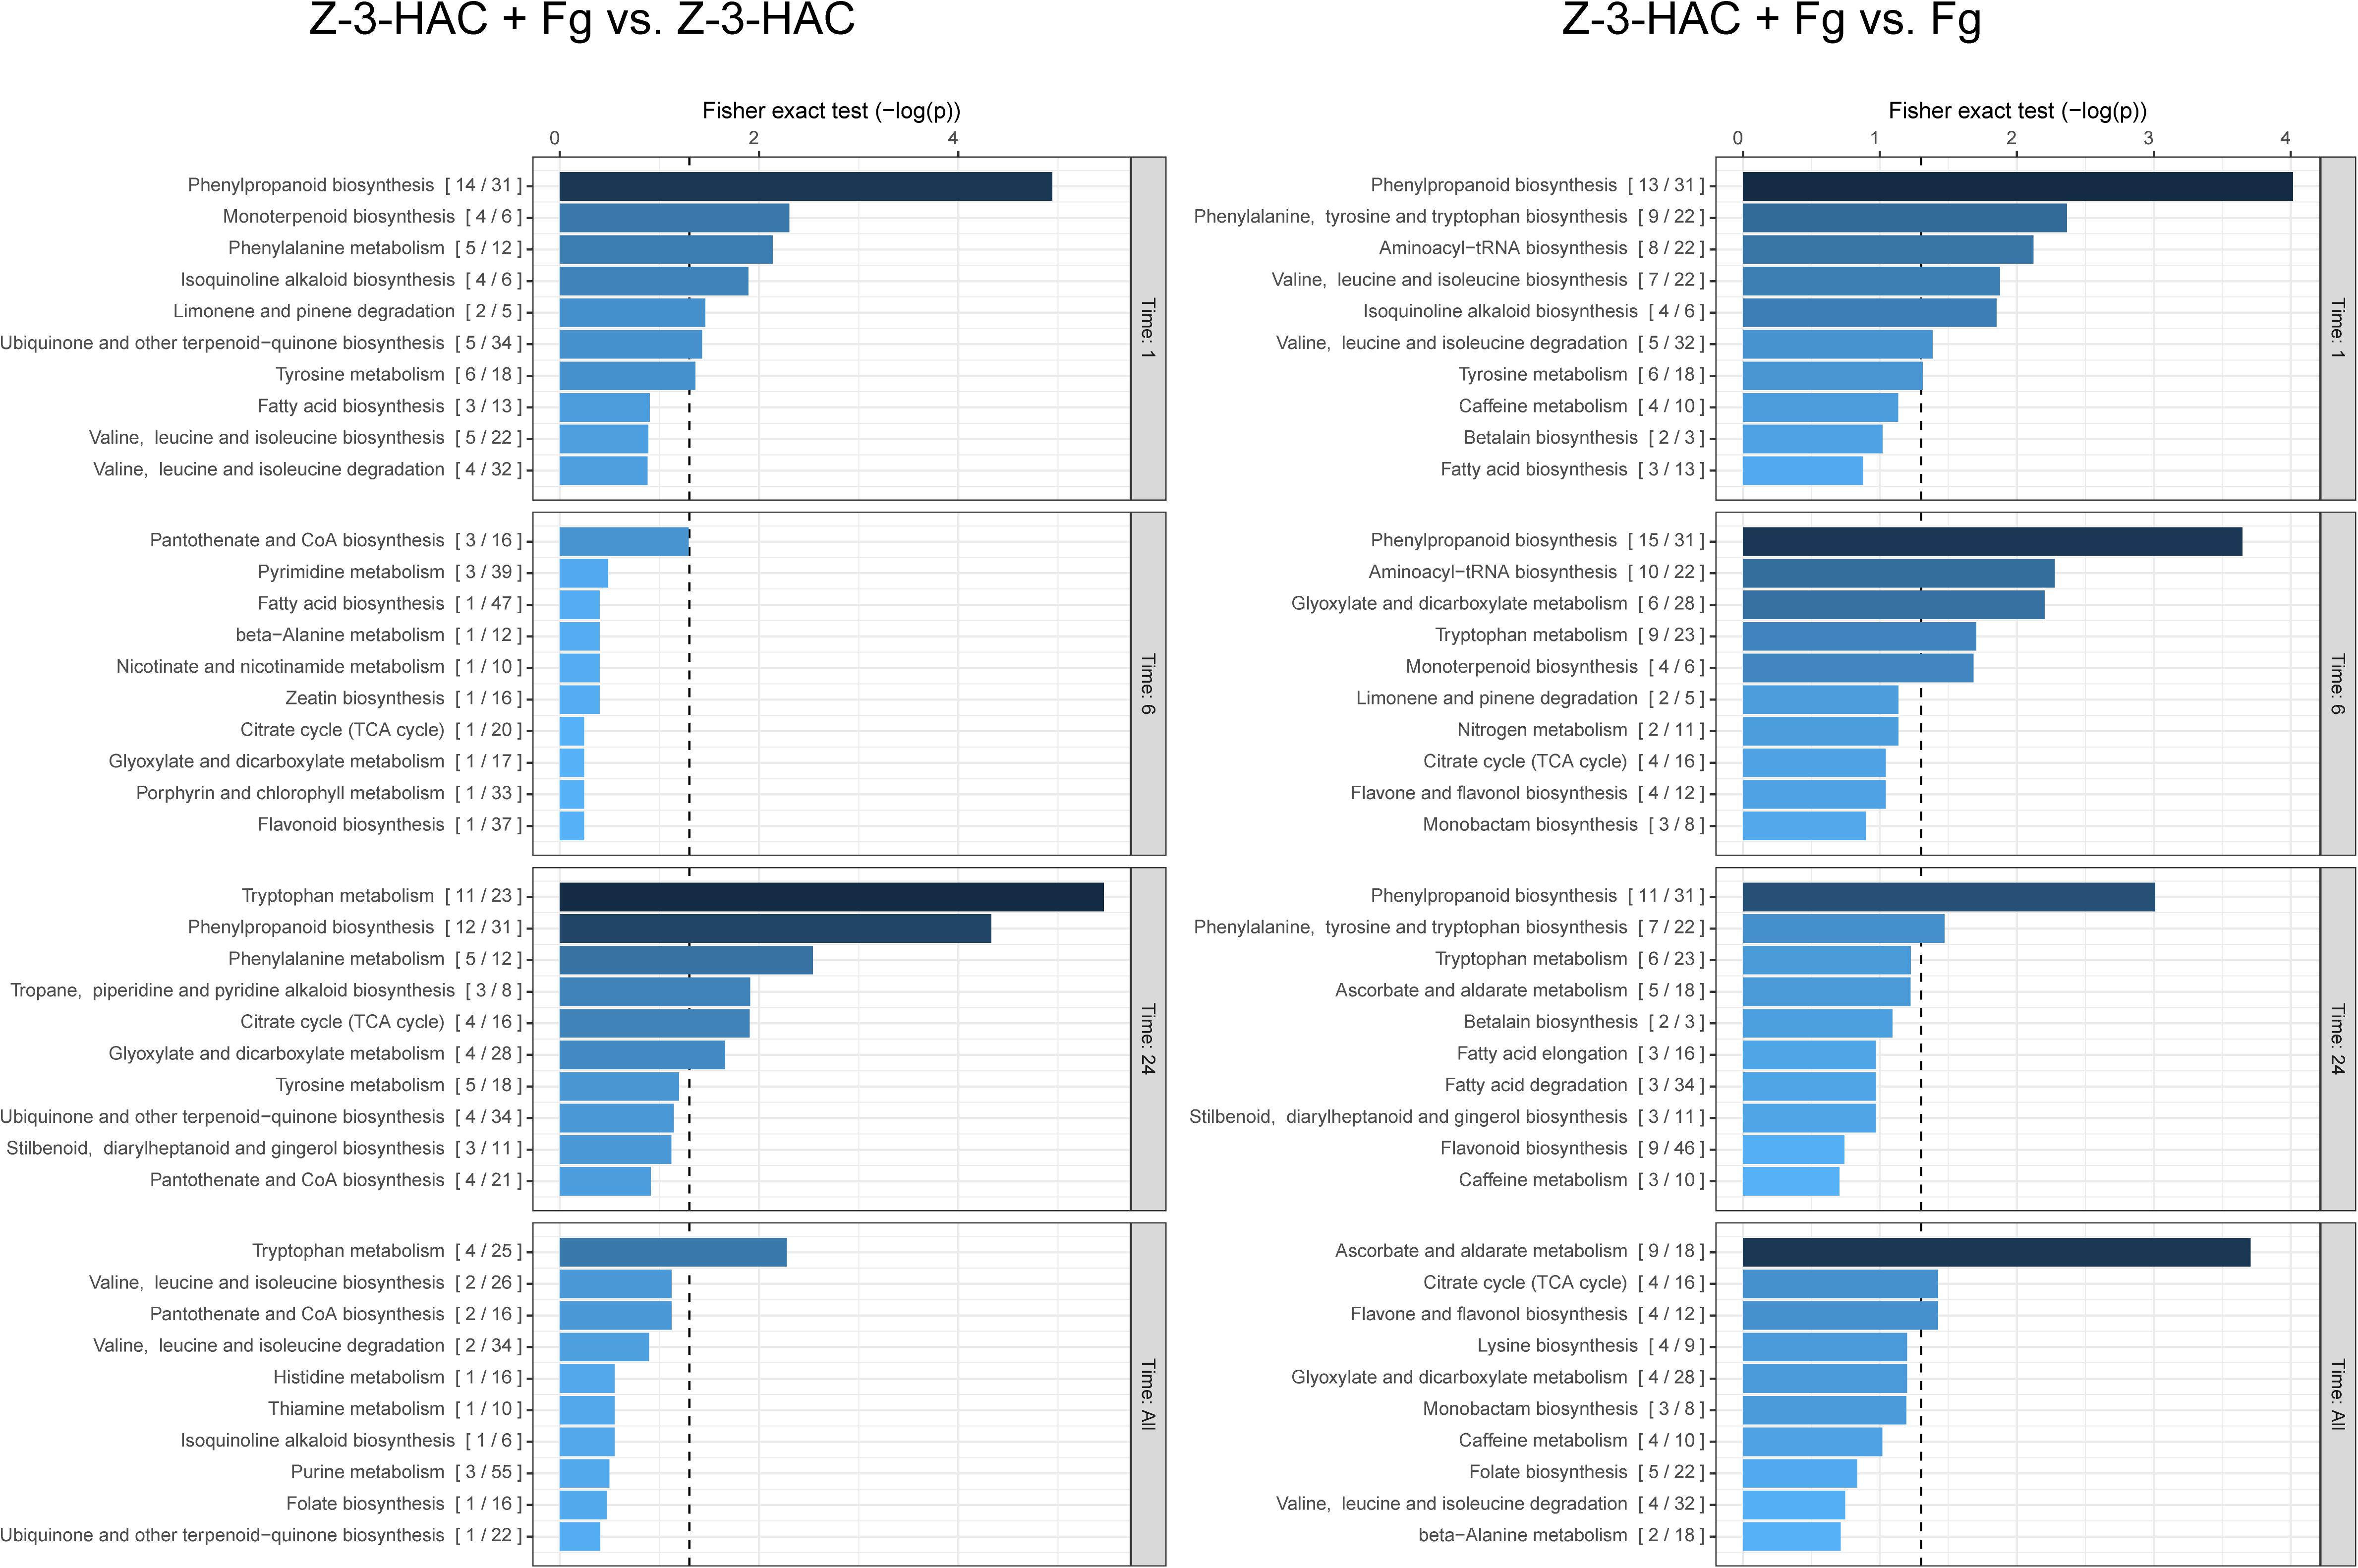
Figure 4. Biochemical pathways in wheat which are affected by exposure to Z-3-HAC after 1, 6, and 24 h after infection. The mummichog algorithm was used on the m/z dataset of six biological replicates per treatment per time point. To analyze the added effect of pre-exposure to Z-3-HAC after infection, the m/z dataset of the Z-3-HAC + Fg treatment was compared to the m/z dataset of the Z-3-HAC treatment on the one hand (left panel) and to the m/z dataset of the Fg dataset on the other hand (right panel). Bars next to pathways represent the p-value of the Fisher exact test which represents the significance of change in the pathway when two treatments are compared. The ratio in brackets represents the number of significant matches to the total number of matched compounds in the pathway. The dashed line represents a p-value of 0.05.
At 1, 6, and 24 hai, we observed that metabolites in the phenylalanine pathways and the more downstream phenylpropanoid and tryptophane pathways were significantly affected by the Z-3-HAC + Fg treatment, which goes beyond the separate effects of Z-3-HAC or Fg (Figure 4). To corroborate the observed results with respect to the phenylalanine pathway, we performed a targeted analysis using an analytical standard of L-phenylalanine (L-Phe), the starting product of the pathway. In the Z-3-HAC and Z-3-HAC + Fg-treated seedlings, L-Phe was significantly lower compared to the control and Fg-inoculated seedlings at 1 and 6 hai (Supplementary Figure 1). This either suggests a decreased L-Phe production in these treatments or an increased demand of L-Phe from the downstream pathways.
The mummichog algorithm provided a powerful tool to get a first grasp on the changes in the metabolome related to Z-3-HAC exposure. However, as this strategy is limited to the available metabolites included in the KEGG database, we pursued a more tentative identification approach. First, we performed PCA, whereby the PCA-X score plots were based on 4,310 positively ionized metabolite features and showed that samples from the same treatment cluster together and separate from the other treatments, which became clear from 6 hai onward (Figure 5). This indicated that metabolic differences were present between the various treatments. The total variance explained by the first two principal model components was 45, 56, and 65% for 1, 6, and 24 hai, respectively. OPLS-DA models were constructed in order to reveal those metabolites that contributed to the differentiation between the Z-3-HAC and Z-3-HAC + Fg treatment. Initially, 103 metabolites from the positive ionization mode were retained for further chemical and biological assessment. Complete-linkage hierarchical clustering of the metabolites according to their abundance profiles along samples revealed two large clusters: one cluster in which a metabolite was most abundant in Z-3-HAC and Z-3-HAC + Fg treatments and another cluster in which the metabolites were least abundant in the Z-3-HAC + Fg treatment (Figure 6). The latter metabolites may be inhibited by Fg infection in Z-3-HAC-treated plants or serve as a substrate for the production of metabolites further downstream.
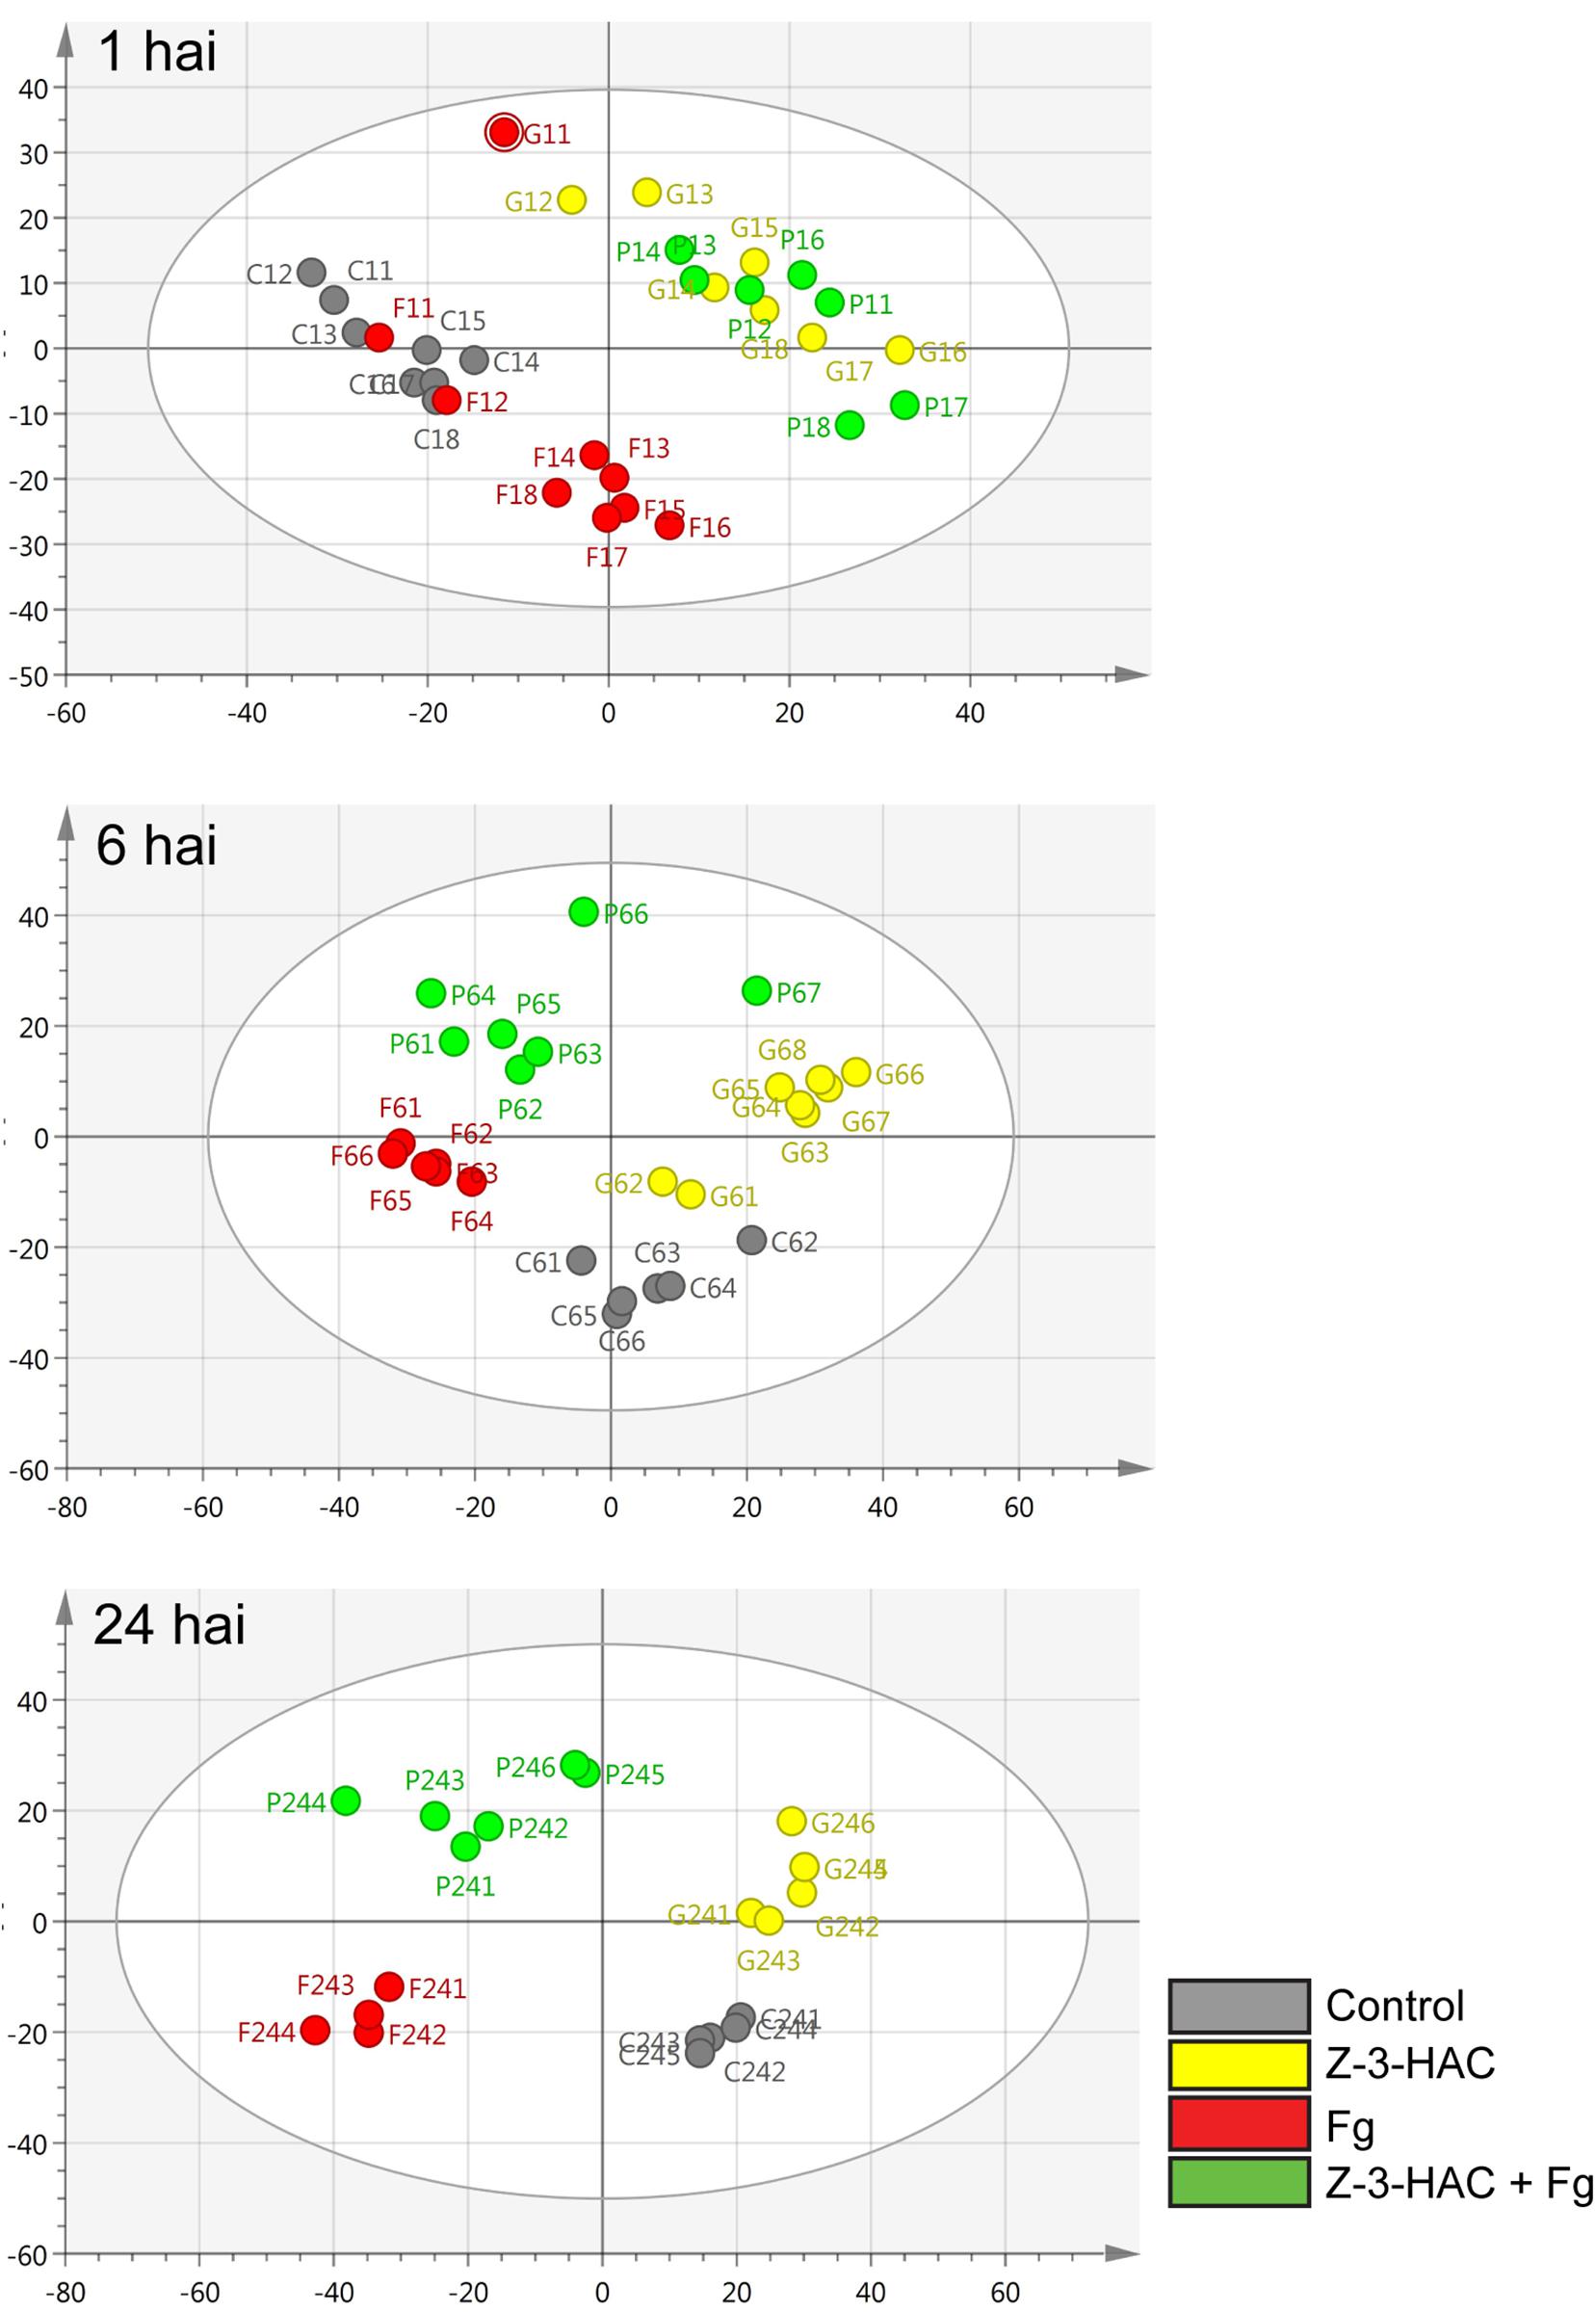
Figure 5. Principal component analysis (PCA) score plots for the different time points. The PCA plots were constructed with metabolome data from the positive ionization mode for different time points: 1, 6, and 24 h after inoculation (hai). Each circle represents a single sample of 6–8 leaf sheaths. Control, gray; Z-3-HAC, yellow; Fg, red; Z-3-HAC + Fg, green. The ellipse depicts the Hotelling’s T2 95% confidence interval.
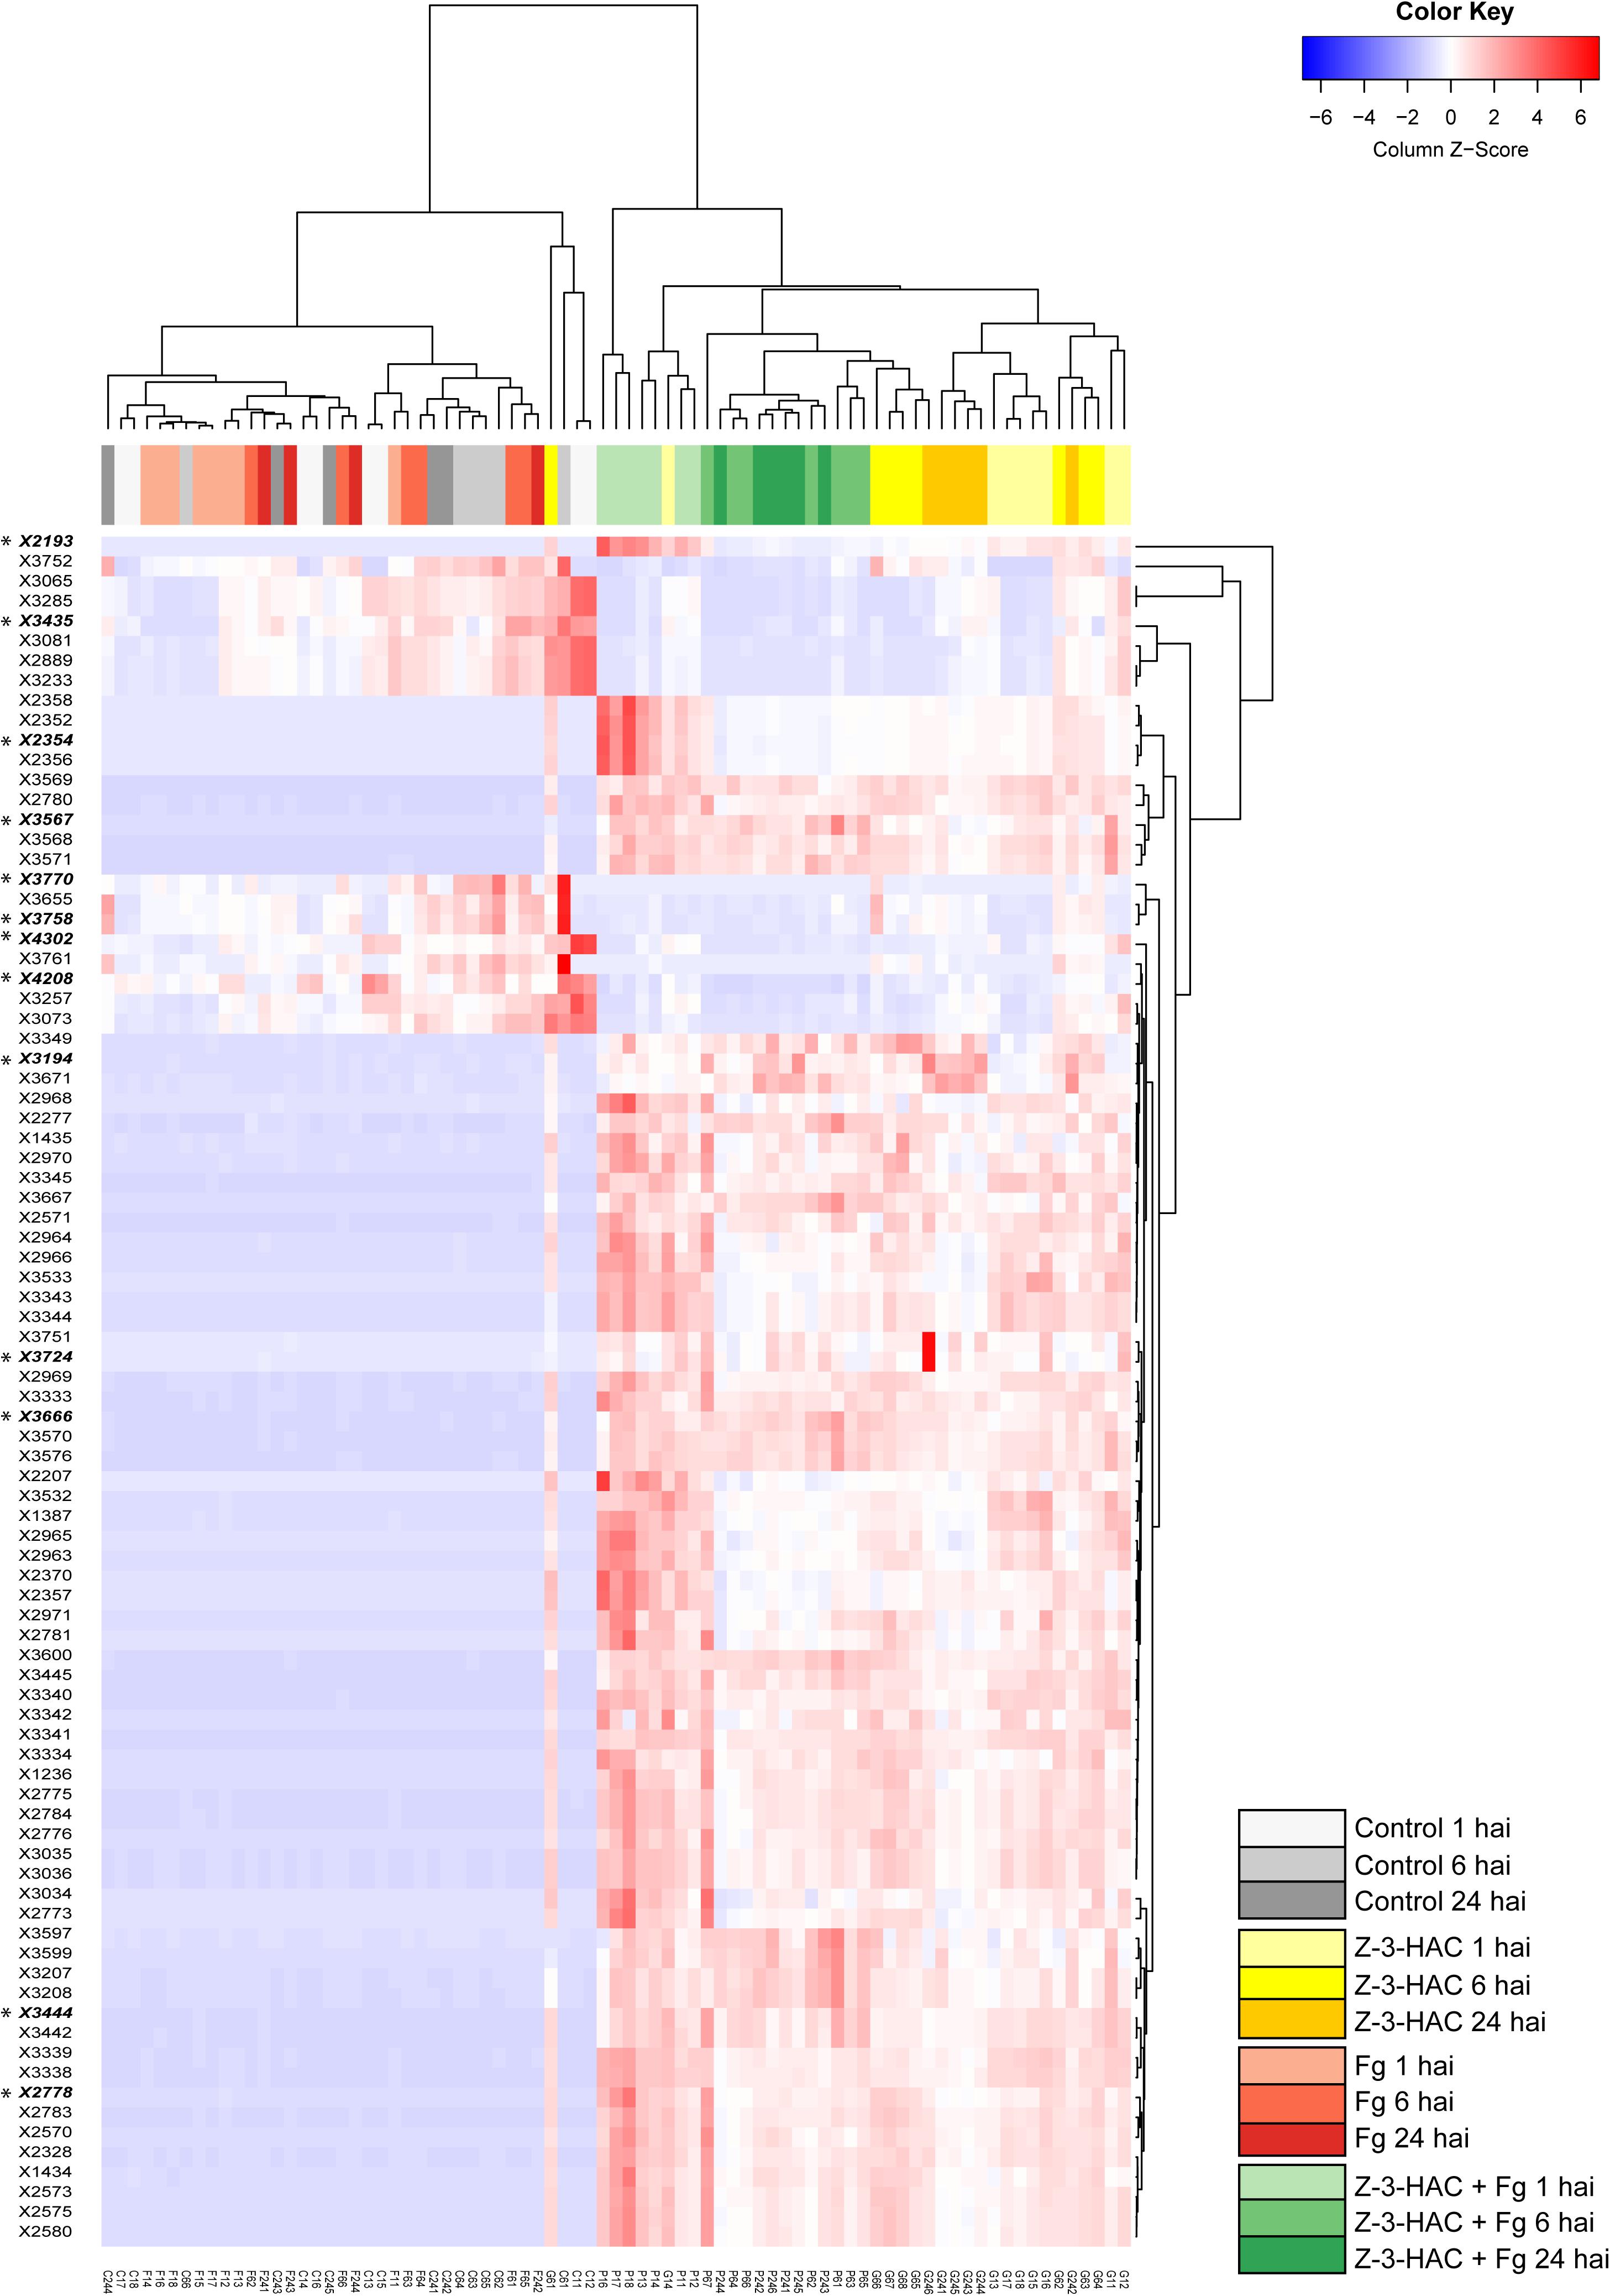
Figure 6. Heat map and complete-linkage hierarchical clustering of the peak areas of the 103 metabolite features (horizontal lines) which contributed most to the orthogonal partial least squares discriminant analysis model for the positive ionization mode. A final set of 13 metabolite features was retained for further analysis, each one marked with an asterisk and in bold. Each vertical line has been assigned a color which corresponds to the treatment and time point of the sample. Metabolite feature codes (identity labels) were automatically assigned by SieveTM 2.1 software (Thermo Fisher Scientific, San Jose, CA, United States). Z-3-HAC, Z-3-hexenyl acetate; Fg, Fusarium graminearum; hai, hours after inoculation.
Metabolites were selected for HRMS/MS fragmentation, and tentative identification was established using full-scan data and the MS/MS patterns. Remarkably, the metabolites that were most abundantly present in the Z-3-HAC-treated plants were tentatively identified as glycosylated compounds (Table 2, Figure 7, and Supplementary Figure 2). Using an analytical standard, we determined the MS/MS pattern of D-glucose (Merck, Darmstadt, Germany) and were able to confirm that various fragments of the metabolites under investigation were matching those of D-glucose, indicating the presence of a glucose group and pointing toward glycosylated metabolites (Supplementary Figure 2 and Supplementary Dataset 1). The metabolites from the other cluster did not possess fragments matching those of D-glucose. Besides the fragments that were shared with those of D-glucose, 30 unique fragment ions were also shared between at least two different metabolites (Supplementary Figure 3), pointing to metabolites that share similar (sub)structures.
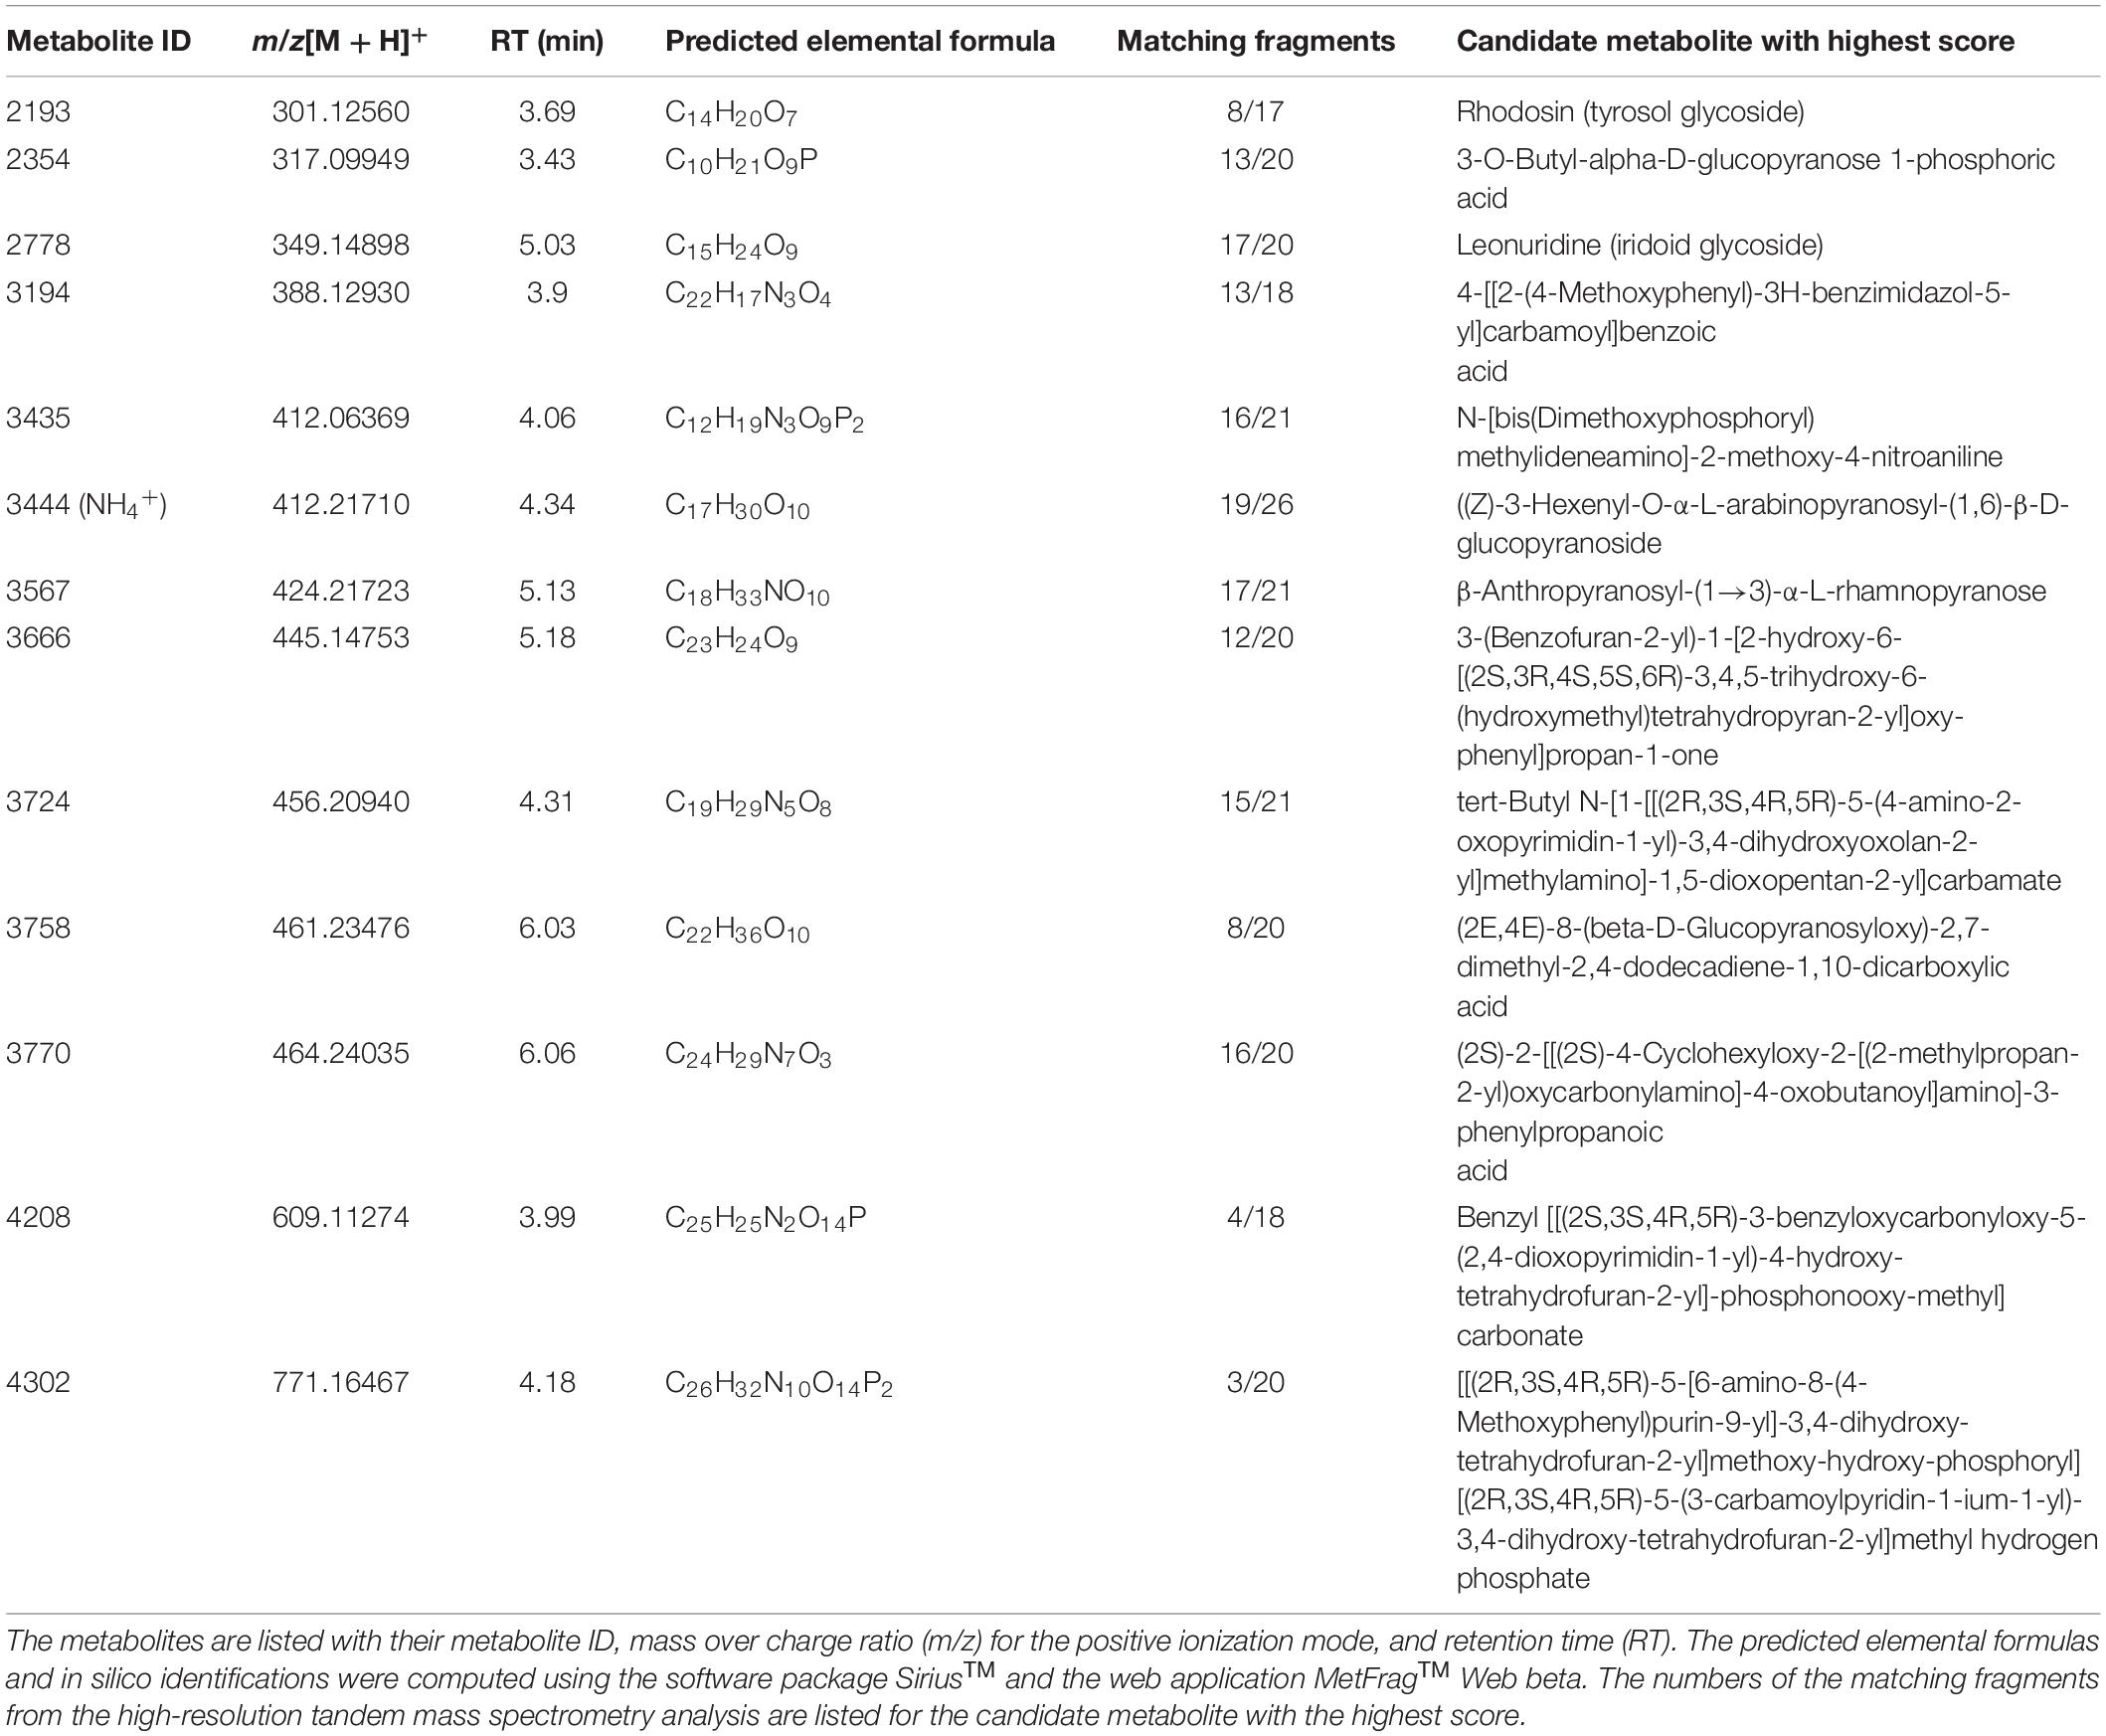
Table 2. Overview of metabolite ions which contribute the most to the predictability of the orthogonal partial least squares discriminant analysis model.
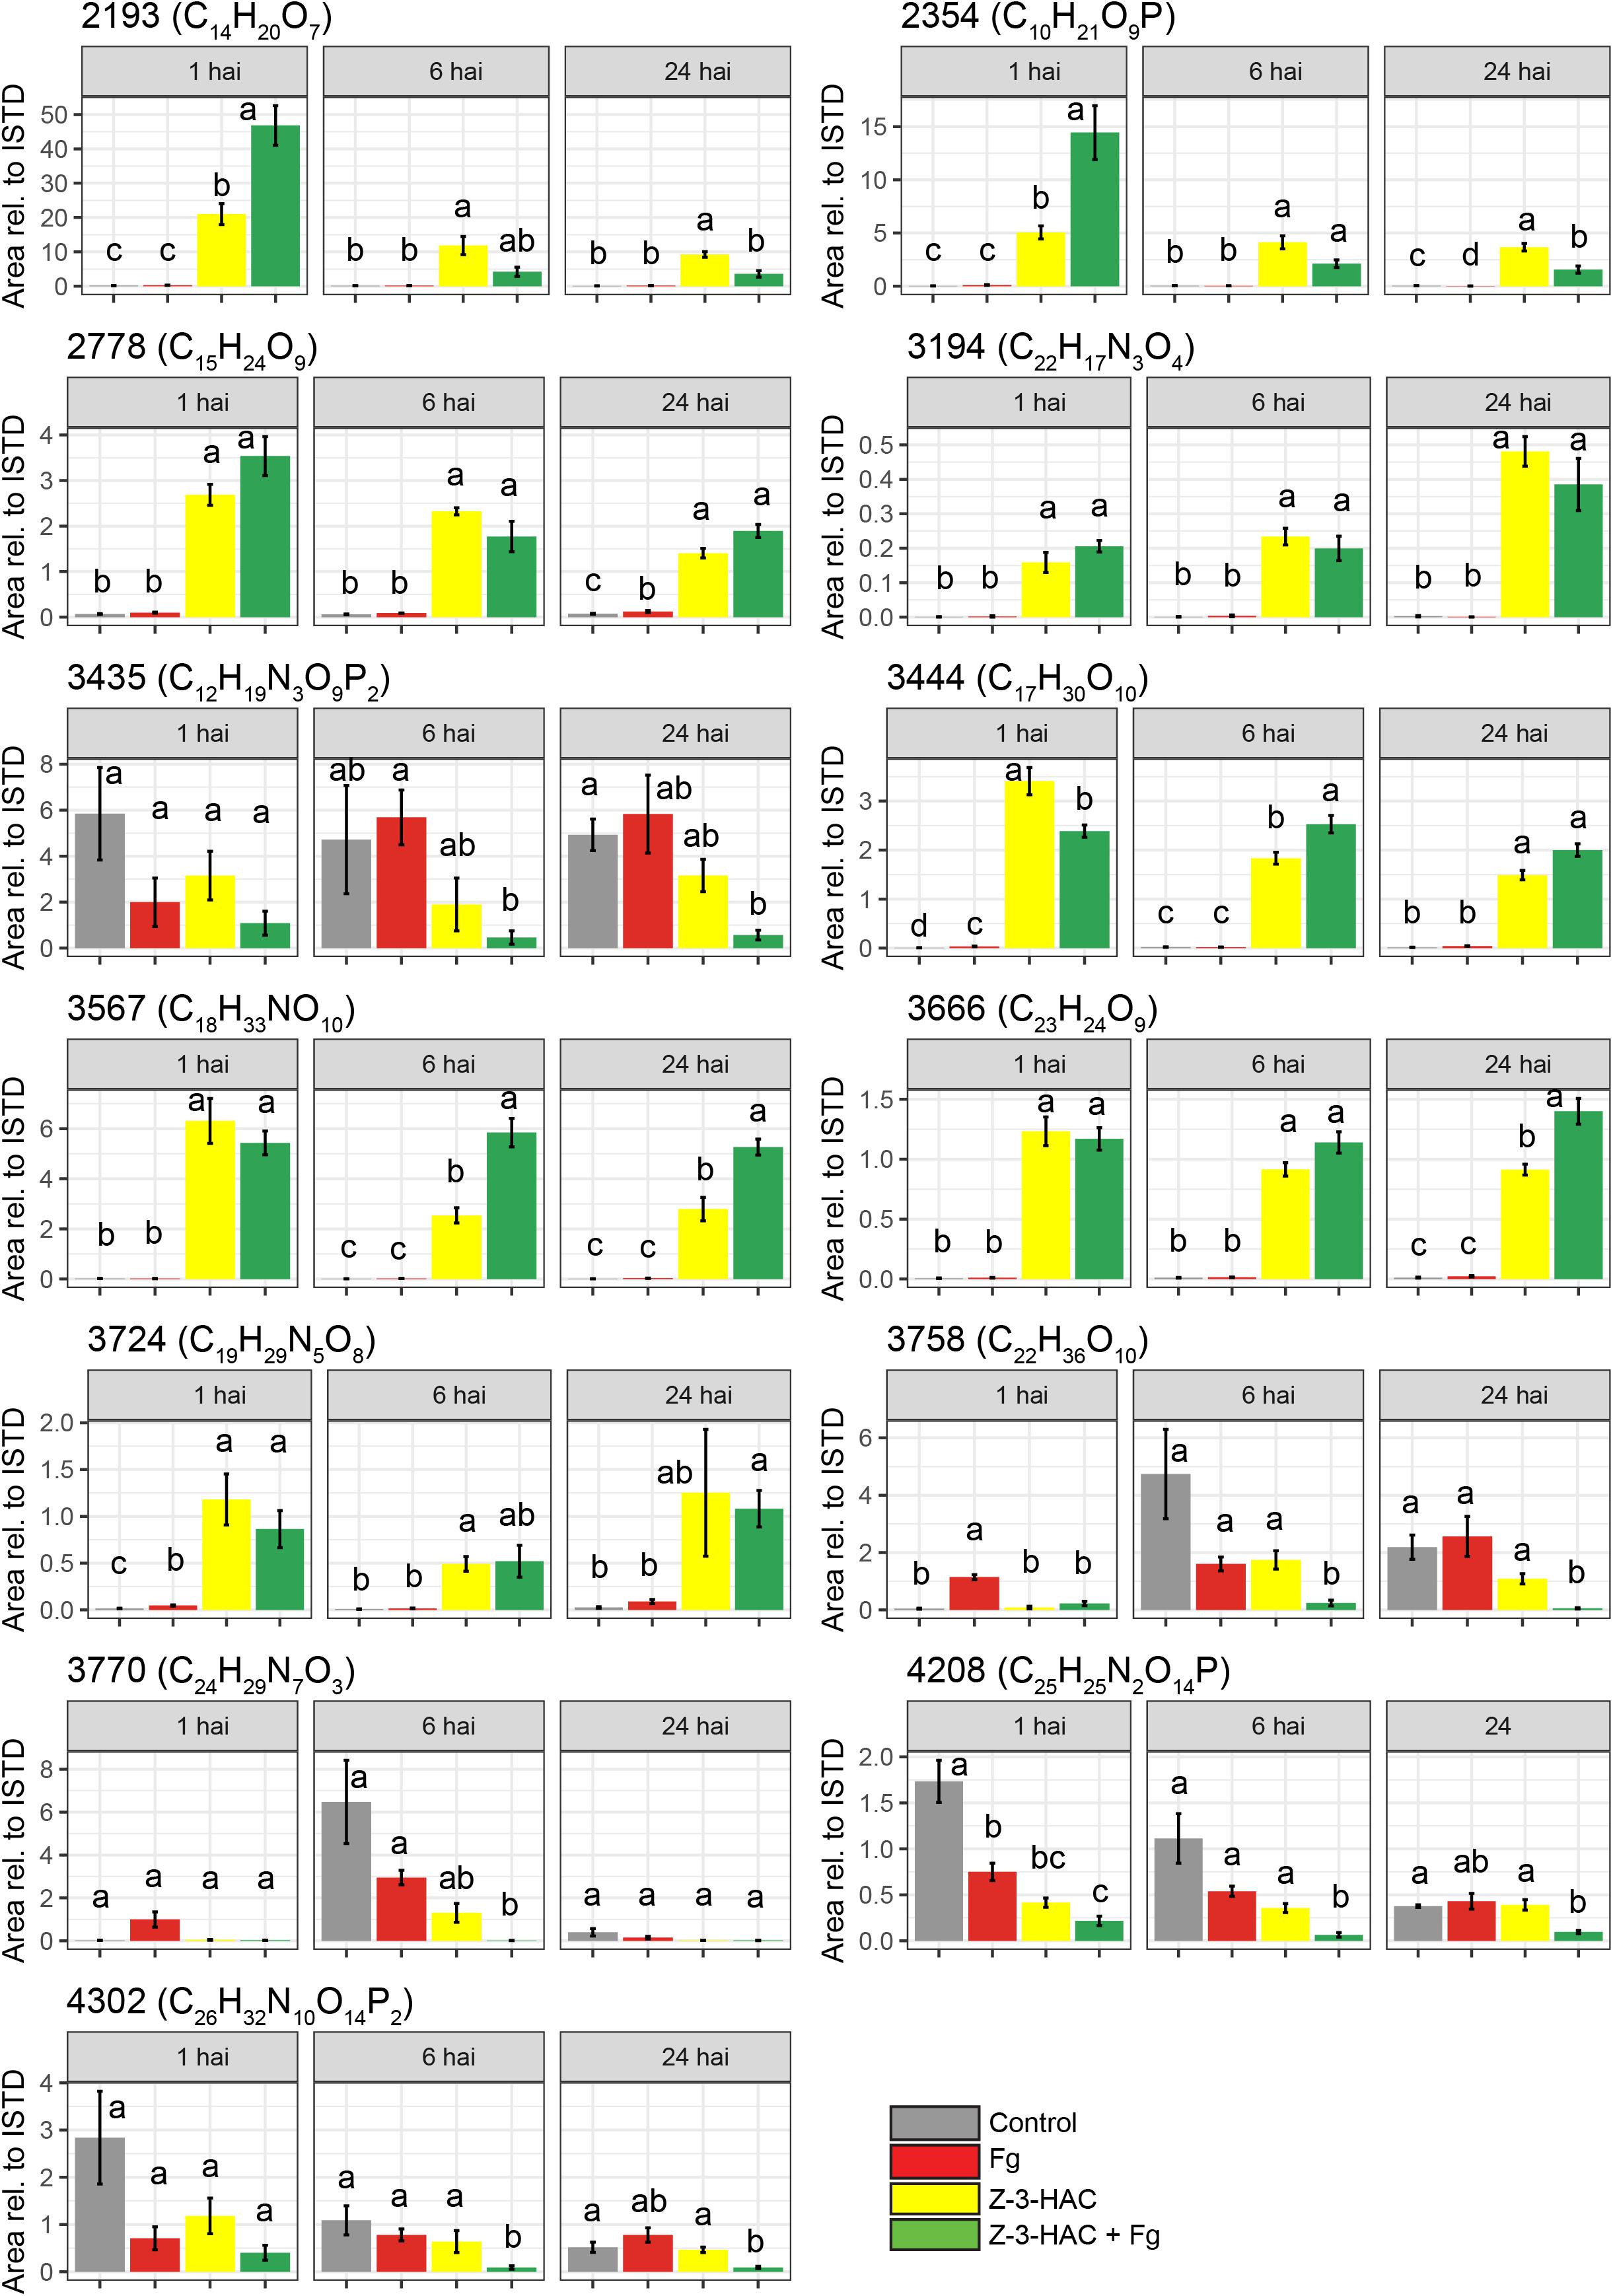
Figure 7. Metabolite features which contribute most to the predictability of the orthogonal partial least squares discriminant analysis model for the positive ionization mode. Bars represent average integrated peak area values relative to the integrated peak area of the internal standard, and this is for 6–8 biological replicates. Treatments: control (gray bars); Fg, F. graminearum inoculation (red bars); Z-3-HAC, Z-3-hexenyl acetate exposure (yellow bars); Z-3-HAC + Fg inoculation (green bars); hai, hours after inoculation. Error bars represent ± SE. Significant differences between treatments per time point are depicted with different letters. The significance of differences was calculated using post hoc Dunett’s T3 test (α = 0.05). Metabolite codes were automatically assigned by SieveTM 2.1 software (Thermo Fisher Scientific, San Jose, CA, United States).
Among the metabolites, several have been described to be implicated in plant defense. Metabolite 2193 (C14H20O7) was tentatively identified as rhodosin, a glycoside of tyrosol, a phenolic antioxidant. This compound was significantly induced in the Z-3-HAC + Fg treatment compared to the sole Z-3-HAC and Fg treatment (Figure 7). Metabolite 2778 (C15H24O9) was tentatively identified as leonuridine. Those metabolites for which no glucose fragment ions were generated upon HRMS/MS analysis were predicted to be phosphorylated: 3435 (C12H19N3O9P2), 4208 (C25H25N2O14P), and 4302 (C26H32N10O14P2). Additionally, based on the accurate mass of the [M + NH4]+ adduct of metabolite 3444 (C17H30O10, m/z value of 412.21765) and HRMS/MS spectrum (fragment ions with mass 263, 295, 233, and 245 Da as well as fragments that are linked to the sugar groups reported in the study of Sugimoto et al. (2014) (Supplementary Dataset 1), metabolite 3444 was identified as HexVic. This metabolite has been reported in the study of Sugimoto et al. (2014), in which 24 different plant species were exposed to Z-3-HOL and found to have an increased production of this diglycoside compound.
We observed an increase in glycosylated metabolites upon Z-3-HAC exposure, and glycosylation of defensive compounds is one of the proposed mechanisms of priming. As glycosylation of SA is a known priming mechanism, we retrospectively analyzed the metabolome data from the exposure experiment and the metabolome data from the inoculation experiment for the presence of SA and its glycoside, salicylic acid 2-O-β-D-glucoside (SAG) (Figure 8). To this end, an authentic reference standard was purchased for identification purposes (Toronto Research Chemicals, Toronto, ON, Canada).
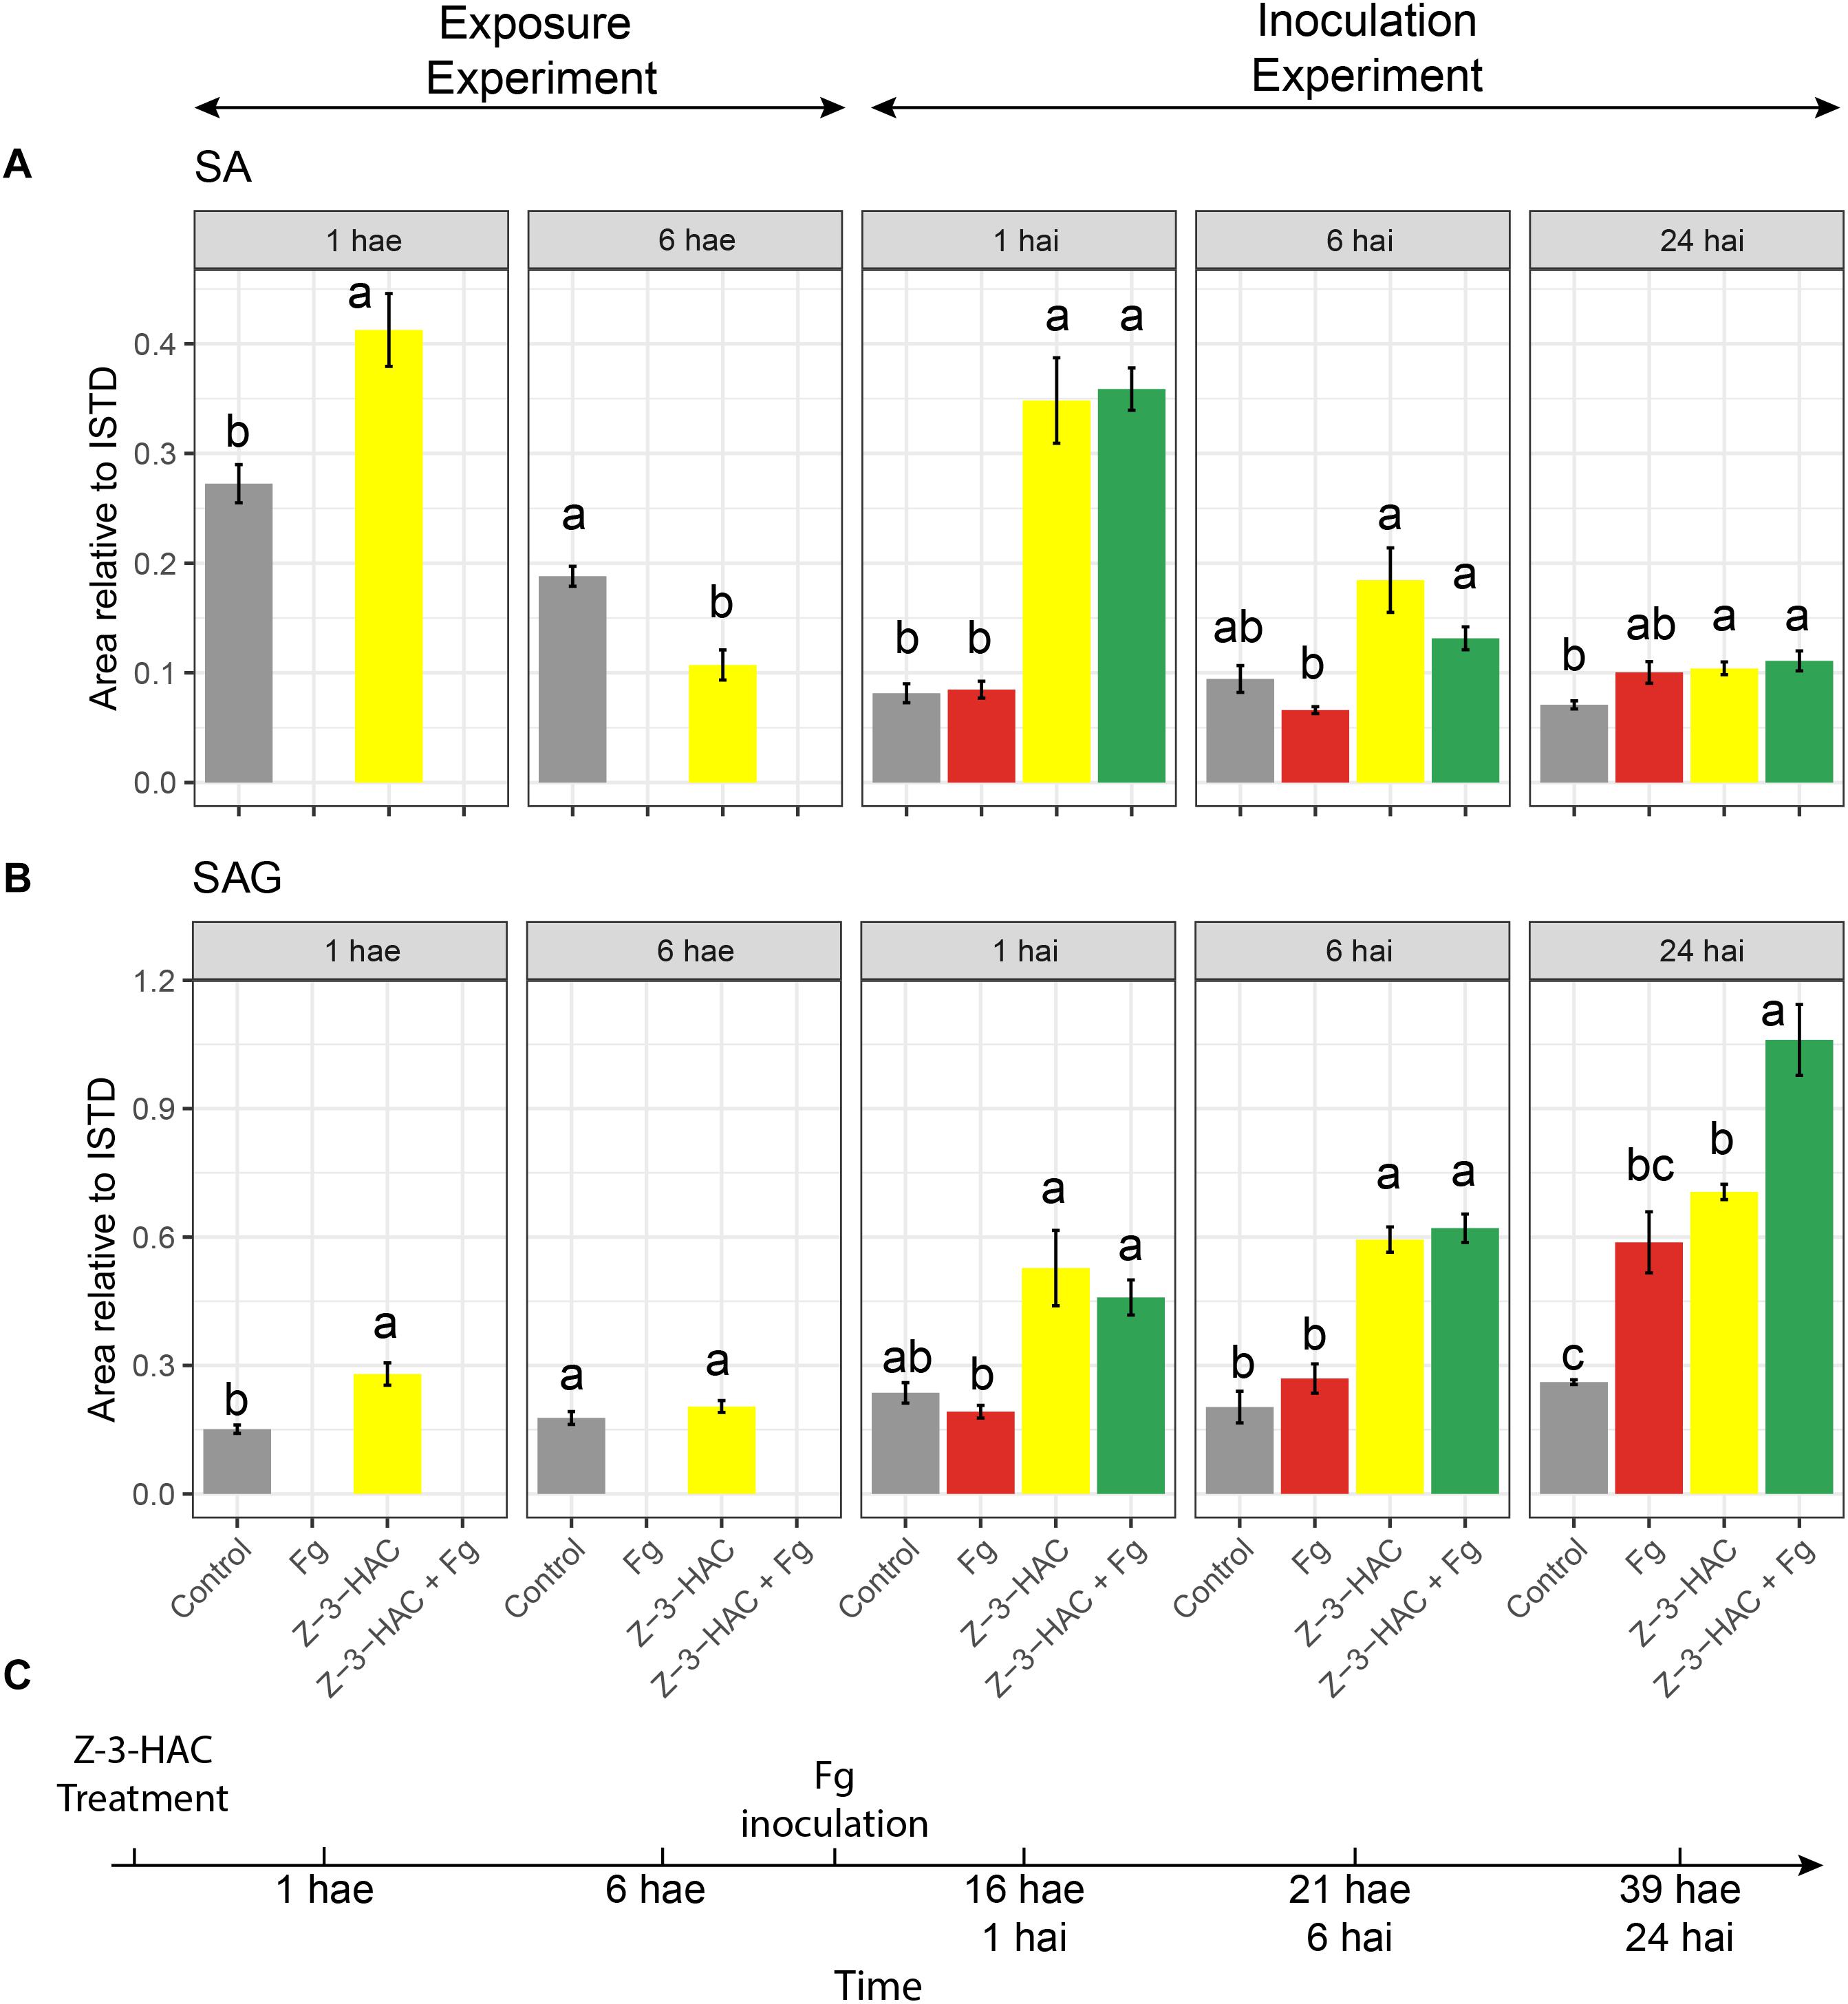
Figure 8. (A) Salicylic acid and (B) salicylic acid 2-O-β-D-glucoside; bars represent integrated peak area relative to the internal standard of seedlings at 1 and 6 h after exposure (hae) to Z-3-HAC and at 1, 6, and 24 h after a combination of exposure to Z-3-HAC and inoculation with a conidia suspension (105 conidia mL–1) of F. graminearum (Fg). (C) Timeline of the bioassays. Bars represent the average values of 6–8 biological replicates. Treatments: control (gray bars); Fg, F. graminearum inoculation (red bars); Z-3-HAC, Z-3-hexenyl acetate exposure (yellow bars); Z-3-HAC + Fg inoculation (green bars); hai, hours after inoculation. Error bars represent ± SE. Significant differences between treatments per time point are depicted with different letters and calculated using a two-sample Student’s t-test for data at 1 and 6 hae and a post hoc Dunett’s T3 test for data at 1, 6, and 24 hai (α = 0.05).
At 1 hae, we already saw an induction of SA biosynthesis (+ 51.4%, P = 0.004) in the Z-3-HAC treatment compared to control leaves. At 6 hae, the SA contents in Z-3-HAC-treated seedlings was remarkably lower compared to those of the control seedlings (−43%, P = 0.001). For the inoculation experiment, we observed a threefold increase in seedlings which had been treated with Z-3-HAC and Z-3-HAC + Fg at 1 hai (P < 0.01), compared to the control treatment (Figure 8). No difference was observed between the Z-3-HAC and the Z-3-HAC + Fg treatments. Also, at 6 and 24 hai, the SA content was higher in Z-3-HAC and Z-3-HAC + Fg-treated seedlings, with significant differences at 24 hai, compared to the control. At 1 hae, SAG was significantly higher (+ 85.3%, P = 0.003), whereas at 6 hae SAG was not significantly different compared to the control treatment (Figure 8B). At 1 and 6 hai, SAG was higher in Z-3-HAC-treated plants, but not significantly different from the control treatment. At 24 hai, SAG was significantly higher (P = 0.014) in the Z-3-HAC + Fg treatment compared to those of the other treatments.
The notions that GLVs are quickly produced upon wounding (Fall et al., 1999) and that plants exposed to GLVs show the same activation patterns as plants which are wounded (Dombrowski and Martin, 2018; Dombrowski et al., 2019) fit within the framework of looking at GLVs as local “damaged-self signals” (Heil, 2014). Indeed GLVs are also released upon insect herbivory and fungal infection and quickly reach non-damaged parts of the plant (Ameye et al., 2018). This may then serve as a cue to induce plant defense responses against (a) biotic stress. To investigate the possible involvement of ROS in response to Z-3-HAC exposure, we performed several experiments.
We found the negative effects of 50 μM of Z-3-HAC on wheat leaves (Figures 1A,B). Remarkably, DAB staining revealed that H2O2 accumulation occurred around the stomata of the top of the leaves, which suggests that Z-3-HAC is taken up by the stomata and induces oxidative stress which is only limited to the top of the leaves. RT-qPCR analysis revealed an upregulation of genes TaRBOH1 and TaRBOH3 encoding for ROS-producing proteins and a suppression of genes coding for ROS-quenching enzymes. However, the enzyme activity of CAT and SOD was increased in Z-3-HAC-treated seedlings (Figure 2), which suggests that ROS quenching at these early time points is post-transcriptionally regulated and shows a delayed response. The induction of ROS and the parallel decreased expression of CAT, APX, GPX, and SOD isoforms are reminiscent of a hypersensitive response (HR) in which ROS accumulation leads to a type of programmed cell death of a number of cells to protect the plant from further biotic damage (De Gara et al., 2003; Balint-Kurti, 2019). Furthermore, this accumulation of ROS is an important hallmark to induce systemic acquired resistance (Durrant and Dong, 2004). We speculate that, during these early time points following GLV exposure, the expression of ROS-generating genes is induced, whereas the gene expression of ROS-quenching enzymes is negatively regulated, permitting the HR to carry on. However, at the protein level, the enzymes which are already present in the cells are post-transcriptionally activated (Rhee et al., 2005; Yamakura and Kawasaki, 2010), resulting in increased activity.
Pursuing a more holistic approach in which we aimed at uncovering pathways which are affected following Z-3-HAC exposure, we observed a significant effect of treating wheat with Z-3-HAC on the phenylpropanoid metabolism. This is an important pathway in plants, yielding metabolites involved in (oxidative) stress responses such as flavonoids and hydroxycinnamic acids (Dixon et al., 2002). Additionally, other metabolic pathways which also play a role in the quenching of oxidative stress, such as glutathione and ascorbate, were also affected (Figure 3). However, if Z-3-HAC-treated plants were subsequently inoculated with Fg, we observed a different effect in the phenylpropanoid pathway compared to a sole Z-3-HAC or Fg treatment (Figure 4). However, whether this effect is due to the higher oxidative stress following infection in Z-3-HAC-treated plants or related to other processes should be further investigated in future research.
Besides accumulation of ROS, our results also disclosed a link between Z-3-HAC exposure and SA production (Figure 8A). Other studies have already shown that GLVs induce an upregulation of the expression of SA and JA biosynthesis genes (Bate and Rothstein, 1998; Arimura et al., 2001; Gomi et al., 2003; Farag et al., 2005; Kishimoto et al., 2006; Engelberth et al., 2007) during the first 6 hae. The effects of Z-3-HAC on SA levels and JA-dependent defense are not mutually exclusive as GLVs have been associated with both JA and SA responses (Ameye et al., 2018). This was shown in a transcriptomics study by Mirabella et al. (2015) who demonstrated the response of Arabidopsis after exposure to E-2-hexenal (E-2-HAL) during the first 3 h and reported that the differentially expressed genes showed a 49% overlap with the gene expression after exposure to SA, whereas there was also a 13% overlap after JA treatment. This suggests that E-2-HAL might activate SA- and JA-dependent responses, corroborating their findings. However, this does not entail that GLV signaling is solely SA or JA dependent as Mirabella et al. (2015) found that 32% of the differentially regulated genes were unique for E-2-HAL treatment. Thus, for our model system, a holistic transcriptomics approach at these early time points will be necessary to disclose whether the early increase in SA coincides with an early increase in SA defense gene expression and whether Z-3-HAC influences defense genes downstream of SA-dependent defense signaling.
While early responses of plants upon GLV exposure have been elucidated (Asai et al., 2009; Zebelo et al., 2012), mechanisms following these responses which contribute to increased defense remain less well understood (Ameye et al., 2018). In previous research, we have already determined that Z-3-HAC induces primed defense responses in wheat (Ameye et al., 2015). However, the mechanisms through which this primed state occurred still need to be further elucidated. The accumulation of conjugated defensive compounds is one of the proposed mechanisms for defense priming. Defense-related compounds such as ABA, SA, benzoxazinoids, and phytoanticipins, among others, can be glycosylated and transported to the vacuole, rendering them inactive. Following stress triggers, these can be quickly released from the vacuole and returned to their active state through hydroxylation by glucosidases (Conrath, 2011; Pastor et al., 2014). Our data are in line with this mechanism, as we observed an increase of metabolites upon exposure to Z-3-HAC, which shared several fragment ions with D-glucose (Supplementary Dataset 1 and Supplementary Figure 3), indicating that Z-3-HAC induced the accumulation of glycosylated compounds. Furthermore, as some of these glycosylated metabolites were higher in the Z-3-HAC + Fg treatment, compared to the Z-3-HAC treatment [e.g., metabolites 2193 (C14H20O7), 2354 (C10H21O9P), and 3567 (C18H33NO10)], these metabolites may point to mechanisms involved in the primed defense response of wheat plants following Z-3-HAC exposure.
Glycosyltransferases (GTs) play an important role in the biosynthesis and maintenance of the cell wall (Scheible and Pauly, 2004). GTs are also involved in plant defense by detoxifying xenobiotic compounds, such as mycotoxins (Lulin et al., 2010; Audenaert et al., 2013). Furthermore, GTs play a role in stabilizing and increasing the solubility of plant-defensive compounds such as phyto-anticipins, plant defense hormones, and their precursors. After glycosylation, these compounds can be transported and stored in the vacuole, from which they can be released upon stress or cellular damage and transformed into their active aglycons by glucosidases, which are located in different cell organelles (Bowles et al., 2006; Morant et al., 2008; Pastor et al., 2013). GTs constitute a large group of enzymes, with a restricted substrate specificity, entailing that different GTs glycosylate specific compounds (Jones and Vogt, 2001; Hansen et al., 2012). Several metabolites shared the same HRMS/MS fragment ions (Supplementary Figure 3), suggesting that some metabolites may have identical or similar aglycone substructure and thus may originate from the same, yet unknown, pathway(s). For example, metabolite 2193 has been identified as leonuridine, a glycosylated terpenoid, a member of the iridoid glycosides which exhibits antioxidant properties (Dinda et al., 2011). Leonuridine has additionally been reported to increase in Quercus suber following drought stress (Almeida et al., 2020). However, metabolite 2354 (C10H21O9P) shares several fragment ions (Supplementary Dataset 1) and exhibits an identical pattern over time (Figure 7), which suggests that these may originate from the same pathway. Another glycoside was identified in our metabolomics study to be significantly produced upon Z-3-HAC exposure, the hexenyl diglycoside HexVic. The presence of hexenyl glycosides in plants has already been described in literature, whereby these compounds have primarily been reported to act as precursors for Z-3-HOL production (Jae-Hak et al., 1996; Nishikitani et al., 1999; Sugimoto et al., 2015). Moreover, it has been shown that one of the early responses (60 min) of maize following Z-3-HOL exposure involves the upregulation of putative glucosyltransferases and UDP-glucoside hydrogenase, which may result in concentration changes of glycosylated compounds (Engelberth et al., 2013). In a later study by Sugimoto et al. (2014), it has been shown for 24 different plant species, including Arabidopsis and Triticum aestivum, that hexenyl glucosides and hexenyl diglucosides increased after exposure to Z-3-HOL. The enzyme responsible for the synthesis of Z-3-hexenyl glycoside in Camellia sinensis was identified. Ohgami et al. (2015) demonstrated in vitro that AtUGT85A3 produced hexenyl-glycosides with UDP-glucose as a sugar donor and Z-3-hexenol as a sugar acceptor. Furthermore, they showed that homologs of the UGT85 family in several other plant species also formed hexenyl-glycosides. CsGT1, the AtUGT85A3 homolog in C. sinensis, was shown to have broad substrate specificity, including benzyl alcohol, linalool, geraniol, and Z-3-hexenol. However, GTs preferentially bind to hydroxyl groups, implying that, in our study, Z-3-HAC most likely must be hydrolyzed to Z-3-HOL by an esterase before it could be glycosylated.
We specifically investigated whether glycosylation of SA was also induced in Z-3-HAC-treated wheat. Indeed Z-3-HAC triggered an increased production of SAG (Figure 8B), corroborating that the defense-inducing action of GLVs may be attributed to the accumulation of glycosylated defensive compounds. These glycosylated compounds may be stored in the vacuole or transported through the xylem to other plant parts (Chen et al., 1995; Ratzinger et al., 2009). The time course of SA and its glycosylated derivate SAG accumulation follows the pattern for a priming response as stated by Martinez-Medina et al. (2016), i.e., following a priming stimulus (Z-3-HAC exposure), there is a transient induction of SA and SAG accumulation at 1 hae which returns to control levels at 6 hae, in the absence of a stress trigger (Figures 8A,C). However, following leaf sheath inoculation, a stress stimulus arises (wounding response because of the peeling of the leaf sheath and/or Fg inoculation), during which we observed a higher induction of SA and SAG formation in the Z-3-HAC and Z-3-HAC + Fg treatment at 1 and 6 hai. At 24 hai, SAG in the Z-3-HAC + Fg treatment is significantly higher than in the Z-3-HAC and the Fg treatment (Figure 8B), underlying the hypothesis that exposure to Z-3-HAC primes plant defense by glycosylating plant defense compounds.
These data together suggest that GLVs induce a transient production of defense signaling compounds (SA and SAG) on the first hours after exposure. After an (a)biotic stress trigger in that tissue, SA and SAG formation are more strongly induced compared to plant tissue which was not previously exposed to Z-3-HAC. Then, Z-3-HAC directly induces glycosylation processes, which may play a role in plant defense. These glycosylation processes are activated upon Z-3-HAC perception and are even more enhanced when Z-3-HAC-treated plants encounter an (a)biotic stress trigger.
In conclusion, using a combined approach of the RT-qPCR analysis together with the metabolome data may point to a role for Z-3-HAC in the defense against pathogens by eliciting a ROS burst and increased activity of ROS-scavenging enzymes. This resulted in the activation of several pathways which are related to antioxidative processes. Indeed ROS production leading to HR constitutes a crude but effective means to fend off aggressors during the biotrophic phase of its infection phase in which living cells are needed to successfully infect the plant tissue. Additionally, our metabolomics approach showed an increase in glycosylation processes following Z-3-HAC exposure. However, further research is mandatory to elucidate the full identity of these glycosylated compounds which are produced more upon a combined treatment in order to unravel whether these involved plant defense.
The raw data supporting the conclusions of this article will be made available by the authors, without undue reservation, to any qualified researcher.
MA, GS, GH, KA, LM, and LV designed the experiments. MA performed all the experiments and wrote the manuscript. BM helped with the ROS experiment. LM and LV provided the valuable input for the metabolomics experiments. All authors read and revised the manuscript.
The authors declare that the research was conducted in the absence of any commercial or financial relationships that could be construed as a potential conflict of interest.
The Supplementary Material for this article can be found online at: https://www.frontiersin.org/articles/10.3389/fpls.2020.596271/full#supplementary-material
Supplementary Figure 1 | Levels of L-Phe in the infection assay.
Supplementary Figure 2 | Predicted chemical structures of the metabolites which contribute the most to the predictability of the orthogonal partial least squares discriminant analysis model.
Supplementary Figure 3 | High-resolution tandem mass spectrometry patterns of the metabolites which contributed most to the predictability of the orthogonal partial least squares discriminant analysis model for the positive ionization mode.
Supplementary Figure 4 | Principal component analysis score plots for the different time points of the negative ionization mode.
Supplementary Figure 5 | S-plot of the metabolite features for the samples at 6 h after inoculation, making the comparison between the Z-3-HAC and Z-3-HAC + Fg treatments.
Supplementary Table 1 | Accurate mass, ionization adduct, and retention time as determined based on analytical standards and used for the identification of salicylic acid.
Supplementary Dataset 1 | Excel datasheet containing fragment ions of metabolites which were most abundant in the Z-3-HAC and Z-3-HAC + Fg treatments.
Akinwumi, B. C., Bordun, K.-A. M., and Anderson, H. D. (2018). Biological activities of stilbenoids. Intern. J. Mol. Sci. 19:792. doi: 10.3390/ijms19030792
Almeida, T., Pinto, G., Correia, B., Gonçalves, S., Meijón, M., and Escandón, M. (2020). In-depth analysis of the Quercus suber metabolome under drought stress and recovery reveals potential key metabolic players. Plant Sci. 299:110606. doi: 10.1016/j.plantsci.2020.110606
Ameye, M., Audenaert, K., De Zutter, N., Steppe, K., Van Meulebroek, L., Vanhaecke, L., et al. (2015). Priming of wheat with the green leaf volatile Z-3-hexenyl acetate enhances defense against Fusarium graminearum but boosts deoxynivalenol production. Plant Physiol. 167, 1671–1684. doi: 10.1104/pp.15.00107
Ameye, M., Van Meulebroek, L., Vanhaecke, L., Smagghe, G., Haesaert, G., and Audenaert, K. (2018). Green leaf volatile production by plants: a meta-analysis. New Phytol. 220, 666–683. doi: 10.1111/nph.14671
Arimura, G., Ozawa, R., Horiuchi, J., Nishioka, T., and Takabayashi, J. (2001). Plant-plant interactions mediated by volatiles emitted from plants infested by spider mites. Biochem. Syst. Ecol. 29, 1049–1061. doi: 10.1016/s0305-1978(01)00049-7
Asai, N., Nishioka, T., Takabayashi, J., and Furuichi, T. (2009). Plant volatiles regulate the activities of Ca2+-permeable channels and promote cytoplasmic calcium transients in Arabidopsis leaf cells. Plant Signal. Behav. 4, 294–300. doi: 10.4161/psb.4.4.8275
Audenaert, K., De Boevre, M., Vanheule, A., Callewaert, J., Bekaert, B., Höfte, M., et al. (2013). Mycotoxin glucosylation in commercial wheat varieties: impact on resistance to Fusarium graminearum under laboratory and field conditions. Food Control 34, 756–762. doi: 10.1016/j.foodcont.2013.06.019
Baker, N. R. (2008). Chlorophyll fluorescence: a probe of photosynthesis in vivo. Annu. Rev. Plant Biol. 59, 89–113. doi: 10.1146/annurev.arplant.59.032607.092759
Balint-Kurti, P. (2019). The plant hypersensitive response: concepts, control and consequences. Mol. Plant Pathol. 20, 1163–1178.
Bate, N. J., and Rothstein, S. J. (1998). C6-volatiles derived from the lipoxygenase pathway induce a subset of defense-related genes. Plant J. 16, 561–569. doi: 10.1046/j.1365-313x.1998.00324.x
Bowles, D., Lim, E.-K., Poppenberger, B., and Vaistij, F. E. (2006). Glycosyltransferases of lipophilic small molecules. Annu. Rev. Plant Biol. 57, 567–597. doi: 10.1146/annurev.arplant.57.032905.105429
Caverzan, A., Passaia, G., Rosa, S. B., Ribeiro, C. W., Lazzarotto, F., and Margis-Pinheiro, M. (2012). Plant responses to stresses: role of ascorbate peroxidase in the antioxidant protection. Genet. Mol. Biol. 35, 1011–1019. doi: 10.1590/s1415-47572012000600016
Chen, Z., Malamy, J., Henning, J., Conrath, U., Sánchez-Casas, P., Silva, H., et al. (1995). Induction, modification, and transduction of the salicylic acid signal in plant defense responses. Proc. Natl. Acad. Sci. U.S.A. 92, 4134–4137. doi: 10.1073/pnas.92.10.4134
Chong, J., Soufan, O., Li, C., Caraus, I., Li, S., Bourque, G., et al. (2018). MetaboAnalyst 4.0: towards more transparent and integrative metabolomics analysis. Nucleic Acids Res. 46, W486–W494.
Cofer, T. M., Seidl-Adams, I., and Tumlinson, J. H. (2018). From acetoin to (Z)-3-hexen-1-ol: the diversity of volatile organic compounds that induce plant responses. J. Agric. Food Chem. 66, 11197–11208. doi: 10.1021/acs.jafc.8b03010
Conrath, U. (2011). Molecular aspects of defence priming. Trends Plant Sci. 16, 524–531. doi: 10.1016/j.tplants.2011.06.004
Creek, D. J., Dunn, W. B., Fiehn, O., Griffin, J. L., Hall, R. D., Lei, Z., et al. (2014). Metabolite identification: are you sure? And how do your peers gauge your confidence? Metabolomics 10:350. doi: 10.1007/s11306-014-0656-8
Dai, J., and Mumper, R. J. (2010). Plant phenolics: extraction, analysis and their antioxidant and anticancer properties. Molecules 15, 7313–7352. doi: 10.3390/molecules15107313
De Gara, L., De Pinto, M. C., and Tommasi, F. (2003). The antioxidant systems vis-à-vis reactive oxygen species during plant-pathogen interaction. Plant Physiol. Biochem. 41, 863–870. doi: 10.1016/s0981-9428(03)00135-9
De Vleesschauwer, D., Yang, Y., Cruz, C. V., and Höfte, M. (2010). Abscisic acid-induced resistance against the brown spot pathogen Cochliobolus miyabeanus in rice involves MAP kinase-mediated repression of ethylene signaling. Plant Physiol. 152, 2036–2052. doi: 10.1104/pp.109.152702
Dinda, B., Debnath, S., and Banik, R. (2011). Naturally occurring iridoids and secoiridoids. An updated review, Part 4. Chem. Pharm. Bull. 59, 803–833. doi: 10.1248/cpb.59.803
Dixon, R. A., Achnine, L., Kota, P., Liu, C.-J., Reddy, M. S. S., and Wang, L. (2002). The phenylpropanoid pathway and plant defence—a genomics perspective. Mol. Plant Pathol. 3, 371–390. doi: 10.1046/j.1364-3703.2002.00131.x
Dombrowski, J. E., Kronmiller, B. A., Hollenbeck, V. G., Rhodes, A. C., Henning, J. A., and Martin, R. C. (2019). Transcriptome analysis of the model grass Lolium temulentum exposed to green leaf volatiles. BMC Plant Biol. 19:222. doi: 10.1186/s12870-019-1799-6
Dombrowski, J. E., and Martin, R. C. (2018). Activation of MAP kinases by green leaf volatiles in grasses. BMC Res. Notes 11:79. doi: 10.1186/s13104-017-3076-9
Dudareva, N., Klempien, A., Muhlemann, J. K., and Kaplan, I. (2013). Biosynthesis, function and metabolic engineering of plant volatile organic compounds. New Phytol. 198, 16–32. doi: 10.1111/nph.12145
Durrant, W., and Dong, X. (2004). Systemic acquired resistance. Annu. Rev. Phytopathol. 42, 185–209.
Engelberth, J., Alborn, H. T., Schmelz, E. A., and Tumlinson, J. H. (2004). Airborne signals prime plants against insect herbivore attack. Proc. Natl. Acad. Sci. U.S.A. 101, 1781–1785. doi: 10.1073/pnas.0308037100
Engelberth, J., Contreras, C. F., Dalvi, C., Li, T., and Engelberth, M. (2013). Early transcriptome analyses of Z-3-hexenol-treated Zea mays revealed distinct transcriptional networks and anti-herbivore defense potential of green leaf volatiles. PLoS One 8:e0077465. doi: 10.1371/journal.pone.0077465
Engelberth, J., Seidl-Adams, I., Schultz, J. C., and Tumlinson, J. H. (2007). Insect elicitors and exposure to green leafy volatiles differentially upregulate major octadecanoids and transcripts of 12-oxo phytodienoic acid reductases in Zea mays. Mol. Plant Microb. Interact. 20, 707–716. doi: 10.1094/mpmi-20-6-0707
Fall, R., Karl, T., Hansel, A., Jordan, A., and Lindinger, W. (1999). Volatile organic compounds emitted after leaf wounding: on-line analysis by proton-transfer-reaction mass spectrometry. J. Geophys. Res. Atmos. 104, 15963–15974. doi: 10.1029/1999jd900144
Farag, M., Fokar, M., Abd, H., Zhang, H., Allen, R., and Paré, P. (2005). (Z)-3-Hexenol induces defense genes and downstream metabolites in maize. Planta 220, 900–909. doi: 10.1007/s00425-004-1404-5
Feussner, I., and Polle, A. (2015). What the transcriptome does not tell—proteomics and metabolomics are closer to the plants’ patho-phenotype. Curr. Opin. Plant Biol. 26, 26–31. doi: 10.1016/j.pbi.2015.05.023
Gomi, K., Yamasaki, Y., Yamamoto, H., and Akimitsu, K. (2003). Characterization of a hydroperoxide lyase gene and effect of C6-volatiles on expression of genes of the oxylipin metabolism in Citrus. J. Plant Physiol. 160, 1219–1231. doi: 10.1078/0176-1617-01177
Hansen, S., Harholt, J., Oikawa, A., and Scheller, H. (2012). Plant glycosyltransferases beyond CAZy: a perspective on DUF families. Front. Plant Sci. 3:59. doi: 10.3389/fpls.2012.00059
Havaux, M. (2014). Carotenoid oxidation products as stress signals in plants. Plant J. 79, 597–606. doi: 10.1111/tpj.12386
Heil, M. (2014). Herbivore- induced plant volatiles: targets, perception and unanswered questions. New Phytol. 204, 297–306. doi: 10.1111/nph.12977
Hong, J., Yang, L. T., Zhang, D. B., and Shi, J. X. (2016). Plant metabolomics: an indispensable system biology tool for plant science. Intern. J. Mol. Sci. 17:767. doi: 10.3390/ijms17060767
Jae-Hak, M., Watanabe, N., Ijima, Y., and Sakata, K. (1996). cis-and trans-Linalool 3, 7-oxides and methyl salicylate glycosides and (Z)-3-hexenyl β-D-glucopyranoside as aroma precursors from tea leaves for oolong tea. Biosci. Biotechnol. Biochem. 60, 1815–1819. doi: 10.1271/bbb.60.1815
Jansen, C., Von Wettstein, D., Schafer, W., Kogel, K. H., Felk, A., and Maier, F. J. (2005). Infection patterns in barley and wheat spikes inoculated with wild-type and trichodiene synthase gene disrupted Fusarium graminearum. Proc. Natl. Acad. Sci. India Sect. B. Biol. Sci. 102, 16892–16897. doi: 10.1073/pnas.0508467102
Jones, P., and Vogt, T. (2001). Glycosyltransferases in secondary plant metabolism: tranquilizers and stimulant controllers. Planta 213, 164–174. doi: 10.1007/s004250000492
Kind, T., Scholz, M., and Fiehn, O. (2009). How large is the metabolome? A critical analysis of data exchange practices in chemistry. PLoS One 4:e5440. doi: 10.1371/journal.pone.05440
Kishimoto, K., Matsui, K., Ozawa, R., and Takabayashi, J. (2006). ETR1-, JAR1-and PAD2-dependent signaling pathways are involved in C6-aldehyde-induced defense responses of Arabidopsis. Plant Sci. 171, 415–423. doi: 10.1016/j.plantsci.2006.05.004
Kishimoto, K., Matsui, K., Ozawa, R., and Takabayashi, J. (2008). Direct fungicidal activities of C6-aldehydes are important constituents for defense responses in Arabidopsis against Botrytis cinerea. Phytochemistry 69, 2127–2132. doi: 10.1016/j.phytochem.2008.04.023
Koga, H., Dohi, K., Nakayachi, O., and Mori, M. (2004). A novel inoculation method of Magnaporthe grisea for cytological observation of the infection process using intact leaf sheaths of rice plants. Physiol. Mol. Plant Pathol. 64, 67–72. doi: 10.1016/j.pmpp.2004.07.002
Li, S., Park, Y., Duraisingham, S., Strobel, F. H., Khan, N., Soltow, Q. A., et al. (2013). Predicting network activity from high throughput metabolomics. PLoS Comput. Biol. 9:e1003123. doi: 10.1371/journal.pcbi.1003123
López-Gresa, M. P., Payá, C., Ozáez, M., Rodrigo, I., Conejero, V., Klee, H., et al. (2018). A new role for green leaf volatile esters in tomato stomatal defence against Pseudomonas syringe pv. tomato. Front. Plant Sci. 9:1855. doi: 10.3389/fpls.2018.01855
Lulin, M., Yi, S., Aizhong, C., Zengjun, Q., Liping, X., Peidu, C., et al. (2010). Molecular cloning and characterization of an up-regulated UDP-glucosyltransferase gene induced by DON from Triticum aestivum L. cv. Wangshuibai. Mol. Biol. Rep. 37:785. doi: 10.1007/s11033-009-9606-3
Martinez-Medina, A., Flors, V., Heil, M., Mauch-Mani, B., Pieterse, C. M., Pozo, M. J., et al. (2016). Recognizing plant defense priming. Trends Plant Sci. 21, 818–822. doi: 10.1016/j.tplants.2016.07.009
Matsui, K., Sugimoto, K., Mano, J., Ozawa, R., and Takabayashi, J. (2012). Differential metabolisms of green leaf volatiles in injured and intact parts of a wounded leaf meet distinct ecophysiological requirements. PLoS One 7:e36433. doi: 10.1371/journal.pone.0036433
Mhlongo, M. I., Piater, L. A., Madala, N. E., Steenkamp, P. A., and Dubery, I. A. (2016). Phenylpropanoid defences in Nicotiana tabacum cells: overlapping metabolomes indicate common aspects to priming responses induced by lipopolysaccharides, chitosan and flagellin-22. PLoS One 11:e0151350. doi: 10.1371/journal.pone.0151350
Mirabella, R., Rauwerda, H., Allmann, S., Scala, A., Spyropoulou, E. A., De Vries, M., et al. (2015). WRKY40 and WRKY6 act downstream of the green leaf volatile E-2-hexenal in Arabidopsis. Plant J. 83, 1082–1096. doi: 10.1111/tpj.12953
Morant, A. V., Jørgensen, K., Jørgensen, C., Paquette, S. M., Sánchez-Pérez, R., Møller, B. L., et al. (2008). β-Glucosidases as detonators of plant chemical defense. Phytochemistry 69, 1795–1813. doi: 10.1016/j.phytochem.2008.03.006
Nakamura, S., and Hatanaka, A. (2002). Green-leaf-derived C6-aroma compounds with potent antibacterial action that act on both gram-negative and gram-positive bacteria. J. Agric. Food Chem. 50, 7639–7644. doi: 10.1021/jf025808c
Nishikitani, M., Dongmei, W., Kubota, K., Kobayashi, A., and Sugawara, F. (1999). (Z)-3-hexenyl and trans-linalool 3, 7-oxide β-primeverosides isolated as aroma precursors from leaves of a green tea cultivar. Biosci. Biotechnol. Biochem. 63, 1631–1633. doi: 10.1271/bbb.63.1631
Ohgami, S., Ono, E., Horikawa, M., Murata, J., Totsuka, K., Toyonaga, H., et al. (2015). Volatile glycosylation in tea plants: sequential glycosylations for the biosynthesis of aroma β-primeverosides are catalyzed by two Camellia sinensis glycosyltransferases. Plant Physiol. 168, 464–477. doi: 10.1104/pp.15.00403
Paolacci, A. R., Tanzarella, O. A., Porceddu, E., and Ciaffi, M. (2009). Identification and validation of reference genes for quantitative RT-PCR normalization in wheat. BMC Mol. Biol. 10:11. doi: 10.1186/1471-2199-10-11
Pastor, V., Balmer, A., Gamir, J., Flors, V., and Mauch-Mani, B. (2014). Preparing to fight back: generation and storage of priming compounds. Front. Plant Sci. 5:295. doi: 10.3389/fpls.2014.00295
Pastor, V., Luna, E., Mauch-Mani, B., Ton, J., and Flors, V. (2013). Primed plants do not forget. Environ. Exper. Bot. 94, 46–56. doi: 10.1016/j.envexpbot.2012.02.013
Patti, G. J., Yanes, O., and Siuzdak, G. (2012). Metabolomics: the apogee of the omics trilogy. Nat. Rev. Mol. Cell Biol. 13, 263–269. doi: 10.1038/nrm3314
Piesik, D., Panka, D., Delaney, K. J., Skoczek, A., Lamparski, R., and Weaver, D. K. (2011). Cereal crop volatile organic compound induction after mechanical injury, beetle herbivory (Oulema spp.), or fungal infection (Fusarium spp.). J. Plant Physiol. 168, 878–886. doi: 10.1016/j.jplph.2010.11.010
Quintana-Rodriguez, E., Duran-Flores, D., Heil, M., and Camacho-Coronel, X. (2018). Damage-associated molecular patterns (DAMPs) as future plant vaccines that protect crops from pests. Sci. Hortic. 237, 207–220. doi: 10.1016/j.scienta.2018.03.026
Ratzinger, A., Riediger, N., Von Tiedemann, A., and Karlovsky, P. (2009). Salicylic acid and salicylic acid glucoside in xylem sap of Brassica napus infected with Verticillium longisporum. J. Plant Res. 122, 571–579. doi: 10.1007/s10265-009-0237-5
Razzaq, A., Sadia, B., Raza, A., Khalid Hameed, M., and Saleem, F. (2019). Metabolomics: a way forward for crop improvement. Metabolites 9:303. doi: 10.3390/metabo9120303
Rhee, S. G., Yang, K.-S., Kang, S. W., Woo, H. A., and Chang, T.-S. (2005). Controlled elimination of intracellular H2O2: regulation of peroxiredoxin, catalase, and glutathione peroxidase via post-translational modification. Antioxid. Redox Signal. 7, 619–626. doi: 10.1089/ars.2005.7.619
Ruttkies, C., Schymanski, E. L., Wolf, S., Hollender, J., and Neumann, S. (2016). MetFrag relaunched: incorporating strategies beyond in silico fragmentation. J. Cheminform. 8:3.
Scala, A., Allmann, S., Mirabella, R., Haring, M. A., and Schuurink, R. C. (2013). Green leaf volatiles: a Plant’s multifunctional weapon against herbivores and pathogens. Intern. J. Mol. Sci. 14, 17781–17811. doi: 10.3390/ijms140917781
Scheible, W.-R., and Pauly, M. (2004). Glycosyltransferases and cell wall biosynthesis: novel players and insights. Curr. Opin. Plant Biol. 7, 285–295. doi: 10.1016/j.pbi.2004.03.006
Škerget, M., Kotnik, P., Hadolin, M., Hraš, A. R., Simonič, M., and Knez, Ž (2005). Phenols, proanthocyanidins, flavones and flavonols in some plant materials and their antioxidant activities. Food Chem. 89, 191–198. doi: 10.1016/j.foodchem.2004.02.025
Sugimoto, K., Matsui, K., Iijima, Y., Akakabe, Y., Muramoto, S., Ozawa, R., et al. (2014). Intake and transformation to a glycoside of (Z)-3-hexenol from infested neighbors reveals a mode of plant odor reception and defense. Proc. Natl. Acad. Sci. U.S.A. 111, 7144–7149. doi: 10.1073/pnas.1320660111
Sugimoto, K., Matsui, K., and Takabayashi, J. (2015). Conversion of volatile alcohols into their glucosides in Arabidopsis. Commun. Integrat. Biol. 8:e992731. doi: 10.4161/19420889.2014.992731
Szalai, G., Kellös, T., Galiba, G., and Kocsy, G. (2009). Glutathione as an antioxidant and regulatory molecule in plants under abiotic stress conditions. J. Plant Growth Regul. 28, 66–80. doi: 10.1007/s00344-008-9075-2
Thordal-Christensen, H., Zhang, Z., Wei, Y., and Collinge, D. B. (1997). Subcellular localization of H2O2 in plants. HO2 accumulation in papillae and hypersensitive response during the barley—powdery mildew interaction. Plant J. 11, 1187–1194. doi: 10.1046/j.1365-313x.1997.11061187.x
Triba, M. N., Le Moyec, L., Amathieu, R., Goossens, C., Bouchemal, N., Nahon, P., et al. (2015). PLS/OPLS models in metabolomics: the impact of permutation of dataset rows on the K-fold cross-validation quality parameters. Mol. BioSyst. 11, 13–19. doi: 10.1039/c4mb00414k
Turlings, T. C., Tumlinson, J. H., Heath, R. R., Proveaux, A. T., and Doolittle, R. E. (1991). Isolation and identification of allelochemicals that attract the larval parasitoid, Cotesia marginiventris (Cresson), to the microhabitat of one of its hosts. J. Chem. Ecol. 17, 2235–2251. doi: 10.1007/bf00988004
Urano, K., Maruyama, K., Ogata, Y., Morishita, Y., Takeda, M., Sakurai, N., et al. (2009). Characterization of the ABA-regulated global responses to dehydration in Arabidopsis by metabolomics. Plant J. 57, 1065–1078. doi: 10.1111/j.1365-313x.2008.03748.x
Van Meulebroek, L., Vanden Bussche, J., De Clercq, N., Steppe, K., and Vanhaecke, L. (2015). A metabolomics approach to unravel the regulating role of phytohormones towards carotenoid metabolism in tomato fruit. Metabolomics 11, 667–683. doi: 10.1007/s11306-014-0728-9
Van Meulebroek, L., Vanden Bussche, J., Steppe, K., and Vanhaecke, L. (2012). Ultra-high performance liquid chromatography coupled to high resolution Orbitrap mass spectrometry for metabolomic profiling of the endogenous phytohormonal status of the tomato plant. J. Chromatogr. A 1260, 67–80. doi: 10.1016/j.chroma.2012.08.047
Ward, J. L., Forcat, S., Beckmann, M., Bennett, M., Miller, S. J., Baker, J. M., et al. (2010). The metabolic transition during disease following infection of Arabidopsis thaliana by Pseudomonas syringae pv. tomato. Plant J. 63, 443–457. doi: 10.1111/j.1365-313x.2010.04254.x
Wenda-Piesik, A., Piesik, D., Ligor, T., and Buszewski, B. (2010). Volatile organic compounds (VOCs) from cereal plants infested with crown rot: their identity and their capacity for inducing production of VOCs in uninfested plants. Intern. J. Pest Manag. 56, 377–383. doi: 10.1080/09670874.2010.505668
Yamakura, F., and Kawasaki, H. (2010). Post-translational modifications of superoxide dismutase. Biochim. Biophys. Acta Proteins Proteom. 1804, 318–325. doi: 10.1016/j.bbapap.2009.10.010
Yamauchi, Y., Kunishima, M., Mizutani, M., and Sugimoto, Y. (2015). Reactive short-chain leaf volatiles act as powerful inducers of abiotic stress-related gene expression. Sci. Rep. 5:8030.
Keywords: green leaf volatile, metabolomic, wheat, fusarium, oxidative stress
Citation: Ameye M, Van Meulebroek L, Meuninck B, Vanhaecke L, Smagghe G, Haesaert G and Audenaert K (2020) Metabolomics Reveal Induction of ROS Production and Glycosylation Events in Wheat Upon Exposure to the Green Leaf Volatile Z-3-Hexenyl Acetate. Front. Plant Sci. 11:596271. doi: 10.3389/fpls.2020.596271
Received: 18 August 2020; Accepted: 02 November 2020;
Published: 03 December 2020.
Edited by:
Michael V. Kolomiets, Texas A&M University, United StatesReviewed by:
Jurgen Engelberth, University of Texas at San Antonio, United StatesCopyright © 2020 Ameye, Van Meulebroek, Meuninck, Vanhaecke, Smagghe, Haesaert and Audenaert. This is an open-access article distributed under the terms of the Creative Commons Attribution License (CC BY). The use, distribution or reproduction in other forums is permitted, provided the original author(s) and the copyright owner(s) are credited and that the original publication in this journal is cited, in accordance with accepted academic practice. No use, distribution or reproduction is permitted which does not comply with these terms.
*Correspondence: Maarten Ameye, TWFhcnRlbi5hbWV5ZUB1Z2VudC5iZQ==; Kris Audenaert, S3Jpcy5hdWRlbmFlcnRAdWdlbnQuYmU=
Disclaimer: All claims expressed in this article are solely those of the authors and do not necessarily represent those of their affiliated organizations, or those of the publisher, the editors and the reviewers. Any product that may be evaluated in this article or claim that may be made by its manufacturer is not guaranteed or endorsed by the publisher.
Research integrity at Frontiers
Learn more about the work of our research integrity team to safeguard the quality of each article we publish.