 Zi-Piao Ye
95% of researchers rate our articles as excellent or good
Learn more about the work of our research integrity team to safeguard the quality of each article we publish.
Find out more
PERSPECTIVE article
Front. Plant Sci. , 15 September 2020
Sec. Plant Abiotic Stress
Volume 11 - 2020 | https://doi.org/10.3389/fpls.2020.581851
This article is part of the Research Topic Photosynthesis Under Fluctuating Light View all 15 articles
Accurately describing the light response curve of electron transport rate (J–I curve) and allocation of electron flow for ribulose biphosphate (RuBP) carboxylation (JC–I curve) and that for oxygenation (JO–I curve) is fundamental for modeling of light relations of electron flow at the whole-plant and ecosystem scales. The non-rectangular hyperbolic model (hereafter, NH model) has been widely used to characterize light response of net photosynthesis rate (An; An–I curve) and J–I curve. However, NH model has been reported to overestimate the maximum An (Anmax) and the maximum J (Jmax), largely due to its asymptotic function. Meanwhile, few efforts have been delivered for describing JC–I and JO–I curves. The long-standing challenge on describing An–I and J–I curves have been resolved by a recently developed An–I and J–I models (hereafter, Ye model), which adopt a nonasymptotic function. To test whether Ye model can resolve the challenge of NH model in reproducing J–I, JC–I and JO–I curves over light-limited, light-saturated, and photoinhibitory I levels, we compared the performances of Ye model and NH model against measurements on two C3 crops (Triticum aestivum L. and Glycine max L.) grown in field. The results showed that NH model significantly overestimated the Anmax and Jmax for both species, which can be accurately obtained by Ye model. Furthermore, NH model significantly overestimated the maximum electron flow for carboxylation (JC-max) but not the maximum electron flow for oxygenation (JO-max) for both species, disclosing the reason underlying the long-standing problem of NH model—overestimation of Jmax and Anmax.
Light intensity (I) is one of the most important environmental drivers affecting electron flow and its allocation for carboxylation versus oxygenation of ribulose biphosphate (RuBP). At I levels before reaching saturation intensity, the non-rectangular hyperbolic model (hereafter, NH model) is a sub-model which is widely used to characterize the light-response curve of electron transport rate (J–I curve) and to estimate the maximum J (Jmax) in C3 photosynthesis model (e.g., Farquhar et al., 1980; Farquhar and Wong, 1984; von Caemmerer, 2000; Farquhar et al., 2001; Long and Bernacchi, 2003; von Caemmerer et al., 2009; Bernacchi et al., 2013; Bellasio et al., 2015; Busch and Sage, 2017; Walker et al., 2017; Cai et al., 2018) and in C4 photosynthesis model (Berry and Farquhar, 1978; von Caemmerer and Furbank, 1999; von Caemmerer, 2013). At light saturation, Jmax is estimated by the C3 photosynthesis model (Farquhar et al., 1980; von Caemmerer, 2013; Farquhar and Busch, 2017). Accurate estimation of Jmax is important for understanding photosynthesis of C3 and C4 species. Jmax is a key quantity to represent plant photosynthetic status under different environmental conditions when the net photosynthesis rate (An) is limited by the regeneration of RuBP, associated with the partitioning of electron flow through photosystem II (PSII) for RuBP carboxylation (JC) versus that for RuBP oxygenation (JO) (Farquhar et al., 1980; Long and Bernacchi, 2003).
By simulating light-response curves of photosynthesis (An–I curve), NH model has been widely used to obtain key photosynthetic characteristics (e.g., the maximum net photosynthetic rate, Anmax; light compensation point when An = 0, Ic; dark respiration rate, Rd) for various species under different environmental conditions (e.g., Ögren & Evans, 1993; Thornley, 1998; Ye, 2007; Aspinwall et al., 2011; dos Santos et al., 2013; Mayoral et al., 2015; Sun et al., 2015; Park et al., 2016; Quiroz et al., 2017; Yao et al., 2017; Xu et al., 2019; Yang et al., 2020; Ye et al., 2020). Significant difference between observed Anmax values and that estimated by NH model for various species has been widely reported (e.g., Chen et al., 2011; dos Santos et al., 2013; Lobo et al., 2014; Ogawa, 2015; Sun et al., 2015; Quiroz et al., 2017; Poirier-Pocovi et al., 2018; Ye et al., 2020). This long-standing challenge has been resolved by an An–I model, which adopts a nonasymptotic function and can accurately reproduce An–I curve over light-limited, light-saturated and photoinhibitory I levels (Ye et al., 2013) (hereafter, Ye model).
Recently, Buckley and Diaz-Espejo (2015) proposed that NH model would overestimate Jmax due to its asymptotic function. A robust model which can accurately reproduce the observed J–I curve, and obtain Jmax, is urgently needed (Buckley and Diaz-Espejo, 2015). Furthermore, the light response of J partitioning for RuBP carboxylation and oxygenation (JC–I and JO–I curves), and the key quantities to describe the curves (e.g., the maximum JC, JC-max, and the maximum JO, JO-max, as well as their corresponding saturation light intensities) are rarely studied. Meanwhile, for the first time, we compared the performances of the two models in reproducing JC–I and JO–I curves.
This study aimed to fill these important gaps using an observation-modeling intercomparison approach. We firstly measured leaf gas exchange and chlorophyll fluorescence over a wide range of I levels for two C3 species [winter wheat (Triticum aestivum L.) and soybean (Glycine max L.)]. We then incorporated Ye model to reproduce An–I, J–I, JC–I, and JO–I curves and return key quantities defining the curves, and evaluated its performance against NH model and observations.
The experiment was conducted in the Yucheng Comprehensive Experiment Station of the Chinese Academy of Science. The detailed descriptions about soil and meteorological conditions in this experiment station were referred to Ye et al. (2019; 2020). Winter wheat was planted on October 4th, 2011 and the measurements were conducted on April 23th, 2012. Soybean was sown in on May 6th, 2013, and the measurements were performed on 27th July, 2013. Using the Li-6400-40 portable photosynthesis system (Li-Cor, Lincoln, NE, USA), measurements on leaf gas exchange and chlorophyll fluorescence were simultaneously performed on mature fully-expanded sun-exposed leaves in sunny days. J was calculated as J = ΦPSII × I × 0.5 × 0.84, where ΦPSII is the effective quantum yield of PSII (Genty et al., 1989; Krall and Edward, 1992).
For soybean, An–I curves and J–I curves were generated from applying different light intensities in a descending order of 2000, 1800, 1600, 1400, 1200, 1000, 800, 600, 400, 200, 150, 100, 80, 50, and 0 μmol m-2 s-1. For winter wheat, the light intensity gradient started from 1800 μmol m-2 s-1 as the maximum, in alignment with environmental light availability from October to April. At each I step, CO2 assimilation was monitored until a steady state was reached before logging a reading. Ambient CO2 concentration in the cuvette (Ca) was kept constant at 380 μmol mol-1. Leaf temperature in the cuvette was kept at about 30°C for winter wheat and 36°C for soybean, respectively. The observation-modeling intercomparison was conducted within each species.
NH model describes J–I curve as follows (Farquhar and Wong, 1984; von Caemmerer, 2000; von Caemmerer, 2013):
where αe is the initial slope of J–I curve, θ is the curve convexity, I is the light intensity, and Jmax is the maximum electron transport rate.
NH model describes An–I curve as follows (Ögren and Evans, 1993; Thornley, 1998; von Caemmerer, 2000):
where α is the initial slope of An–I curve, Anmax is the maximum net photosynthetic rate, and Rd is the dark respiration rate when I = 0 μmol m-2 s-1. NH model cannot return the corresponding saturation light intensities for Jmax or Anmax due to its asymptotic function.
The model developed by Ye et al. (2013, 2019; hereafter, Ye model) describes J–I curve as follows:
where αe is the initial slope of J–I curve, and βe and γe are the photoinhibition coefficient and light-saturation coefficient of J–I curve, respectively.
The saturation irradiance corresponding to the Jmax (Ie-sat) can be calculated as follows:
Using Ye model, Jmax can be calculated as follows:
Ye model describes An–I curve as follows (Ye, 2007; Ye et al., 2013):
where α is the initial slope of An–I curve, β and γ are the photoinhibition coefficient and light-saturation coefficient of An–I curve, respectively.
The saturation irradiance corresponding to Anmax (Isat) can be calculated as follows:
Using Ye model, Anmax can be calculated as follows:
Combining measurements of gas exchange and chlorophyll fluorescence was a reliable and easy-to-use technique widely used to determine JO and JC (e.g., Peterson, 1990; Comic and Briantais, 1991). In C3 plants, carbon assimilation and photorespiration are two closely linked processes catalyzed by the key photosynthetic enzyme—RuBP carboxylase/oxygenase. Photorespiration is considered as an alternative sink for light-induced photosynthetic electron, and as a process helping consume extra photosynthetic electrons under high irradiance or other stressors limiting CO2 availability at Rubisco (Stuhlfauth et al., 1990; Valentini et al., 1995; Long and Bernacchi, 2003). When the other alternative electron sinks are ignored or kept constant, the electron flow is mainly allocated for RuBP carboxylation and RuBP oxygenation (e.g. Farquhar et al., 1980; von Caemmerer, 2000; Farquhar et al., 2001; Long and Bernacchi, 2003; von Caemmerer et al., 2009; Bernacchi et al., 2013; von Caemmerer, 2013), and JC and JO can be respectively calculated as follows (Valentini et al., 1995):
where Rday is the day respiration rate, and following Fila et al. (2006), Rday = 0.5 Rd. In this study, JC and JO values calculated from Eqs. 9 and 10 were viewed as experimental observations—to be compared with modelled values derived from NH model and Ye model, respectively.
Using the same J–I modeling framework by Ye model, the light response of JC (JC–I) can be described as follows:
where αC is the initial slope of JC–I curve, and βC and γC are two coefficient of JC–I curve. The maximum JC (JC-max) and the saturation irradiance corresponding to the JC-max (IC-sat) can be calculated as follows:
Using the same J–I modeling framework by Ye model, the light response of JO (JO–I) can be described as follows:
where αO is the initial slope of JO–I curve, and βO and γO are two coefficient of JO–I curve. The maximum JO (JO-max) and the saturation irradiance corresponding to the JO-max (IO-sat) can be calculated as follows:
Meanwhile, NH model can describe the JC–I and JO–I curves as follows:
where αC is the initial slope of JC–I curve, θ is the curve convexity, and JC-max is the maximum JC, and
where αO is the initial slope of JO–I curve, θ is the curve convexity, and JO-max is the maximum JO. NH model—Eqs. 17 and 18—cannot return the corresponding saturation light intensities for JC-max or JO-max due to its asymptotic function.
Statistical tests were performed using the statistical package SPSS 18.5 statistical software (SPSS, Chicago, IL). One-Way ANOVA was used to examine differences between parameter values estimated by NH model, Ye model and observed values of each parameter (Anmax, Isat, Jmax, Ie-sat, JC-max, IC-sat, JO-max, IO-sat, etc.). Goodness of fit of the mathematical model to experimental observations was assessed using the coefficient of determination (R2 = 1 – SSE/SST, where SSE is the error sum of squares, and SST is the total sum of squares).
Soybean and winter wheat exhibited an immediate and rapid initial increase of An (α) and J (αe) with the increasing I (Figure 1 and Table 1). The increase of An and J continued until I reached the cultivar-specific maximum values (Anmax and Jmax) at their corresponding saturation light intensities (Isat and Ie-sat) (Figure 1 and Table 1). Both NH model (Eqs. 1 and 2) and Ye model (Eqs. 3 and 6) showed high level of goodness of fit (R2) to experimental observations of two species (Figure 1 and Table 1). However, compared with observations, NH model significantly overestimated Anmax and Jmax (P < 0.05) for both soybean and winter wheat (Table 1). In contrast, Anmax and Jmax values returned by Ye model were in very close agreement with the observations for both species (Table 1).
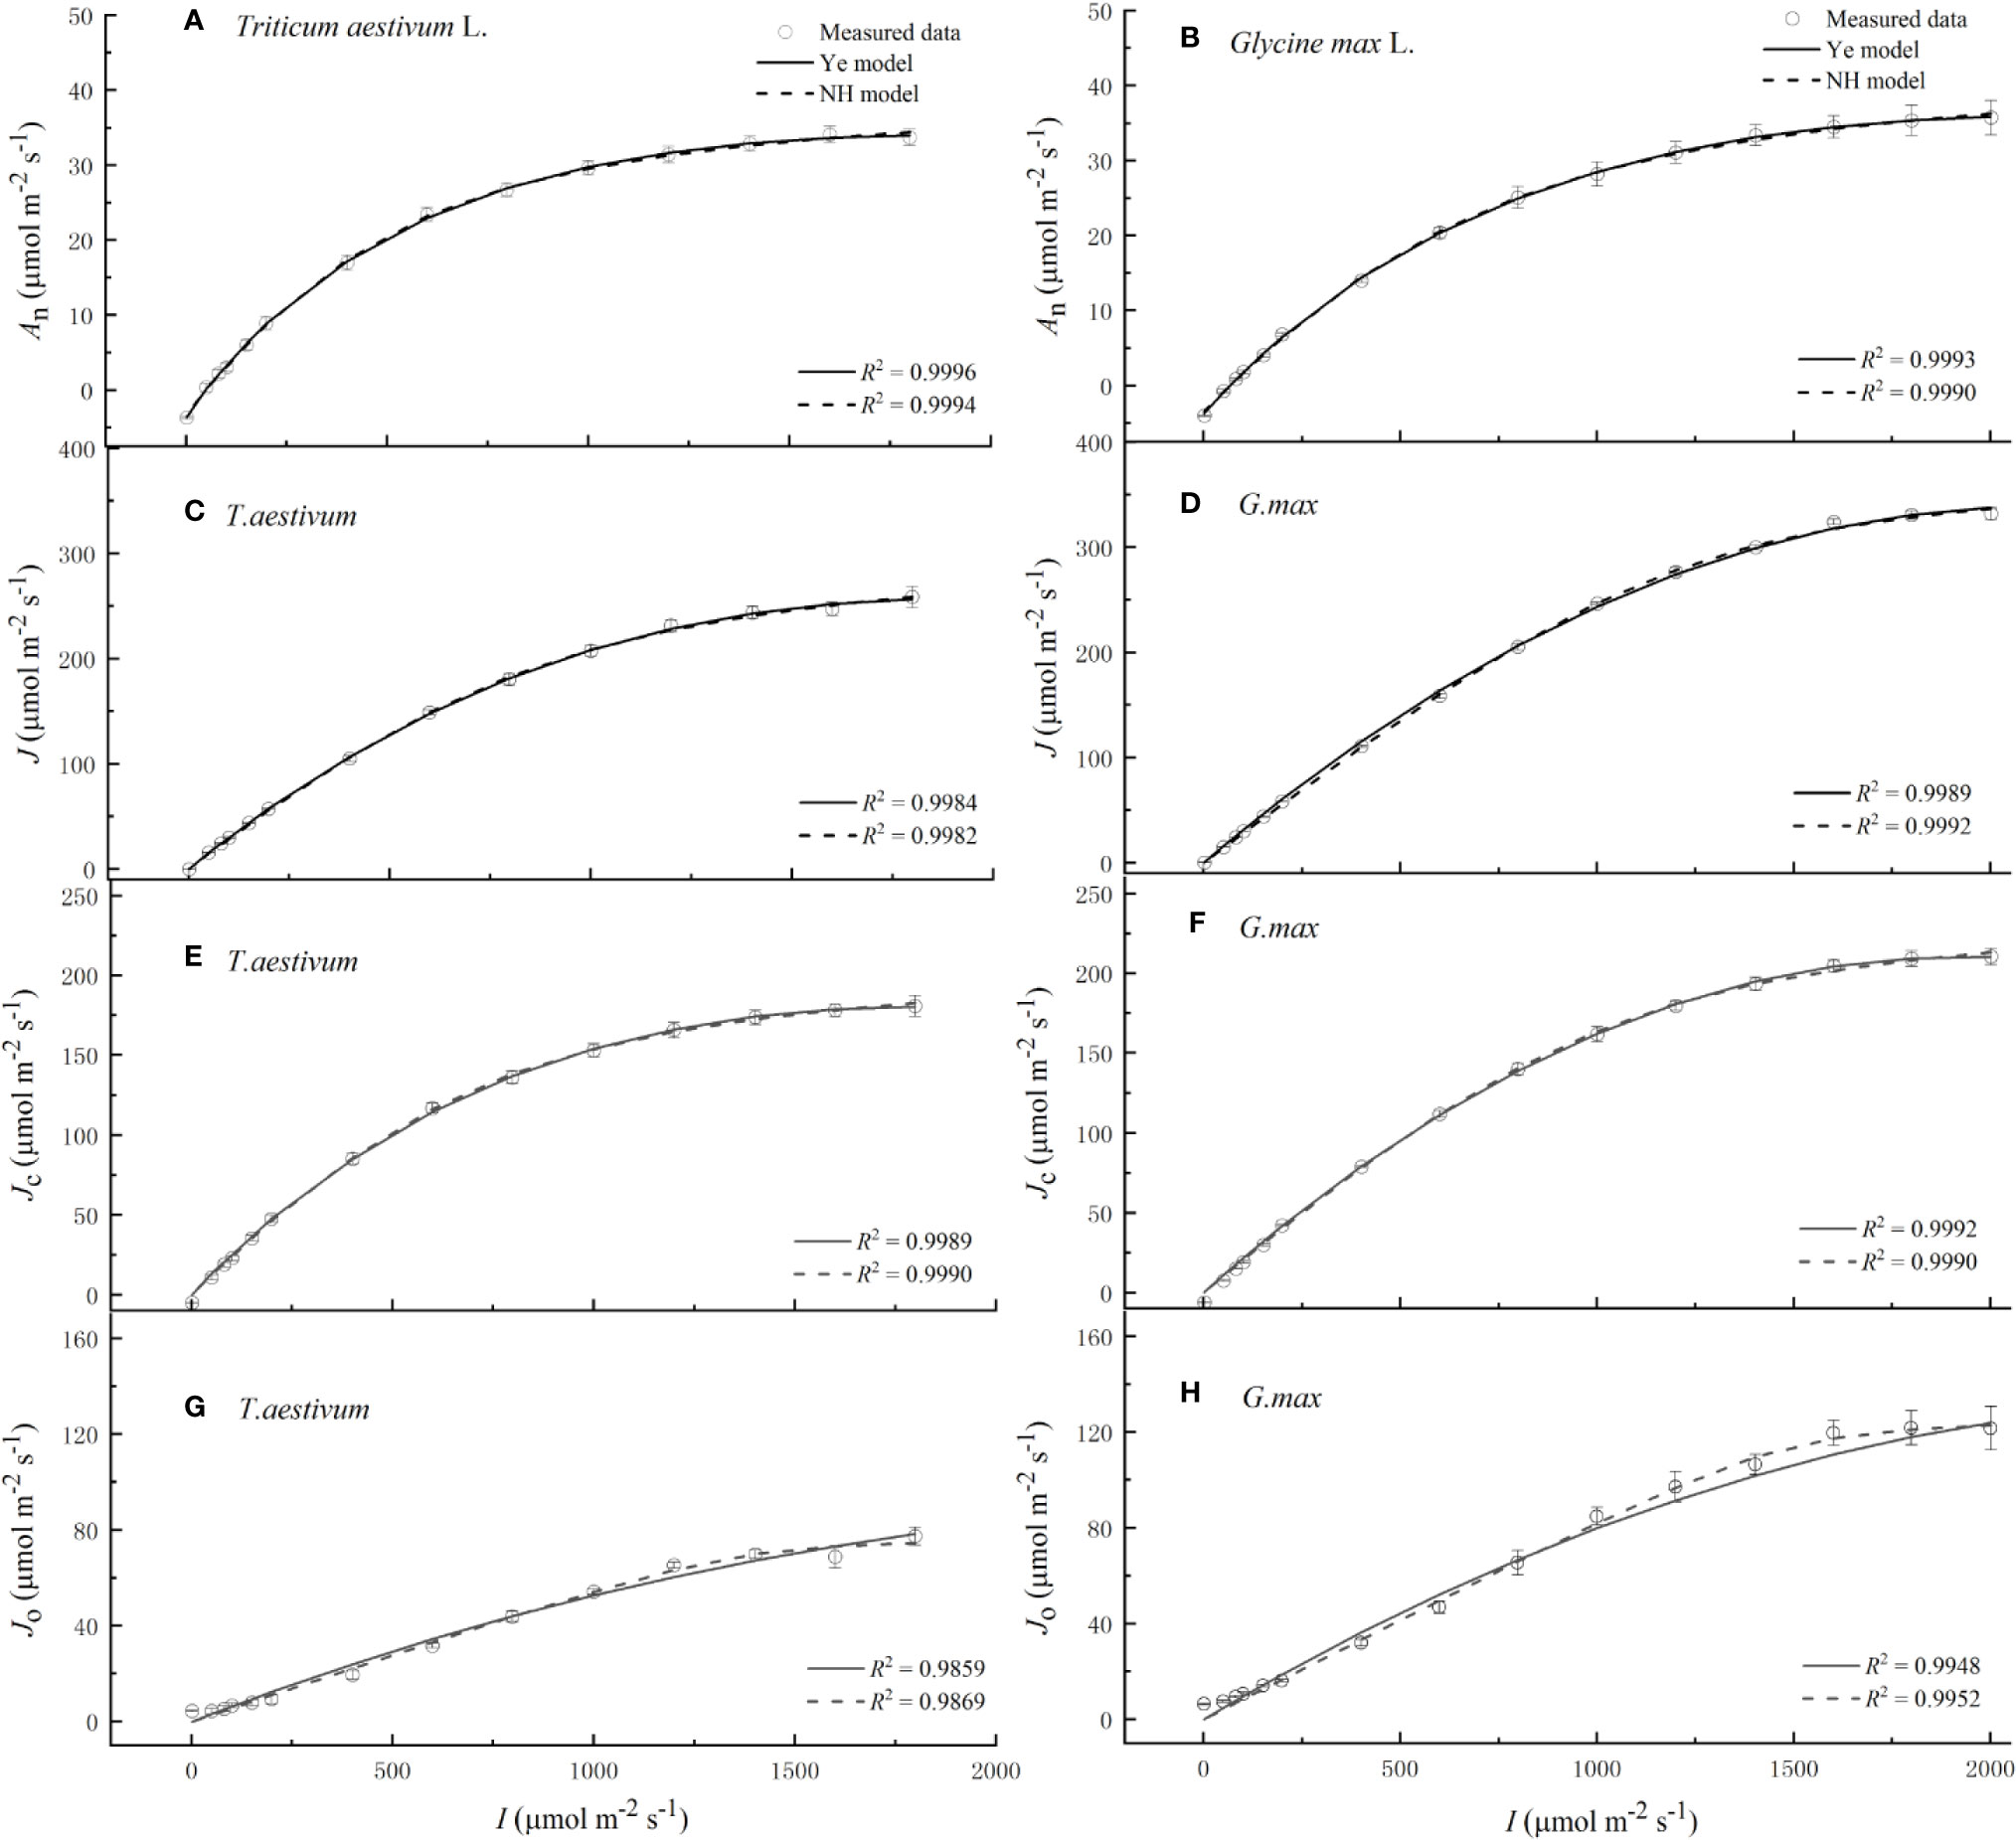
Figure 1 Light response curves of net photosynthetic rate (A, B), electron transport rate (C, D), electron flow for RuBP carboxylation (E, F) and the electron flow for RuBP oxygenation (G, H) for winter wheat (Triticum aestivum L.) and soybean (Glycine max L.), respectively, over the irradiance range from 0 to 2000 μmol m−2 s−1. Solid curves were fitted using Ye model, and dash curves were fitted using NH model. Values are means ± standard errors (n = 3).
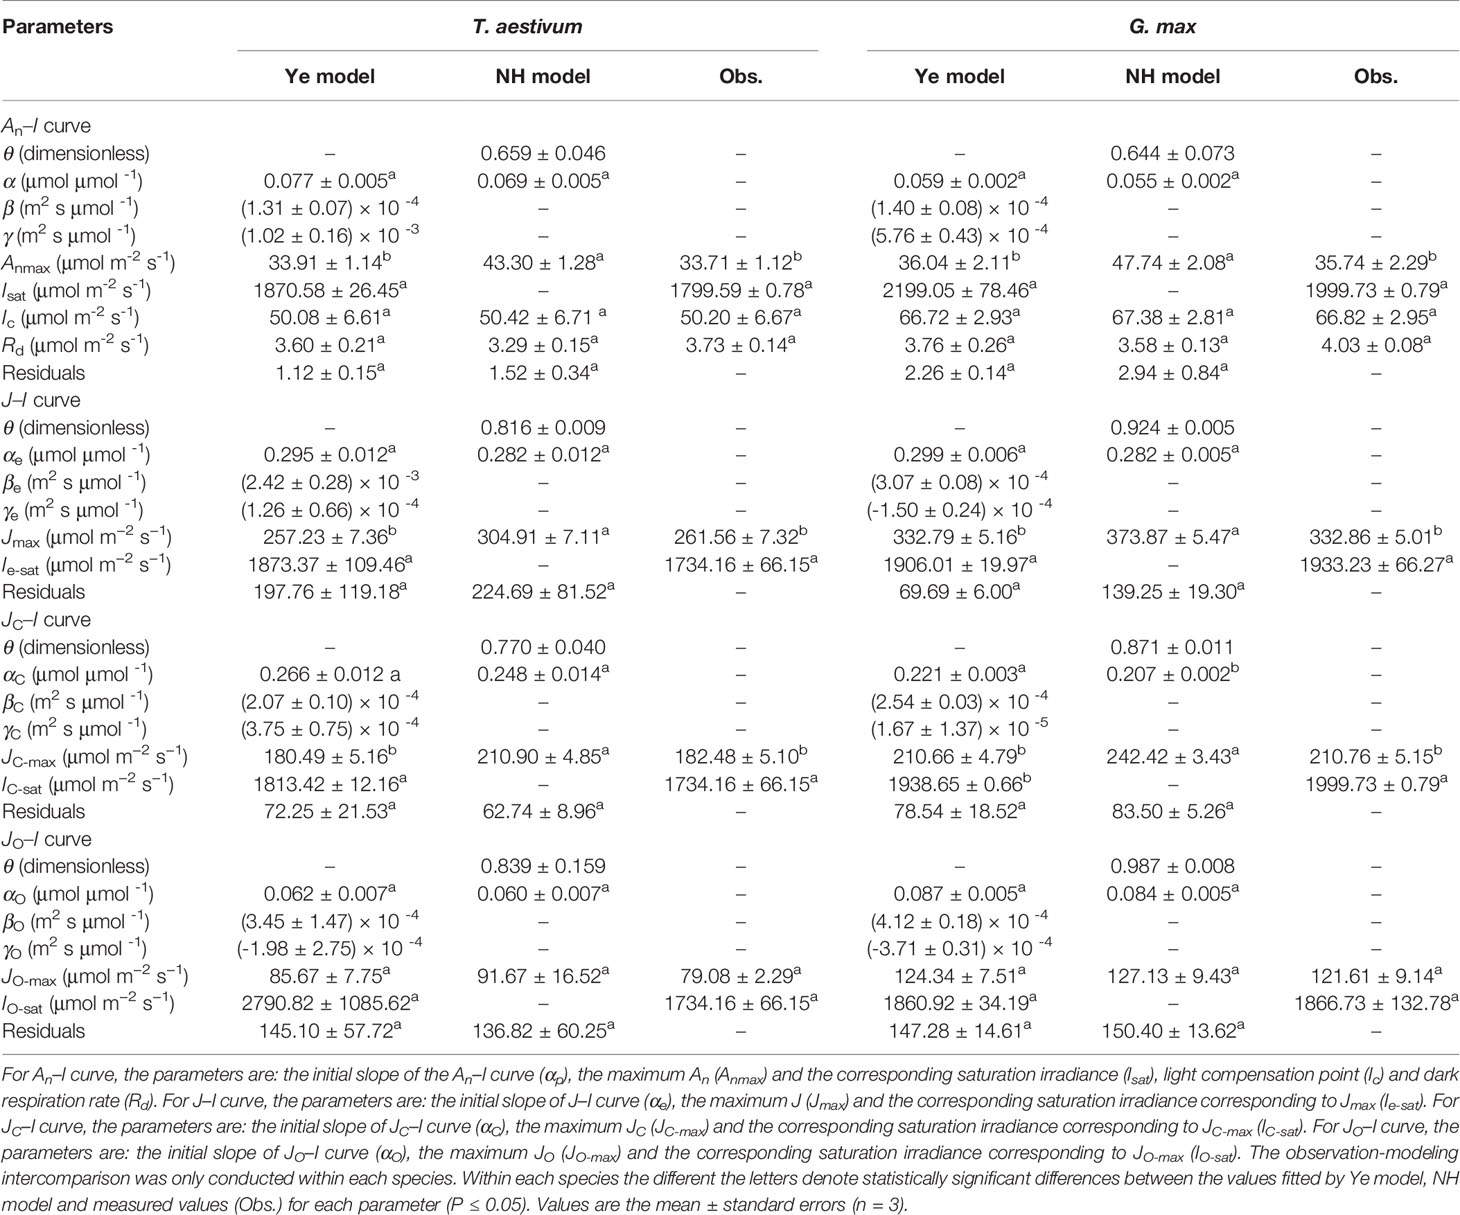
Table 1 Fitted (Ye model and NH model) and measured values (Obs.) of parameters defining the light-response curve of photosynthesis (An–I curve), electron transport rate (J–I curve), electron transport rate for RuBP carboxylation (JC–I curve), and electron transport rate for RuBP oxygenation (JO–I curve) for wheat and soybean species, respectively.
Both species exhibited an immediate and rapid initial increase of JC (αC) with the increasing I (Figure 1 and Table 1). The increase of JC continued until I reached the cultivar-specific maximum values (JC-max) at the corresponding saturation light intensity (IC-sat) (Figure 1 and Table 1). Both Ye model (Eq. 11) and NH model (Eq. 17) showed high level of goodness of fit (R2) to experimental observations of both species (Figure 1 and Table 1). However, compared with observations, NH model significantly overestimated JC-max (P < 0.05) for both soybean and winter wheat (Table 1). In contrast, JC-max values returned by Ye model were in very close agreement with the observations for both species (Table 1).
Compared to the light-response rapidness of JC, JO exhibited a much slower initial increase (αO) with the increasing I (Figure 1 and Table 1). No species showed significant difference between the observed value of JO-max and that estimated by Ye model (Eq. 14) or NH model (Eq. 18) (Table 1). Both models showed high level of goodness of fit (R2) to experimental observations of both species (Figure 1 and Table 1).
Assessed with an observation-modeling intercomparison approach, the results in this study highlight the robustness of Ye model in accurately reproducing An–I, J–I, JC–I, and JO–I curves and returning key quantities defining the curves, in particular: Anmax, Jmax, JC-max, and JO-max. On the contrary, the NH model significantly overestimates Anmax, Jmax, and JC-max (Table 1). For the first time, our study discloses the previously widely reported overestimation of Jmax (and Anmax) by the NH model is linked to its overestimation of JC-max but not JO-max.
The overestimation of Anmax by NH model found in this study is consistent with the previous reports (e.g., Calama et al., 2013; dos Santos et al., 2013; Lobo et al., 2014; Ježilová et al., 2015; Mayoral et al., 2015; Ogawa, 2015; Park et al., 2016; Quiroz et al., 2017; Poirier-Pocovi et al., 2018; Ye et al., 2020). The accurate returning of Anmax by Ye model found in this study is consistent with previous studies using Ye model for various species under different environmental conditions (e.g., Wargent et al., 2011; Zu et al., 2011; Xu et al., 2012a; Xu et al., 2012b; Lobo et al., 2014; Xu et al., 2014; Song et al., 2015; Chen et al., 2016; Ye et al., 2019; Yang et al., 2020; Ye et al., 2020). The robustness of Ye model has also been validated for microalgae observations, including four freshwater and three marine microalgae species (Yang et al., 2020). The Ye model reproduced the An–I response well for all microalgae species, and produced Isat closer to the measured values than those by three widely used models for microalgae (Yang et al., 2020). Meanwhile, the overestimation of Jmax by NH model found in this study supports Buckley and Diaz-Espejo (2015) in highlighting the demerit of the asymptotic function (i.e. NH model).
One key novelty of the present study is its evaluation of both asymptotic and nonasymptotic functions in describing the light response of electron flow allocation for carboxylation and oxygenation respectively (i.e. JC–I and JO–I curves). To the best of our knowledge, this is the first study which has experimentally evidenced the robustness of a nonasymptotic function (Eqs. 3, 11, 14) in accurately (1) reproducing J–I, JC–I, and JO–I curves and (2) returning Jmax, JC-max, and JO-max values, as well as their corresponding the saturation light intensities. These novel findings are of significance for our understanding of light responses of plant carbon assimilation and photorespiration—both are catalyzed by RuBP carboxylase/oxygenase.
The findings, and the approach of bridging experiment and modeling, in the present study remain to be tested for (1) species of different plant function types and/or climatic origin, which could exhibit different response patterns (Ye et al., 2020) and (2) plant response to interaction of multiple environmental factors (e.g., temperature, rainfall pattern, soil type) involving fluctuating light. The explicit and consistent modeling framework and parameter definitions on light responses (i.e. An–I, J–I, JC–I, and JO–I)—combined with the simplicity and robustness—allows for future transparent scaling-up of leaf-level findings to whole-plant and ecosystem scales.
Ye model can accurately estimate Anmax, Jmax, and JC-max which the NH model would overestimate. Adopting an explicit and transparent analytical framework and consistent definitions on An–I, J–I, JC–I, and JO–I curves, this study highlights the advantage of Ye model over NH model in terms of (1) its extremely well reproduction of J–I, JC–I, and JO–I trends over a wide I range from light-limited to light-inhibitory light intensities, (2) accurately returning the wealth of key quantities defining J–I, JC–I, and JO–I curves, particularly Jmax, JC-max, JO-max, and their corresponding the saturation light intensities (besides Anmax and Isat of An–I curve), and (3) being transparent in disclosing that the previously widely reported but poorly explained problem of NH model—overestimation of Jmax (and the maximum plant carboxylation capacity)—is linked to its overestimation of JC-max but not JO-max. Besides, NH model cannot obtain their saturation light intensities corresponding to Jmax, Anmax, JC-max, and JO-max due to its asymptotic function. This study is of significance for both experimentalists and modelers working on better representation of photosynthetic processes under dynamic irradiance conditions.
The raw data supporting the conclusions of this article will be made available by the authors, without undue reservation.
All authors contributed to the conception of the work. H-JK mainly performed the experiment. Z-PY and S-XZ drafted the original manuscript. All authors critically reviewed and revised the manuscript with new data sets and contributed substantially to the completion of the present study. All authors contributed to the article and approved the submitted version.
This research was supported by the Natural Science Foundation of China (Grant No. 31960054 and 31560069) and the Key Science and Technology Innovation Team Project of Wenzhou City (Grant No. C20150008).
S-XZ was employed by the company The New Zealand Institute for Plant and Food Research Limited.
The remaining authors declare that the research was conducted in the absence of any commercial or financial relationships that could be construed as a potential conflict of interest.
Aspinwall, M. J., King, J. S., McKeand, S. E., Domec, J. C. (2011). Leaf-level gas-exchange uniformity and photosynthetic capacity among loblolly pine (Pinus taeda L.) genotypes of contrasting inherent genetic variation. Tree Physiol. 31, 78–91. doi: 10.1093/treephys/tpq107
Bellasio, C., Beerling, D. J., Griffiths, H. (2015). An Excel tool for deriving key photosynthetic parameters from combined gas exchange and chlorophyll fluorescence: Theory and practice. Plant Cell Environ. 39, 1180–1197. doi: 10.1111/pce.12560
Bernacchi, C. J., Bagley, J. E., Serbin, S. P., Ruiz-Vera, U. M., Rosenthal, D. M., Vanloocke, A. (2013). Modelling C3 photosynthesis from the chloroplast to the ecosystem. Plant Cell Environ. 36, 1641–1657. doi: 10.1111/pce.12118
Berry, J. A., Farquhar, G. D. (1978). “The CO2 concentrating function of C4 photosynthesis: a biochemical model,” in The Proceedings of the Fourth International Congress on Photosynthesis. Eds. Hall, D., Coombs, J., Goodwin, T. (London: Biochemical Society of London), 119–131.
Buckley, T. N., Diaz-Espejo, A. (2015). Reporting estimates of maximum potential electron transport rate. New Phytol. 205, 14–17. doi: 10.1111/nph.13018
Busch, F. A., Sage, R. F. (2017). The sensitivity of photosynthesis to O2 and CO2 concentration identifies strong Rubisco control above the thermal optimum. New Phytol. 213, 1036–1051. doi: 10.1111/nph.14258
Cai, C., Li, G., Yang, H. L., Yang, J. H., Liu, H., Struik, P. C., et al. (2018). Do all leaf photosynthesis parameters of rice acclimate to elevated CO2, elevated temperature, and their combination, in FACE environments? Global Change Biol. 24, 1685–1707. doi: 10.1111/gcb.13961
Calama, R., Puértolas, J., Madrigal, G., Pardos, M. (2013). Modeling the environmental response of leaf net photosynthesis in Pinus pinea L. natural regeneration. Ecol. Model. 51, 9–21. doi: 10.1016/j.ecolmodel.2012.11.029
Chen, Z. Y., Peng, Z. S., Yang, J., Chen, W. Y., Ou-Yang, Z. M. (2011). A mathematical model for describing light-response curves in nicotiana tabacum l. Photosynthetica 49, 467–471. doi: 10.1007/s11099-011-0056-5
Chen, X., Liu, W. Y., Song, L., Li, S., Wu, C. S., Lu, H. Z. (2016). Adaptation of epiphytic bryophytes in the understorey attributing to the correlations and trade-offs between functional traits. J. Bryol. 38, 110–117. doi: 10.1080/03736687.2015.1120370
Comic, G., Briantais, J. M. (1991). Partitioning of photosynthetic electron flow between CO2 and O2 reduction in a C3 leaf (Phaseolus vulgaris L.) at different CO2 concentrations and during drought stress. Planta 183, 178–184. doi: 10.1007/bf00197786
dos Santos, J. U. M., de Carvalho, G. J. F., Fearnside, P. M. (2013). Measuring the impact of flooding on Amazonian trees: photosynthetic response models for ten species flooded by hydroelectric dams. Trees 27, 193–210. doi: 10.1007/s00468-012-0788-2
Farquahr, G. D., Busch, F. A. (2017). Changes in the chloroplastic CO2 concentration explain much of the observed Kok effect: a model. New Phytol. 214, 570–584. doi: 10.1111/nph.14512
Farquhar, G. D., Wong, S. C. (1984). An empirical model of stomatal conductance. Aus. J. Plant Physiol. 11, 191–210. doi: 10.1071/pp9840191
Farquhar, G. D., von Caemmerer, S., Berry, J. A. (1980). A biochemical model of photosynthetic CO2 assimilation in leaves of C3 species. Planta 149, 78–90. doi: 10.1007/BF00386231
Farquhar, G. D., von Caemmerer, S., Berry, J. A. (2001). Models of photosynthesis. Plant Physiol. 125, 42–45. doi: 10.1104/pp.125.1.42
Fila, G., Badeck, F., Meyer, S., Cerovic, Z., Ghashghaie, J. (2006). Relationships between leaf conductance to CO2 diffusion and photosynthesis in micropropagated grapevine plants, before and after ex vitro acclimatization. J. Exp. Bot. 57, 2687–2695. doi: 10.1093/jxb/erl040
Genty, B., Briantais, J. M., Baker, N. R. (1989). The relationship between the quantum yield of photosynthetic electron transport and quenching of chlorophyll fluorescence. Biochim. Biophys. Acta 990, 87–92. doi: 10.1016/s0304-4165(89)80016-9
Ježilová, E., Nožková-Hlaváčková, V., Duchoslav, M. (2015). Photosynthetic characteristics of three ploidy levels of Allium oleraceum L. (Amaryllidaceae) differing in ecological amplitude. Plant Spec. Biol. 30, 212–224. doi: 10.1111/1442-1984.12053
Krall, J. P., Edward, G. E. (1992). Relationship between photosystem II activity and CO2 fixation in leaves. Physiol. Plant 86, 180–187. doi: 10.1111/j.1399-3054.1992.tb01328.x
Lobo, F. D. A., Barros, M. P. D., Dalmagro, H. J., Dalmolin, Â.C., Pereira, W. E., de Souza, É.C., et al. (2014). Fitting net photosynthetic light-response curves with microsoft excel – a critical look at the models. Photosynthetica 52, 445–456. doi: 10.1007/s11099-014-0045-6
Long, S. P., Bernacchi, C. J. (2003). Gas exchange measurements, what can they tell us about the underlying limitations to photosynthesis? Procedures and sources of error. J. Exp. Bot. 54, 2393–2401. doi: 10.1093/jxb/erg262
Mayoral, C., Calama, R., Sánchez-González, M., Pardos, M. (2015). Modelling the influence of light, water and temperature on photosynthesis in young trees of mixed Mediterranean forests. New For. 46, 485–506. doi: 10.1007/s11056-015-9471-y
Ogawa, K. (2015). Mathematical consideration of the pipe model theory in woody plant species. Trees 29, 695–704. doi: 10.1007/s00468-014-1147-2
Ögren, E., Evans, J. R. (1993). Photosynthetic light-response curves. Planta 189, 182–190. doi: 10.1007/BF00195075
Park, K. S., Bekhzod, K., Kwon, J. K., Son, J. E. (2016). Development of a coupled photosynthetic model of sweet basil hydroponically grown in plant factories. Hortic. Environ. Biotechnol. 57, 20–26. doi: 10.1007/s13580-016-0019-7
Peterson, R. B. (1990). Effects of irradiance on the in vivo CO2:O2 specificity factor in tobacco using simultaneous gas exchange and fluorescence techniques. Plant Physiol. 94, 892–898. doi: 10.1104/pp.94.3.892
Poirier-Pocovi, M., Lothier, J., Buck-Sorlin, G. (2018). Modelling temporal variation of parameters used in two photosynthesis models: influence of fruit load and girdling on leaf photosynthesis in fruit-bearing branches of apple. Ann. Bot. 121, 821–832. doi: 10.1093/aob/mcx139
Quiroz, R., Loayza, H., Barreda, C., Gavilán, C., Posadas, A., Ramírez, D. A. (2017). Linking process- based potato models with light reflectance data: Does model complexity enhance yield prediction accuracy? Europ. J. Agron. 82, 104–112. doi: 10.1016/j.eja.2016.10.008
Song, L., Zhang, Y. J., Chen, X., Li, S., Lu, H. Z., Wu, C. S., et al. (2015). Water relations and gas exchange of fan bryophytes and their adaptations to microhabitats in an Asian subtropical montane cloud forest. J. Plant Res. 128, 573–584. doi: 10.1007/s10265-015-0721-z
Stuhlfauth, T. R., Scheuermann, R., Foek, H. P. (1990). Light energy dissipation under water stress conditions. Contribution of reassimilation and evidence for additional processes. Plant Physiol. 92, 1053–1061. doi: 10.1104/pp.92.4.1053
Sun, J. S., Sun, J. D., Feng, Z. Z. (2015). Modelling photosynthesis in flag leaves of winter wheat (Triticum aestivum) considering the variation in photosynthesis parameters during development. Funct. Plant Biol. 42, 1036–1044. doi: 10.1071/FP15140
Thornley, J. H. M. (1998). Dynamic model of leaf photosynthesis with acclimation to light and nitrogen. Ann. Bot. 81, 431–430. doi: 10.1006/anbo.1997.0575
Valentini, R., Epron, D., Angelis, P. D., Matteucci, G., Dreyer, E. (1995). In situ estimation of net CO2 assimilation, photosynthetic electron flow and photorespiration of Turkey oak (Q. cerris L.) leaves: diurnal cycles under different water supply. Plant Cell Environ. 18, 631–640. doi: 10.1111/j.1365-3040.1995.tb00564.x
von Caemmerer, S., Furbank, R. T. (1999). “Modeling of C4 photosynthesis,” in C4 Plant Biology. Eds. Sage, R. F., Monson, R. (San Diego, CA: Academic Press), 169–207.
von Caemmerer, S., Farquhar, G. D., Berry, J. A. (2009). “Biochemical model of C3 photosynthesis,” in Photosynthesis in Silico. Understanding Complexity from Molecules to Ecosystemns. Eds. Laisk, A., Nedbal, L., Govindjee (Dordrecht, Netherlands: Springer), 209–230.
von Caemmerer, S. (2000). Biochemical Models of Leaf Photosynthesis (Victoria, Australia: Csiro Publishing).
von Caemmerer, S. (2013). Steady-state models of photosynthesis. Plant Cell Environ. 36, 1617–1630. doi: 10.1111/pce.12098
Walker, B. J., Orr, D. J., Carmo-Silva, E., Parry, M. A., Bernacchi, C. J., Ort, D. R. (2017). Uncertainty in measurements of the photorespiratory CO2 compensation point and its impact on models of leaf photosynthesis. Photosyn. Res. 132, 245–255. doi: 10.1007/s11120-017-0369-8
Wargent, J. J., Elfadly, E. M., Moore, J. P., Paul, N. D. (2011). Increased exposure to uv-b radiation during early development leads to enhanced photoprotection and improved long-term performance in lactuca sativa. Plant Cell Environ. 34, 1401–1413. doi: 10.1111/j.1365-3040.2011.02342.x
Xu, Z. F., Yin, H. J., Xiong, P., Wan, C., Liu, Q. (2012a). Short-term responses of Picea asperata seedlings of different ages grown in two contrasting forest ecosystems to experimental warming. Environ. Exp. Bot. 77, 1–11. doi: 10.1016/j.envexpbot.2011.10.011
Xu, Z. F., Hu, T. X., Zhang, Y. B. (2012b). Effects of experimental warming on phenology, growth and gas exchange of treeline birch (Betula utilis) saplings, Eastern Tibetan Plateau, China. Eur. J. For. Res. 131, 811–819. doi: 10.1007/s10342-011-0554-9
Xu, J. Z., Yu, Y. M., Peng, S. Z., Yang, S. H., Liao, L. X. (2014). A modified nonrectangular hyperbola equation for photosynthetic light-response curves of leaves with different nitrogen status. Photosynthetica 52, 117–123. doi: 10.1007/s11099-014-0011-3
Xu, J., Lv, Y., Liu, X., Wei, Q., Liao, L. (2019). A general non-rectangular hyperbola equation for photosynthetic light response curve of rice at various leaf ages. Sci. Rep. 9, 9909. doi: 10.1038/s41598-019-46248-y
Yang, X. L., Liu, L. H., Yin, Z. K., Wang, X. Y., Wang, S. B., Ye, Z. P. (2020). Quantifying photosynthetic performance of phytoplankton based on photosynthesis–irradiance response models. Environ. Sci. Eur. 32, 24. doi: 10.1186/s12302-020-00306-9
Yao, X., Zhou, H., Zhu, Q., Li, C. H., Zhang, H. J., Hu, J. J., et al. (2017). Photosynthetic response of soybean leaf to wide light-fluctuation in maize-soybean intercropping system. Front. Plant Sci. 8, 1695. doi: 10.3389/fpls.2017.01695
Ye, Z. P., Suggett, J. D., Robakowski, P., Kang, H. J. (2013). A mechanistic model for the photosynthesis-light response based on the photosynthetic electron transport of PS II in C3 and C4 species. New Phytol. 152, 1251–1262. doi: 10.1111/nph.12242
Ye, Z. P., Liu, Y. G., Kang, H. J., Duan, H. L., Chen, X. M., Zhou, S. X. (2019). Comparing two measures of leaf photorespiration rate across a wide range of light intensities. J. Plant Physiol. 240, 153002. doi: 10.1016/j.jplph.2019.153002
Ye, Z.-P., Ling, Y., Yu, Q., Duan, H.-L., Kang, H.-J., Huang, G.-M., et al. (2020). Quantifying light response of leaf-scale water-use efficiency and its interrelationships with photosynthesis and stomatal conductance in C3 and C4 Species. Front. Plant Sci. 11, 374. doi: 10.3389/fpls.2020.00374
Ye, Z. P. (2007). A new model for relationship between irradiance and the rate of photosynthesis in Oryza sativa. Photosynthetica 45, 637–640. doi: 10.1007/s11099-007-0110-5
Keywords: photosynthesis, light response curve, electron flow partitioning, maximum J, saturation light intensity, ribulose biphosphate carboxylation, ribulose biphosphate oxygenation, model
Citation: Ye Z-P, Kang H-J, An T, Duan H-L, Wang F-B, Yang X-L and Zhou S-X (2020) Modeling Light Response of Electron Transport Rate and Its Allocation for Ribulose Biphosphate Carboxylation and Oxygenation. Front. Plant Sci. 11:581851. doi: 10.3389/fpls.2020.581851
Received: 10 July 2020; Accepted: 25 August 2020;
Published: 15 September 2020.
Edited by:
Stefano Santabarbara, National Research Council (CNR), ItalyReviewed by:
Yanbo Hu, Northeast Forestry University, ChinaCopyright © 2020 Ye, Kang, An, Duan, Wang, Yang and Zhou. This is an open-access article distributed under the terms of the Creative Commons Attribution License (CC BY). The use, distribution or reproduction in other forums is permitted, provided the original author(s) and the copyright owner(s) are credited and that the original publication in this journal is cited, in accordance with accepted academic practice. No use, distribution or reproduction is permitted which does not comply with these terms.
*Correspondence: Shuang-Xi Zhou, shuangxi.zhou@plantandfood.co.nz; Xiao-Long Yang, yxl327813040@163.com
†These authors have contributed equally to this work
Disclaimer: All claims expressed in this article are solely those of the authors and do not necessarily represent those of their affiliated organizations, or those of the publisher, the editors and the reviewers. Any product that may be evaluated in this article or claim that may be made by its manufacturer is not guaranteed or endorsed by the publisher.
Research integrity at Frontiers
Learn more about the work of our research integrity team to safeguard the quality of each article we publish.