 Xiongfang Liu
 Yongpeng Ma
 Youming Wan1
 Hong Ma
- 1Research Institute of Resources Insects, Chinese Academy of Forestry, Kunming, China
- 2Yunnan Key Laboratory for Integrative Conservation of Plant Species with Extremely Small Populations, Kunming Institute of Botany, Chinese Academy of Sciences, Kunming, China
Phyllanthus emblica L. is a well-known medicinal and edible plant species. Various medicinal compounds in the fruit make it an important medicinal and promising economic material. The plant is widely distributed in Southwestern and Southern China. However, due to massive deforestation and land reclamation as well as deterioration of its natural habitat in recent years, the wild resources of this species have been sharply reduced, and it is rare to see large-scale wild P. emblica forests so far. In order to effectively protect and rationally utilize this species, we investigated the genetic diversity, genetic structure, and population dynamics of 260 individuals from 10 populations of P. emblica sampled from the dry climate area in Yunnan and wet climate area in Guangxi using 20 polymorphic EST-SSR markers. We found high genetic diversity at the species level (He = 0.796) and within populations (He = 0.792), but low genetic differentiation among populations (FST = 0.084). In addition, most genetic variation existed within populations (92.44%) compared with variation among the populations (7.56%). Meanwhile, the NJ tree, STRUCTURE, and hierarchical analysis suggested that the sampled individuals were clustered into two distinct genetic groups. In contrast, the genetic diversity of the dry climate group (He = 0.786, Na = 11.790, I = 1.962) was higher than that of the wet climate group (He = 0.673, Na = 9.060, I = 1.555), which might be attributed to the combined effects of altitude, precipitation, and geographic distance. Interestingly, only altitude and precipitation had significant pure effects on the genetic diversity, and the former was slightly stronger. In addition, DIYABC analysis suggested the effective population size of P. emblica might have contracted in the beginning of the Last Glacial Maximum. These genetic features provided vital information for the conservation and sustainable development of genetic resources of P. emblica, and they also provided new insights and guidelines for ecological restoration and economic development in dry-hot valleys of Yunnan and karst areas in Guangxi.
Introduction
Phyllanthus emblica is a perennial deciduous tree or shrub distributed across tropical and subtropical areas. It contains many medicinal compounds such as vitamin C, flavonoids, emblicol, emblicanin A/B, and is used as a daily medication by many ethnic minorities such as Tibetan group in China; its various therapeutic effects such as hepatoprotective, antimicrobials have also been confirmed in modern medical research (Variya et al., 2016; Chaphalkar et al., 2017). The World Health Organization has listed it as one of the three health-care plants that are widely planted throughout the world (Li and Zhao, 2007). Its seeds contain high contents of unsaturated fatty acids, such as linoleic and linolenic acid, making it an important potential raw industrial material (Choudhary and Grover, 2019). In nature, P. emblica is mainly pollinated by wind and bees (Bajpai, 1957), and the long-distance transmission of pollen provides the chances of long-distance genetic migration between different populations (Nakanishi et al., 2020). In nature, P. emblica usually depends on seed propagation, and long-distance seed dispersal must depend on certain fruit-eating animals (Li and Zhao, 2007). In China, P. emblica is mainly distributed south of the Yangtze River with a large distribution in the east-west direction, from the humid area in the east to the dry-hot valley formed by the wind-burning effect in the west. The Yunnan dry-hot valley is located on the southern edge of the Hengduan Mountains in the Biodiversity Center in Southwest China. It exhibits unique characteristics of dry-hot valleys due to its geographical location and climate: the average annual precipitation is 600–800 mm, and the annual average evaporation is 3–6 times higher than the precipitation. Precipitation is mainly concentrated in the rainy season, whereas the dry season is extremely arid, which is similar to the typical savannah climate (Jin and Ou, 2000). In contrast, the area near the Tropic of Cancer in central Guangxi belongs to the south subtropical monsoon climate zone with abundant rainfall. Although these two climate types are clearly different, P. emblica is distributed in both of these areas and has adapted well to their respective habitats during its long-term evolution. However, since the 1980s, the wild genetic resources of P. emblica in China have sharply decreased, and its natural habitat has become severely fragmented as a consequence of unreasonably high levels of development and land utilization (Li and Zhao, 2007). Thus, it is highly important to explore the genetic diversity of P. emblica to be able to effectively protect this medicinal, economic and industrial plant species along with rationally developing and utilizing it as an important resource.
Rational utilization and protection of a species depends on understanding its distribution, differentiation, and factors influencing its genetic diversity, which is the basis of species’ adaptation to changing environment (Solbrig, 1991). Particularly, for long-lived woody species, genetic diversity not only determines their ability to adapt to the environment but also forms the basis for maintaining long-term stability of forest ecosystems (Hamrick et al., 1992; Ony et al., 2020; Wells et al., 2020). With the increase in genetic diversity within species, their ability to adapt to environmental changes increases, whereas the decrease or disappearance of genetic diversity often results in low adaptability, reproduction, and disease resistance (Hamrick et al., 1992). In general, the decline in population size may cause a decline in genetic diversity through genetic drift and inbreeding (Hamrick et al., 1992). In the long term, the decrease in genetic diversity may lead to the loss of the ability of adaptation to environmental changes and evolutionary capabilities (Lande, 1993; Kaljund and Jaaska, 2010). Therefore, the protection and maintenance of genetic diversity has important theoretical and practical implications for the protection and utilization of plant resources and genetic improvement of forest tree species. The genetic diversity and structure of populations or species can be attributed to multiple factors, such as distribution ranges, life forms, breeding systems, seed dispersal mechanisms, evolutionary history, climate factors, and human interference (overexploitation, overgrazing, landslides, and fragmentation) (Hamrick and Godt, 1996; Sarin et al., 2015; Gaisberger et al., 2020; Zhou et al., 2020). Identifying climatic factors affecting genetic diversity may provide insights into genetic conservation of species in the context of rapid global climate change. Many studies have explored the impact of climate change on species distribution and genetic structure, confirming that climate change may indirectly affect species distribution to reduce the richness of genetic resources (Abeysinghe et al., 2000; Tan et al., 2018; Garot et al., 2019; Helmstetter et al., 2020). However, different climatic factors play different roles in this process. So far, little is understood about how precipitation and altitude shape the genetic diversity of species. It is known that P. emblica is only distributed in Southern and Southwestern areas in China, both in typical dry climate areas and wet climate areas (Pathak, 2003). In addition, in the field investigation, we observed that this species had larger population sizes and better fruit traits (such as fruit size, color and taste) in dry climate areas than that in wet climate areas. Therefore, we hypothesized that altitude and geographical location as well as the environmental stress caused by the long-term extreme precipitation synthetically made the P. emblica populations in dry climate areas have high genetic diversity and environmental adaptability.
SSR markers have been widely used in genetic diversity studies because of their co-dominance, high polymorphism rate, good reproducibility, and rapid excavation at a low cost (Bouck and Vision, 2007; Nasim et al., 2020). Based on 20 highly polymorphic EST-SSR markers developed in our previous study (Liu et al., 2018), we evaluated the genetic structure, bottleneck effect, and effective population size of 10 P. emblica populations distributed in typical dry-hot climate areas and typical humid climate areas. We aimed to answer the following questions: (1) What is the level of genetic diversity of P. emblica in both of these typical climate areas? (2) What is the relative importance of geographic and environmental distance as well as precipitation and altitude to the genetic diversity of P. emblica? (3) What is the population dynamics of the species? We hoped to provide a reference for the protection and rational utilization of the wild resources of P. emblica as well as theoretical guidance for the ecological restoration and economic development of mountainous areas in China.
Materials and Methods
Plant Materials and Study Sites
A total of 260 P. emblica samples were collected from 10 wild populations (YMA, YMB, BCA, BCB, BCC, MSA, MSB, MSC, MSD, and MSE) which were distributed in two main climate areas: arid areas (Yuanmou County and Binchuan County in Yunnan) and humid areas (Mashan County in Guangxi) (Figures 1, 2). The altitude and 12 bioclimatic factors (Fick and Hijmans, 2017) showed significant differences between these two climate areas (Supplementary Table S1). The five populations in the Yunnan dry-hot area were located above 1000 m, whereas the five populations in the humid area of Guangxi were all located below 500 m. The average annual precipitation in the area of the five populations in Yunnan was lower than 900 mm, whereas that in the area of the five populations in Guangxi was higher than 1700 mm. In addition, in order to avoid repeated clone sampling, the sampled individuals in every population were at least 15 m apart from each other when collecting leaves. The collected leaf tissues were quickly dried with silica gel and stored at −20°C until further analyses.
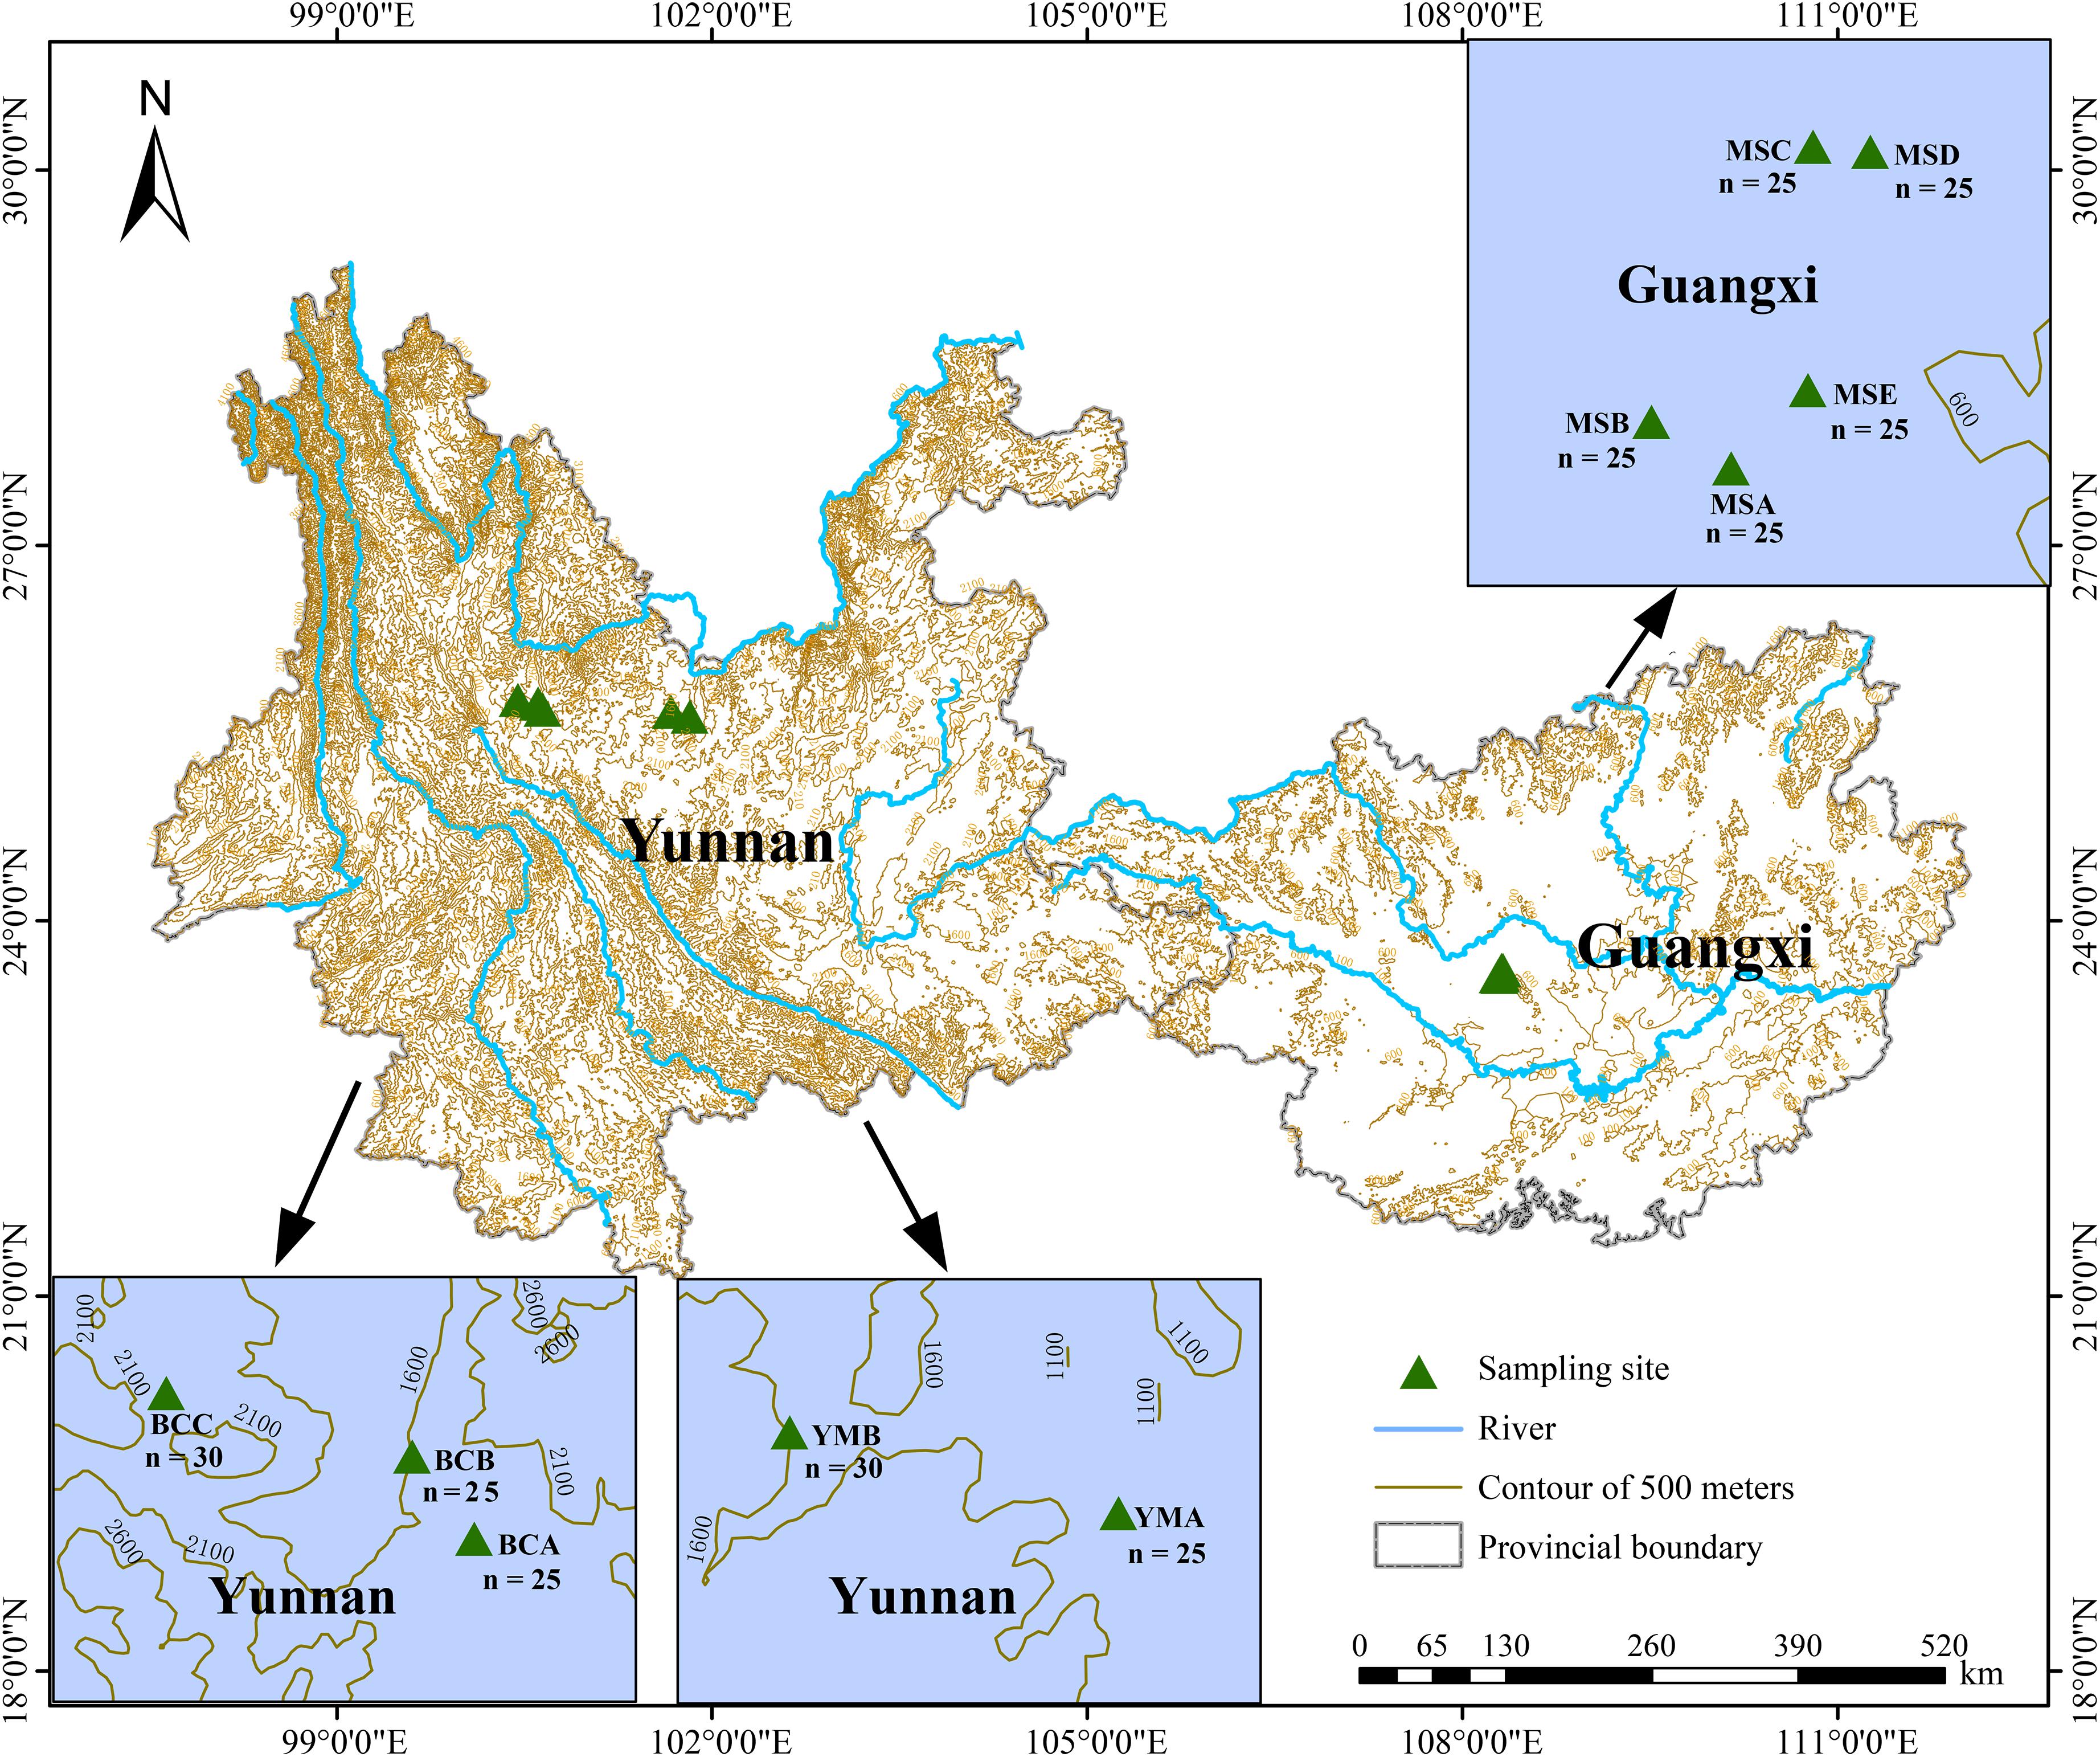
Figure 1. Geographical distribution of the 10 populations of P. emblica in this study. The populations YMA, YMB, respectively, represent sampling sites A (25°37′56″N, 101°49′12″E, 1174.8 m a.s.l.) and B (25°40′09″N, 101°40′09″E, 1245.8 m a.s.l.) in Yuanmou County, Yunnan Province; the populations BCA, BCB, and BCC respectively represent sampling sites A (25°41′20″N, 100°38′39″E, 1667.7 m a.s.l.), B (25°44′15″N, 100°36′22″E, 1627.8 m a.s.l.), and C (25°45′57″N, 100°26′28″E, 1742.1 m a.s.l.) in Binchuan County, Yunnan Province; the populations MSA, MSB, MSC, MSD, and MSE respectively represent sampling sites A (23°33′02″N, 108°17′43″E, 253.1 m a.s.l.), B (23°33′31″N, 108°16′53″E, 221.0 m a.s.l.), C (23°36′23″N, 108°18′34″E, 214.2 m a.s.l.), D (23°36′20″N, 108°19′10″E, 339.2 m a.s.l.), and E (23°33′51″N, 108°18′31″E, 242.5 m a.s.l.) in Mashan County, Guangxi Province. The number of samples is detailed in the map of each population.
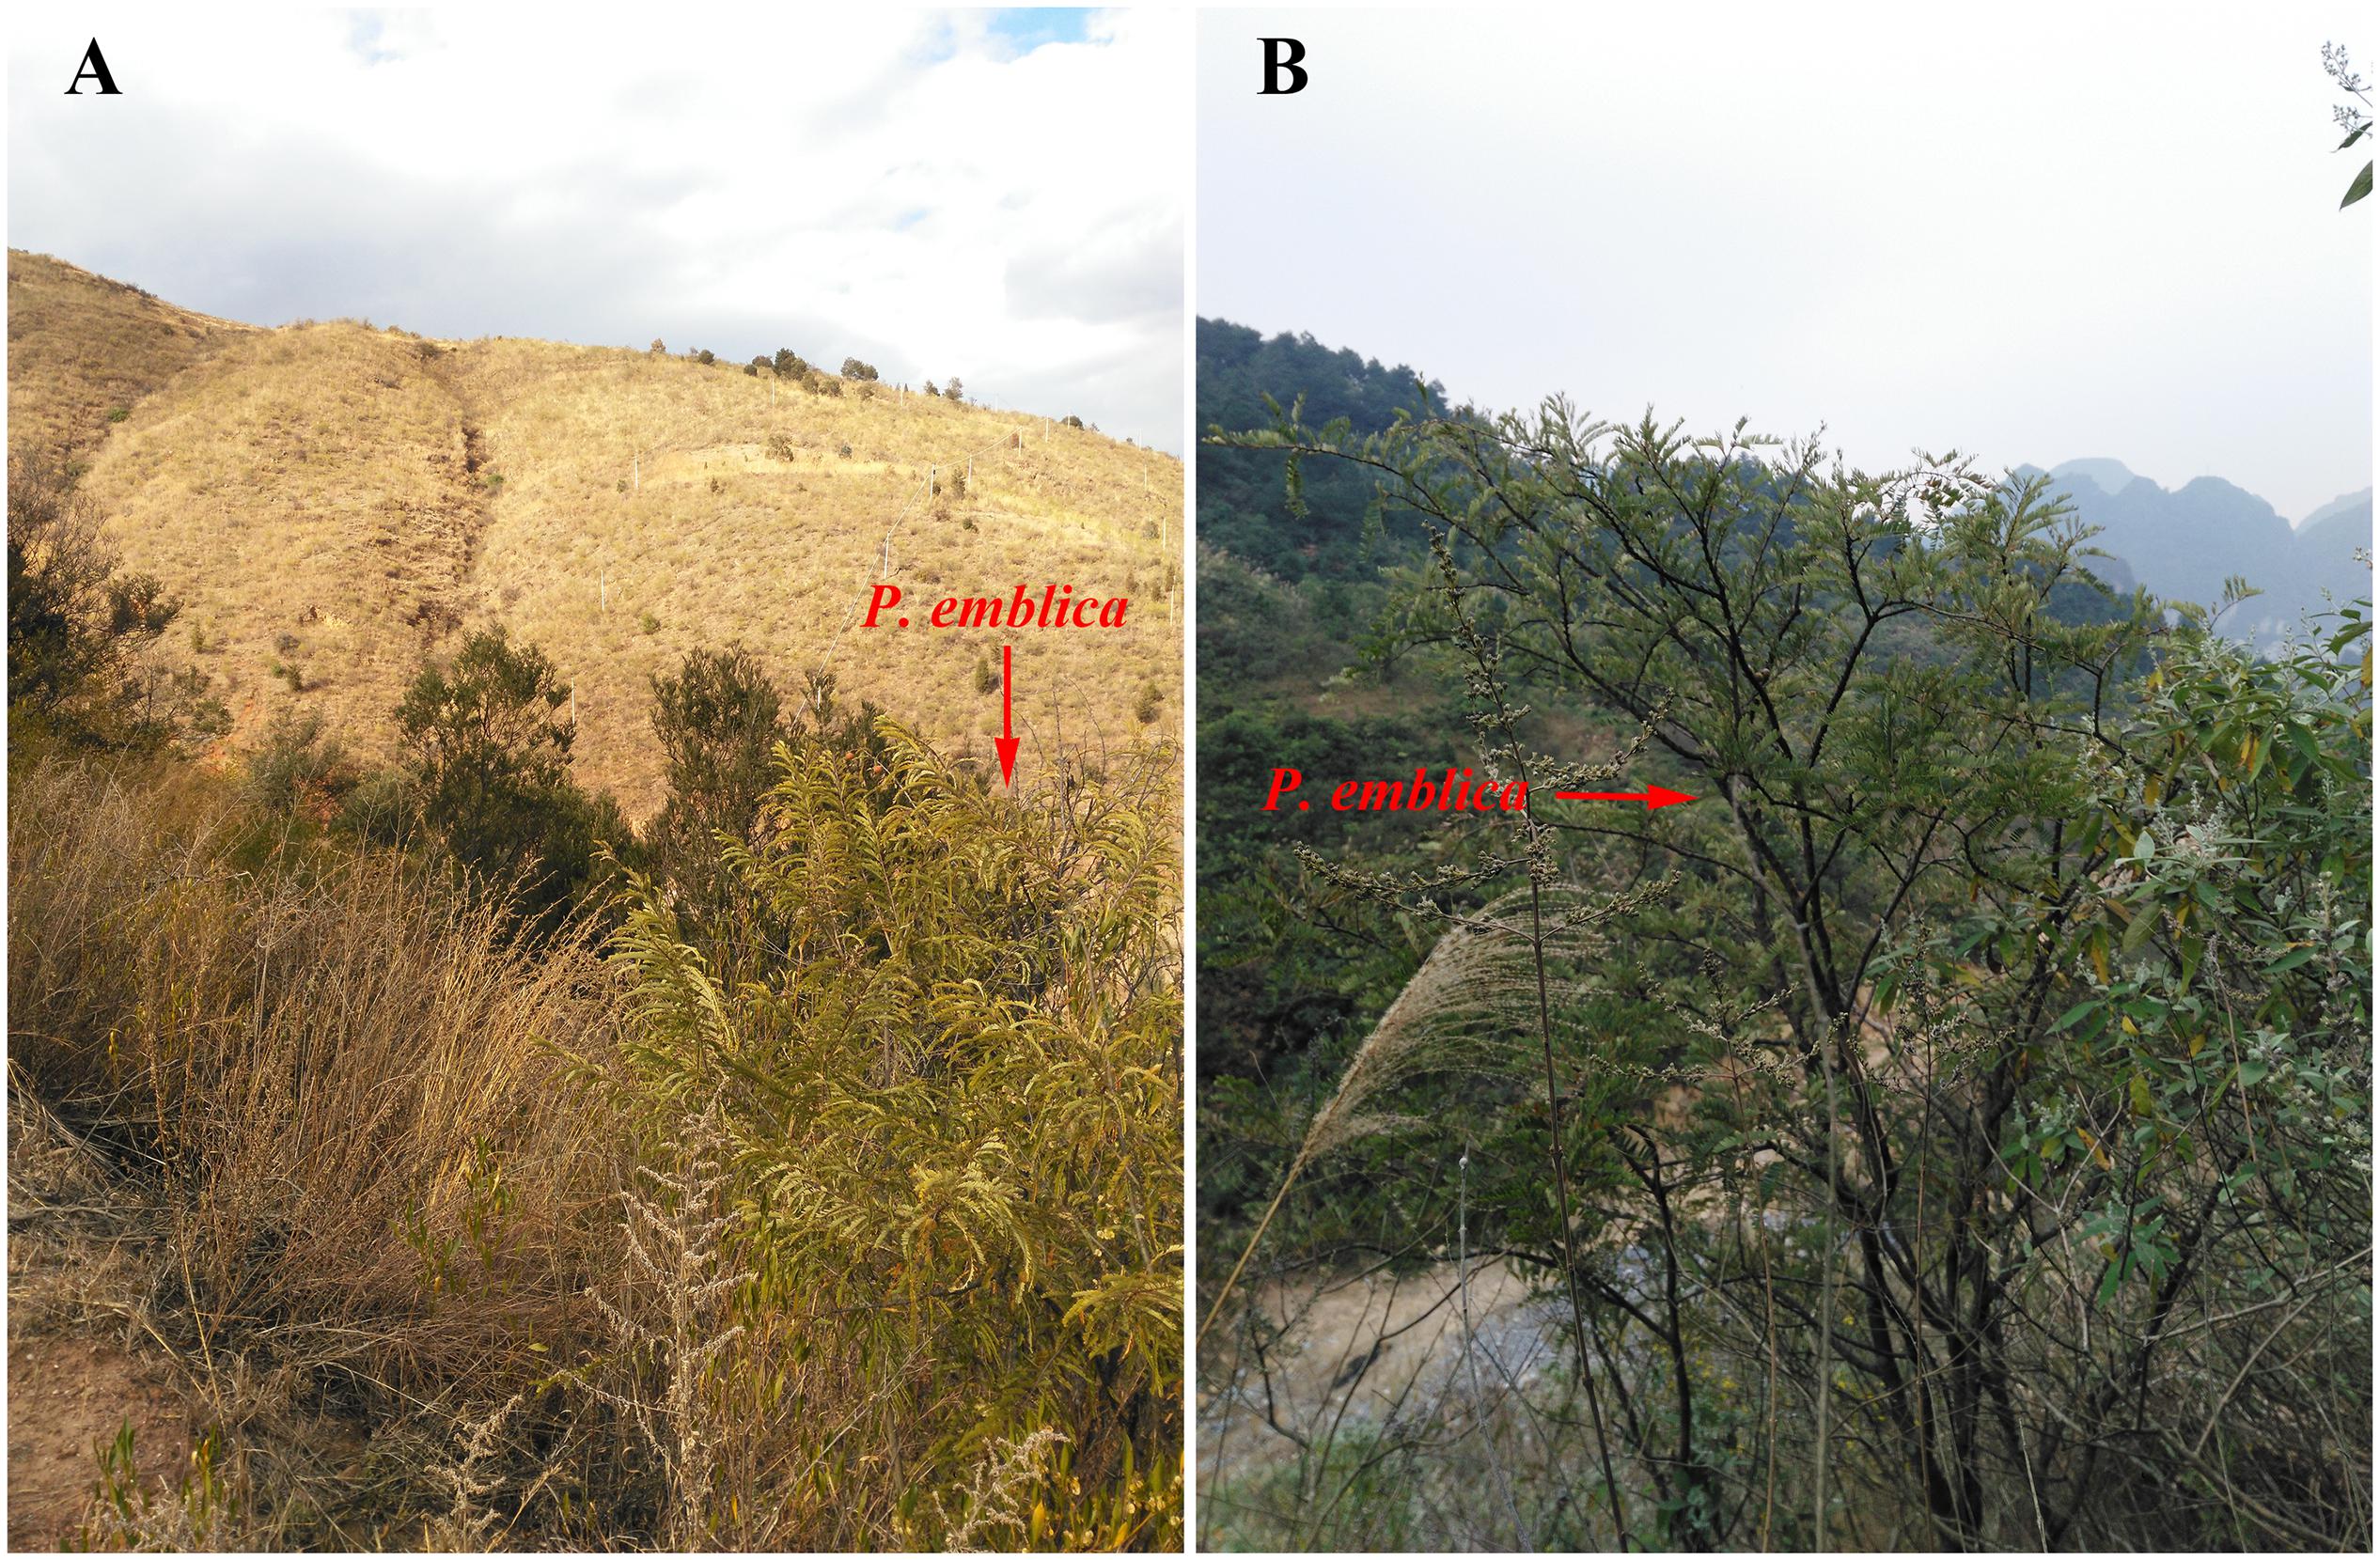
Figure 2. The habitats of P. emblica distributed in dry-hot valley of Yunnan (A) and humid areas of Guangxi (B).
DNA Extraction and EST-SSR Genotyping
Genomic DNA was isolated with the modified CTAB method (Doyle and Doyle, 1987). All samples were genotyped using 20 EST-SSR markers previously developed for the species (Liu et al., 2018). For all markers, PCR amplification (three replicates of each sample) was performed on ABI 2720 Thermal Cycler (Thermo Fisher Scientific, Waltham, MA, United States). The 15 μL reaction mixture contained 1 μL (15–20 ng) of genomic DNA, 7.5 μL of 2 × PCR Master Mix (TSINGKE, Beijing, China), 1 μL (10 pM) of each primer, and 4.5 μL of ddH2O. The PCR program was as follows: 5 min at 94°C; 30 cycles of 30 s at 94°C, annealing at 58°C for 30 s, 30 s at 72°C; and a final extension step at 72°C for 5 min. The PCR products were pooled and purified using the Wizard SV Gel and PCR Clean-Up System (Promega) following the manufacturer’s instructions. The 5′ end of each forward primer for the 20 markers was tagged with one of three fluorescent dyes (FAM, HEX, or ROX), and multiplex PCR amplifications were performed for the 260 individuals of P. emblica using the PCR conditions described above. Allele sizes for the tagged PCR products were obtained using an ABI 3730 sequencer with a GeneScan 500 LIZ Size Standard and GeneMapper 4.1 (Thermo Fisher Scientific, Waltham, MA, United States).
Data Analysis
POPGENE version 1.31 (Yeh et al., 1999) was used to calculate the average number of alleles (Na), the effective number of alleles (Ne), Shannon’s diversity index (I), the observed heterozygosity (Ho), the expected heterozygosity (He), inbreeding coefficient (FIS), outcrossing rate t [t = (1 − FIS)/(1 + FIS)] (Kesseli, 1992), gene flow (Nm), percentage of polymorphic loci (PPL), and genetic differentiation index (FST). Polymorphic information (PIC) was calculated using PowerMarker version 3.25 (Liu and Muse, 2005).
The standard WorldClim bioclimatic variables with a spatial resolution of 30 s (∼1 km2) were obtained from WorldClim version 2 (Fick and Hijmans, 2017), and they were the average values for the period of 1970–2000. Based on the latitude and longitude information obtained in the field, the bioclimatic variables of the 10 investigated populations were extracted using ArcGIS version 10 (ESRI, 2012). Principal component analysis (PCA) of altitude and bioclimatic variables of the 10 populations was conducted using the FactoMineR package (Sébastien et al., 2008).
Mantel and partial Mantel tests were performed using the R vegan package to assess the relationships between genetic diversity indices (Bray–Curtis distance) and geographical distance or environmental variables (Euclidean distance) with 9999 permutations. To further explore the relative importance of altitude and precipitation to genetic diversity, we also conducted a similar correlation analysis with them as environmental distance (Euclidean distance), respectively.
In order to evaluate the population genetic structure of P. emblica, several approaches were used in this study. Firstly, the Bayesian clustering analysis of the population structure was carried out using STRUCTURE version 2.3.4 (Pritchard et al., 2000). The program was run with the admixture model and independent-allele frequency using a burn-in period of 3 × 10⁵ and 1 × 10⁵ Markov chain Monte Carlo (MCMC) replications. A total of 20 independent runs were performed for each K value ranging from 1 to 20. The most likely number of clusters was evaluated using both ΔK and the log-likelihood value with STRUCTURE HARVESTER version 0.6.94 (Evanno et al., 2005; Earl and VonHoldt, 2012). Furthermore, the hierarchical analysis on 260 P. emblica individuals was performed in the R stats package with UPGMA algorithm based on the Hellinger distance. Following this, cluster analysis on the basis of shared allele distance (DAS) was performed using POPULATIONS version 1.2.30 (Langella, 2007) with the neighbor-joining (NJ) method. The NJ tree was visualized and edited in iTOL version 3 (Letunic and Bork, 2016). Finally, based on Nei’s genetic distance (Nei, 1973), principal coordinate analysis (PCoA) of 260 individuals was conducted with ape package version 5.4 (Paradis and Schliep, 2019).
Analysis of molecular variance (AMOVA) was carried out to estimate the partitioning of genetic variation between and within the populations using ARLEQUIN version 3.0 (Excoffier et al., 2005). The effective population sizes for the 10 populations were calculated using LDNE version 1.31 (Waples and Do, 2008) at three levels of lowest allele frequency (Pcrit = 0.05, 0.02, 0.01) at 95% confidence interval (CI). In order to gain insight into the population dynamic history of P. emblica, the ABC framework in DIYABC v. 2.0 (Cornuet et al., 2014) was used to test the applicability of seven plausible scenarios based on 20 highly polymorphic SSR loci, and the posterior probability of the optimal model was estimated with two methods: direct estimate and logistic regression. The scenario with the highest posterior probability was selected, and the prior settings of the detailed parameters used to simulate the DIYABC scenarios are shown in Supplementary Table S2. Times and effective population sizes are not strictly to scale. Since DIYABC analysis adopts generation numbers, the generation times of P. emblica was assumed to be 5 years and were converted to a calendar year.
Results
Genetic Diversity
A total of 562 alleles were detected in the 20 analyzed SSR loci. The number of alleles (Na), expected heterozygosity (He), and Shannon’s diversity index (I) ranged from 18 to 40, 0.485 to 0.921, and 1.324 to 2.851, respectively, with the means of 28.1, 0.796, and 2.232, respectively (Table 1), indicating that these 20 SSR makers were highly polymorphic. Polymorphic information content (PIC; Table 1), which was also used to evaluate loci polymorphisms (Xie et al., 2010; Wang et al., 2014), showed that 19 loci were highly polymorphic (PIC > 0.5), and only one locus (PE14171) was moderately polymorphic (0.25 < PIC < 0.5), further indicating high polymorphism of these 20 loci.
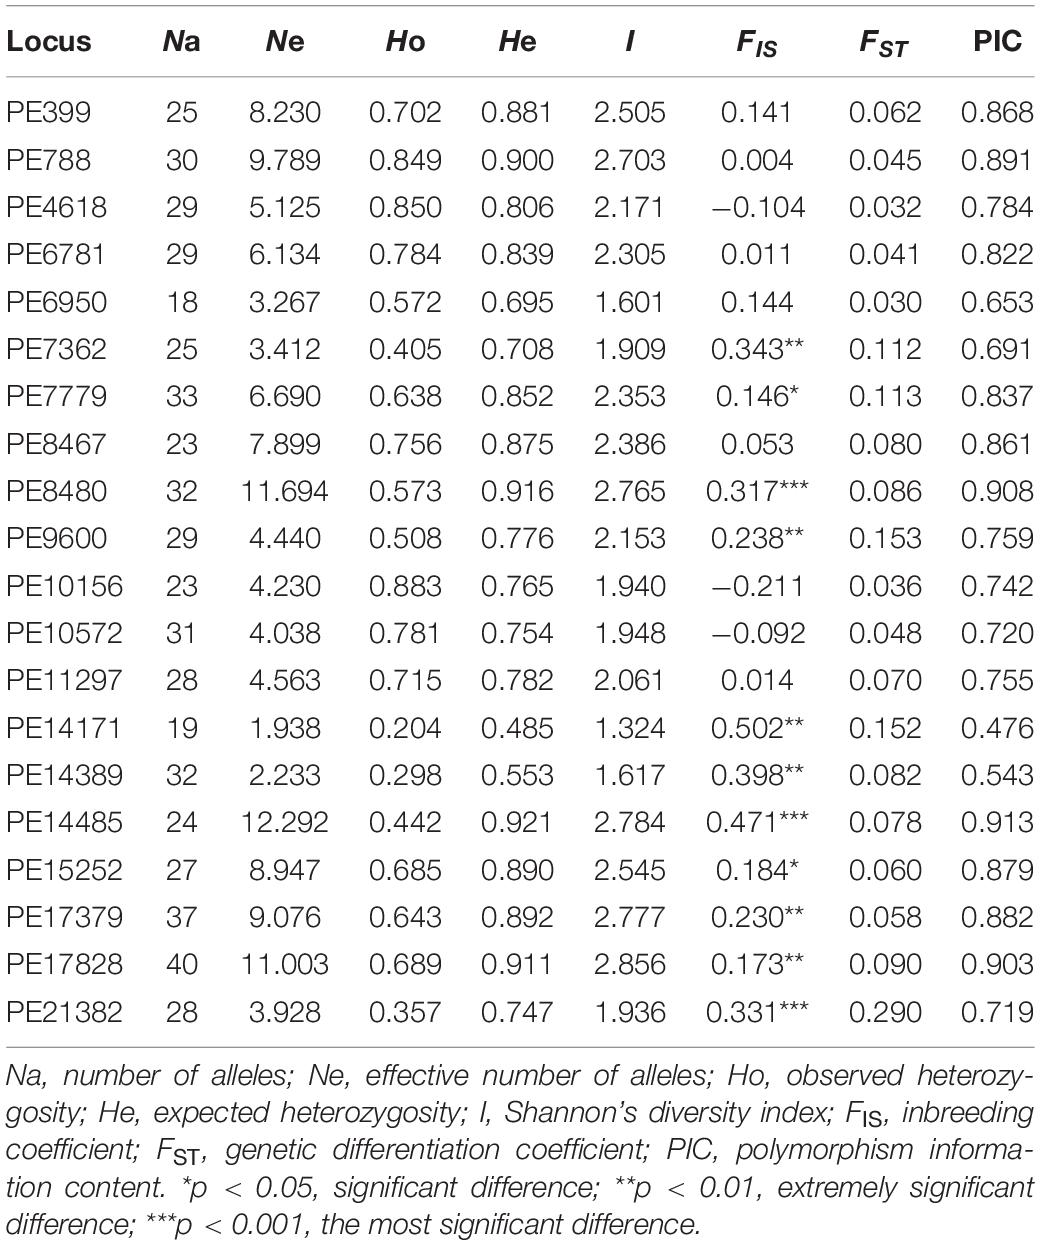
Table 1. Genetic diversity parameters of the 20 EST-SSR makers in all tested individuals of P. emblica.
At the population level, the percentages of polymorphic loci (PPL) in all 10 populations were 100%; however, the genetic diversity of each population was different. The YMB population had the highest genetic diversity (He = 0.819), whereas MSE had lowest genetic diversity (He = 0.604) (Table 2). Moreover, the mean genetic diversity of the 10 populations investigated in the present study (He = 0.792) was at a high level; however, the average genetic diversity of the five populations of P. emblica from dry climate areas of Yunnan (He = 0.786) was higher than that of the five populations from wet climate areas of Guangxi (He = 0.673) (Table 2). In addition, at the species level, we found that the genetic diversity (He = 0.796) of P. emblica was also at a high level (Table 2).
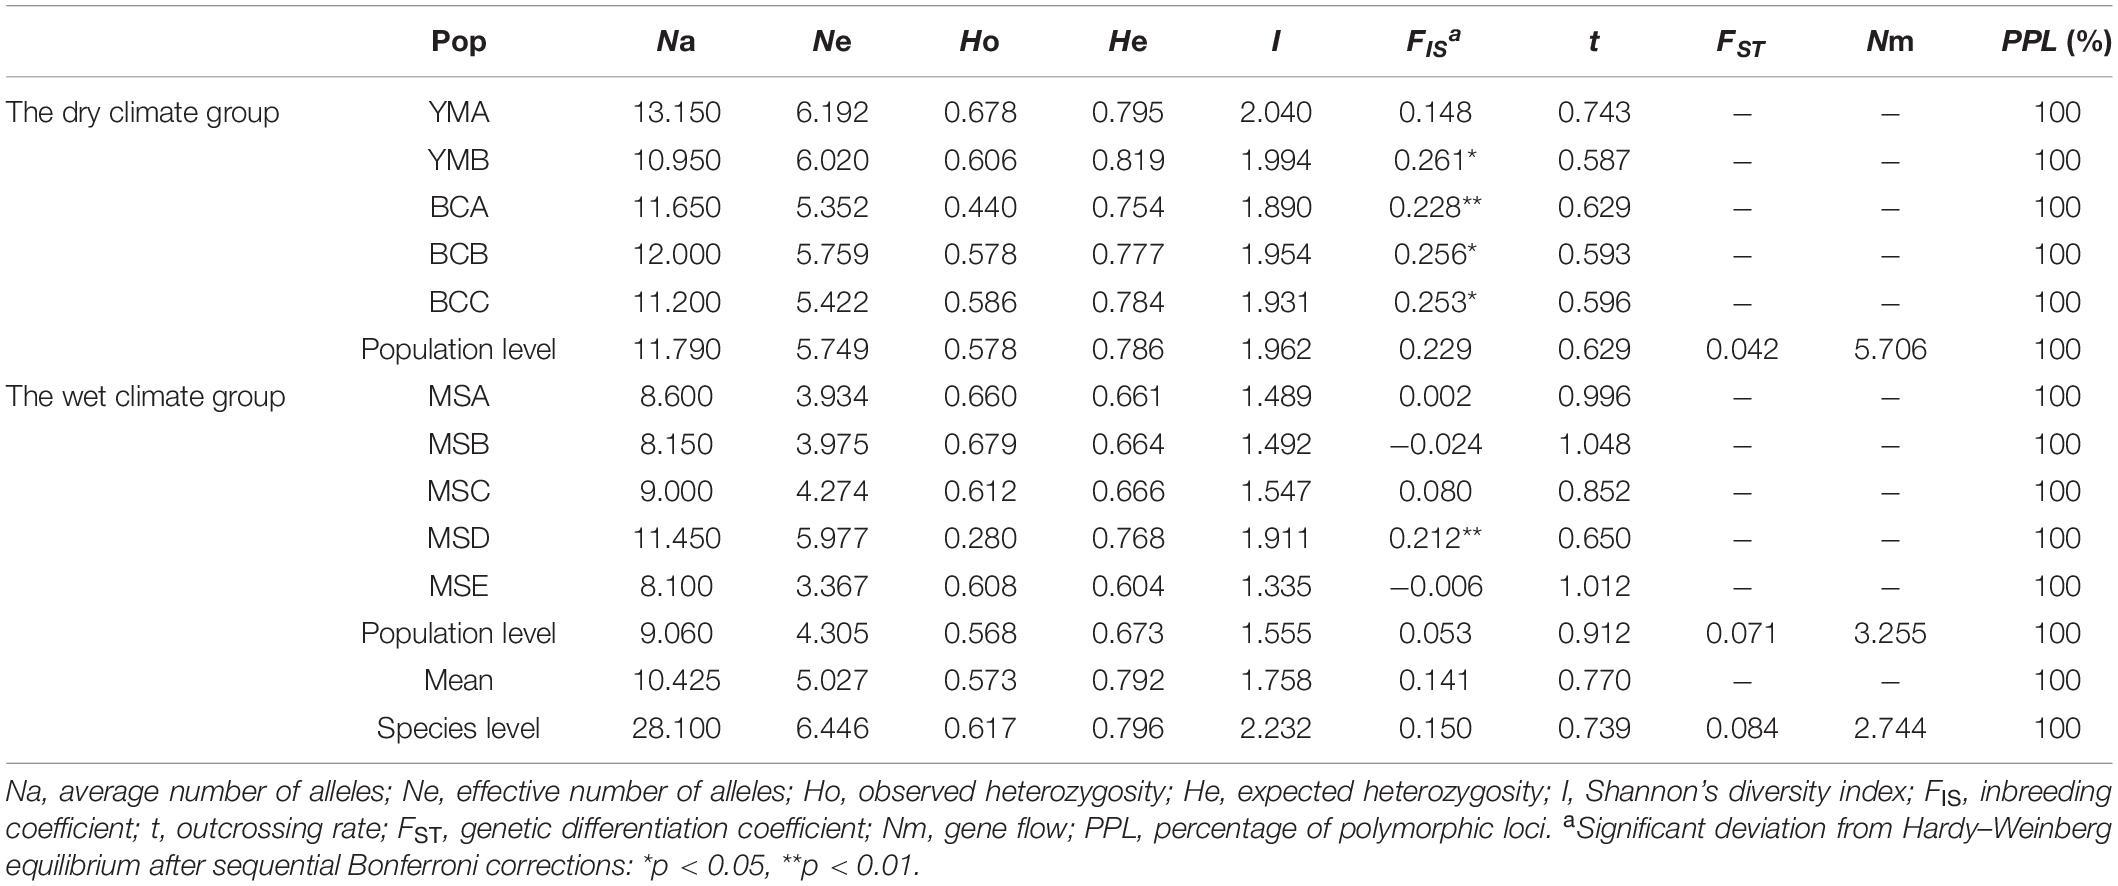
Table 2. Genetic diversity in 10 populations of P. emblica.
Effects of Geographical and Environmental Distances on Genetic Diversity Indices of 10 P. emblica Populations
The PCA results show that PC1 (97.81%) not only divided the seven precipitation-related bioclimatic variables and altitude into two clusters, but also made a clear distinction between the populations in dry and wet climatic areas (Figure 3). The altitude might be the main factor of environmental difference between these two climatic areas, showing a positive effect in the dry climatic area, whereas the precipitation-related bioclimatic variables showed a positive effect in the wet climatic area.
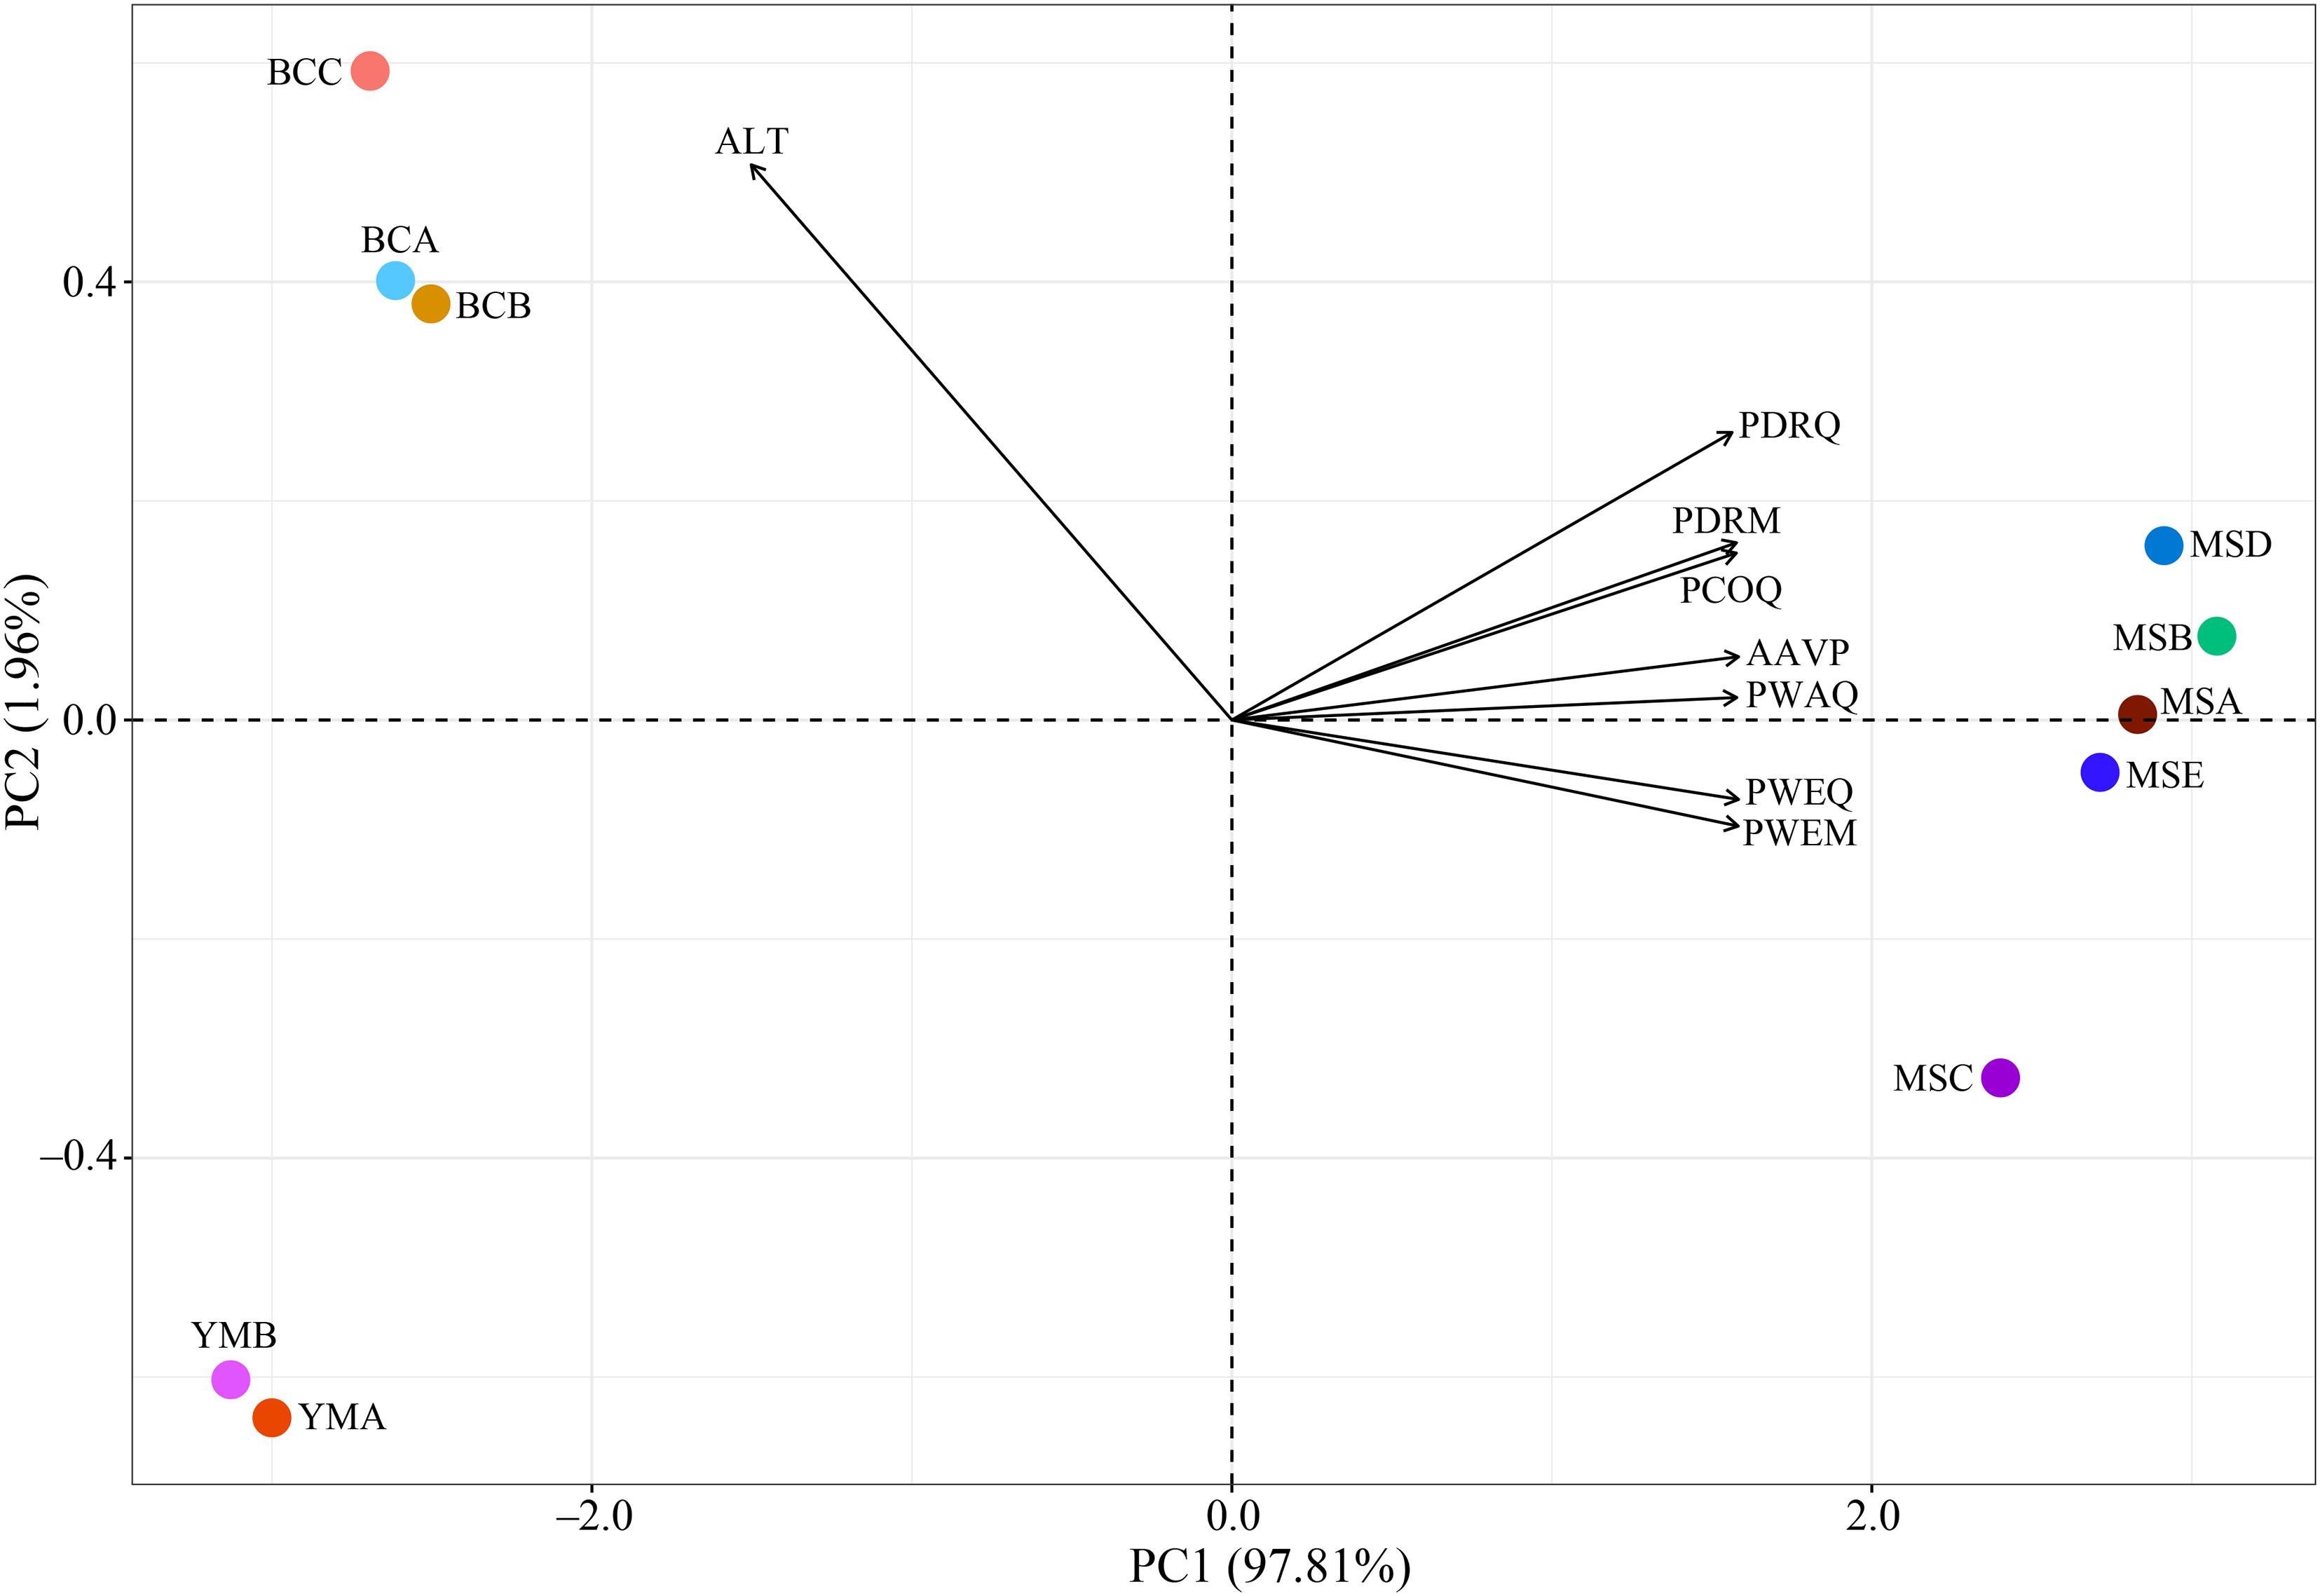
Figure 3. Principal component analysis (PCA) of environmental variables of 10 P. emblica populations. AAVP, annual average precipitation (mm); PWEQ, precipitation of the wettest quarter (mm); PDRQ, precipitation of the driest quarter (mm); PWEM, precipitation of the wettest month (mm); PDRM, precipitation of the driest month (mm); PWAQ, precipitation of the warmest quarter (mm); PCOQ, precipitation of the coldest quarter (mm); ALT, altitude (m). All environmental variables were normalized by z-score.
According to the Mantel tests, both environmental distance and geographic distance had significant effects on three genetic diversity indices (Figure 4). Compared with geographic distance, environmental distance had a stronger effect on average number of alleles (Na) and Shannon’s diversity index (I), while geographic distance explains more variation of expected heterozygosity (He) (Figure 4). In addition, there was a significant correlation between geographic distance and environmental distance. However, according to the partial Mantel tests, only the pure effect of environmental distance on Shannon’s information index (I) was significant (Figure 5; p = 0.036 < 0.05).
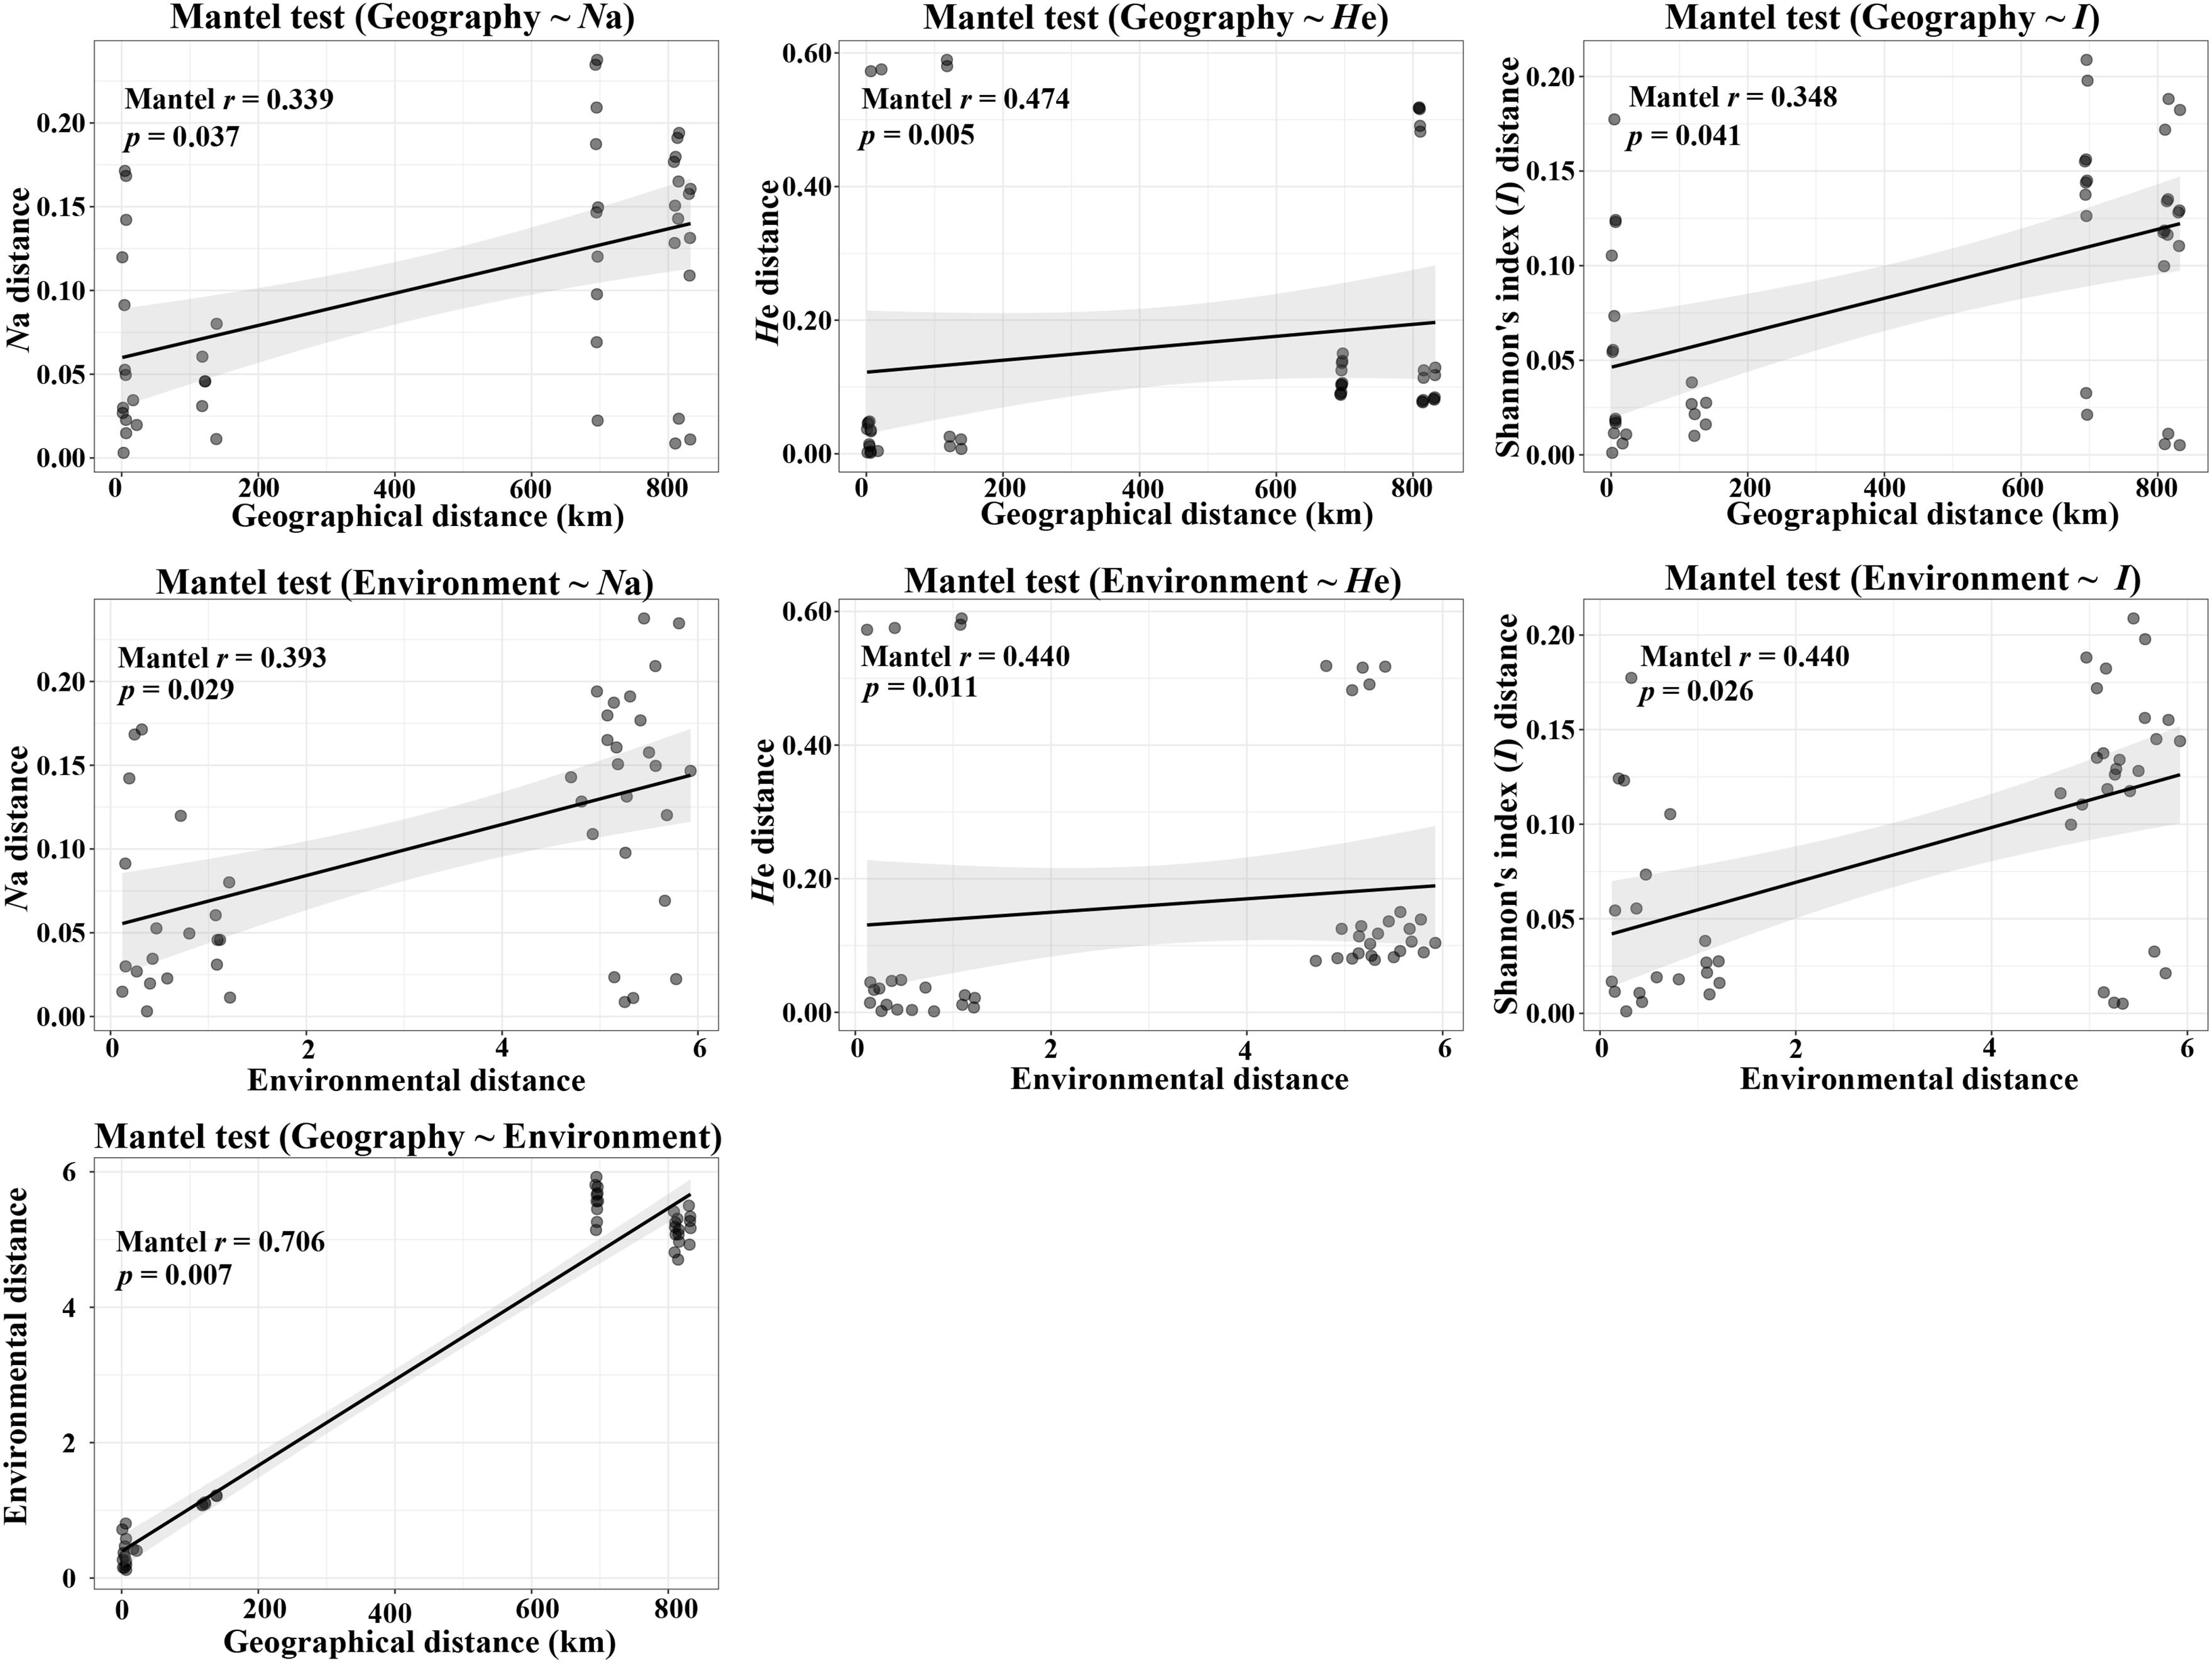
Figure 4. Plot of Mantel tests for the correlation between genetic diversity parameter (Bray–Curtis distance) and explanatory distances (geographic and environmental distance) using Spearman’s coefficient.
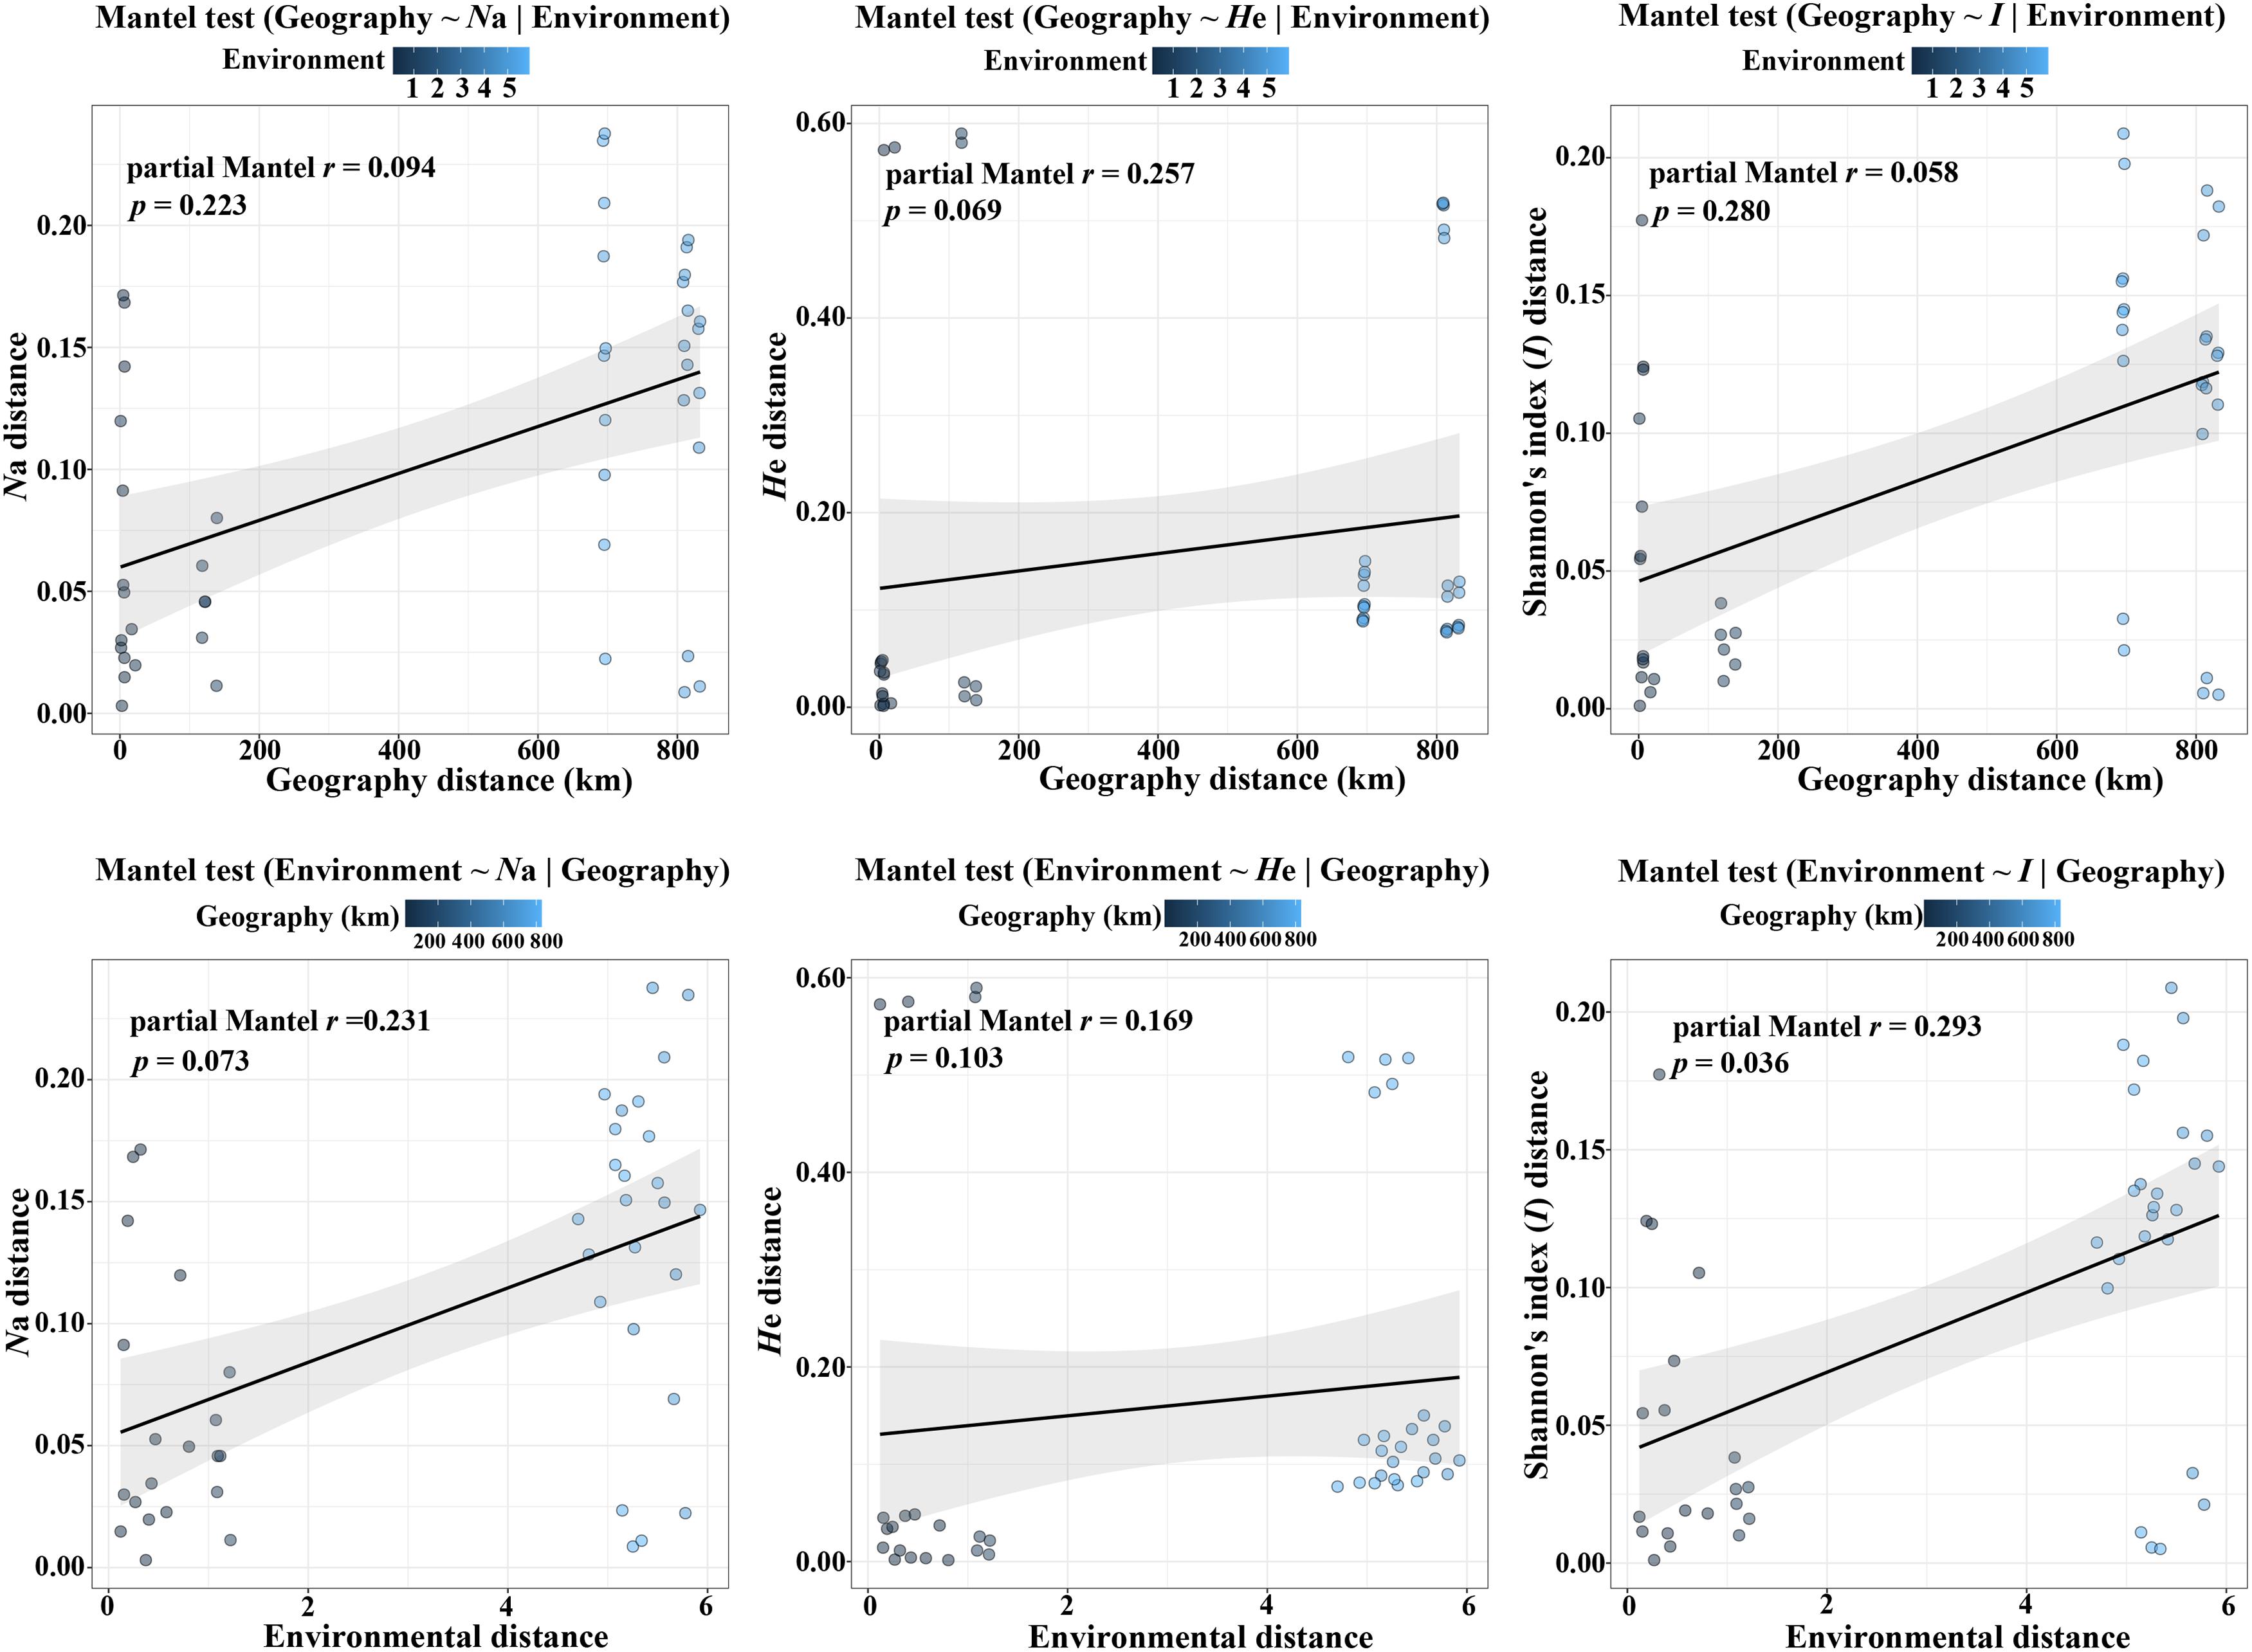
Figure 5. Plot of partial Mantel tests for the correlation between genetic diversity parameter (Bray–Curtis distance) and explanatory distances (geographic and environmental distance) using Spearman’s coefficient.
Furthermore, the Mantel tests of precipitation and altitude showed that altitude had a greater impact on genetic diversity parameters than precipitation (Table 3 and Supplementary Figures S1, S2). In addition, under controlling for geographic distance, altitude was significantly related to both average number of alleles (Na) and Shannon’s diversity index (I), while precipitation was only significantly related to Shannon’s diversity index (I) and its effect was weaker than that of altitude (Table 3 and Supplementary Figure S2). These results implied that both altitude and precipitation had significant effects on the genetic diversity of P. emblica, however, compared with precipitation, the pure effect of altitude was slightly stronger.
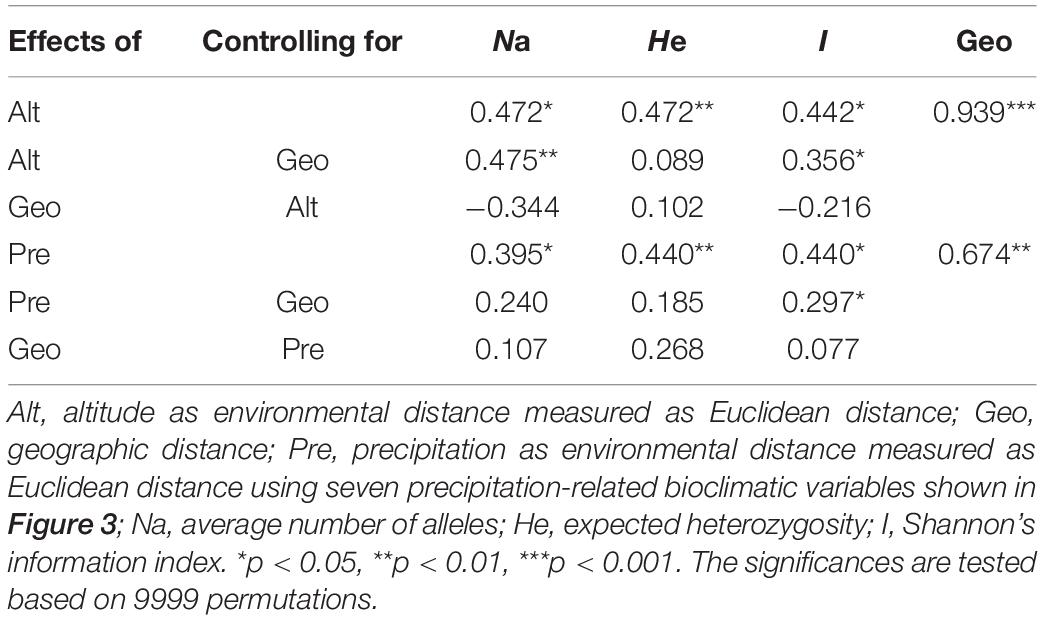
Table 3. Mantel and partial Mantel tests for the correlation between genetic diversity parameter (Bray–Curtis distance) and explanatory distances (geographic and environmental (altitude or precipitation) distance) using Spearman’s coefficient.
Genetic Differentiation and Genetic Structure of Populations
The results showed that the genetic differentiation between populations (FST) was 0.084 (Table 2), indicating a moderate genetic differentiation among the 10 populations (0.05 < FST < 0.15). The populations YMB, BCA, BCB, BCC, and MSD had significant deviations from the Hardy-Weinberg equilibrium (p < 0.05 or p < 0.01) (Table 2). The inbreeding coefficients (FIS) of these five populations were positive; correspondingly, their outcrossing rates (t) were < 1 (Table 2), indicating the presence of inbreeding in these five populations.
The STRUCTURE analysis showed that ΔK reached the maximum value (ΔK = 577.307) at K = 2 (Figures 6A,B), which suggested that the 260 individuals from the 10 populations most likely belonged into two principal genetic clusters (Figure 6C). Cluster II mainly included individuals from the dry climate group, containing YMA, YMB, BCA, BCB, and BCC populations, whereas cluster I consisted of most of the individuals from the wet climate group, containing MSA, MSB, MSC, MSD, and MSE populations (Figures 6D,E). However, there were some individuals with admixed genotype in both two groups, indicating ongoing gene flow or weak genetic differentiation. Although L(K) has the highest value and least variance at K = 4 (Figure 6A), the division of genetic clusters was unclear and the gene introgression between populations was relatively disordered (Supplementary Figure S3), which could not reasonably explain the background of the sampling populations. The result of the hierarchical analysis showed that 260 individuals were divided into two main groups (dry and wet climate groups) at the distance of 0.02 (Supplementary Figure S4). The neighbor-joining tree showed that 260 individuals were grouped into two principal clades (Figure 7). One clade included the majority of the individuals from the dry climate group, and the other clade mainly included the individuals from the wet climate group. However, the PCoA results show that PCoA1 and PCoA2 explained 6.54% and 2.91% of the total genetic variance, respectively (Figure 8).
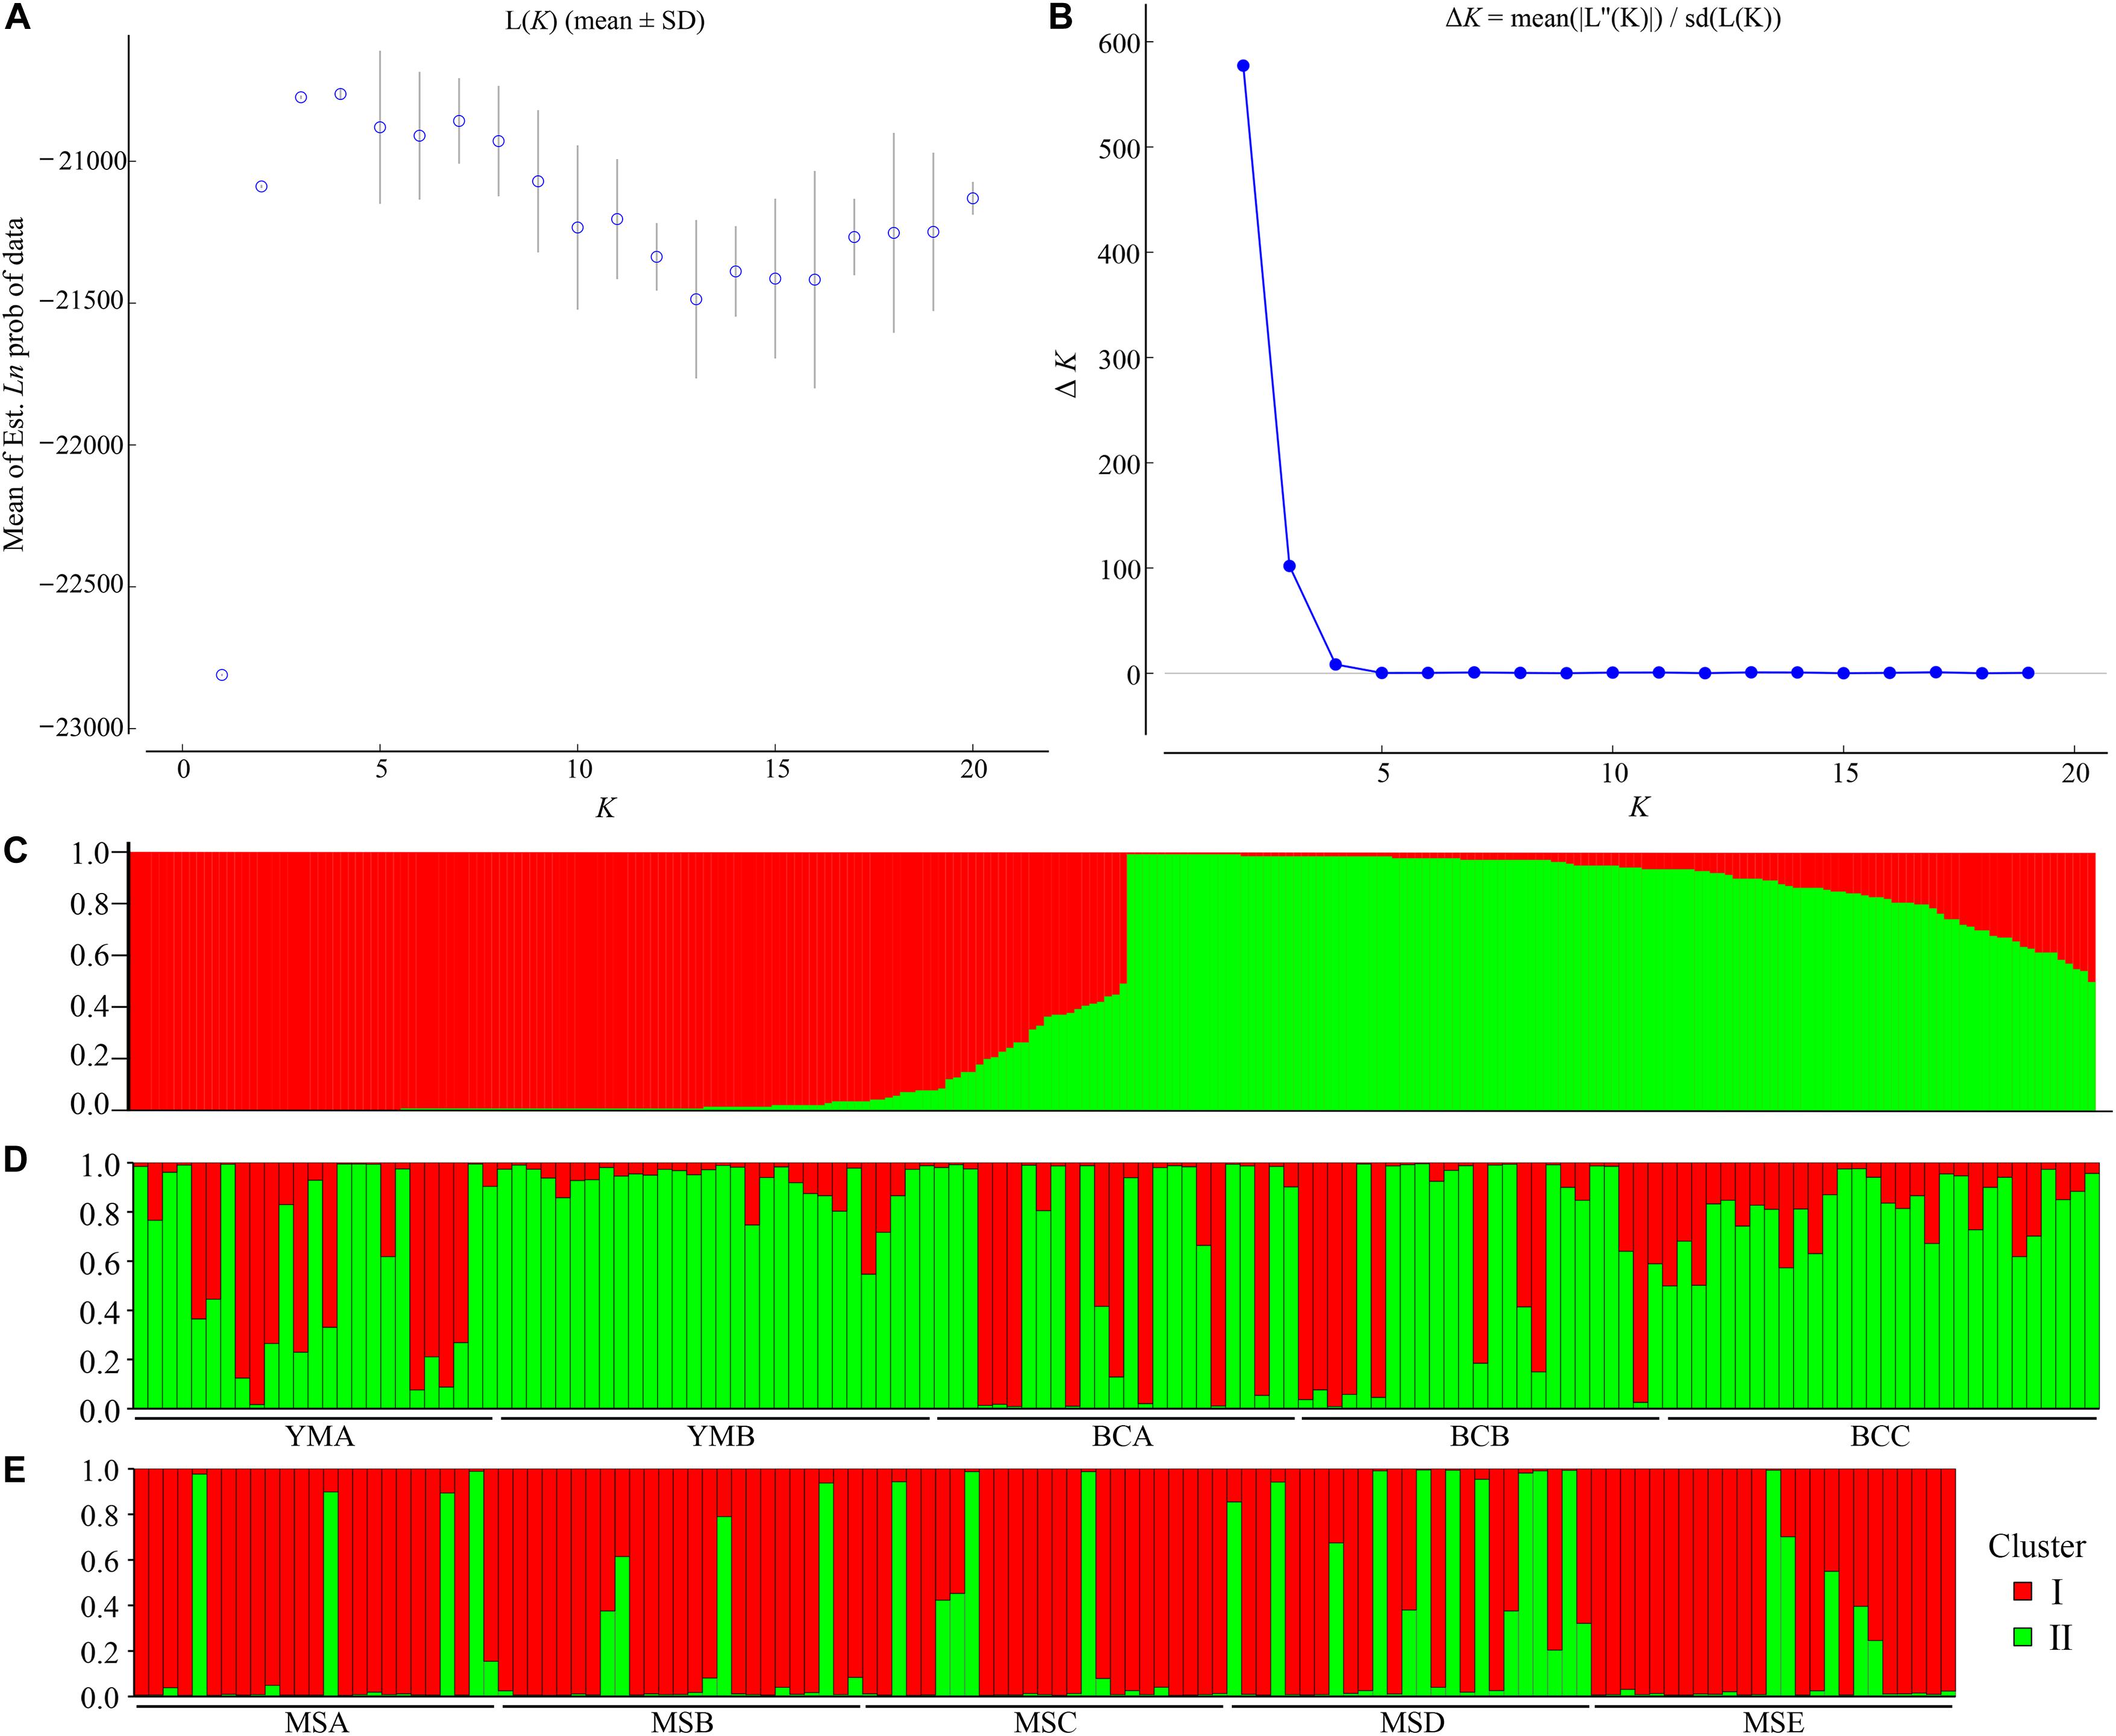
Figure 6. Bayesian model-based clustering STRUCTURE analysis of 260 individuals of P. emblica. (A) Mean log-likelihood [Ln(K) ± SD] against the number of K; (B) ΔK values for different numbers of clusters (K); (C–E) Estimated population structure of 260 Phyllanthus emblica individuals on K = 2: (C) bar plot was sorted by Q-values in single line, and (D,E) bar plot was grouped by population ID in multiple lines.
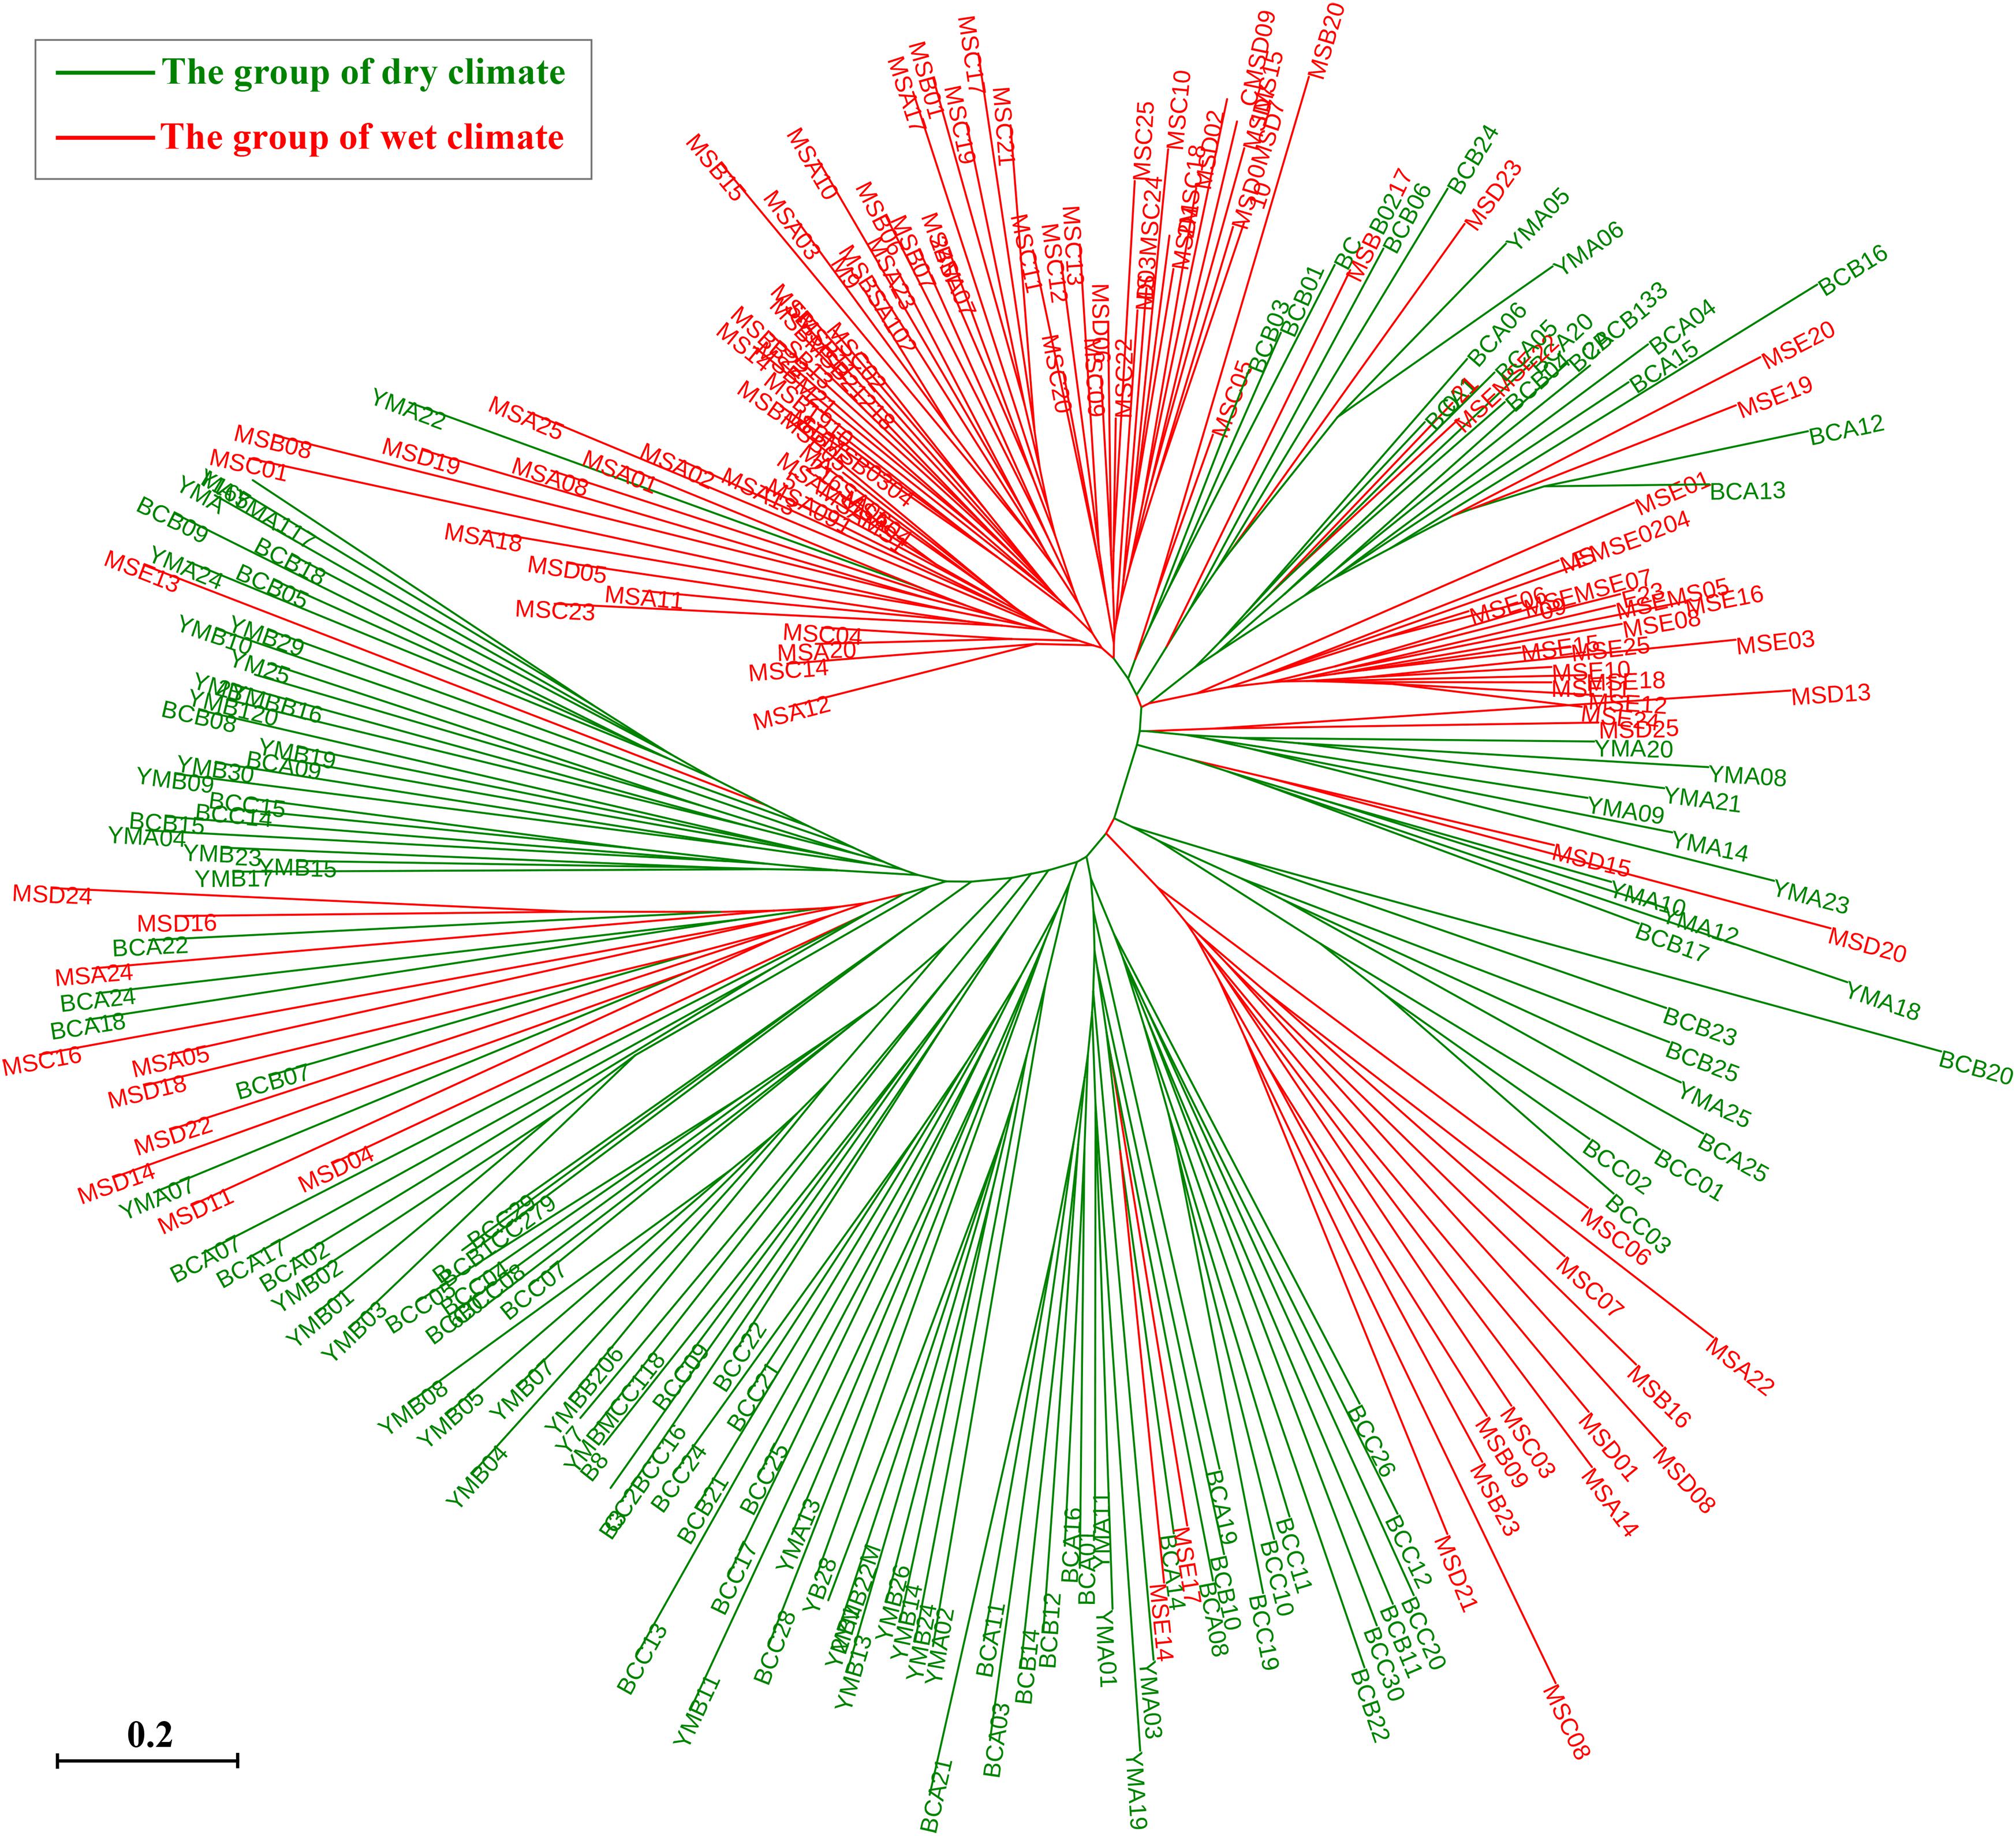
Figure 7. Neighbor-joining tree based on shared allele distance (DAS) between 260 individuals of P. emblica.
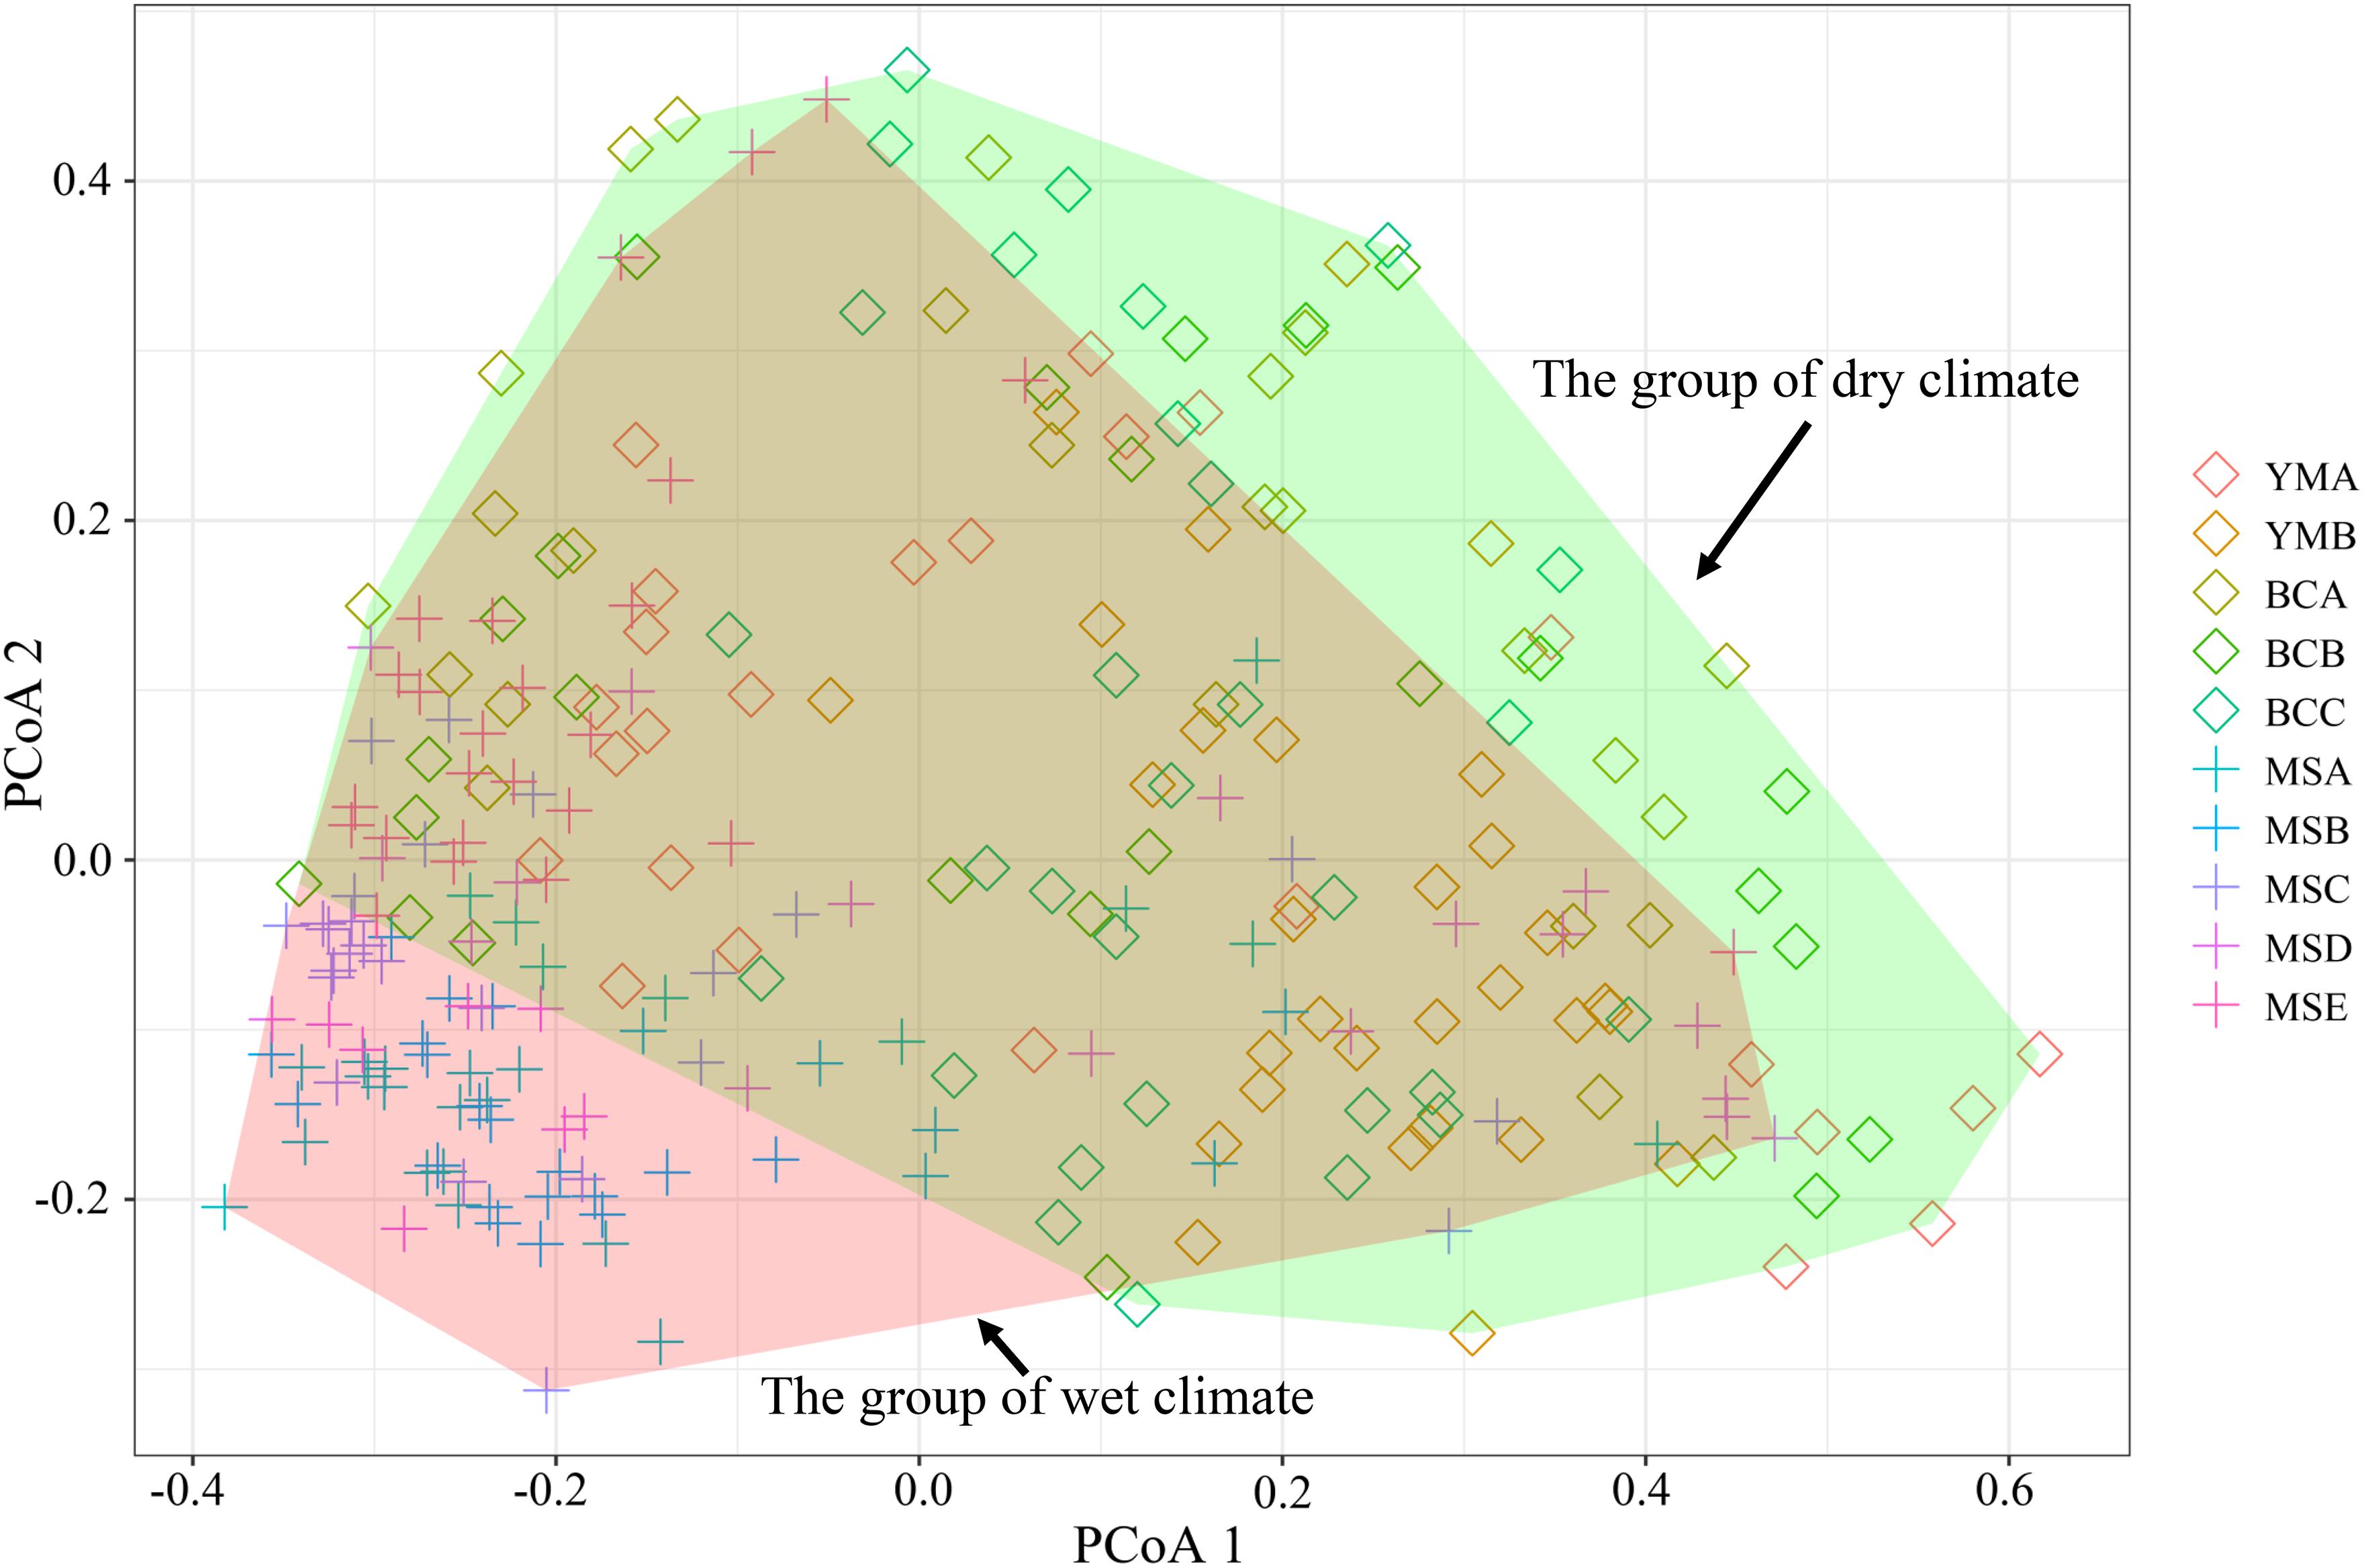
Figure 8. Principal coordinate analysis (PCoA) of 260 P. emblica individuals from 10 populations, based on a genetic distance matrix of 20 EST-SSRs. The PCoA1 explains 6.54% of the total genetic variance, and the PCoA2 accounts for 2.91%. The confidence interval of 95% is showed as polygon.
At the species level, the AMOVA revealed that the majority of the observed genetic variation could be attributed to differences within populations (92.44%) rather than to the variation among populations (7.56%) (Table 4). At the group level, higher genetic variation was observed within populations than among populations in both climate groups; however, the genetic variation within the populations from the dry climate group (96.24%) was higher than that within the populations from the wet climate group (93.36%) (Table 4). There was moderate genetic differentiation between the two climate groups (F = 0.095); 4.66% of the genetic variations were attributed to the differences among the groups, 90.53% were attributed to the differences within populations, and 4.81% were attributed to the differences among populations within groups (Table 4).
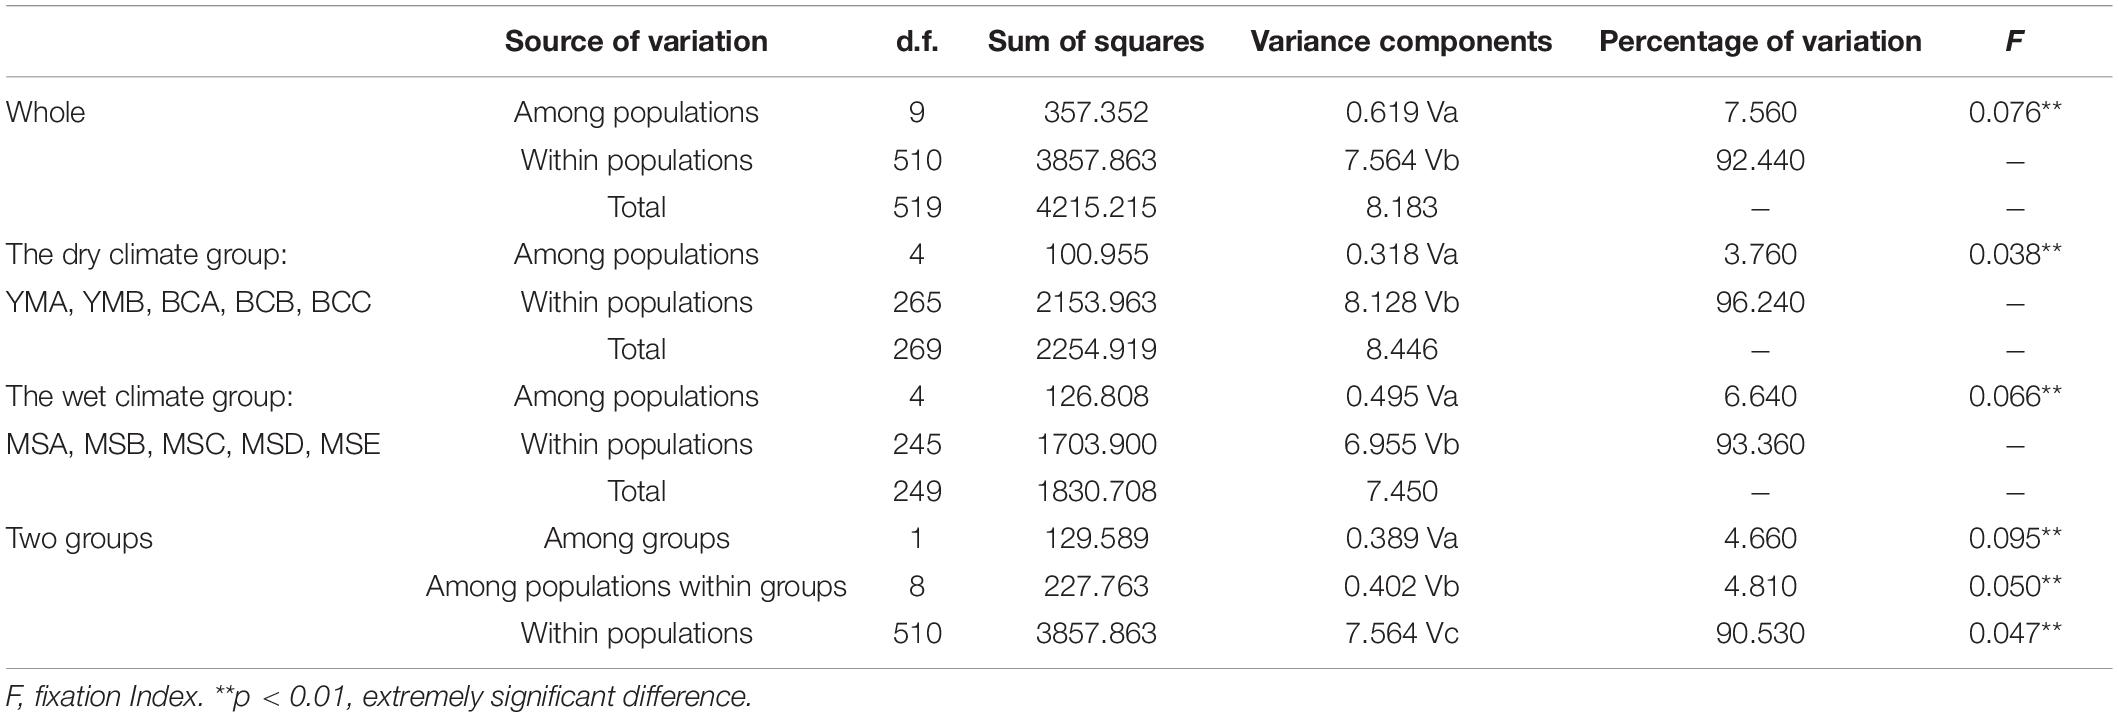
Table 4. Analysis of molecular variance (AMOVA) based on 20 EST-SSR markers for populations of P. emblica.
Effective Population Size and Population Dynamic History Based on ABC Model
Estimations of effective population sizes with the lowest allele frequency (Pcrit) are listed in Table 5. At Pcrit = 0.02 and Pcrit = 0.01, effective population size of BCC was the largest, whereas MSA had the smallest effective population size. The DIYABC results showed that the optimal model was Scenario 7 (Supplementary Figure S5), i.e., an ancestral range expansion (the ancestral range expansion was the ancient expansion in Figure 9) followed by a recent range bottleneck (Figure 9). The posterior probabilities obtained from this scenario under direct estimate and logistic regression were 76.25% and 93.60%, respectively; followed by Scenario 6, with posterior probabilities (15.80% and 6.00%). In addition, Scenario 7 had the lowest average type I and type II error rates (14% and 0%, respectively) (Supplementary Table S3). The posterior distribution of the dynamic historical parameters evaluated under the best model (Scenario 7) showed that the initial effective population size of the studied P. emblica populations was 8980 (95% confidence interval 7120–9950) individuals (N5; Figure 10 and Supplementary Table S4), and there was a strong expansion at 126 (55–227.50) Ka, resulting in the effective population size up to 53.79 (25.28–76.50) times (N3) of the original. Next, a certain degree of bottleneck appeared at 49.85 (49.55–50.00) Ka, and the effective population size was further reduced to 0.2 (0.04–0.39) times (N1; Figure 10 and Supplementary Table S4) that of the expansion period. Although the 95% confidence interval was wide, the initial expansion seems to occur in the Last Interglacial (LIG), whereas the most recent bottleneck occurred in the beginning of the Last Glacial Maximum (LGM).
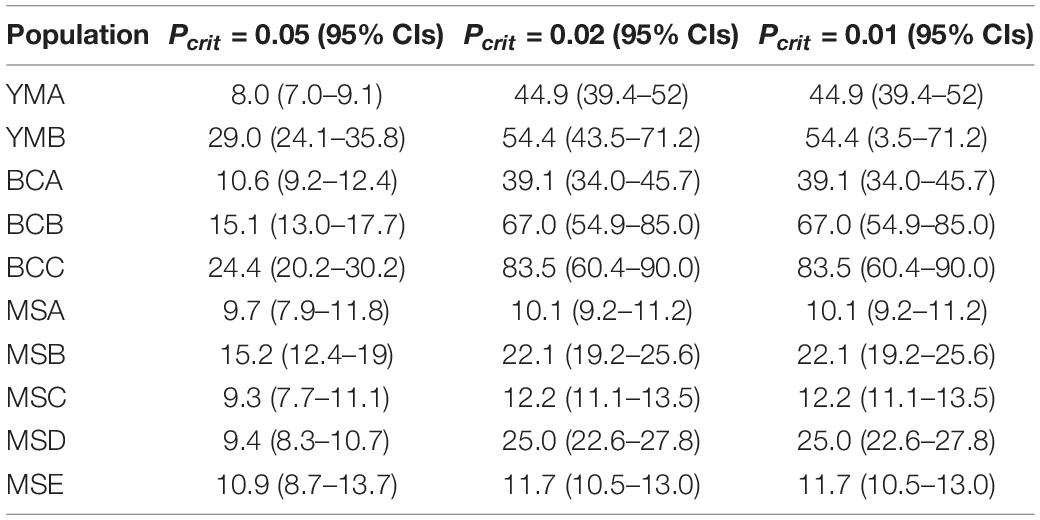
Table 5. The effective population size with three levels of the lowest allele frequency (Pcrit) for the 10 populations of P. emblica.
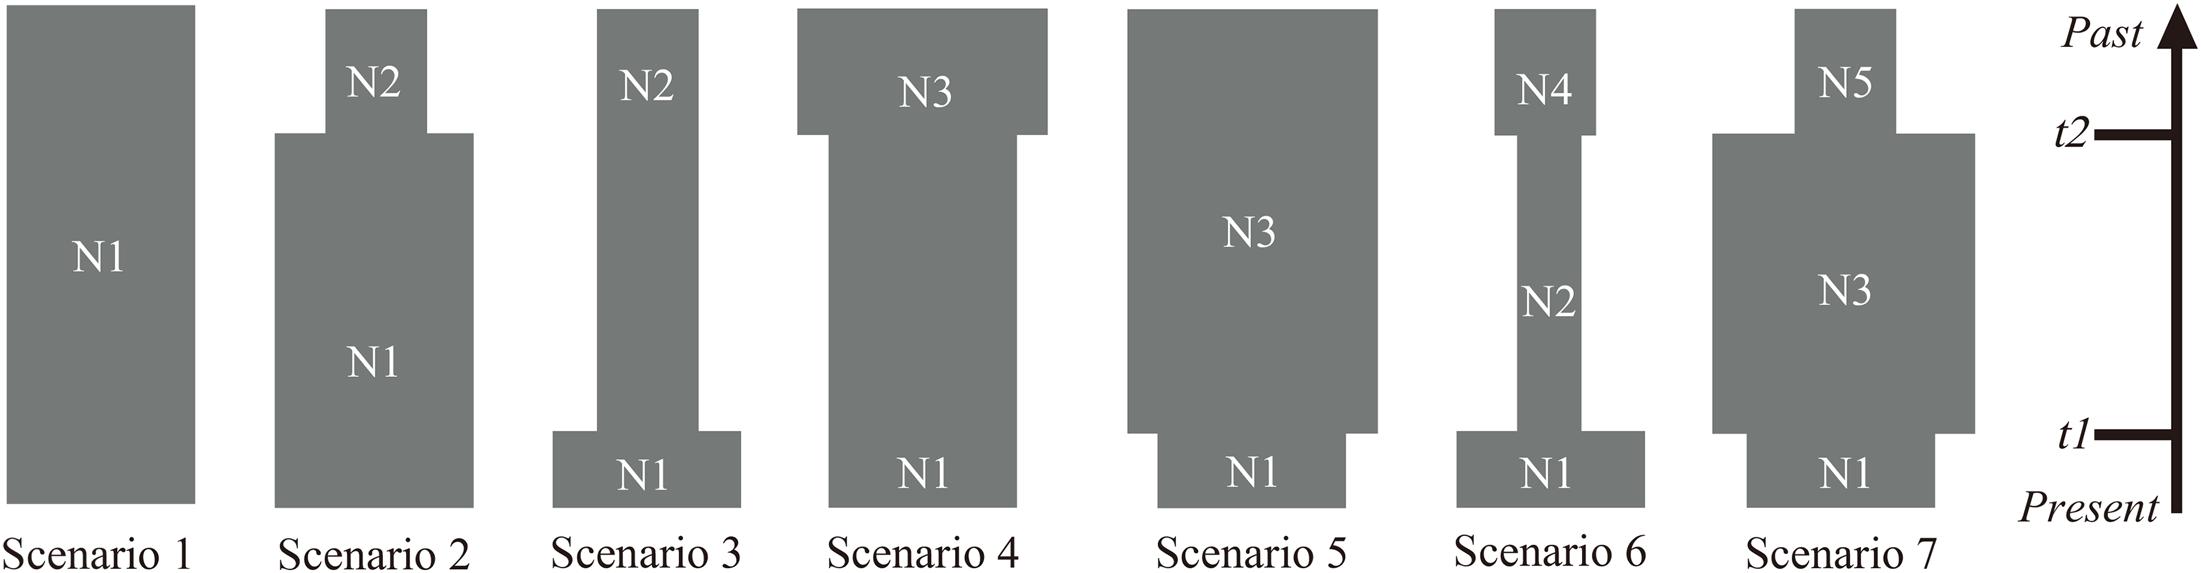
Figure 9. Schematic representation of the seven demographic scenarios (including model parameters) for P. emblica tested by the DIYABC method using the SSR loci. (Scenario 1) constant effective population size (N1); (Scenario 2) an old expansion (N2 to N1, t2); (Scenario 3) a recent expansion (N2 to N1, t1); (Scenario 4) an old bottleneck (N3 to N1, t2); (Scenario 5) an recent bottleneck (N3 to N1, t1); (Scenario 6) an old bottleneck (N4 to N2, t2) followed by a recent expansion that led to current effective size (N2 to N1, t1); and (Scenario 7) an old expansion (N5 to N3, t2) followed by a recent bottleneck (N3 to N1, t1).
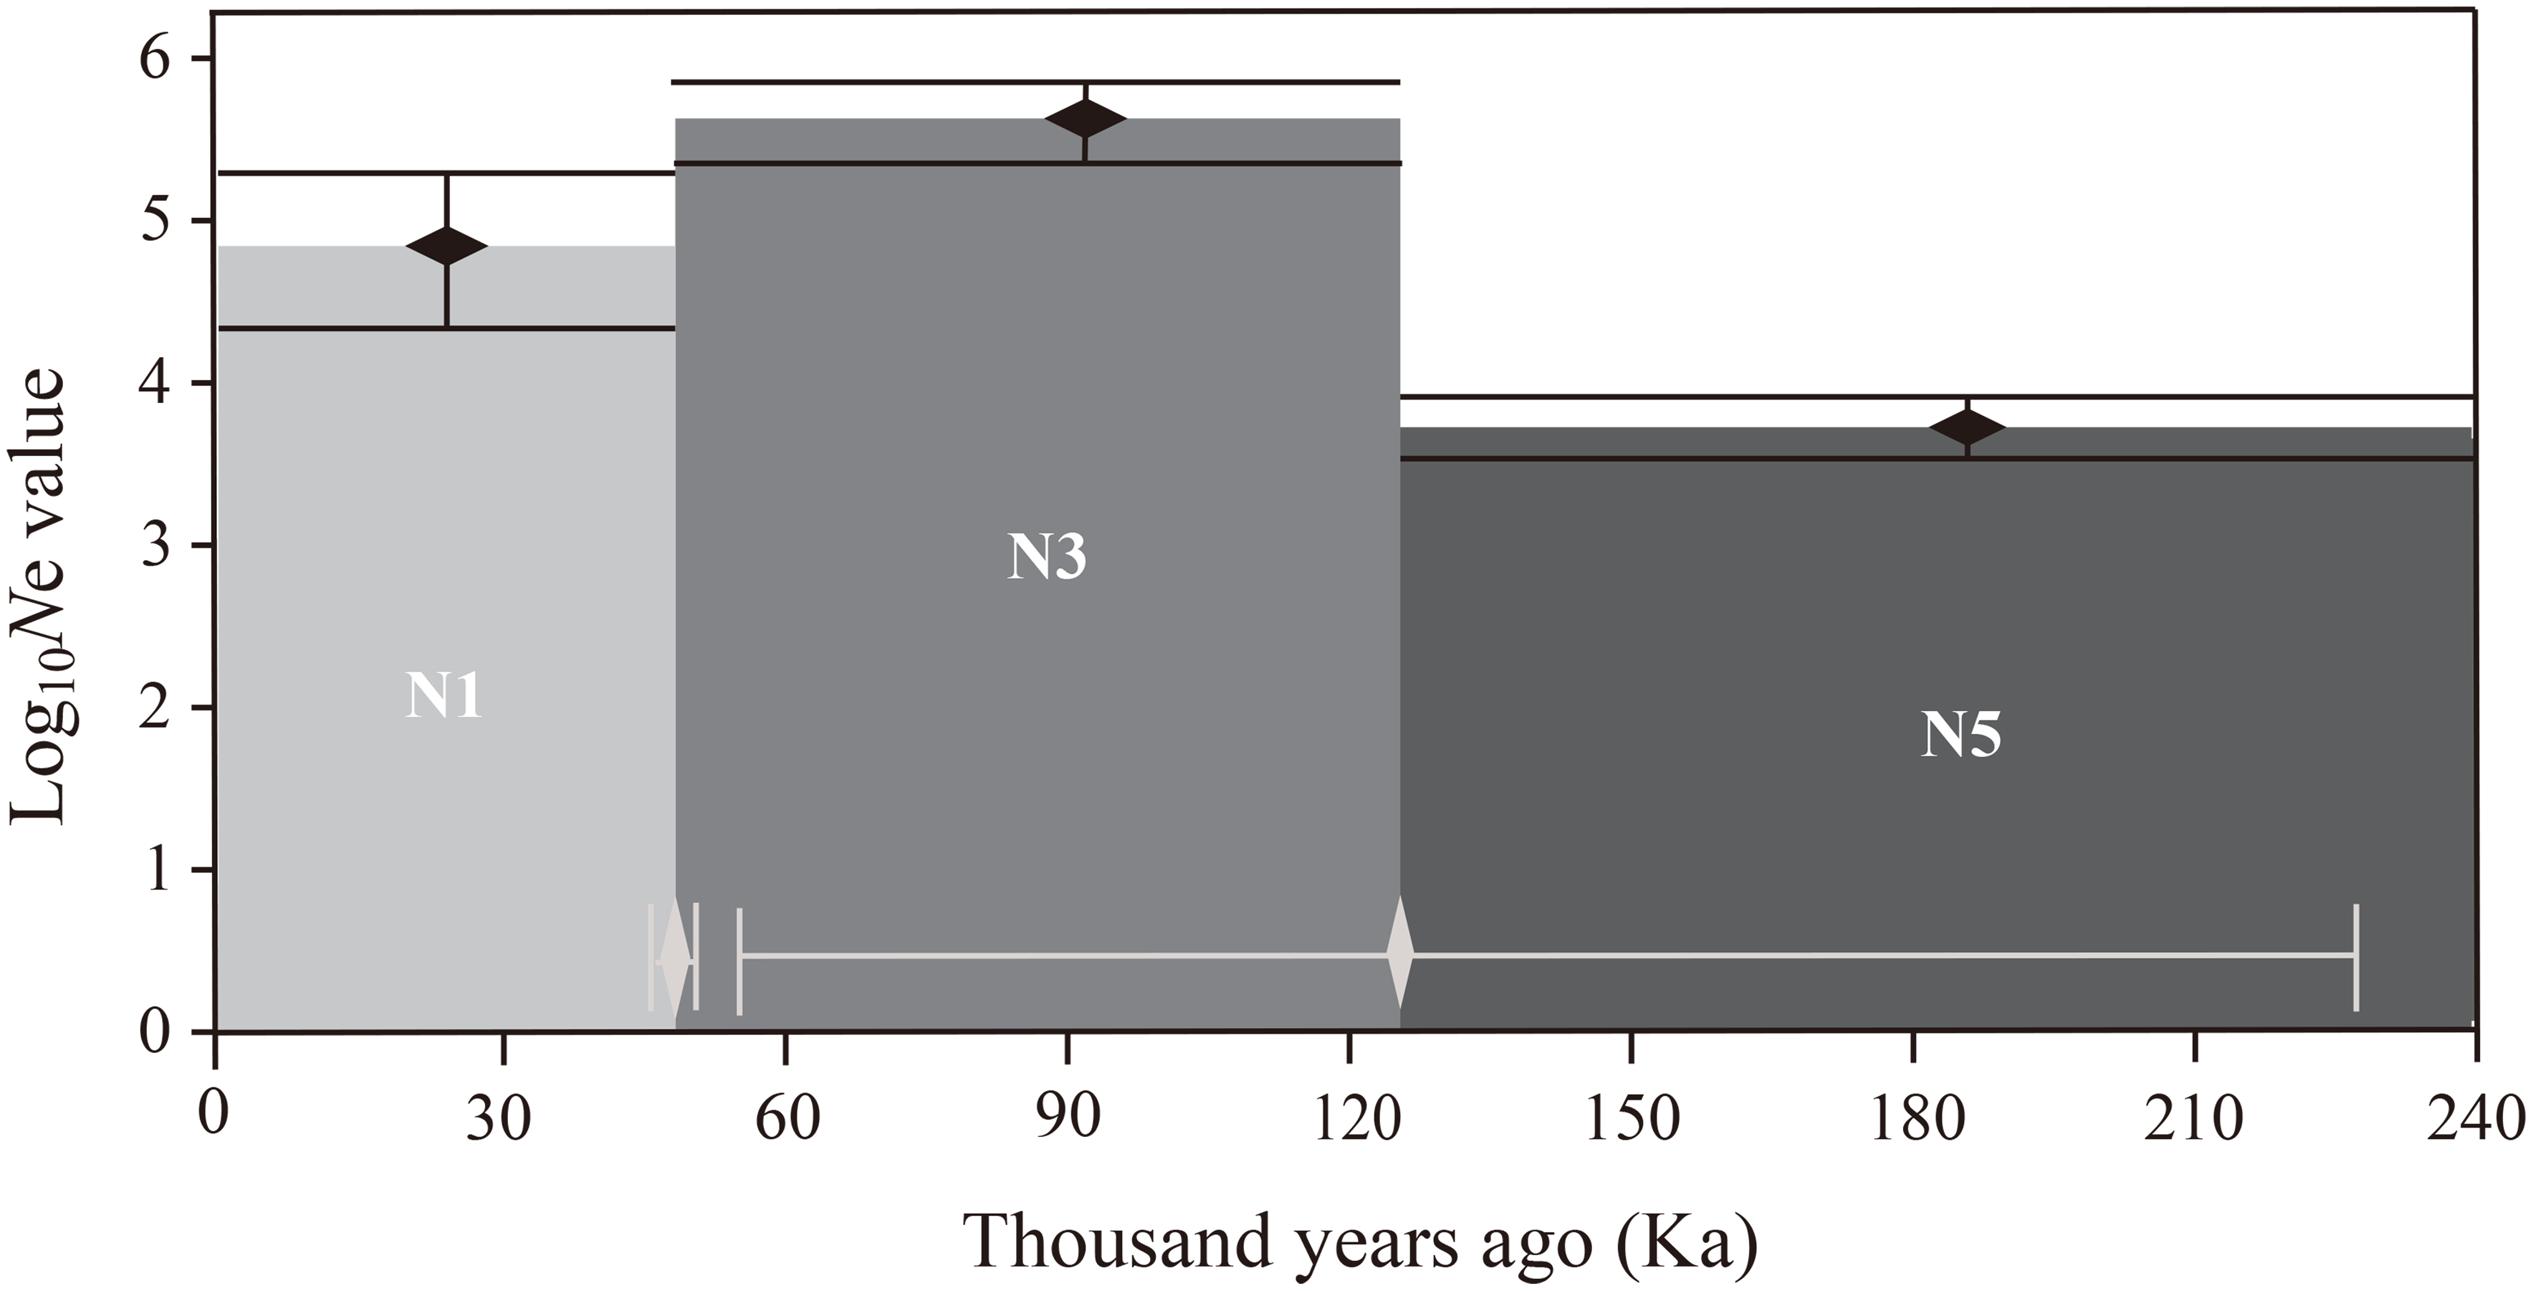
Figure 10. Schematic representation for the estimates of effective population size and the effective population size transition time of the best DIYABC scenario (Scenario 7). Black vertical bars and white horizontal bars represent 95% confidence intervals for the estimates of effective population size and effective population size transition time, respectively. Note that the y-axis of effective population size value is in log10 format.
Discussion
High Genetic Diversity Within Populations and Low Genetic Differentiation Among Populations
The evolutionary potential of a species and its ability to withstand adverse environments depend on both genetic diversity of the species and its population genetic structure (Stebbins, 1950). Different levels of genetic variation and genetic structure of populations can be attributed to multiple factors, such as distribution ranges, life forms, breeding systems, seed dispersal mechanisms, evolutionary history, natural selection, and human interference (Hamrick and Godt, 1996; Sarin et al., 2015; Zhou et al., 2020). In general, the genetic diversity of widespread plant species is higher than that of narrowly distributed species (Hamrick and Godt, 1996), and compared to annual and perennial herbaceous plants, perennial woody plants tend to have higher genetic diversity at the species level and within populations, but lower genetic variation among populations (Hamrick et al., 1979, 1992; Chung et al., 2020). As a long-lived perennial woody plant widely distributed in tropical and subtropical areas, P. emblica was found to have high genetic diversity at the species level (He = 0.796), and the mean genetic diversity of the 10 populations investigated in the present study (He = 0.792) was similar to that reported for this species in Thailand (He = 0.619) (Pandey and Changtragoon, 2012) and Sri Lanka (He = 0.753) (Mawalagedera et al., 2014), but significantly higher than that reported by Nybom (2004) for multiple plant species (He = 0.22 or 0.23). Compared to congeneric herbs, such as P. amarus (total diversity hT = 0.62; average intrapopulation diversity hS = 0.47; level of genetic differentiation GST = 0.24) and P. fraternus (hT = 0.77; hS = 0.57; GST = 0.26) (Sarin et al., 2015), P. emblica showed higher genetic variation at the species level (0.796) and within populations (0.792), but lower genetic differentiation among populations (FST = 0.084) in the present study. Outcrossing species usually have higher genetic diversity than inbreeding species (Hamrick and Godt, 1989; Nybom, 2004). A previous study revealed that the mating system of P. emblica is dominated by outcrossing (Singh et al., 1998). In the present study, the MSB and MSE populations were mainly outcrossing populations (FIS < 0, t > 1); however, for the other eight populations, the inbreeding coefficients (FIS) were positive, and the outcrossing rates (t) were lower than 1, indicating insufficient heterozygotes and the possibility of inbreeding. According to our long-term field investigations, this could be attributed to human interference in the habitats of these eight populations, resulting in insufficient heterozygotes and a high inbreeding coefficient. This might also be attributed to hybridization (inbreeding) between adjacent individuals with the same genotype. The richness of plant genetic diversity is related to the complexity of its habitat and ecological factors such as precipitation, temperature, and soil (Abeysinghe et al., 2000), which is a possible reason for different genetic diversity of the same species in different habitats. The high genetic diversity of species with a high inbreeding coefficient may be related to the heterogeneity and complexity of their habitat. In China, P. emblica is a widely distributed species and occupies different habitats, which could create a rich gene pool through long-term adaptive evolution, leading to increased genetic diversity. In addition, it is also possible that these populations exhibit a high degree of genetic diversity from ancestral populations originating from southeastern tropical Asia (Morton, 1987; Setoguchi et al., 2011).
Gene flow plays an important role in population genetic differentiation. Genetic migration causes an increase in genetic variation within populations and a decrease in differentiation among populations, which is the opposite of the genetic drift effect (Whitlock and McCauley, 1999). In addition, the genetic differentiation of natural populations is thought to be a dynamic process which relies on the equilibrium relationship between gene flow and selection (Whitlock and McCauley, 1999). In the present study, the populations YMA, MSA, MSB, MSC, and MSD had not significant deviations from the Hardy-Weinberg equilibrium, the estimation of gene flow (Nm) of these populations of P. emblica was >1, indicating that gene flow was high enough to resist the genetic differentiation among populations caused by genetic drift, thus achieving a homogenizing effect (Wright, 1949).
STRUCTURE analysis, NJ tree, and hierarchical analysis revealed that the 260 investigated individuals were grouped into two genetic clusters, and this genetic structure was consistent with geographical distribution, except for some admixed genotypes, which may be a consequence of high genetic variation within populations, resulting in the occurrence of similar genetic variations in the individuals of the two groups. This may be also attributed to genetic migration between the two groups, or to some genes from the ancestral populations shared in the two groups. Pollen spread and seed dispersal are the most important determinants of gene flow. Woody species, especially trees, usually have low population density and large statures, which is beneficial to the long-distance migration of pollen and seeds (Paffetti et al., 1996). In nature, P. emblica is mainly pollinated by wind and bees (Bajpai, 1957), and the long-distance transmission of pollen provides the chances of long-distance genetic migration between different populations (Nakanishi et al., 2020). In nature, P. emblica usually depends on seed propagation, and long-distance seed dispersal must depend on certain fruit-eating animals (Li and Zhao, 2007). Because of the limited range of activities of fruit-eating animals and the limited number of seeds they are able to carry, the contribution of seed dispersal to the homogenization of P. emblica populations is expected to be small. We presumed that the frequent gene flow among P. emblica populations might be caused by pollen flow by wind or pollinators. Therefore, we concluded that the investigated species exhibited high levels of genetic diversity and low levels of genetic differentiation.
Differences Between the Genetic Diversity of P. emblica Populations From the Two Climate Areas
According to the niche breadth variation hypothesis, molecular genetic variation is related to environmental variation, and high level of genetic variation is an adaptive strategy of plants for responding to heterogeneous environments (Levins, 1968). The current research supported the original hypothesis, i.e., the level of genetic diversity in the dry climate group (Na = 11.790, He = 0.786, I = 1.962) was higher than that in the wet climate group (Na = 9.060, He = 0.673, I = 1.555), and both of these values were higher than the genetic diversity of Camellia nitidissima at the population level (Li et al., 2020; Na = 3.881, He = 0.546, I = 0.988). Moreover, the AMOVA suggested that genetic variation within the populations of the dry climate group (96.24%) was also higher than that within the populations of the wet climate group (93.36%). The Mantel tests confirmed that the genetic diversity of this species was affected by altitude, precipitation and geographic distance. Interestingly, the partial Mantel tests showed that the pure effects of altitude and precipitation only on Shannon’s diversity index (I) was significant, which implied that this genetic diversity index was more sensitive to the environmental response to some extent. Just as it is widely used in microbial and forest landscape researches (Allen et al., 2009; Trivedi et al., 2020), Shannon’s diversity index (I) is also a key indicator for genetic diversity assessment of woody plants. This study supported the conclusion that altitude significantly affects the distribution of genetic variation in populations (Chen et al., 2008; Hahn et al., 2012). In this study, the populations in low-altitude wet climate areas had lower genetic diversity. On the one hand, it might be because of undergoing stronger genetic bottlenecks and founder effects for these populations (possible range contractions and expansions during the Pleistocene as supported by Scenario 7) (Hensen et al., 2012). On the other hand, it might also be explained by the restriction of sexual reproduction, as the yield and quality of P. emblica populations in the wet climate areas were significantly lower than those in the wet climate areas (Liu et al., unpublished data). Recent studies have proposed that genetic diversity basically exhibited a high-low-high pattern with increasing altitude (Wang et al., 2019). However, this study did not involve the genetic diversity analysis of the populations distributed at intermediate altitudes. However, the characteristics of higher genetic diversity in the populations at high altitudes lay a solid foundation for carrying out artificial assisted transplantation of this species in the context of climate warming. As far as precipitation is concerned, according to the statistical data of 79 vascular plants, the precipitation and seasonal drought had important implications for the genetic diversity of vascular plants species (Tan et al., 2018). Although drought is a limiting factor for plant growth, after long-term adaptive evolution, plants in arid environments can developed different drought-resistant mechanisms (such as resistance genes) as well as genetic structures for adaptation to the environment (Ceccarelli and Grando, 1996; Ricardo-Trejo and O’Connell, 2005). The genetic variation and diversity of the populations in arid environments is predicted to increase as a consequence of drought stress, and the rate of evolution of plant populations in these environments is higher than that of the populations in humid environments (Stebbins, 1952). Therefore, this can explain why P. emblica in the dry-hot valley of Yunnan had higher genetic diversity than that in the humid area of Guangxi. In addition, it is worth noting that the Mantel tests also revealed the significant correlation between environmental and geographical distance, implying a certain degree of isolation by distance (IBD). Given that intermediate populations between the two climate zones were not sampled and compared, in future researches, further work should be carried out to study the populations distributed in more climatic gradients, altitude gradients and distance gradients to reveal the general effects of altitude, precipitation and geographical distance on genetic diversity.
Our results showed moderate genetic differentiation between the two climate groups (F = 0.095). The genetic differentiation among the populations in the wet climate group (FST = 0.071) was higher than that among the populations in the dry climate group (FST = 0.042), and it might be the result of combined effects of isolation by distance (IBD) and environmental selection. The effective population size of the dry climate group was larger than that of the wet climate group, and the effective population sizes of BCC was the largest (83.5), whereas MSA had the smallest effective population size (10.1). However, DIYABC analysis suggested the effective population size of P. emblica might have contracted in the beginning of the Last Glacial Maximum. The above results supported that genetic differentiation was associated with decline in the effective population size (Frankel et al., 1995).
Population Dynamics
Compared with the expansion period, the most likely Scenario 7 revealed that the effective population size of P. emblica shrank by approximately 0.8 times at 49.85 Ka. Although there was a certain degree of uncertainty in the estimation of population dynamics history in terms of the 95% confidence interval, the detected bottleneck events corresponded well to the beginning of LGM (Clark et al., 2009). The effective population size of P. emblica after experiencing a genetic bottleneck was lower than the estimated value of the ancestral population of the model plant Poplar (Populus) (Ingvarsson, 2008), implying the intensity of the bottleneck experienced to some extent. After experiencing the bottleneck effect to some extent, the populations of P. emblica still maintained high genetic diversity, which may have been a consequence of gene mutation or high gene flow, and consequently, the level of genetic variation remained close to or returned to its original level. However, if human disturbance continues in the future, it will probably result in population decline, habitat fragmentation, or even population isolation of this species, and P. emblica may experience the bottleneck effect once again. According to our long-term field investigations, significant deviations from Hardy-Weinberg equilibrium in the YMB, BCA, BCB, BCC, and MSD populations may be a consequence of human activities which negatively influenced the habitats of these five populations, resulting in heterozygote deficiency and high inbreeding coefficient in these populations (Bourguiba et al., 2020). It is worth noting that P. emblica is not distributed in Northern China, whereas almost continuous distribution areas are formed in Southern and Southwestern China (Pathak, 2003). Based on dynamic history of this species preliminarily speculated in this study, the unique distribution bottleneck in China may be explained by the detected genetic bottleneck event that occurred in the beginning of LGM.
Implications for Ecological Restoration
China has abundant resources of P. emblica. However, this famous plant species which has important medicinal, commercial, and ecological values is being consumed at a very high and alarming rate, with the increase in human population leading to the increase in the demand for such plant materials. In Yunnan and Guangxi, the natural P. emblica forests are commonly being cut down for fodder, fuel, and wood. Because of the negative influence of climate change and human activities, the native vegetation types in the dry-hot P. emblica habitat have declined and are almost non-existent. The existing habitat types mainly include semi-savannah vegetation similar to the valley savannah vegetation in Africa (Jin and Ou, 2000), and in some places, they have even become bare lands and barren hills, leading to the destruction of biodiversity and ecosystem stability as well as serious soil erosion. The habitat of P. emblica in the humid climate area of Guangxi is karst landform, where plants live in harsh and extremely fragile conditions with serious soil erosion and high ecological sensitivity. Over-exploitation is a serious threat to the survival of this species, and currently, it is difficult to find well-preserved wild P. emblica forests in China. At the same time, the harsh and fragile habitats of P. emblica are also facing various threats, including climate change and human activities, and it is difficult for the ecosystem to recover naturally after these disturbances. Therefore, it is crucial to protect and rationally utilize the wild resources of P. emblica as well as to put efforts into the ecological restoration of its habitats.
P. emblica is a species with excellent tolerance to drought and barren soil because of its well-developed roots, and is often used as a pioneer tree species for forestation. Meanwhile, its high genetic diversity provides more possibilities to breed high-quality varieties of this species to be used as an important medicinal economic plant. The genetic resource conservation of local P. emblica populations should be considered mainly for the ecological restoration of dry-hot valleys and karst areas. In addition to in situ conservation of the populations with high genetic diversity, ex situ germplasm collection for different purposes, such as breeding and conservation, is also significant for achieving our goals. Compared to the five populations from the Guangxi area, the five populations from the dry-hot valley of Yunnan had higher genetic diversity, particularly the YMA and YMB populations, and attention should be payed to this difference. Furthermore, given that the genetic variation mainly existed within populations, more individuals should be selected and propagated within populations used for ecological restoration in Yunnan dry-hot valley area and Guangxi karst area. In the present study, P. emblica samples were divided into two gene clusters, which should be taken into account when collecting germplasm resources and carrying out ecological restoration. Finally, environmental protection should be advocated in order to increase local farmers’ awareness of the protection of this valuable species, and it should be forbidden to cut down P. emblica trees in its ecological restoration areas.
Conclusion
According to our investigations of the genetic diversity and genetic structure of P. emblica in two different typical climate areas of China by polymorphic EST-SSR markers, P. emblica had more genetic diversity at the species level and within populations, but less genetic variation among populations. However, the genetic diversity of P. emblica in the dry climate area of Yunnan was higher than that in the wet climate area of Guangxi, and both altitude and precipitation had significant pure effects on this result. In addition, we found that P. emblica populations had experienced a bottleneck event in the beginning of the Last Glacial Maximum. The findings of this study will provide new ideas and guidance for the protection and rational development and utilization of P. emblica resources, and they will also provide a scientific basis for the ecological restoration and economic development in Yunnan dry-hot valley areas and Guangxi karst areas.
Data Availability Statement
The original contributions presented in the study are included in the article/Supplementary Materials, further inquiries can be directed to the corresponding author/s.
Author Contributions
HM conceptualized the study. XL, YM, and ZL contributed to the investigation. XL and YW were in charge of data curation. XL and HM wrote the original draft, and HM reviewed. All authors agree to be accountable for the final manuscript.
Funding
This work was supported by the Fundamental Research Funds for the Central Non-profit Research Institution of the Chinese Academy of Forestry (Grant No. CAFYBB2016ZX003-2); the Technology Innovation Talent Project of Yunnan Province (Grant No. 2016HB007); the Ten Thousand Talent Program of Yunnan Province (Grant to HM); and the Young and Middle-aged Academic and Technical Leader Reserve Talent Project of Yunnan Province (Grant No. 2018HB066; grant to YM).
Conflict of Interest
The authors declare that the research was conducted in the absence of any commercial or financial relationships that could be construed as a potential conflict of interest.
Supplementary Material
The Supplementary Material for this article can be found online at: https://www.frontiersin.org/articles/10.3389/fpls.2020.580812/full#supplementary-material
References
Abeysinghe, P. D., Triest, L., De Greef, B., Koedam, N., and Hettiarachi, S. (2000). Genetic and geographic variation of the mangrove tree Bruguiera in Sri Lanka. Aquat. Bot. 67, 131–141. doi: 10.1016/S0304-3770(99)00096-0
Allen, B., Kon, M., and Bar Yam, Y. (2009). A new phylogenetic diversity measure generalizing the Shannon index and its application to phyllostomid bats. Am. Nat. 174, 236–243. doi: 10.1086/600101
Bajpai, P. N. (1957). Blossom biology and fruit set in Phyllanthus emblica L. Indian. J. Hortic. 14, 99–102.
Bouck, A., and Vision, T. (2007). The molecular ecologist’s guide to expressed sequence tags. Mol. Ecol. 16, 907–924. doi: 10.1111/j.1365-294X.2006.03195.x
Bourguiba, H., Scotti, I., Sauvage, C., Zhebentyayeva, T., Ledbetter, C., Krška, B., et al. (2020). Genetic structure of a worldwide germplasm collection of Prunus armeniaca L. reveals three major diffusion routes for varieties coming from the species’ center of origin. Front. Plant Sci. 11:638. doi: 10.3389/fpls.2020.00638
Ceccarelli, S., and Grando, S. (1996). Drought as a challenge for the plant breeder. Plant Growth Regul. 20, 149–155. doi: 10.1007/BF00024011
Chaphalkar, R., Apte, K. G., Talekar, Y., Ojha, S. K., and Nandave, M. (2017). Antioxidants of Phyllanthus emblica L. bark extract provide hepatoprotection against ethanol-induced hepatic damage: a comparison with Silymarin. Oxid. Med. Cell. Longev. 2017:e3876040. doi: 10.1155/2017/3876040
Chen, G., Wang, Y., Zhao, C., Korpelainen, H., and Li, C. (2008). Genetic diversity of Hippophae rhamnoides populations at varying altitudes in the Wolong natural reserve of china as revealed by ISSR markers. Silvae Genet. 57, 29–36. doi: 10.1515/sg-2008-0005
Choudhary, M., and Grover, K. (2019). “Amla (Emblica officinalis L.) Oil,” in Fruit Oils: Chemistry and Functionality, ed. M. Ramadan (Cham: Springer), 875–882.
Chung, M. Y., Son, S., Herrando-Moraira, S., Tang, C. Q., Maki, M., Kim, Y., et al. (2020). Incorporating differences between genetic diversity of trees and herbaceous plants in conservation strategies. Conserv. Biol. 34, 1142–1151. doi: 10.1111/cobi.13467
Clark, P. U., Dyke, A. S., Shakun, J. D., Carlson, A. E., Clark, J., Wohlfarth, B., et al. (2009). The last glacial maximum. Science 325, 710–714. doi: 10.1126/science.1172873
Cornuet, J., Pudlo, P., Veyssier, J., Dehne-Garcia, A., Gautier, M., Leblois, R., et al. (2014). DIYABC v2.0: a software to make approximate Bayesian computation inferences about population history using single nucleotide polymorphism, DNA sequence and microsatellite data. Bioinformatics 30, 1187–1189. doi: 10.1093/bioinformatics/btt763
Doyle, J. J., and Doyle, J. L. (1987). A rapid DNA isolation procedure for small quantities of fresh leaf tissue. Phytochem. Bull. 19, 11–15.
Earl, D. A., and VonHoldt, B. M. (2012). STRUCTURE HARVESTER: a website and program for visualizing STRUCTURE output and implementing the Evanno method. Conserv. Genet. Resour. 4, 359–361. doi: 10.1007/s12686-011-9548-7
Evanno, G., Regnaut, S., and Goudet, J. (2005). Detecting the number of clusters of individuals using the software structure: a simulation study. Mol. Ecol. 14, 2611–2620. doi: 10.1111/j.1365-294X.2005.02553.x
Excoffier, L., Laval, G., and Schneider, S. (2005). Arlequin (version 3.0): an integrated software package for population genetics data analysis. Evol. Bioinform. 1, 47–50. doi: 10.1177/117693430500100003
Fick, S. E., and Hijmans, R. J. (2017). WorldClim 2: new 1-km spatial resolution climate surfaces for global land areas. Int. J. Climatol. 37, 4302–4315. doi: 10.1002/joc.5086
Frankel, O. H., Brown, A. H. D., and Burdon, J. J. J. (1995). The Conservation of Plant Biodiversity. Cambridge: Cambridge University Press.
Gaisberger, H., Legay, S., Andre, C., Loo, J., Azimov, R., Aaliev, S., et al. (2020). Diversity under threat: connecting genetic diversity and threat mapping to set conservation priorities for Juglans regia L. populations in Central Asia. Front. Ecol. Evol. 8:171. doi: 10.3389/fevo.2020.00171
Garot, E., Joët, T., Combes, M., and Lashermes, P. (2019). Genetic diversity and population divergences of an indigenous tree (Coffea mauritiana) in Reunion Island: role of climatic and geographical factors. Heredity 122, 833–847. doi: 10.1038/s41437-018-0168-9
Hahn, T., Kettle, C. J., Ghazoul, J., Frei, E. R., Matter, P., and Pluess, A. R. (2012). Patterns of genetic variation across altitude in three plant species of semi-dry grasslands. PLoS One 7:e41608. doi: 10.1371/journal.pone.0041608
Hamrick, J. L., and Godt, M. J. W. (1989). “Allozyme diversity in plant species,” in Plant Population Genetics, Breeding and Genetic Resources, eds H. D. Brown, M. T. Clegg, and A. L. Kahler (Sunderland: Sinauer Associates Inc), 43–46.
Hamrick, J. L., and Godt, M. J. W. (1996). Effects of life history traits on genetic diversity in plant species. Philos. Trans. R. Soc. Lond. B Biol. Sci. 351, 1291–1298. doi: 10.1098/rstb.1996.0112
Hamrick, J. L., Godt, M. J. W., and Sherman-Broyles, S. L. (1992). “Factors influencing levels of genetic diversity in woody plant species,” in Population Genetics of Forest Trees, eds W. T. Adams, S. H. Strauss, D. L. Copes, and A. R. Griffin (Dordrecht: Springer), 95–124.
Hamrick, J. L., Linhart, Y. B., and Mitton, J. B. (1979). Relationships between life history characteristics and electrophoretically detectable genetic variation in plants. Annu. Rev. Ecol. Syst. 10, 173–200. doi: 10.1146/annurev.es.10.110179.001133
Helmstetter, A. J., Amoussou, B. E. N., Bethune, K., Kamdem, N. G., Glèlè Kakaï, R., Sonké, B., et al. (2020). Phylogenomic approaches reveal how climate shapes patterns of genetic diversity in an African rain forest tree species. Mol. Ecol. 29, 3560–3573. doi: 10.1111/mec.15572
Hensen, I., Cierjacks, A., Hirsch, H., Kessler, M., Romoleroux, K., Renison, D., et al. (2012). Historic and recent fragmentation coupled with altitude affect the genetic population structure of one of the world’s highest tropical tree line species. Glob. Ecol. Biogeogr. 21, 455–464. doi: 10.1111/j.1466-8238.2011.00691.x
Ingvarsson, P. K. (2008). Multilocus patterns of nucleotide polymorphism and the demographic history of Populus tremula. Genetics 180, 329–340. doi: 10.1534/genetics.108.090431
Jin, Z. Z., and Ou, X. K. (2000). Dry-Hot Valley Vegetation of Yuanjiang River, Nujiang River, Jinsha River, and Lancang River. Kunming: Yunnan University Press.
Kaljund, K., and Jaaska, V. (2010). No loss of genetic diversity in small and isolated populations of Medicago sativa subsp. falcata. Biochem. Syst. Ecol. 38, 510–520. doi: 10.1016/j.bse.2010.05.007
Kesseli, R. V. (1992). “Population biology and conservation of rare plants,” in Applied Population Biology, eds S. K. Jain and L. W. Botsford (Dordrecht: Springer), 69–90.
Lande, R. (1993). Risks of population extinction from demographic and environmental stochasticity and random catastrophes. Am. Nat. 142, 911–927. doi: 10.1086/285580
Langella, O. (2007). Populations 1.2.30: Population Genetic Software (Individuals or Populations Distances, Phylogenetic Trees). Available online at: http://bioinformatics.org/t̃ryphon/populations/ (accessed March 16, 2020).
Letunic, I., and Bork, P. (2016). Interactive tree of life (iTOL) v3: an online tool for the display and annotation of phylogenetic and other trees. Nucleic Acids Res. 44, W242–W245. doi: 10.1093/nar/gkw290
Li, Q., and Zhao, J. (2007). Genetic diversity of Phyllanthus emblica populations in dry-hot valleys in Yunnan. Biodivers. Sci. 15, 84–91. doi: 10.1360/biodiv.060124
Li, X., Wang, J., Fan, Z., Li, J., and Yin, H. (2020). Genetic diversity in the endangered Camellia nitidissima assessed using transcriptome-based SSR markers. Trees 34, 543–552. doi: 10.1007/s00468-019-01935-1
Liu, K., and Muse, S. V. (2005). PowerMarker: an integrated analysis environment for genetic marker analysis. Bioinformatics 21, 2128–2129. doi: 10.1093/bioinformatics/bti282
Liu, X. F., Ma, H., Li, T. Q., Li, Z. H., Wan, Y. M., Liu, X. X., et al. (2018). Development of novel EST-SSR markers for Phyllanthus emblica (Phyllanthaceae) and cross-amplification in two related species. Appl. Plant Sci. 6:e1169. doi: 10.1002/aps3.1169
Mawalagedera, S. M. U. P., Janaththani, P., Dunuwille, S. W. M. B., Perera, G. A. D., and Weebadde, C. K. (2014). DNA marker analysis reveals genomic diversity and putative QTL associated with drupe traits in Phyllanthus emblica L. Ceylon J. Sci. Biol. Sci. 43, 31–46. doi: 10.4038/cjsbs.v43i1.7323
Morton, J. (1987). “Emblic,” in Fruits of Warm Climates, ed. J. F. Morton (Miami, FL: Florida Flair Books), 213–217.
Nakanishi, A., Takeuchi, T., Ueno, S., Nishimura, N., and Tomaru, N. (2020). Spatial variation in bird pollination and its mitigating effects on the genetic diversity of pollen pools accepted by Camellia japonica trees within a population at a landscape level. Heredity 124, 170–181. doi: 10.1038/s41437-019-0262-7
Nasim, N., Sandeep, I. S., Sahoo, A., Das, S., Panda, M. K., Acharya, L., et al. (2020). Population genetic structure and diversity analysis in economically important Pandanus odorifer (Forssk.) Kuntze accessions employing ISSR and SSR markers. Ind. Crops Prod. 143:e111894. doi: 10.1016/j.indcrop.2019.111894
Nei, M. (1973). Analysis of gene diversity in subdivided populations. Proc. Natl. Acad. Sci. U.S.A. 70, 3321–3323. doi: 10.1073/pnas.70.12.3321
Nybom, H. (2004). Comparison of different nuclear DNA markers for estimating intraspecific genetic diversity in plants. Mol. Ecol. 13, 1143–1155. doi: 10.1111/j.1365-294X.2004.02141.x
Ony, M. A., Nowicki, M., Boggess, S. L., Klingeman, W. E., Zobel, J. M., Trigiano, R. N., et al. (2020). Habitat fragmentation influences genetic diversity and differentiation: fine-scale population structure of Cercis canadensis (eastern redbud). Ecol. Evol. 10, 3655–3670. doi: 10.1002/ece3.6141
Paffetti, D., Scotti, C., Gnocchi, S., Fancelli, S., and Bazzicalupo, M. (1996). Genetic diversity of an Italian Rhizobium meliloti population from different Medicago sativa varieties. Appl. Environ. Microbiol. 62, 2279–2285.
Pandey, M., and Changtragoon, S. (2012). Isolation and characterization of microsatellites in a medicinal plant, Phyllanthus emblica (Euphorbiaceae). Am. J. Bot. 99, e468–e469. doi: 10.3732/ajb.1200157
Paradis, E., and Schliep, K. (2019). ape 5.0: an environment for modern phylogenetics and evolutionary analyses in R. Bioinformatics 35, 526–528. doi: 10.1093/bioinformatics/bty633
Pathak, R. K. (2003). “Status report on genetic resources of Indian gooseberry – Aonla (Emblica officinalis Gaertn.) in South and Southeast Asia,” in Paper Presented at the IPGRI Office for South Asia, New Delhi.
Pritchard, J. K., Stephens, M., and Donnelly, P. (2000). Inference of population structure using multilocus genotype data. Genetics 155, 945–959.
Ricardo-Trejo, C., and O’Connell, M. A. (2005). Genetic diversity of drought-responsive genes in populations of the desert forage Dactylis glomerata. Plant Sci. 168, 1327–1335. doi: 10.1016/j.plantsci.2005.01.010
Sarin, B., Martín, J. P., and Mohanty, A. (2015). Differences in population genetic structure of two ethnomedicinal herbs of the genus Phyllanthus from India: a consequence of anthropogenic intervention? Plant Syst. Evol. 301, 667–676. doi: 10.1007/s00606-014-1104-y
Sébastien, L., Julie, J., and François, H. (2008). FactoMineR: an R package for multivariate analysis. J. Stat. Softw. 25, 1–18. doi: 10.18637/jss.v025.i01
Setoguchi, H., Mitsui, Y., Ikeda, H., Nomura, N., and Tamura, A. (2011). Genetic structure of the critically endangered plant Tricyrtis ishiiana (Convallariaceae) in relict populations of Japan. Conserv. Genet. 12, 491–501. doi: 10.1007/s10592-010-0156-y
Singh, H. K., Srivastava, A. K., and Dwivedi, R. (1998). Pollination and fruit set behaviour of Aonla (Emblica officinalis). Indian J. Agric. Sci. 68, 204–205.
Stebbins, G. L. (1952). Aridity as a stimulus to plant evolution. Am. Nat. 86, 33–44. doi: 10.1086/281699
Tan, J., Wan, J., Luo, F., and Yu, F. (2018). Relationships between genetic diversity of vascular plant species and climate factors. J. Resour. Ecol. 9, 663–672. doi: 10.5814/j.issn.1674-764x.2018.06.009
Trivedi, P., Leach, J. E., Tringe, S. G., Sa, T., and Singh, B. K. (2020). Plant–microbiome interactions: from community assembly to plant health. Nat. Rev. Microbiol. 18, 607–621. doi: 10.1038/s41579-020-0412-1
Variya, B. C., Bakrania, A. K., and Patel, S. S. (2016). Emblica officinalis (Amla): a review for its phytochemistry, ethnomedicinal uses and medicinal potentials with respect to molecular mechanisms. Pharmacol. Res. 111, 180–200. doi: 10.1016/j.phrs.2016.06.013
Wang, S., Liu, Y., Ma, L., Liu, H., and Yan, T. (2014). Isolation and characterization of microsatellite markers and analysis of genetic diversity in Chinese Jujube (Ziziphus jujuba Mill.). PLoS One 9:e99842. doi: 10.1371/journal.pone.0099842
Wang, S., Luo, Y., Yang, T., Zhang, Y., Li, Z., Jin, W., et al. (2019). Genetic diversity of Rhododendron simsii Planch. natural populations at different altitudes in Wujiashan Mountain (central China). Caryologia 72, 41–51. doi: 10.13128/caryologia-760
Waples, R. S., and Do, C. (2008). LDNE: a program for estimating effective population size from data on linkage disequilibrium. Mol. Ecol. Resour. 8, 753–756. doi: 10.1111/j.1755-0998.2007.02061.x
Wells, J. V., Dawson, N., Culver, N., Reid, F. A., and Morgan Siegers, S. (2020). The state of conservation in North America’s boreal forest: issues and opportunities. Front. For. Glob. Change 3:90. doi: 10.3389/ffgc.2020.00090
Whitlock, M. C., and McCauley, D. E. (1999). Indirect measures of gene flow and migration: FST not equal to 1/(4Nm + 1). Heredity 82, 117–125. doi: 10.1038/sj.hdy.6884960
Wright, S. (1949). The genetic structure of populations. Ann. Hum. Genet. 15, 323–354. doi: 10.1111/j.1469-1809.1949.tb02451.x
Xie, W., Zhang, X., Cai, H., Liu, W., and Peng, Y. (2010). Genetic diversity analysis and transferability of cereal EST-SSR markers to orchardgrass (Dactylis glomerata L.). Biochem. Syst. Ecol. 38, 740–749. doi: 10.1016/j.bse.2010.06.009
Yeh, F. C., Yang, R. C., and Boyle, T. (1999). POPGENE VERSION 1.31: Microsoft Window–Based Freeware for Population Genetic Analysis. Available online at: https://sites.ualberta.ca/~fyeh/popgene_download.html (accessed April 21, 2020).
Keywords: Phyllanthus emblica, genetic diversity, genetic structure, population dynamics, precipitation, altitude
Citation: Liu X, Ma Y, Wan Y, Li Z and Ma H (2020) Genetic Diversity of Phyllanthus emblica From Two Different Climate Type Areas. Front. Plant Sci. 11:580812. doi: 10.3389/fpls.2020.580812
Received: 07 July 2020; Accepted: 11 November 2020;
Published: 30 November 2020.
Edited by:
Susann Wicke, Humboldt University of Berlin, GermanyReviewed by:
Alejandro Casas, Universidad Nacional Autónoma de México, MexicoGabriela Castellanos-Morales, The South Border College (ECOSUR), Mexico
Copyright © 2020 Liu, Ma, Wan, Li and Ma. This is an open-access article distributed under the terms of the Creative Commons Attribution License (CC BY). The use, distribution or reproduction in other forums is permitted, provided the original author(s) and the copyright owner(s) are credited and that the original publication in this journal is cited, in accordance with accepted academic practice. No use, distribution or reproduction is permitted which does not comply with these terms.
*Correspondence: Hong Ma, aG9ydHNjaWVuY2VAMTYzLmNvbQ==