 Meinan Sui1†Yan Jing1†
 Haiyan Li1†Yuhang Zhan1Jian Luo1Weili Teng1Lijuan Qiu2
 Hongkun Zheng3
 Wenbin Li1Xue Zhao1*
 Yingpeng Han1*
- 1Key Laboratory of Soybean Biology in Chinese Ministry of Education (Key Laboratory of Soybean Biology and Breeding/Genetics of Chinese Agriculture Ministry), Northeast Agricultural University, Harbin, China
- 2Institute of Crop Science, National Key Facility for Crop Gene Resources and Genetic Improvement (NFCRI) Chinese Academy of Agricultural Sciences, Beijing, China
- 3Bioinformatics Division, Biomarker Technologies Corporation, Beijing, China
Tocopherol (Toc) occurs in soybean seeds and is extracted together with the soybean oil. Toc is utilized as an antioxidant in food and an additive in animal feed. A total of 180 representative accessions and 144 recombinant inbred lines (RILs) from the cross of ‘Hefeng 25’ and ‘OAC Bayfield’ were selected to evaluate individuals and total Toc concentrations in soybean seeds. The 180 soybean samples were sequenced by the approach of Specific Locus Amplified Fragment Sequencing (SLAF-seq). A total of 22,611 single nucleotide polymorphisms (SNPs) were developed. Nineteen quantitative trait nucleotides (QTNs) were identified associated with individual or total-Toc based on genome-wide association analysis (GWAS). Among them, three QTNs located near known QTLs, and 16 were novel. Eighteen QTLs and nine eQTLs were also detected by linkage mapping. The QTN rs9337368 on Chr.02 was colocalized according to the linkage mapping of the RILs and genome-wide association analysis and regarded as a stable locus for mining the candidate genes in association with Toc. A total of 42 candidate genes near the 200 kbp flanking region of this identified locus were found. Upon a gene-based association, 11 SNPs from five genes out of the 42 candidates were detected. Expression level analysis of five candidate genes revealed that two genes were significantly related to Toc content. The identified loci, along with the candidate genes, might be valuable for increasing the Toc concentration in soybean seeds and improving the nutritional value of soybean oil.
Introduction
Soybean (Glycine max (L.) Merr.) is a major crop for oil and food. Soybean oil accounts for 30% of vegetable oil consumption. Tocopherols (Tocs) are extracted with soybean oil during seed processing. Toc concentrations account only 1.5% of the total oil, but they are important for providing oxidative stability (Tavva et al., 2007). Toc is also used as an antioxidant in foods and a nutrient additive in animal food to improve meat quality (Munné-Bosch and Alegre, 2002). As a human diet supplement, Toc can reduce cancer and help prevent cardiovascular diseases (Dwiyanti et al., 2007; Shaw et al., 2017). Toc is a member of the family of structurally-related compounds, including α-, β-, γ- and δ-Toc, and four corresponding unsaturated derivatives, α-, β-, γ- and δ-tocotrienols (Wan et al., 2008). All Tocs are amphipathic molecules and contain a polar chromanol head group, which is derived from homogentisic acid and a lipophilic tail from phytyl-diphosphate (Maheswari et al., 2015; Park et al., 2019). In soybean oil, the biological activities of four individual Tocs vary with the number and position of methyl groups on the chromanol ring (Bramley et al., 2000). The biological activities of α-, β-, γ-, and δ-Toc are 100, 50, 10 and 3% equivalent to that of α-Toc activity (Kamal-Eldin and Appelqvist, 1996; Wan et al., 2008). The proportion of α-Toc is usually less than 10% of the total Toc in soybean seeds (Park et al., 2019). The demand for Toc has increased due to the increasing interest in functional foods and meat products. However, about 85% of Toc is derived from chemical synthesis nowadays (Dwiyanti et al., 2007). The biological activities of Toc that were synthesized by chemical account for only 50% of the natural α-Toc (Dwiyanti et al., 2007). Thus, increasing α-Toc proportion and total Toc concentration of soybean seeds is important for soybean breeding programs.
Toc content of soybean seeds is a complex quantitative trait that is regulated by multiple genetic and environmental factors (Seguin et al., 2010). Genetic improvement on Toc content of soybean seeds by traditional selection is inefficient and time-consuming. Marker-assisted selection (MAS) is faster and more accurate and is based on genotype instead of solely on phenotype. Determining the genetic basis of Toc in soybean seeds is critical for MAS. Two strategies, including traditional quantitative trait locus (QTL) mapping and genome-wide association study (GWAS), were utilized to determine the genetic basis of Toc. For bi-parent QTL mapping, only a limited number with famous strains that have genetic basis (‘Keszthelyi A.S,’ ‘OAC Bayfield’ and ‘Beifeng 9’) have been analyzed (Li et al., 2010; Shaw et al., 2016). Nearly all of these identified QTLs were obtained through a low-resolution genetic map, which was constructed by lower density simple-sequence repeat (SSR) markers (Li et al., 2010; Shaw et al., 2016). These identified QTLs were difficult to use for MAS. Complementary to linkage analysis, genome-wide association study (GWAS) with a population of unrelated lines and high-density single nucleotide polymorphism (SNP) markers could identify causal genes for a broad range of complex traits. Many important traits including soybean cyst nematode (Han et al., 2015; Zhang et al., 2016), seed weight (Liu et al., 2017), fatty acid content (Zhao et al., 2019), protein and oil (Li et al., 2018; Lee et al., 2019) have been reported in the Soybase database. However, no studies for GWAS of Toc concentration in soybean seeds have been reported.
The Toc biosynthetic pathway to higher plants is known, and relatively few genes methyl-6-phytyl-1, 4-benzoquinone (MPBQ), tocopherol cyclize (TC) and Phytyl transferase (HPT)) are associated with Toc accumulation. Increasing the transcript abundance of these genes is an effective approach for improving Toc concentration (Dwiyanti et al., 2007). The integrated analysis of genotype and transcript abundance data associated with complex traits can be used to identify novel genetic pathways involved in complex traits through QTL expression (Wang et al., 2014). Wang et al. (2014) identified 33 eQTLs of four genes from the biosynthetic pathway of soybean seeds isoflavone, and these were valuable for MAS.
In this study, a GWAS of Toc concentration was performed through 22,611 SNPs and 180 soybean accessions. Based on a recombinant inbred line (RIL) population, a QTL analysis was conducted, and MPBQ, TC, and HPT in the Toc biosynthetic pathway were selected as the target genes (TGs) to analyze eQTL that related to Toc concentration. This study aims to identify stable loci and screen candidate genes that highly associated with individual or total-Toc concentration.
Materials and Methods
Plant Material and Field Trials
A germplasm collection including 180 diverse soybean accessions, representing the genetic diversity inside and outside of China (Table S1), was selected to evaluate the individual and total Toc and used for subsequent sequencing analysis and GWAS. Additionally, a cross population of 144 recombinant inbred lines (RILs), derived from crossing between two elite soybean cultivars, ‘Hefeng 25’ (low Toc concentration) and ‘OAC Bayfield’ (high Toc concentration), was used for subsequent linkage analysis (Tanner et al., 1998; Guan et al., 2009). All samples were planted in Harbin for four consecutive years (2014–2017). Field trials were performed using single-row plots (3 m long and 0.65 m between rows) and a randomized complete block design (three replications per test environment). After reaching full maturity, ten randomly selected plants per row in each plot were collected and used to evaluate individual and total Toc concentration. Additionally, for the eQTL analysis, immature seeds of the RILs at the R7 reproductive stage were harvested and quantified in 2017 for transcript abundances (Li et al., 2016). Furthermore, sixteen characteristic germplasms within the association panel were used to analyze the expression levels of candidate genes, including relatively higher accessions (Line 1 to Line 8) and lower accessions (Line 9 to Line 16) of α-Toc, γ-Toc, δ-Toc, and total Toc contents were planted in 2018. Immature seeds were harvested at the R7 reproductive stage, which stage showed the highest content of Toc in grains, for the determination of Toc content and expression analysis of genes (Li et al., 2016).
Sample Preparation and High-Performance Liquid Chromatography (HPLC) Analysis
Extraction and determination of soybean seed Toc were conducted based on methods described by Ujiie et al. (2005). In detail, 5 g test samples were ground to a fine powder. A mixture of 0.1 g soybean flour, 0.05 g ascorbic acid, and 3 ml of 80% (w/v) ethanol was stirred in a 5 ml tube for 10 s, sonicated for 15 min, and stirred for 10 min after adding 2 ml of hexyl hydride at room temperature. The slurry was centrifuged at 13,000 g for 15 min, and then the clear aliquot was filtered through a 0.45-µm PTFE filter. The supernatant was used to measure individual and total Toc using HPLC (Dionex ASI-100, USA) with a C18 reverse-phase column (250 mm length and 4.6 µm particle sizes). The measurement conditions (solvent A: 100% methanol, flow rate: 1.5 ml min−1, the temperature of the column: 40°C; and the injection volume: 20 μl) were set. A senex fluorescent light a detector was used with excitation at 295 nm and emission at 330 nm. The standard concentrations ranged from 5 to 100 µM, and 10 µl volumes (5–1,000 pM) were injected. FR spectra were recorded, and the responses were integrated using Dionex 2.0 software. The external standard method was used for the quantification of Toc in soybean seeds.
Real-Time PCR of the Target Genes Involved in the Toc Biosynthetic Pathway
Some target genes (TGs) involved in the biosynthesis pathway of soybean tocopherols (https://www.kegg.jp/) were selected for investigation of transcript abundance. Total RNA was isolated from soybean seeds samples of all the 144 RIL individuals at the R7 stage using plant RNA purification reagent (TIANGEN, DP432), and then we synthesized the first-strand cDNA based on the TIANScript RT Kit (TIANGEN, KR104). The transcript abundances of the TGs were determined by real-time PCR analysis, and the assay was performed on an ABI 7500 Fast using SuperReal PreMix Plus (SYBR Green) Kit (TIANGEN, FP205) according to manufacturer instructions.
Each reverse transcription was performed with approximately 1 μg of total RNA. About 1 μl of the first-strand cDNA, 0.2 μM of each primer, 0.4 μl of DyeII, and 10 μl of SYBR Green PCR Master Mix, were used for each amplification reaction of 20 μl. The real-time PCR programs were as follows: 95°C for 30 s, for holding stage; 95°C for 3 s, 60°C for 30 s, 72°C for 30 s for 40 cycles, for cycling stage; 95°C for 15 s, 60°C for 1 min, 95°C for 30 s and 60°C for 15 s for melt curve stage. Three technical replicates and three biological duplications were conducted for each sample, and the relative transcript levels were calculated using the comparative threshold method (2−△△CT) with GmActin4 (GenBank accession no. AF049106) as the internal standard control. The sequences of the primer pairs used to amplify these genes are listed in Table S2.
SNP Genotyping Data Collection
The genomic DNA of the whole association panel was isolated using the CTAB method described by Han et al. (2015) and then sequenced based on the specific-locus amplified fragment sequencing (SLAF-seq) approach (Sun et al., 2013). A group of digest enzymes Mse I (EC 3.1.21.4) and HaeIII (EC:3.1.21.4) (Thermo Fisher Scientific Inc., Waltham, MA, USA.) were used to obtain more than 50,000 sequencing tags, each 300–500 bp in length, from each accession based on preliminary analysis of the reference genome. These tags were distributed in unique genomic regions of the 20 soybean chromosomes. The sequencing libraries of each accession were defined based on the sequencing tags. For each accession library, the 45 bp sequence reads at both ends of the sequencing tags were obtained through a barcode method combination with Illumina Genome Analyzer II system (Illumina Inc., San Diego, CA, USA). The alignment between the raw paired-end reads and soybean reference genome was performed using Short Oligonucleotide Alignment Program 2 (SOAP2) software. The raw read in the same genomic position were used to define the SLAF groups based on more than 58,000 high-quality SLAF tags from each tested sample. The SNPs were based on MAF ≥ 0.05. The genotype was regarded as heterozygous when the depth of the minor allele/the total depth of the sample was more than 1/3 (Han et al., 2016).
Twenty soybean germplasms (10 lines with higher level and 10 lines with lower level of Toc concentration) were selected for a genome re-sequencing 10-fold in depth using an Illumina HiSeq 2500 sequencer. Paired-end re-sequencing reads were mapped to the reference genome via BWA (Version: 0.6.1-r104) using default parameters. The BAM format of these mapped reads was converted via SAMtools48 (Version: 0.1.18) software, and unmapped and non-unique reads were filtered. Duplicated reads were further filtered with the Picard package (picard.sourceforge.net, Version:1.87). The BEDtools (Version: 2.17.0) coverage Bed program was used for computing the coverage of sequence alignments. A sequence was defined as “absent” when coverage was lower than 90% and “present” when coverage was higher than 90%. SNPs were identified through the Genome Analysis Toolkit (GATK, version 2.4-7-g5e89f01) and SAMtools (Zhou et al., 2015). Only the SNPs which were detected by both methods were further analyzed. SNPs with allele frequencies lower than 1% in the population were discarded. The annotations of SNPs were conducted based on the soybean reference genome using the package ANNOVAR (Version: 2013-08-23).
Population Structure Evaluation and Linkage Disequilibrium (LD) Analysis
Principal component analysis (PCA) programs of Software package GAPIT (Lipka et al., 2012) were used to analyze the population structure of the natural panel. Software TASSEL version 3.0 (Bradbury et al., 2007) was used to determine LD across the soybean genome with these SNPs (MAF ≥ 0.05 and missing data < 3%). Compared with the GWAS, missing SNP genotypes were not imputed with the major allele before LD analysis. Parameters in the program included MAF (≥ 0.05) and the integrity of each SNP (> 80%).
Genome-Wide Association Analysis
The association signals of individuals and total Toc were identified based on 22,611 SNPs and 180 tested soybean samples with the compressed mixed linear model (CMLM) in GAPIT (Lipka et al., 2012). The significance threshold for the association between SNP and traits was determined by −log10(P) ≥ 3 (Yan et al., 2017).
QTL and eQTL Mapping Based on Linkage Analysis for Soybean Toc Concentration-Related
QTL and eQTL analyses were performed using the composite interval mapping (CIM) method implemented with QTL IciMapping v4.1 using stepwise regression for cofactor selection (Meng et al., 2015). The LOD score threshold was determined based on the results of 1,000 permutations for each trait. The percentage of phenotypic variance and additive effect explained by a QTL for a trait was also estimated.
Prediction of Candidate Genes Controlling Toc Concentration of Soybean Seed
Candidate genes, located in the 200-kb genomic region up- and down-stream of each peak SNP, were classified and then annotated with the soybean reference genome through the methods developed by Cheng et al. (2017). The SNP variations that occurred in the regions of candidate genes, including exon regions, splicing sites, 5′UTRs and 3′UTRs, intron regions and upstream and downstream regions, were detected via genome re-sequencing data. A candidate gene-based association was conducted based on these SNPs and phenotype values of 20 soybean germplasms in different years by using the General Linear Model (GLM) model in TASSEL software 3.0 to identify haplotypes of candidate genes that related to Toc (Bradbury et al., 2007). Significant SNPs related to the target traits were claimed when the test statistic was p < 0.01. Permutation test was used to control the false positive results (Chaubey et al., 1993). The expression levels of five candidate genes in 16 characteristic soybean germplasms at R7 stage were detected by real-time PCR to further analyze candidate genes. The method of real-time PCR was the same as the expression analysis of target genes involved in the Toc biosynthetic pathway. The sequences of the primer pairs used to amplify these genes were listed in Table S2.
Statistical Analysis
A statistical analysis was performed by SPSS 22.0. Descriptive statistics such as minimum, maximum, mean, coefficient of variation, skewness, and kurtosis were calculated for the selected population, including the tocopherol contents of 178 soybean germplasms in four environments, the tocopherol contents of RILs and the expression patterns of three genes (MPBQ, TC, HPT) in RILs at R7 stage. In addition, descriptive statistics such as minimum, maximum, mean, standard error, and coefficient of variation were calculated for expression levels of candidate genes in 16 characteristic soybean germplasms. Analysis of Pearson’s correlation coefficient among tocopherol contents related to expression levels of candidate genes were estimated. The degree of correlation was divided into two levels, including significant correlation (P < 0.05) and extremely significant correlation (P < 0.01).
Results
Phenotype Variation Analysis of the Germplasm Collection and the RILs
The phenotypic values were measured to analyze the variation distribution of the association panel at Harbin from 2014 to 2017 and the RIL population at Harbin in 2017 (Tables 1 and 2). In the association panel, the individual and total Toc concentration of the 180 tested soybean lines varied greatly, including δ-Toc (from 34.90 to 235.10 ug/g), γ-Toc (from 60.20 to 279.40 ug/g), α-Toc (from 1.00 to 69.20 ug/g) and total-Toc (from 80.08 to 497.10 ug/g). The contents of 112.36, 168.04, 21.59, and 301.34 ug/g were the means of the four years of data (Table 1). Of the RIL population, these concentrations also varied over a wide range with averages of 68.95, 139.82, 9.90, and 222.43 ug/g (Table 2). The coefficient of variation, skewness, and kurtosis of the association panel and RIL population are shown in Tables 1 and 2. Continuous distributions with no significant skewness or kurtosis of individual and total Toc concentration for the association and RIL populations showed that these phenotypic values were appropriate for the subsequent GWAS and QTL analysis (Table 1, Figure 1 and Table 2). Additionally, the transcript abundances of three TGs (MPBQ, HPT, and TC) among the RILs at the R7 stage were measured (Table 1). Among these, the variation range of TC expression of the RILs was greater than the MPBQ and HPT expressions. No significant skewness or kurtosis of the three expressions was observed among the RILs; thus these values were suitable for the eQTL analysis.
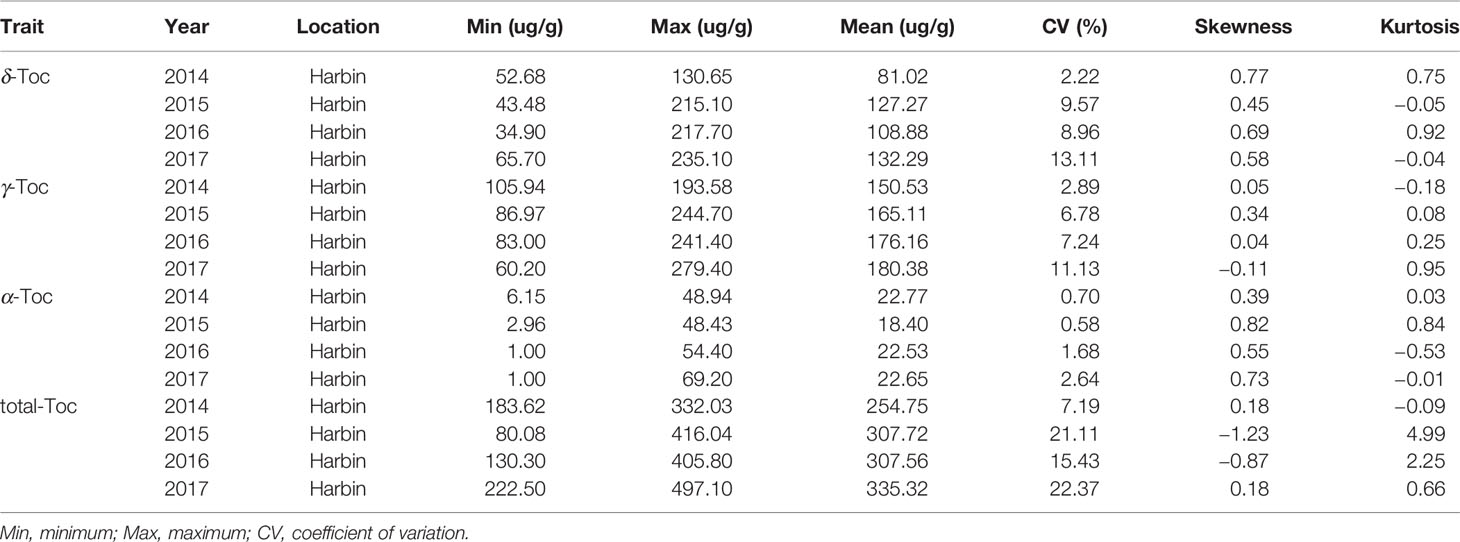
Table 1 Basic genetic parameter statistics for tocopherol in the tested soybean population (n =180).
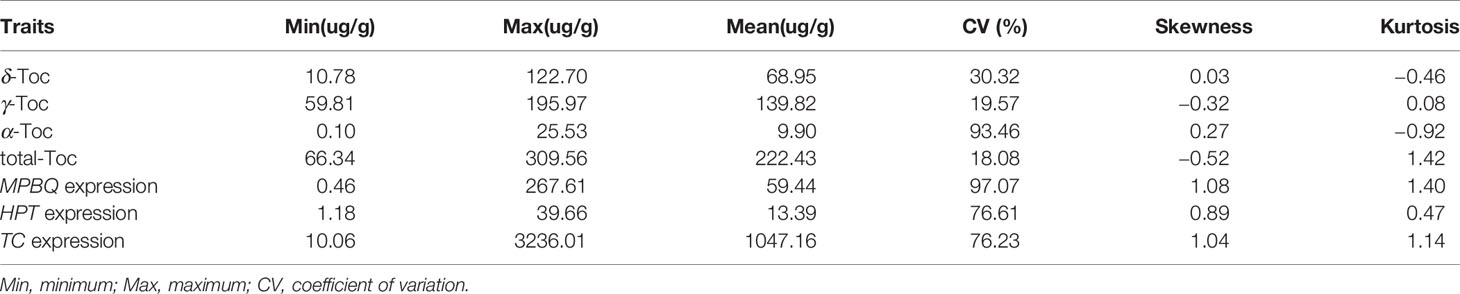
Table 2 Total and individual tocopherol content of the RIL population.
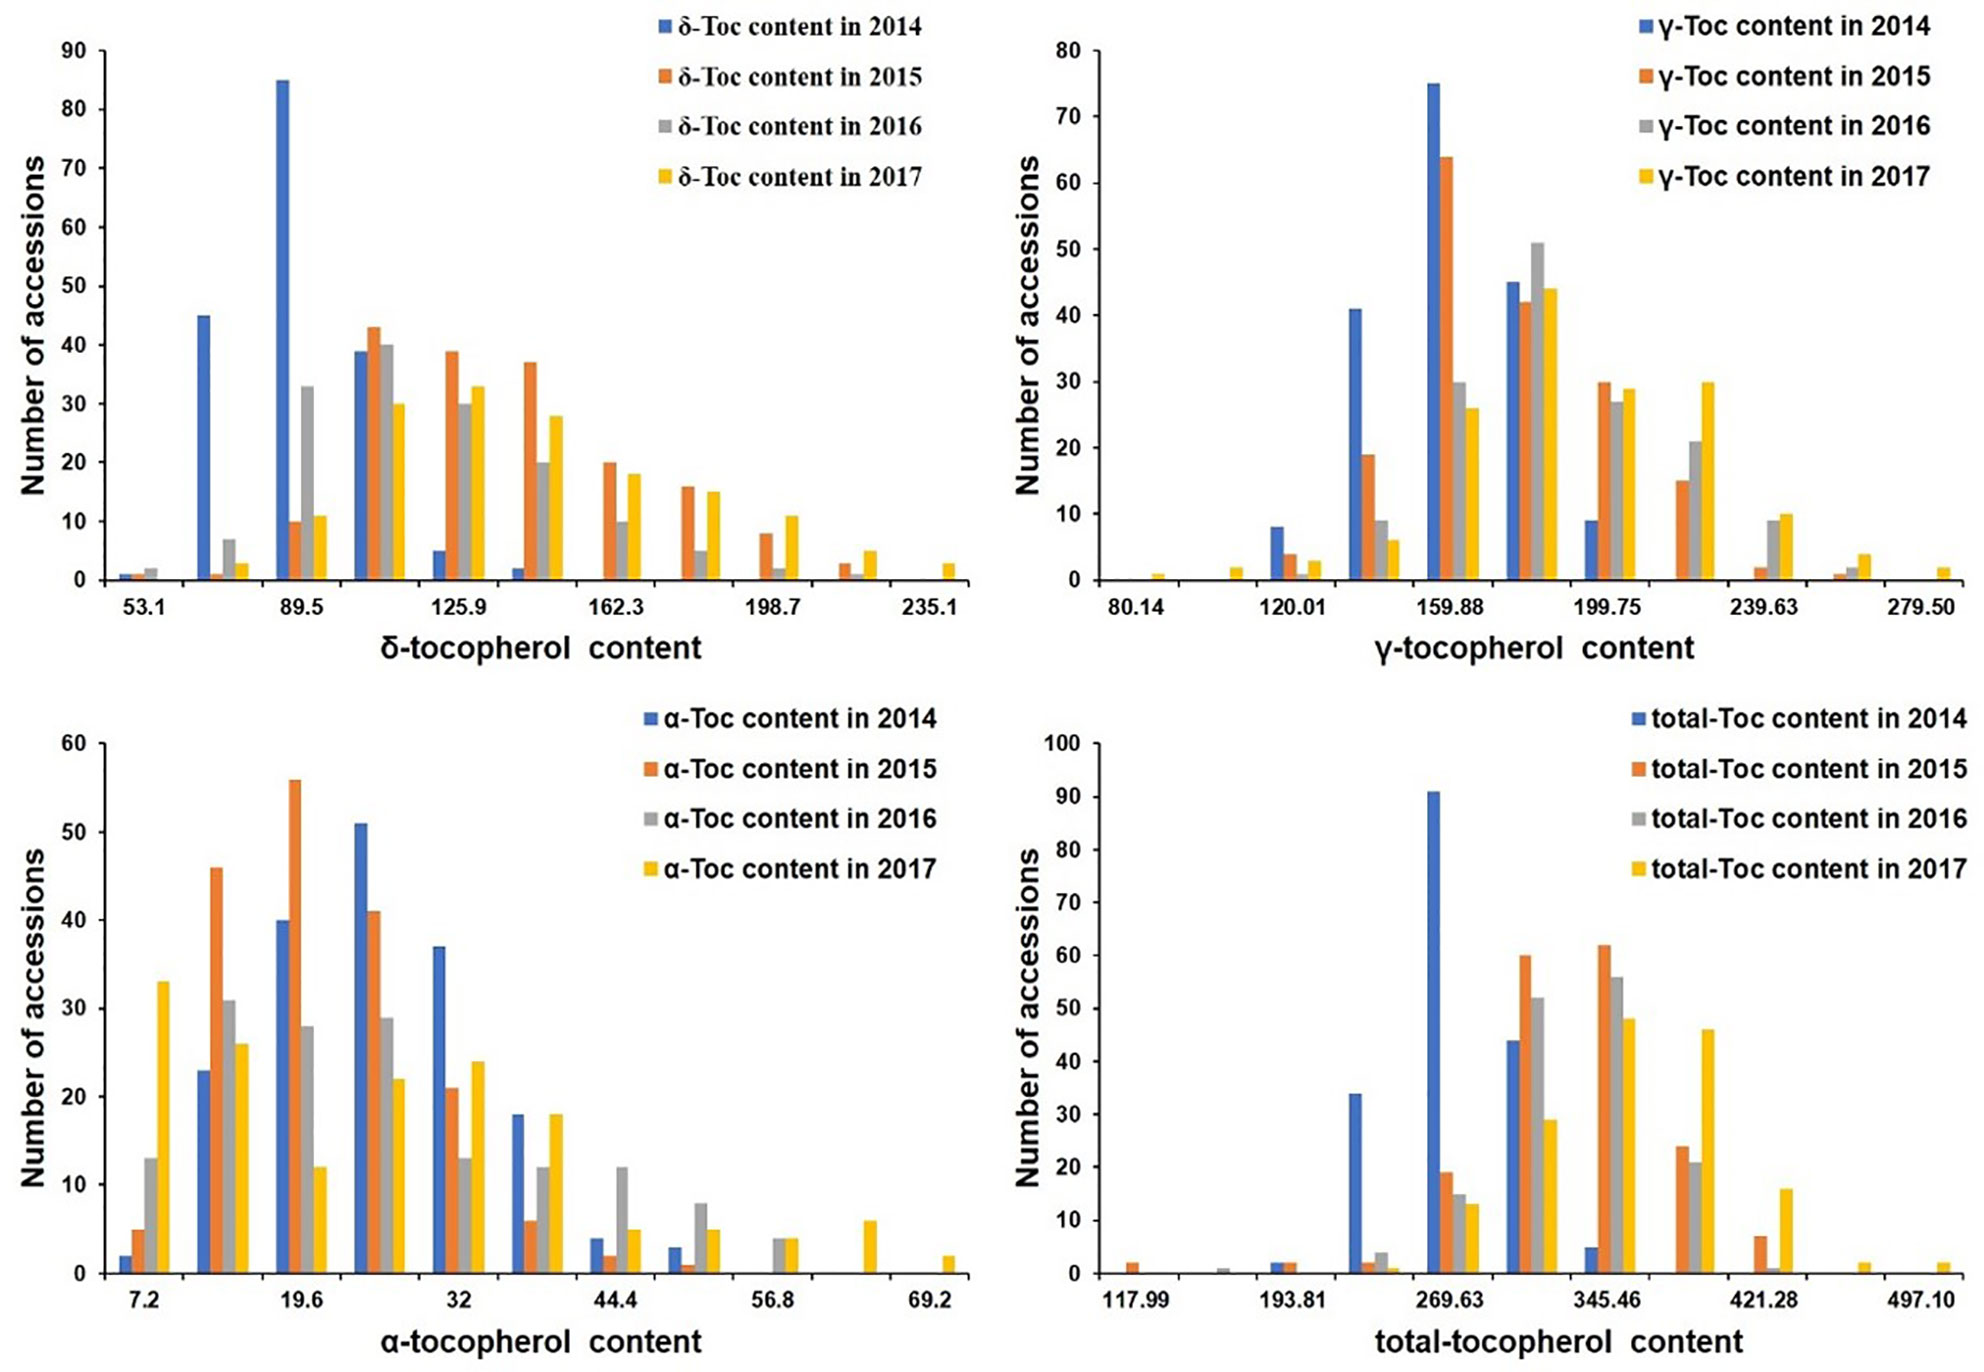
Figure 1 Distribution of tocopherol content among 180 soybean accessions in four tested environments.
SNP Genotyping of the Association Panel
For the association panel, the genomic DNA of the 180 soybean samples was sequenced based on the SLAF-seq approach. A total of 22,611 SNPs distributed on 20 soybean chromosomes were screened with MAF ≥ 0.05 and missing data < 3%. These SNPs spanned 947.07 Mb, which covered about 86.10% of the entire soybean genome (Figure 2). The number of SNPs varied across the 20 soybean chromosomes, and the average number of SNPs per chromosome was 1130. The average marker density was approximately one SNP every 41.89 kb genome-wide.
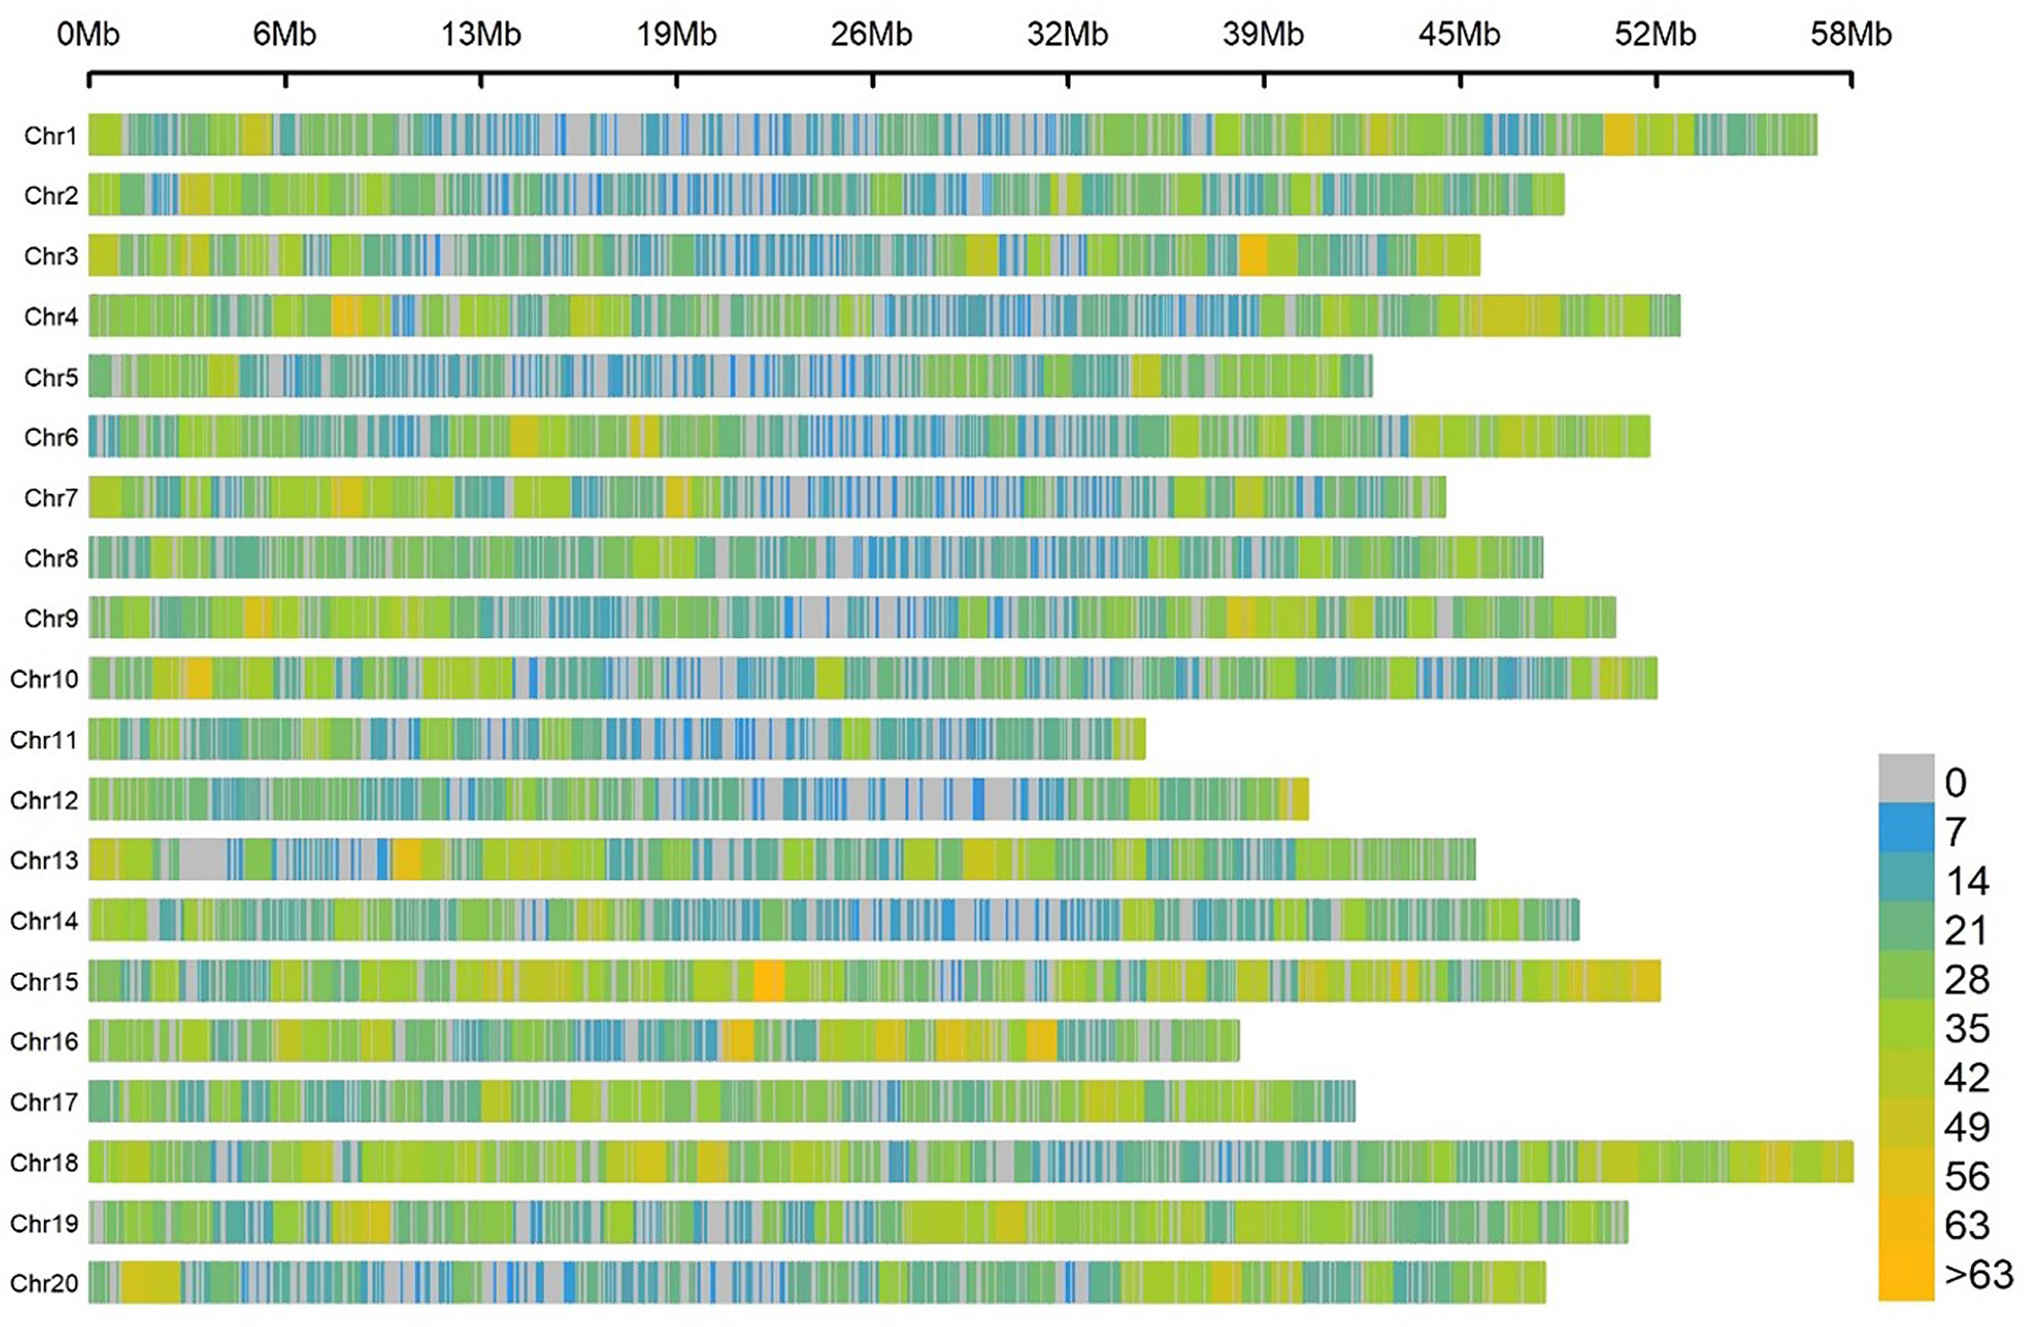
Figure 2 SNP density and distribution across the 20 soybean chromosomes.
Polymorphic SSRs for the RIL Population
Underlying the SSR markers mapped on the 20 LGs of soybean (Cregan et al., 1999; Song et al., 2004), 69 polymorphic SSRs between the two parental genotypes in this study were the new markers compared to the ones on the genetic map published by Li et al. (2010) and were applied in screening the RIL population. The genotypes of the recombinants were determined on the basis of these polymorphic markers and used to encrypt the reported genetic map for further QTL and eQTL analysis (Figure 3 and Table S3).
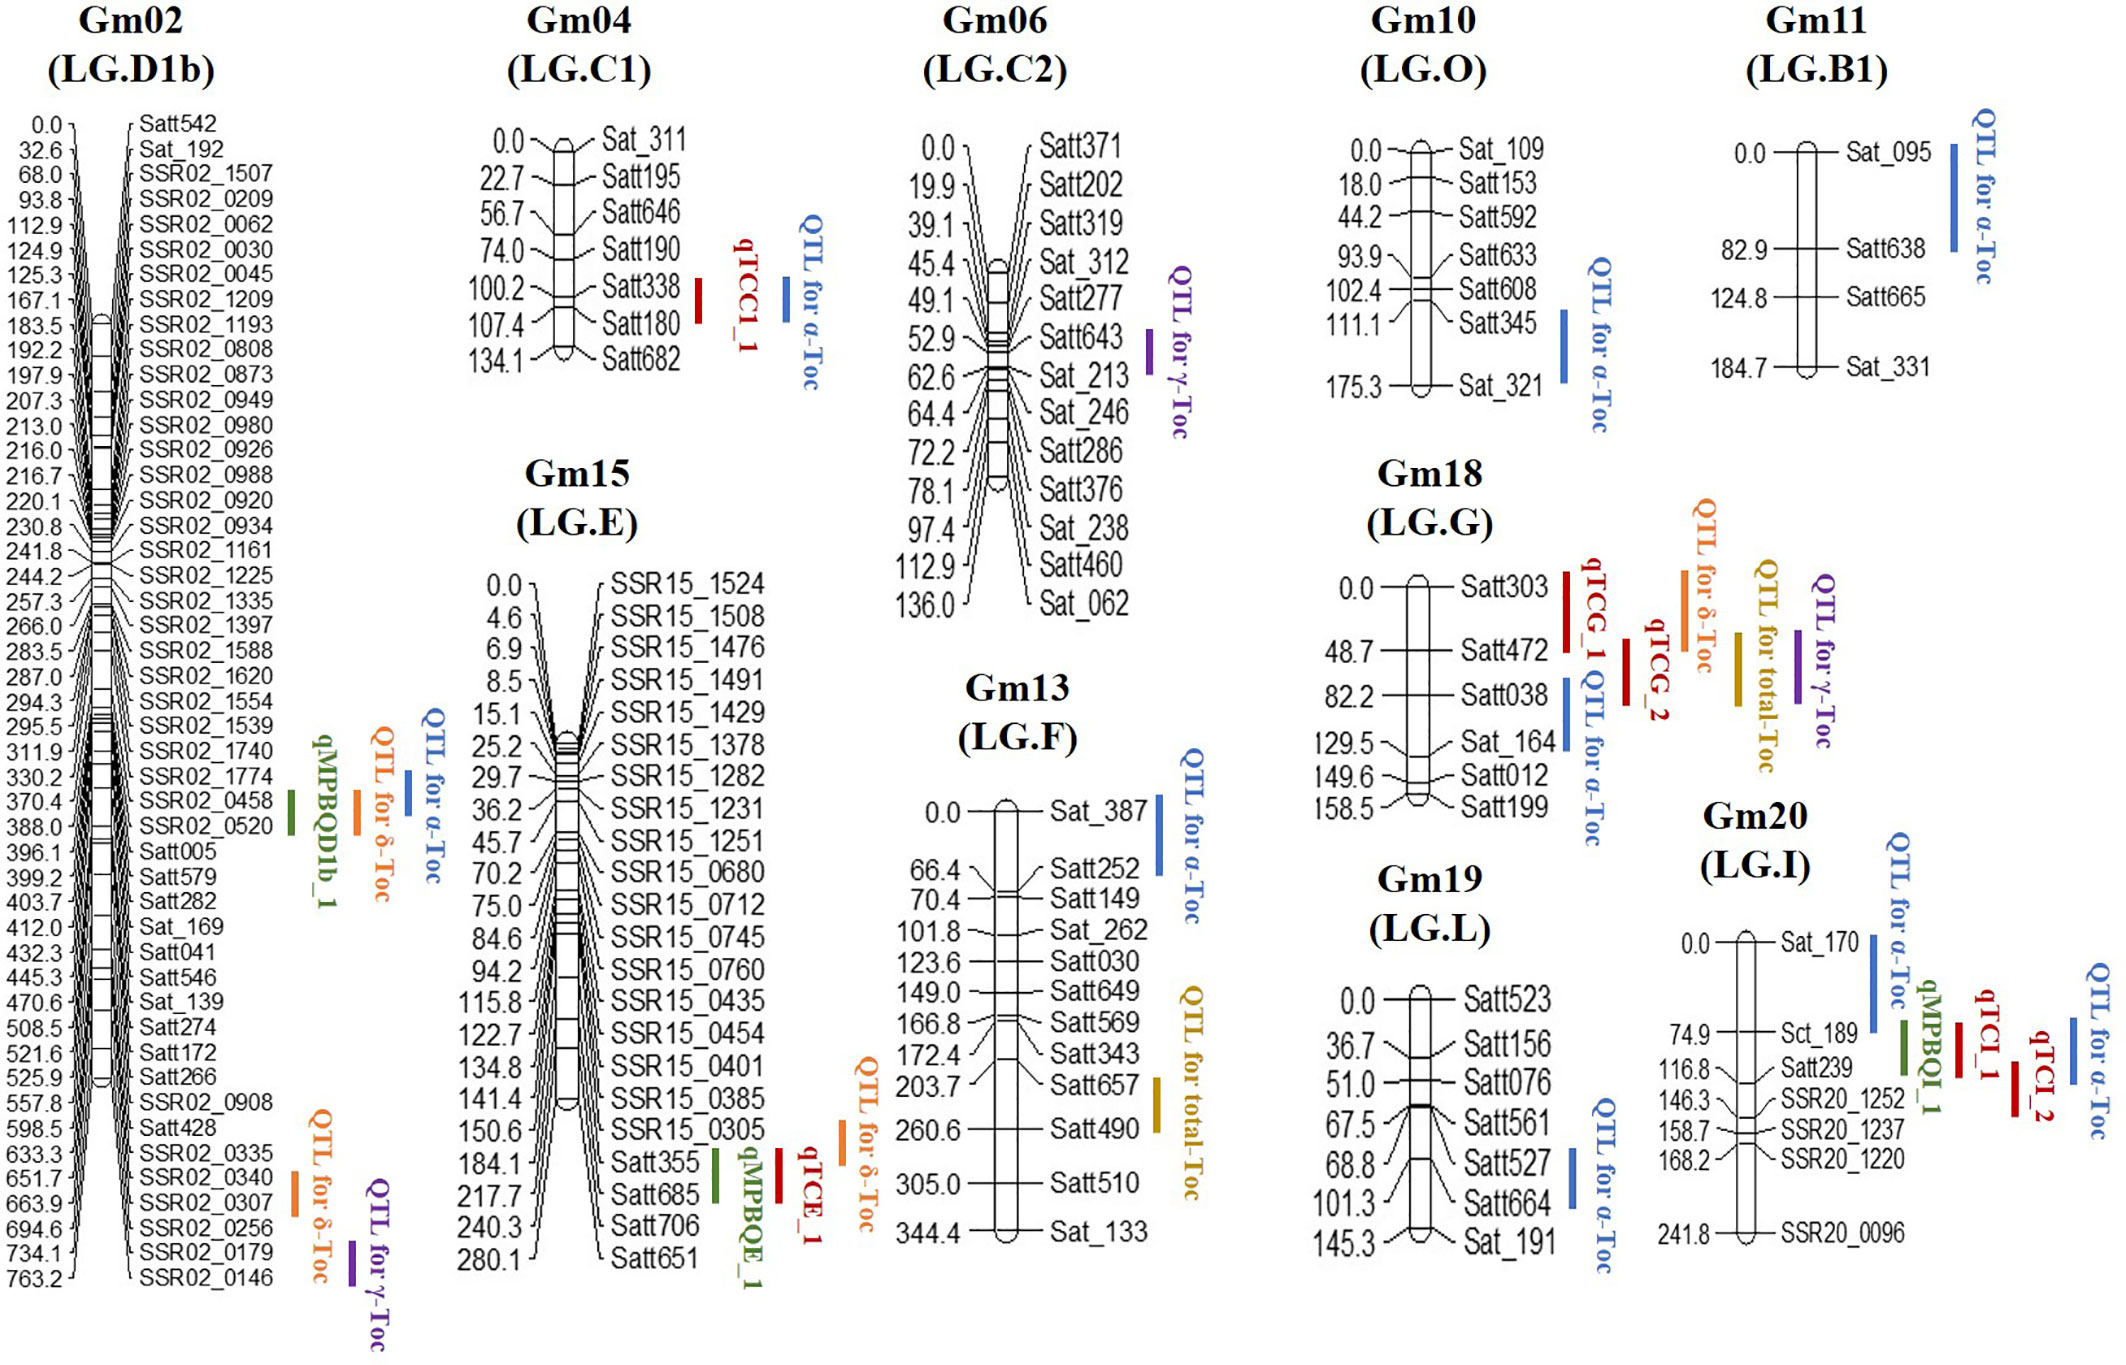
Figure 3 Summary of eQTL and QTL locations detected in the soybean genome.
Genome-Wide Association of Toc Concentration in Soybean Seeds
The average distance of LD decay was analyzed to describe the mapping resolution of GWAS. The mean LD decay of the panel was estimated as 223.2 kb when R2 dropped to 0.4 (Figure 4A). Principal component (PC) and kinship analyses were also conducted by the 22,611 SNPs. The first three PCs accounted for 12.83% of the overall genetic variation, and the inflection point occurred at PC3, which indicated that the first three PCs could dominate the population structure for the association mapping (Figures 4B, C). In addition, a lower level of genetic relatedness was found based on the distribution of the pairwise relative kinship coefficients among the 180 tested accessions (Figure 4D). Based on the CMLM model (Lipka et al., 2012), 19 SNP loci identified in at least two years were considered to be associated with individual or total Toc of soybean seeds. They distributed on ten different chromosomes (Chr.), including Chr.01, Chr.02, Chr.06, Chr.07, Chr.09, Chr.11, Chr.15, Chr.17, Chr.18, and Chr.20 (Figure S1 and Table 3). Among them, three QTNs located near the SNP markers of rs37703714 on Chr.17, rs33069111, and rs35562231 on Chr.20, were near the genomic region of known QTLs for Toc concentration. The other 16 QTNs were novel Toc-related loci (Table 3). Of these QTNs, 15 loci located on different genomic regions of nine chromosomes were identified to be associated with total Toc of soybean seeds. The numbers of the QTNs correlated with α-Toc, γ-Toc and δ-Toc were 2, 5, and 12, respectively. The allele effects of these identified QTNs showed that different alleles for each QTN could significantly affect the Toc content of the tested soybean samples (Table 3).
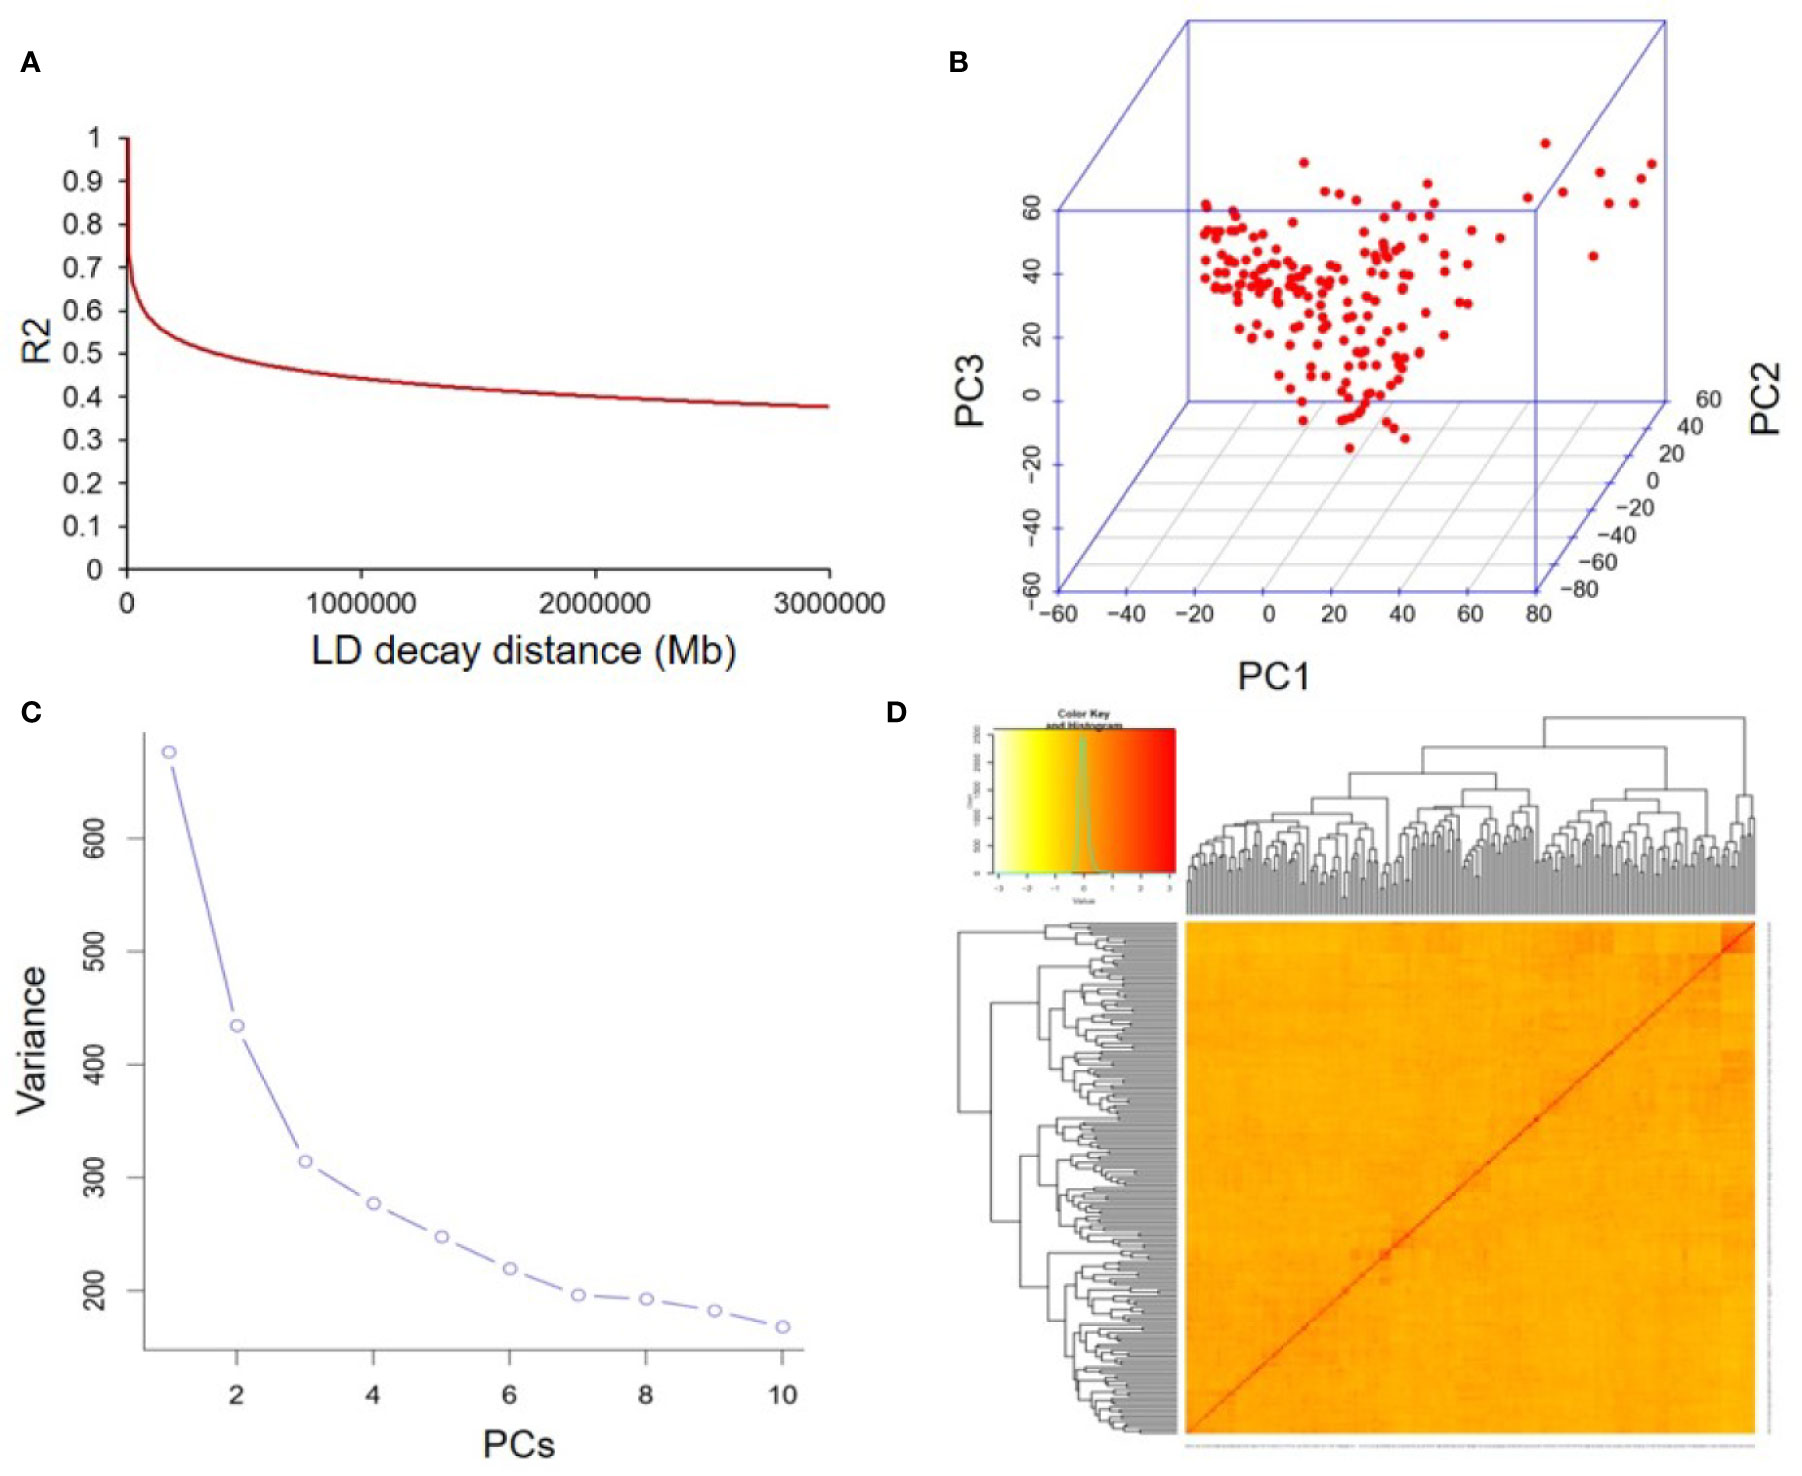
Figure 4 The linkage disequilibrium (LD), principal component, and kinship analyses of soybean genetic data. (A) The linkage disequilibrium (LD) decay of genome-wide association study (GWAS) population. (B) The first three principal components of the more than 20,000 SNPs used in the GWAS. (C) Population structure of soybean germplasm collection as reflected by principal components. (D) A heatmap of the kinship matrix of the 180 soybean accessions calculated from the same SNPs.
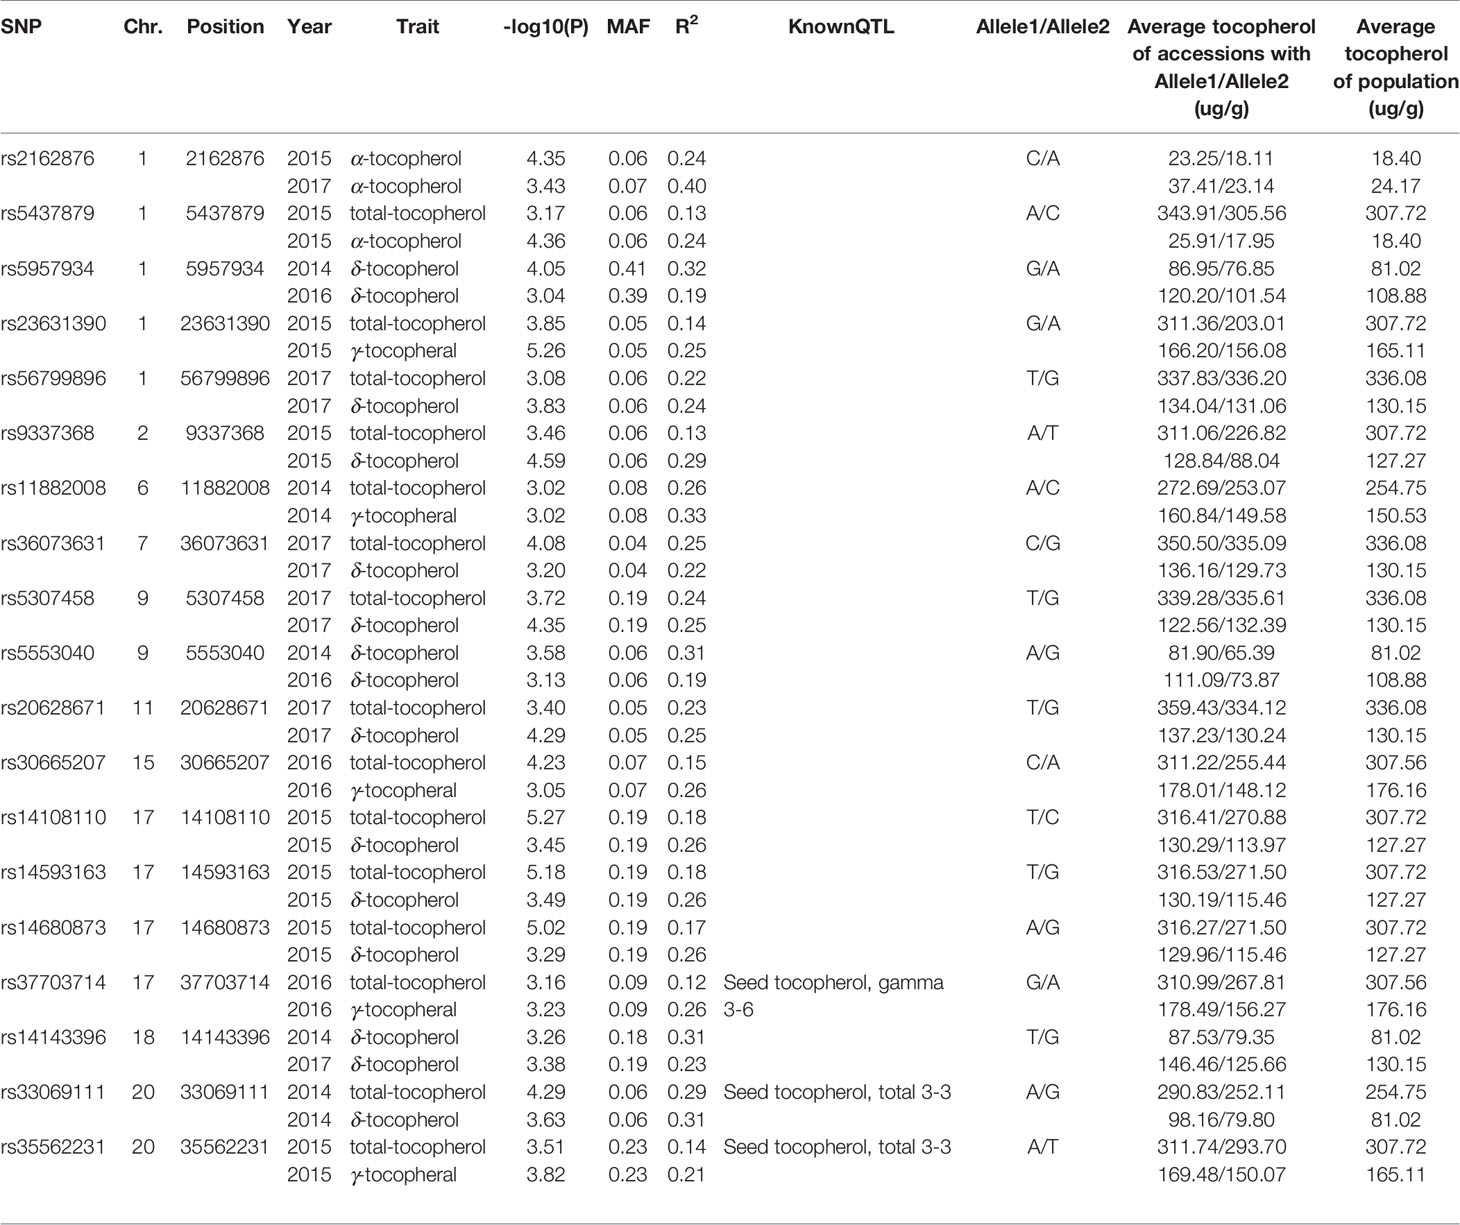
Table 3 All significant SNPs for tocopherol traits detected by GWAS.
Linkage Mapping for Soybean Seeds Toc Concentration
For the linkage analysis, 18 QTLs (α-Toc, nine QTLs; δ-Toc, four QTLs; γ-Toc, three QTLs; total Toc, two QTLs) mapped on ten different chromosomes were detected using the CIM method (Meng et al., 2015). The phenotypic variation (PVE) explained by these QTLs was analyzed with the value range of 0.60–17.97% (Table 4). Additionally, additive effects analysis for individual or total Toc content was also performed. As shown in Table 4, two QTLs located in the Satt303–Satt472 and Satt472–Satt038 interval on Chr.18 for δ-Toc and total-Toc showed a higher positive additive effect. In contrast, two QTLs located in the interval of SSR02_0458–SSR02_0520 on Chr.02 and Satt657–Satt490 on Chr.13 exhibited a higher negative additive effect for δ-Toc and total-Toc, respectively. To confirm the stable loci for the Toc concentration, an eQTL analysis was conducted based on the same SSR markers and the transcript abundance of the TGs (Table 5). Finally, nine eQTLs mapped on five different chromosomes (Chr.02, Chr.04, Chr.15, Chr.18, and Chr.20) were detected. Among these, qMPBQD1b_1 on Chr.02, qMPBQE_1 on Chr.15, and qMPBQI_1 on Chr.20 were associated with MPBQ transcript abundance and could account for 2.07, 6.53, and 7.15% of the phenotypic variation, respectively. The other six eQTLs (qTCC1_1, qTCE_1, qTCG_1, qTCG_2, qTCI_1, and qTCI_2) underlying TC transcript abundance could explain the phenotypic variations from 2.86 to 7.20%. Of them, qTCG_2 located in the interval of Satt472–Satt038 on Chr.18 showed a higher LOD score with the value of 6.18.
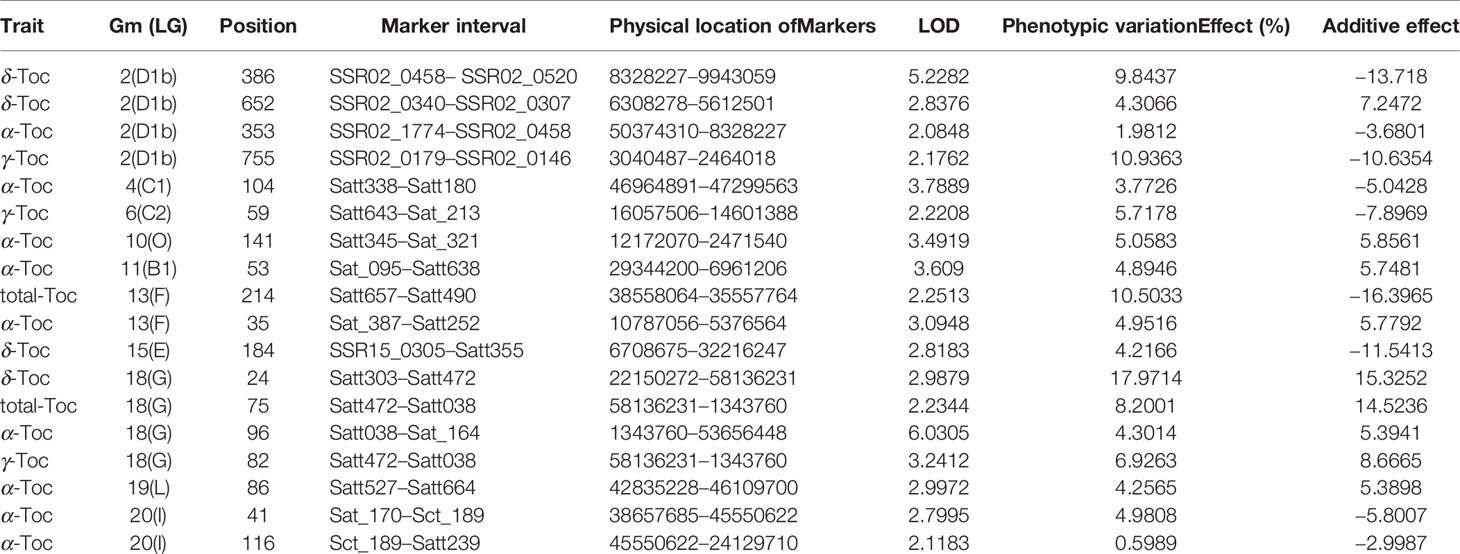
Table 4 QTL information mapped in RIL population.
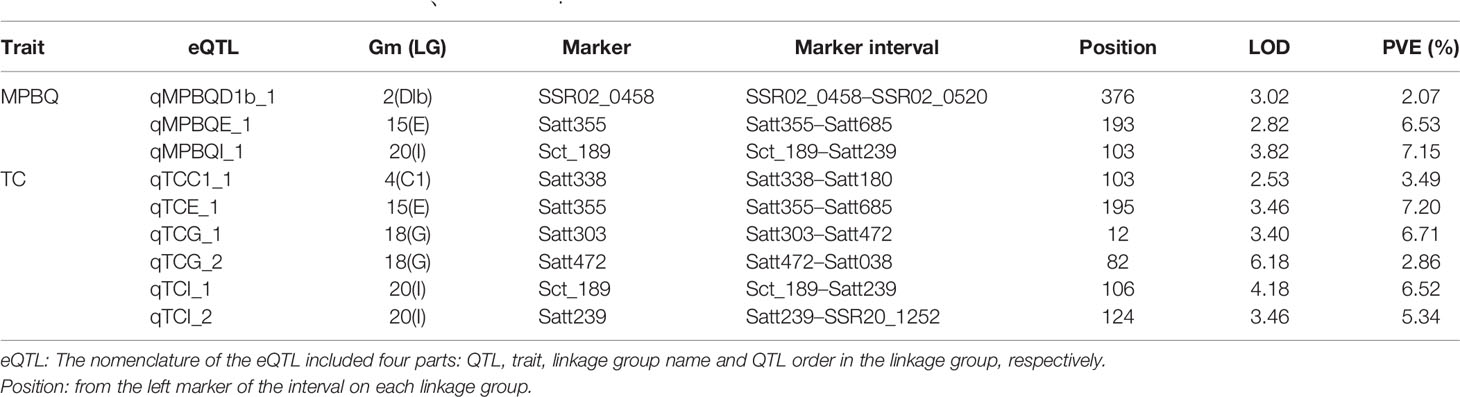
Table 5 The eQTLs for target genes of MPBQ、TC and HPT.
Analysis of the Candidate Genes Regulating Toc Concentration on Chr.02
For association analysis, a total of 177 candidate genes were screened in the 200-kbp flanking region of the identified nineteen QTNs (Table S4). Except for the seven genes with an unknown or uncharacterized protein domain, the other 170 candidates were classified and were mainly related to secondary metabolism, lipid metabolism, signaling, cell, protein synthesis/modification/degradation, and RNA regulation of transcription (Figure S2). Of these genes, some were directly or indirectly related to the tocopherol metabolism pathways. Glyma.18G115500 (located near QTN rs14143396 on Chr.18) was derived from the superfamily of NAD(P)-linked oxidoreductase. Two genes belonging to the zinc finger superfamily, including Glyma.01G021100 and Glyma.20G113200 located near QTN rs2162876 on Chr.01 and rs35562231 on Chr.20, respectively, might aid in the soybean Toc concentration with higher expressions in soybean seeds and pods (https://soybase.org/) (Park et al., 2019). Glyma.02G102900 is a protein containing plant U-box domain (PUB26), which triggers the accumulation of Toc content by regulating the transient burst of reactive oxygen species (ROS) (Kadota et al., 2014; Li et al., 2014; Stahl et al., 2019). Glyma.02G101300 (located near QTN rs9337368 on Chr.02), belonging to cytochrome b561/ferric reductase transmembrane protein family, participates in the regeneration of ascorbic acid; ascorbic acid-glutathione circulation is related to the regeneration of tocopherol phenolic groups, the oxidized form of tocopherol, and the results of the reaction of tocopherol with lipid peroxygen radicals (Kamal-Eldin and Appelqvist, 1996; Lane et al., 2015).
Based on the loci detected by GWAS, QTL, and eQTL analysis, a stable locus on Chr.02 was identified to be highly associated with Toc concentration in soybean seeds. Therefore, a total of 42 genes in the 200-kb flanking region of the QTL (located in the interval of SSR02_0458–SSR02_0520), eQTL (qMPBQD1b_1, located in the interval of SSR02_0458–SSR02_0520), and QTN (rs9337368) were considered as candidate genes (Table 6). To verify whether these candidates were associated with individual or total Toc, a candidate gene-based association was conducted. A total of 2,975 SNPs of 42 candidate genes were obtained from the genome re-sequencing of 20 soybean lines (10 higher/lower level of Toc concentration lines). Of them, 108 SNPs from 25 candidate genes were found reaching the threshold with −log10(P) ≥ 2. The stable SNPs detected in multiple years were picked out and considered to be significantly associated with Toc concentration; the genes containing these stable SNPs were then referred to the potential ones. Finally, a total of 11 SNPs from five potential genes (Glyma.02G098200 2 SNPs; Glyma.02G099800 2 SNPs; Glyma.02G100800 2 SNPs; Glyma.02G101300 2 SNPs; Glyma.02G102900 3 SNPs) were identified (Figure 5 and Table S5). For the haplotype analysis, at least two haplotypes existed for each of the five genes, and the individual or total Toc with these different haplotypes exhibited significant or highly significant differences (Figure 6).
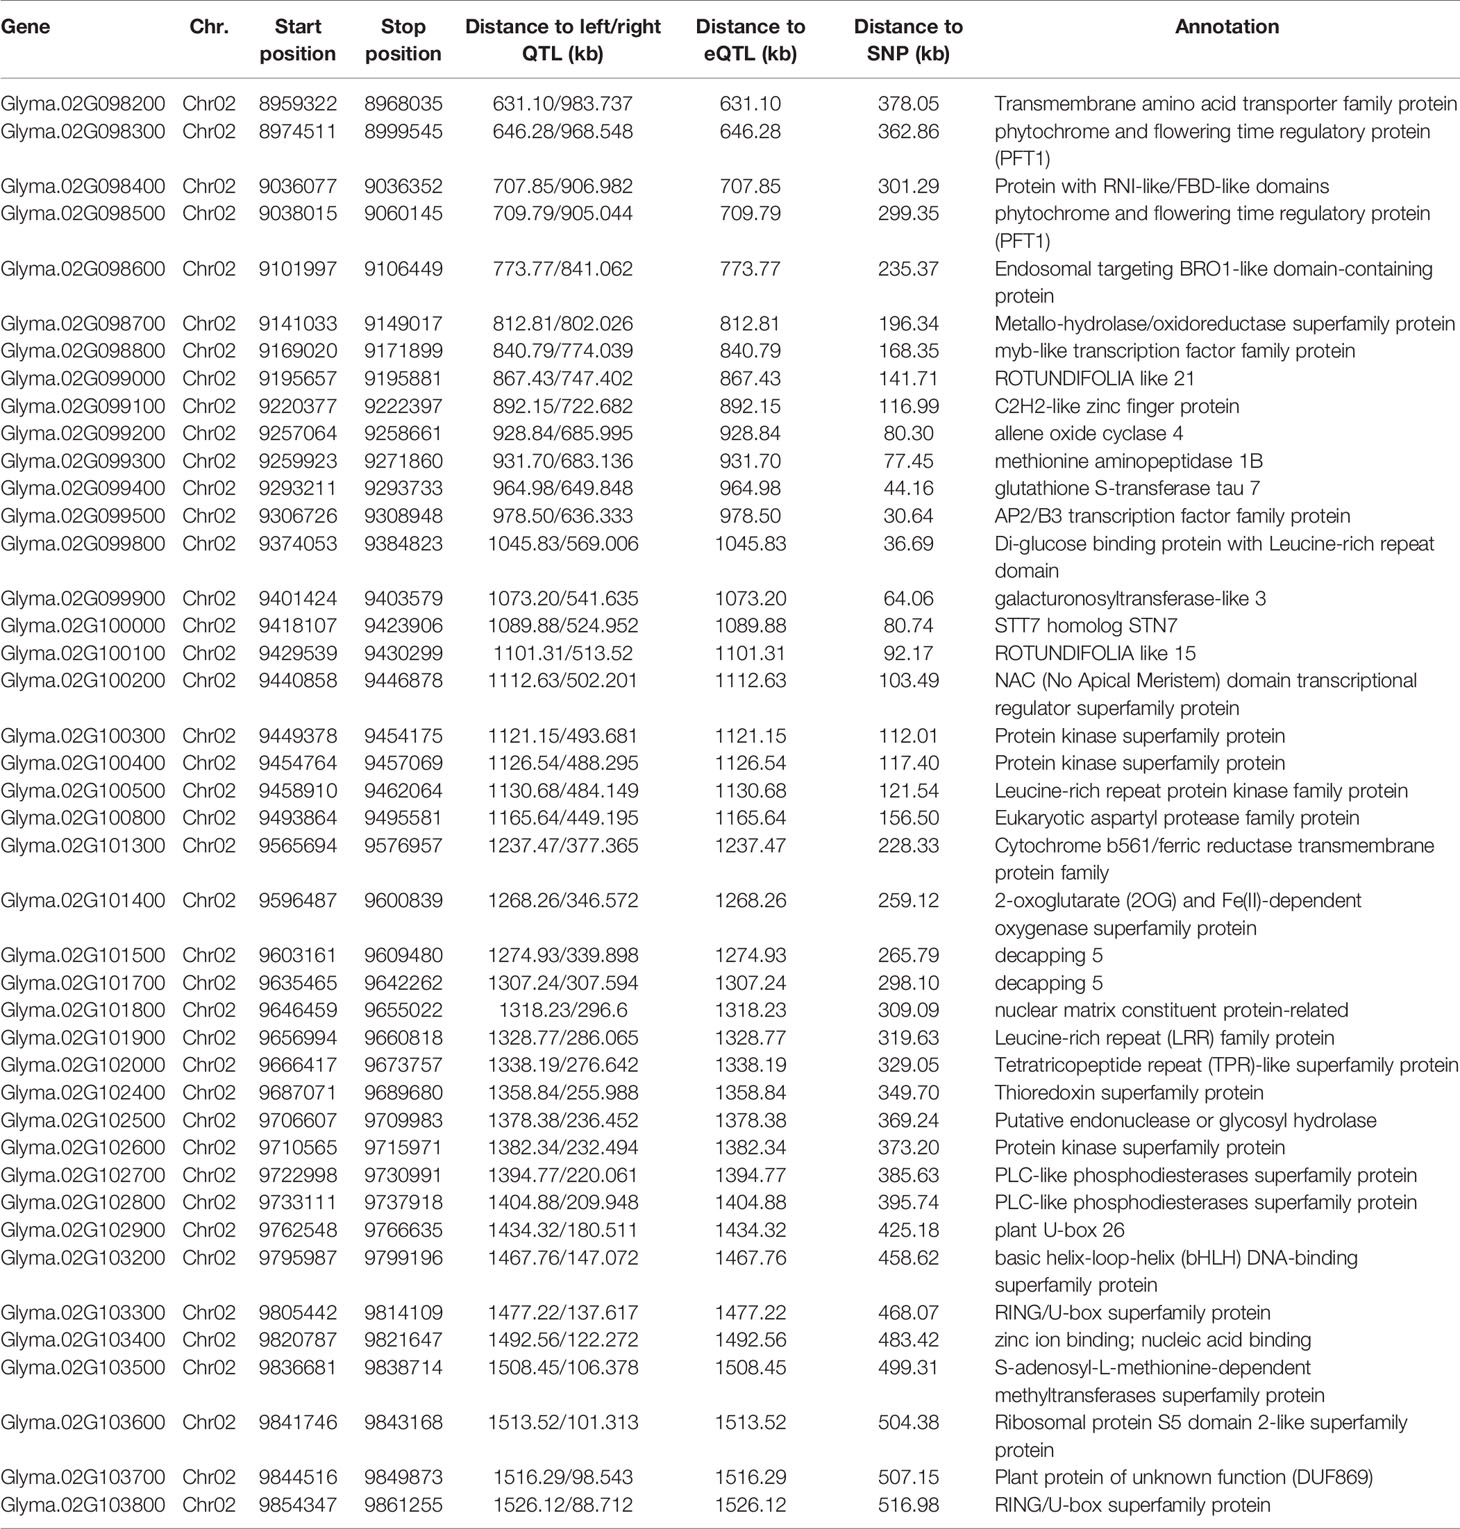
Table 6 Candidate genes in overlapping regions detected by QTL, eQTL, and GWAS.
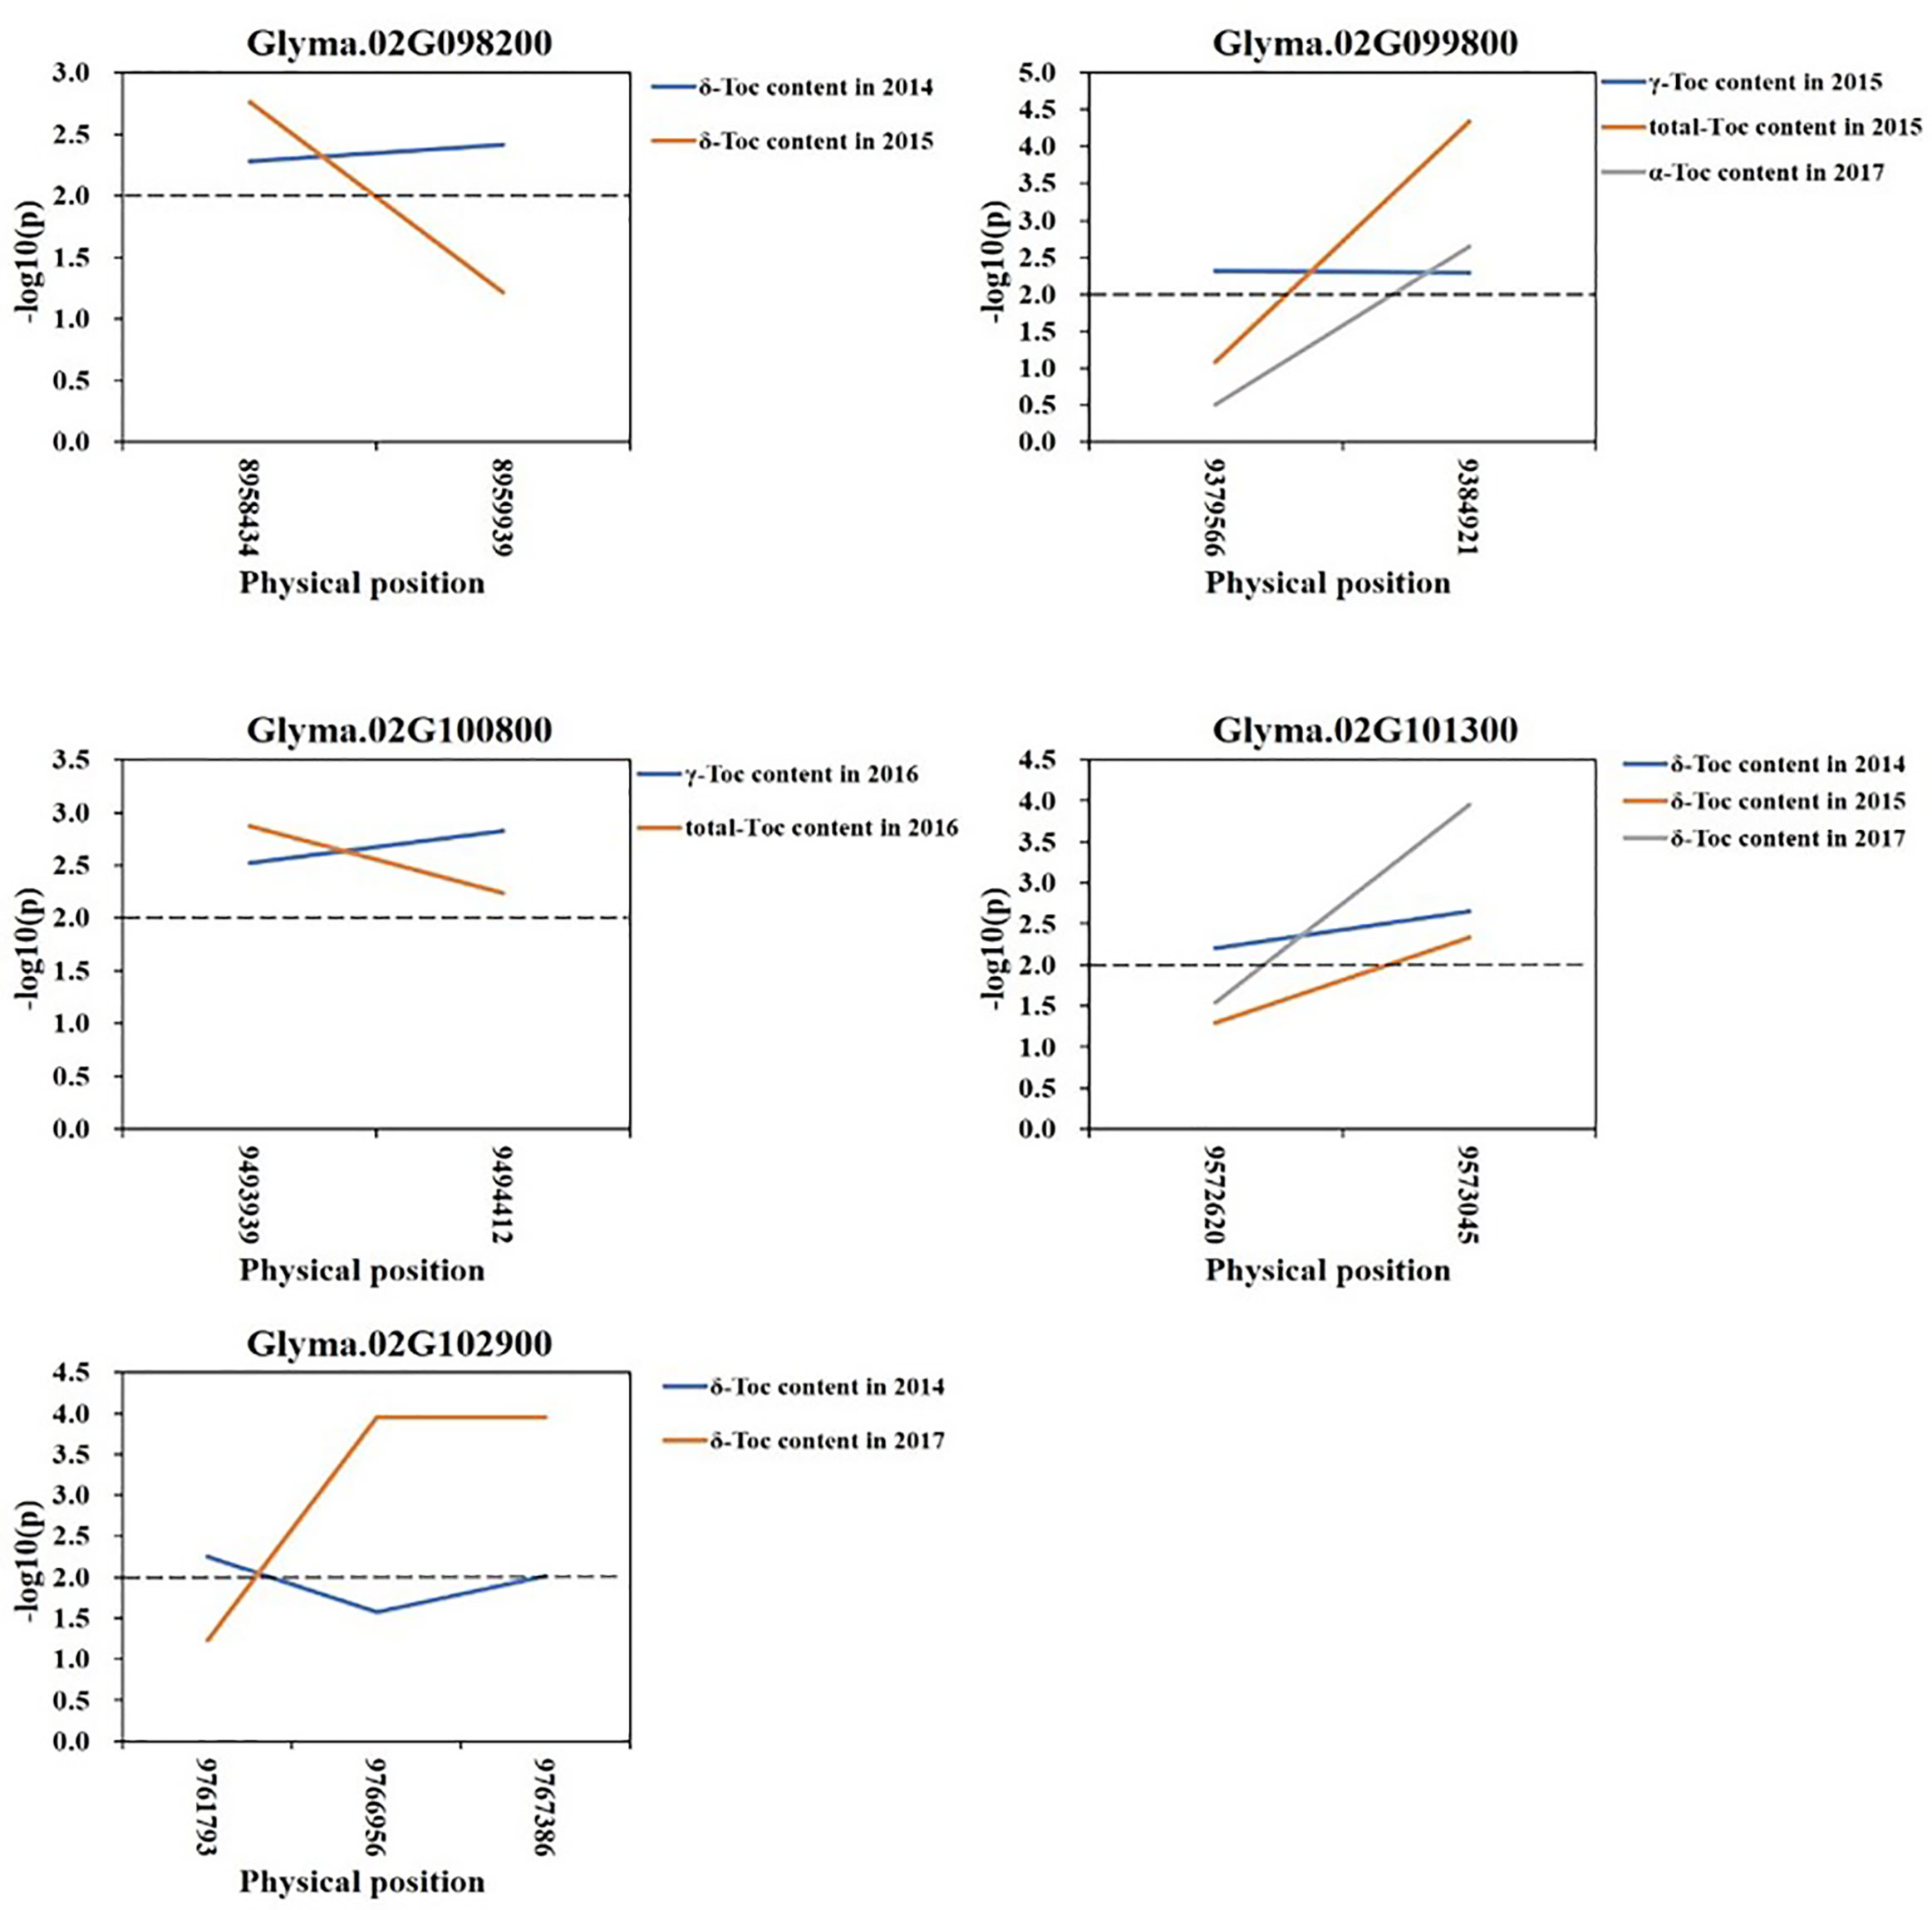
Figure 5 Candidate gene-based association. Gene-based association analysis of candidate genes with SNPs that were significantly correlated to tocopherol content. Horizontal line indicated that the threshold was set to 2.0.
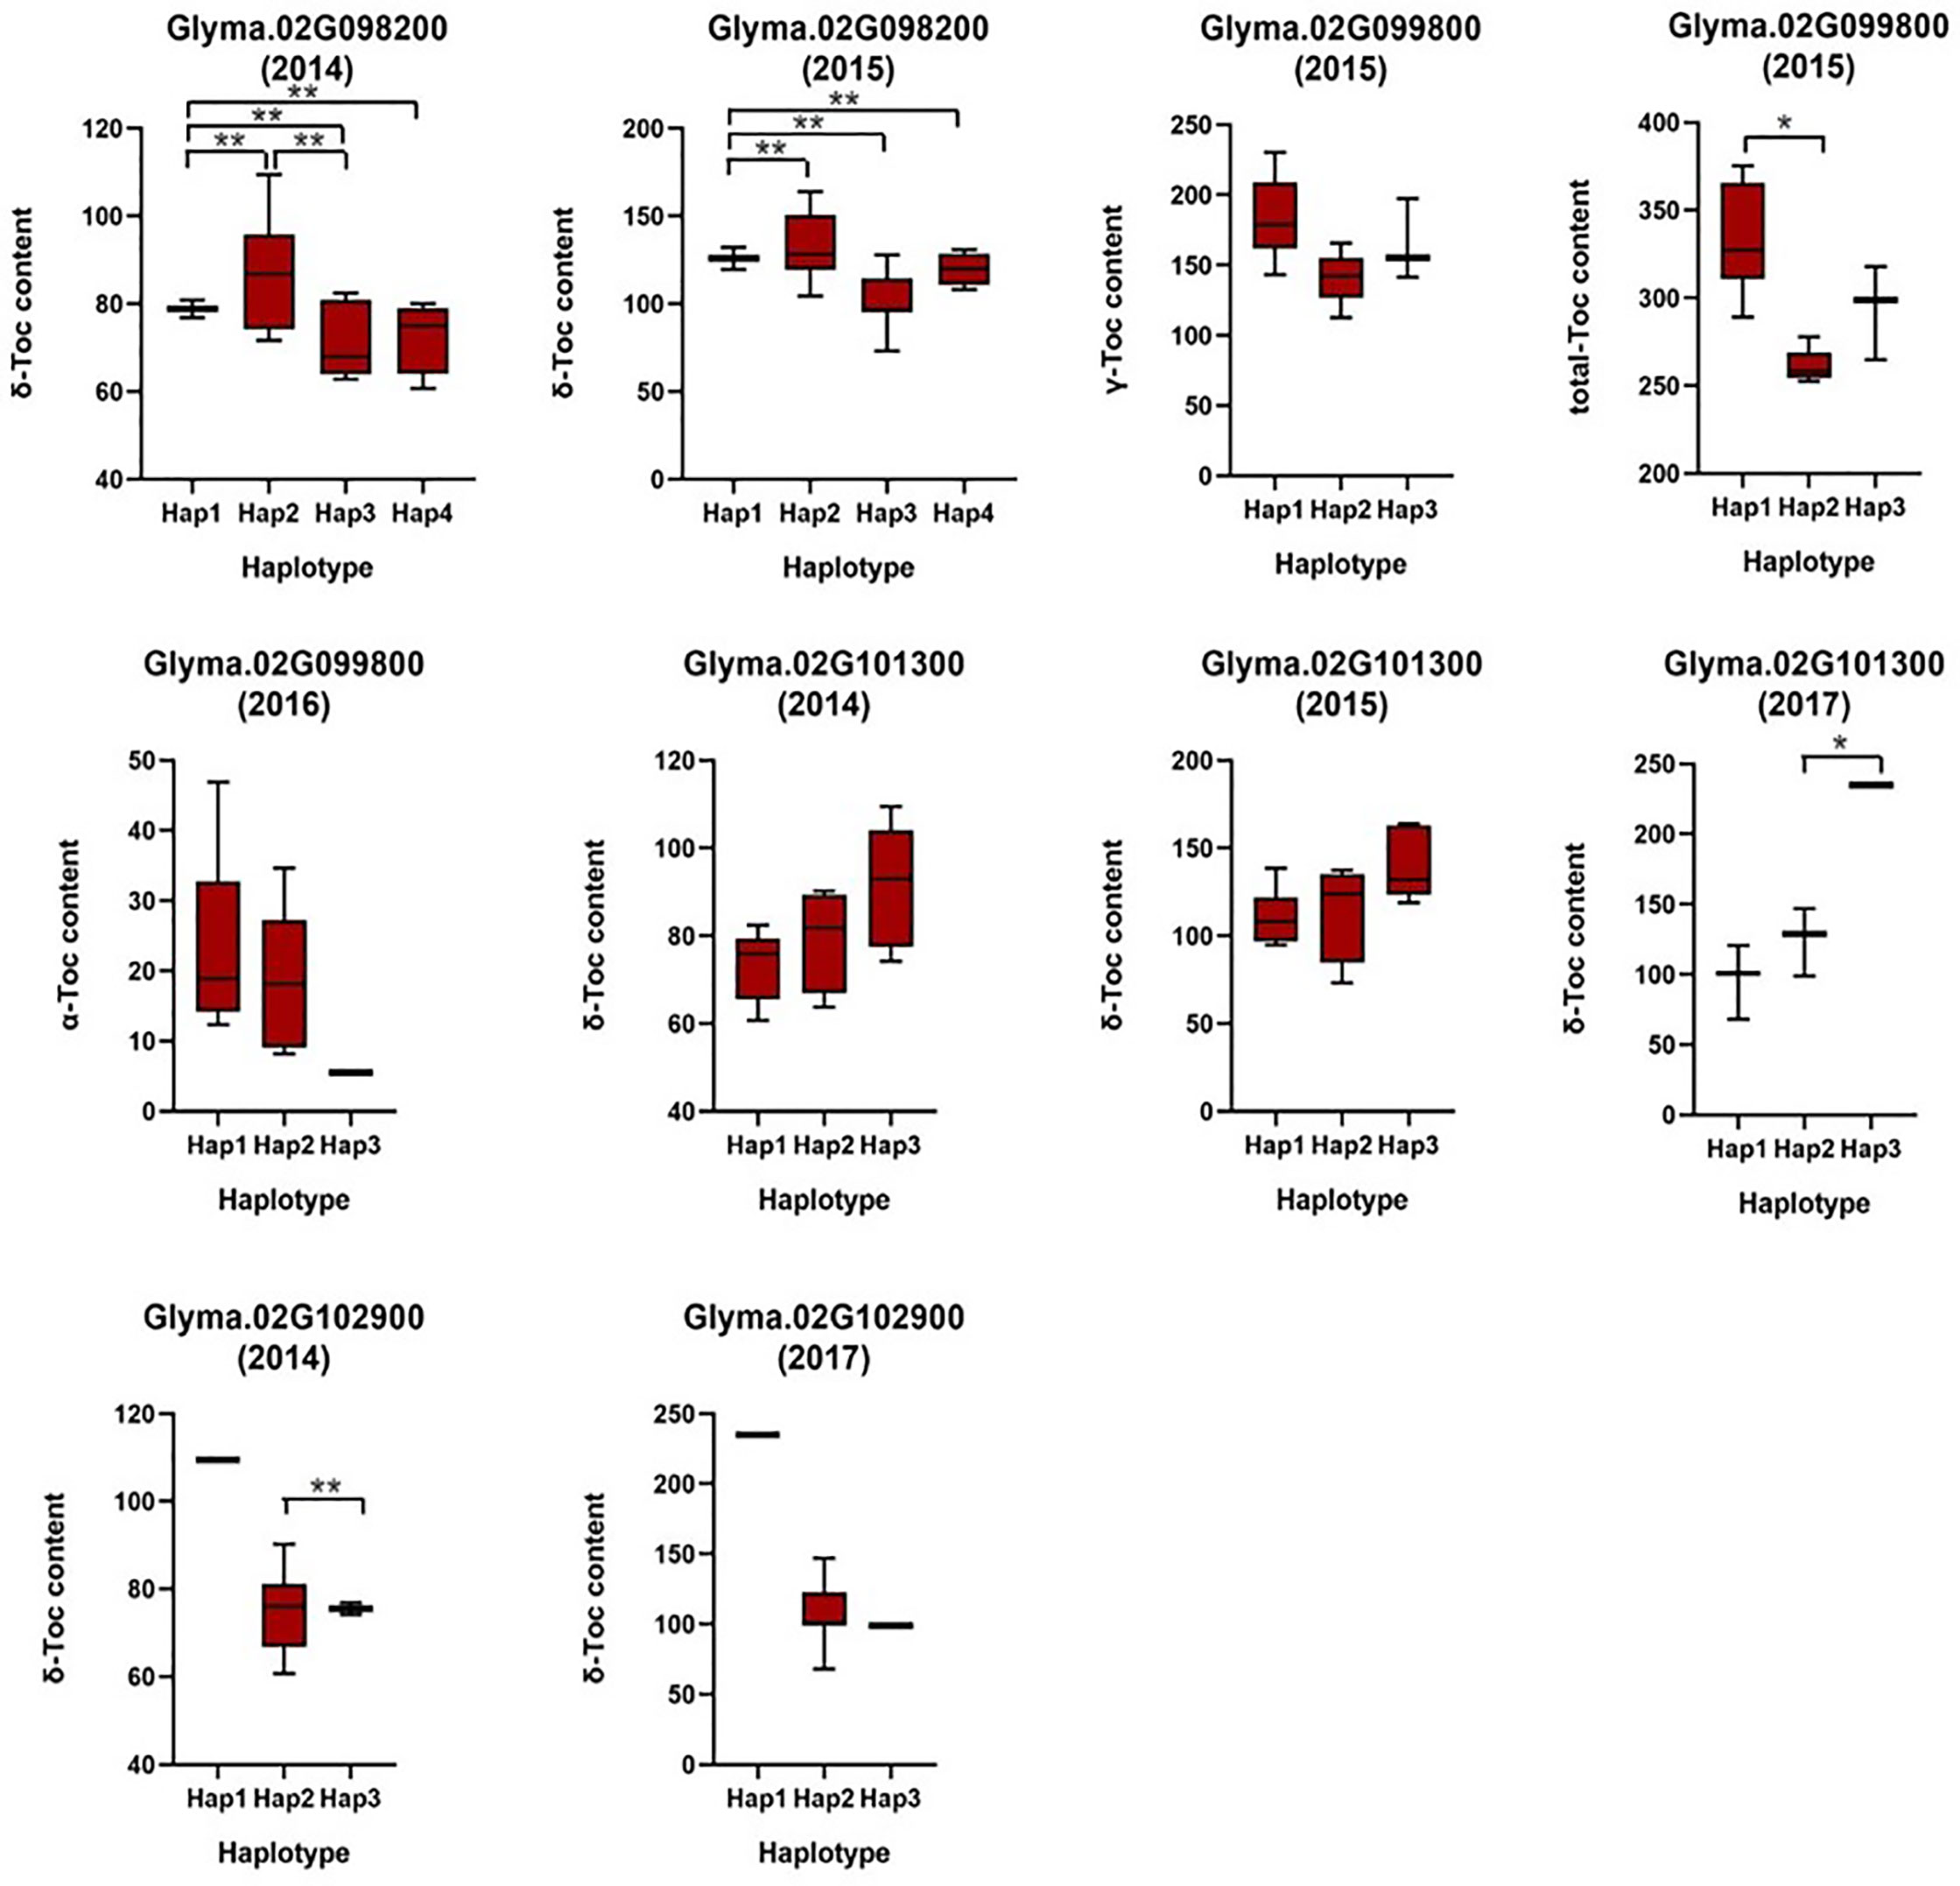
Figure 6 Haplotypes analysis of genes that related to tocopherol content. The * and ** was significance at p < 0.05 and p < 0.01, respectively.
To predict the potential role of candidate genes in the regulation of Toc content, pods from 16 characteristic soybean germplasms at development stages (R7) were selected to determine the content of δ-Toc, γ-Toc, α-Toc and total-Toc (Figure 7), and to analyze the expression levels of five potential genes. Of them, only Glyma.02g098200 was not expressed in immature soybean seeds, and the expression levels of the other four genes varied greatly among soybean germplasms (Figure 8). A statistical analysis for the expression levels of these five genes were conducted. The result showed that the expression levels of the five potential genes in 16 germplasms varied over a wide range and the expression levels among the lines with higher and lower tocopherol contents were different, including Glyma.02G099800 (Line 1 to Line 8 were from 4.53 to 7.52, Line 9 to Line 16 were from 3.16 to 5.63), Glyma.02G100800 (Line 1 to Line 8 were from 0.21 to 0.42, Line 9 to Line 16 were from 0.07 to 0.63), Glyma.02G102900 (Line 1 to Line 8 were from 0.17 to 0.75, Line 9 to Line 16 were from 0.05 to 0.13), Glyma.02G101300 (Line 1 to Line 8 were from 5.27 to 9.99, Line 9 to Line 16 were from 6.05 to 10.86). Among them, the range of the expression levels of Glyma.02G099800 and Glyma.02G102900 in higher Toc lines (Line 1 to Line 8) was much higher than those of lower Toc lines (Line 9 to Line 16) (Table S6). An analysis of Pearson’s correlation coefficient was performed to analyze the correlations between expression levels and tocopherol contents of the five potential genes. The results showed that the expression levels of Glyma.02G099800, Glyma.02G100800 and Glyma.02G102900 in pods were significantly correlated with total Toc content or its components, and Glyma.02G101300 showed no significant correlation with Toc content (Table S7). Among them, the expression level of Glyma.02G099800 showed significantly positive correlation (P < 0.05) with the γ-Toc content and total Toc content in soybean seeds among tested germplasms. The expression level of Glyma.02G100800 showed significantly positive correlation (P < 0.05) with the content of δ-Toc and showed the opposite correlation with α-Toc content. In addition, the expression level of Glyma.02G102900 was significantly positively correlated with δ-Toc content (P < 0.01) and total-Toc content (P < 0.05) (Table S7). These genes with beneficial haplotypes would be of great value in regulating individual and total Toc concentration of soybean seeds.
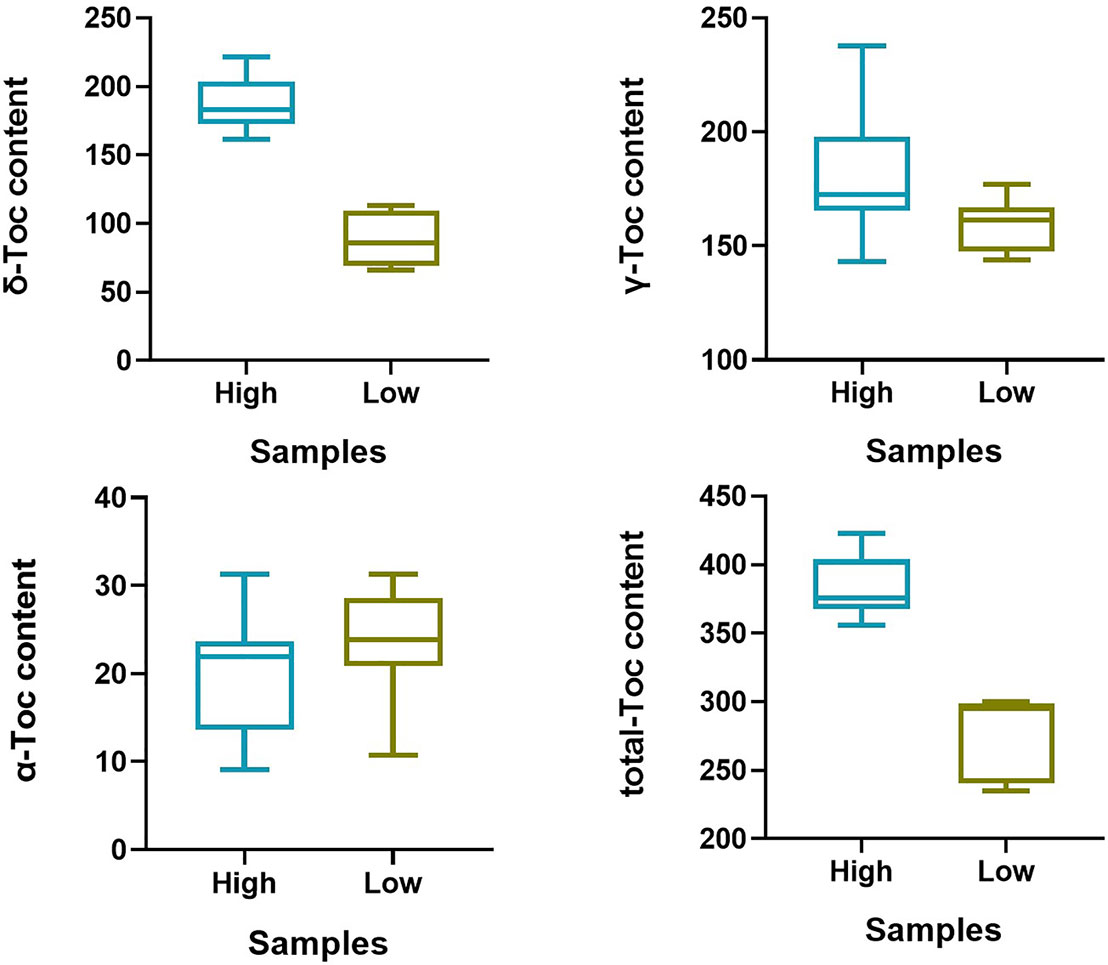
Figure 7 Tocopherol content of 16 germplasms at R7 growth period. “High” represent the higher accessions (Line 1–Line 8), “Low” represent the lower accessions (Line 9–Line 16).
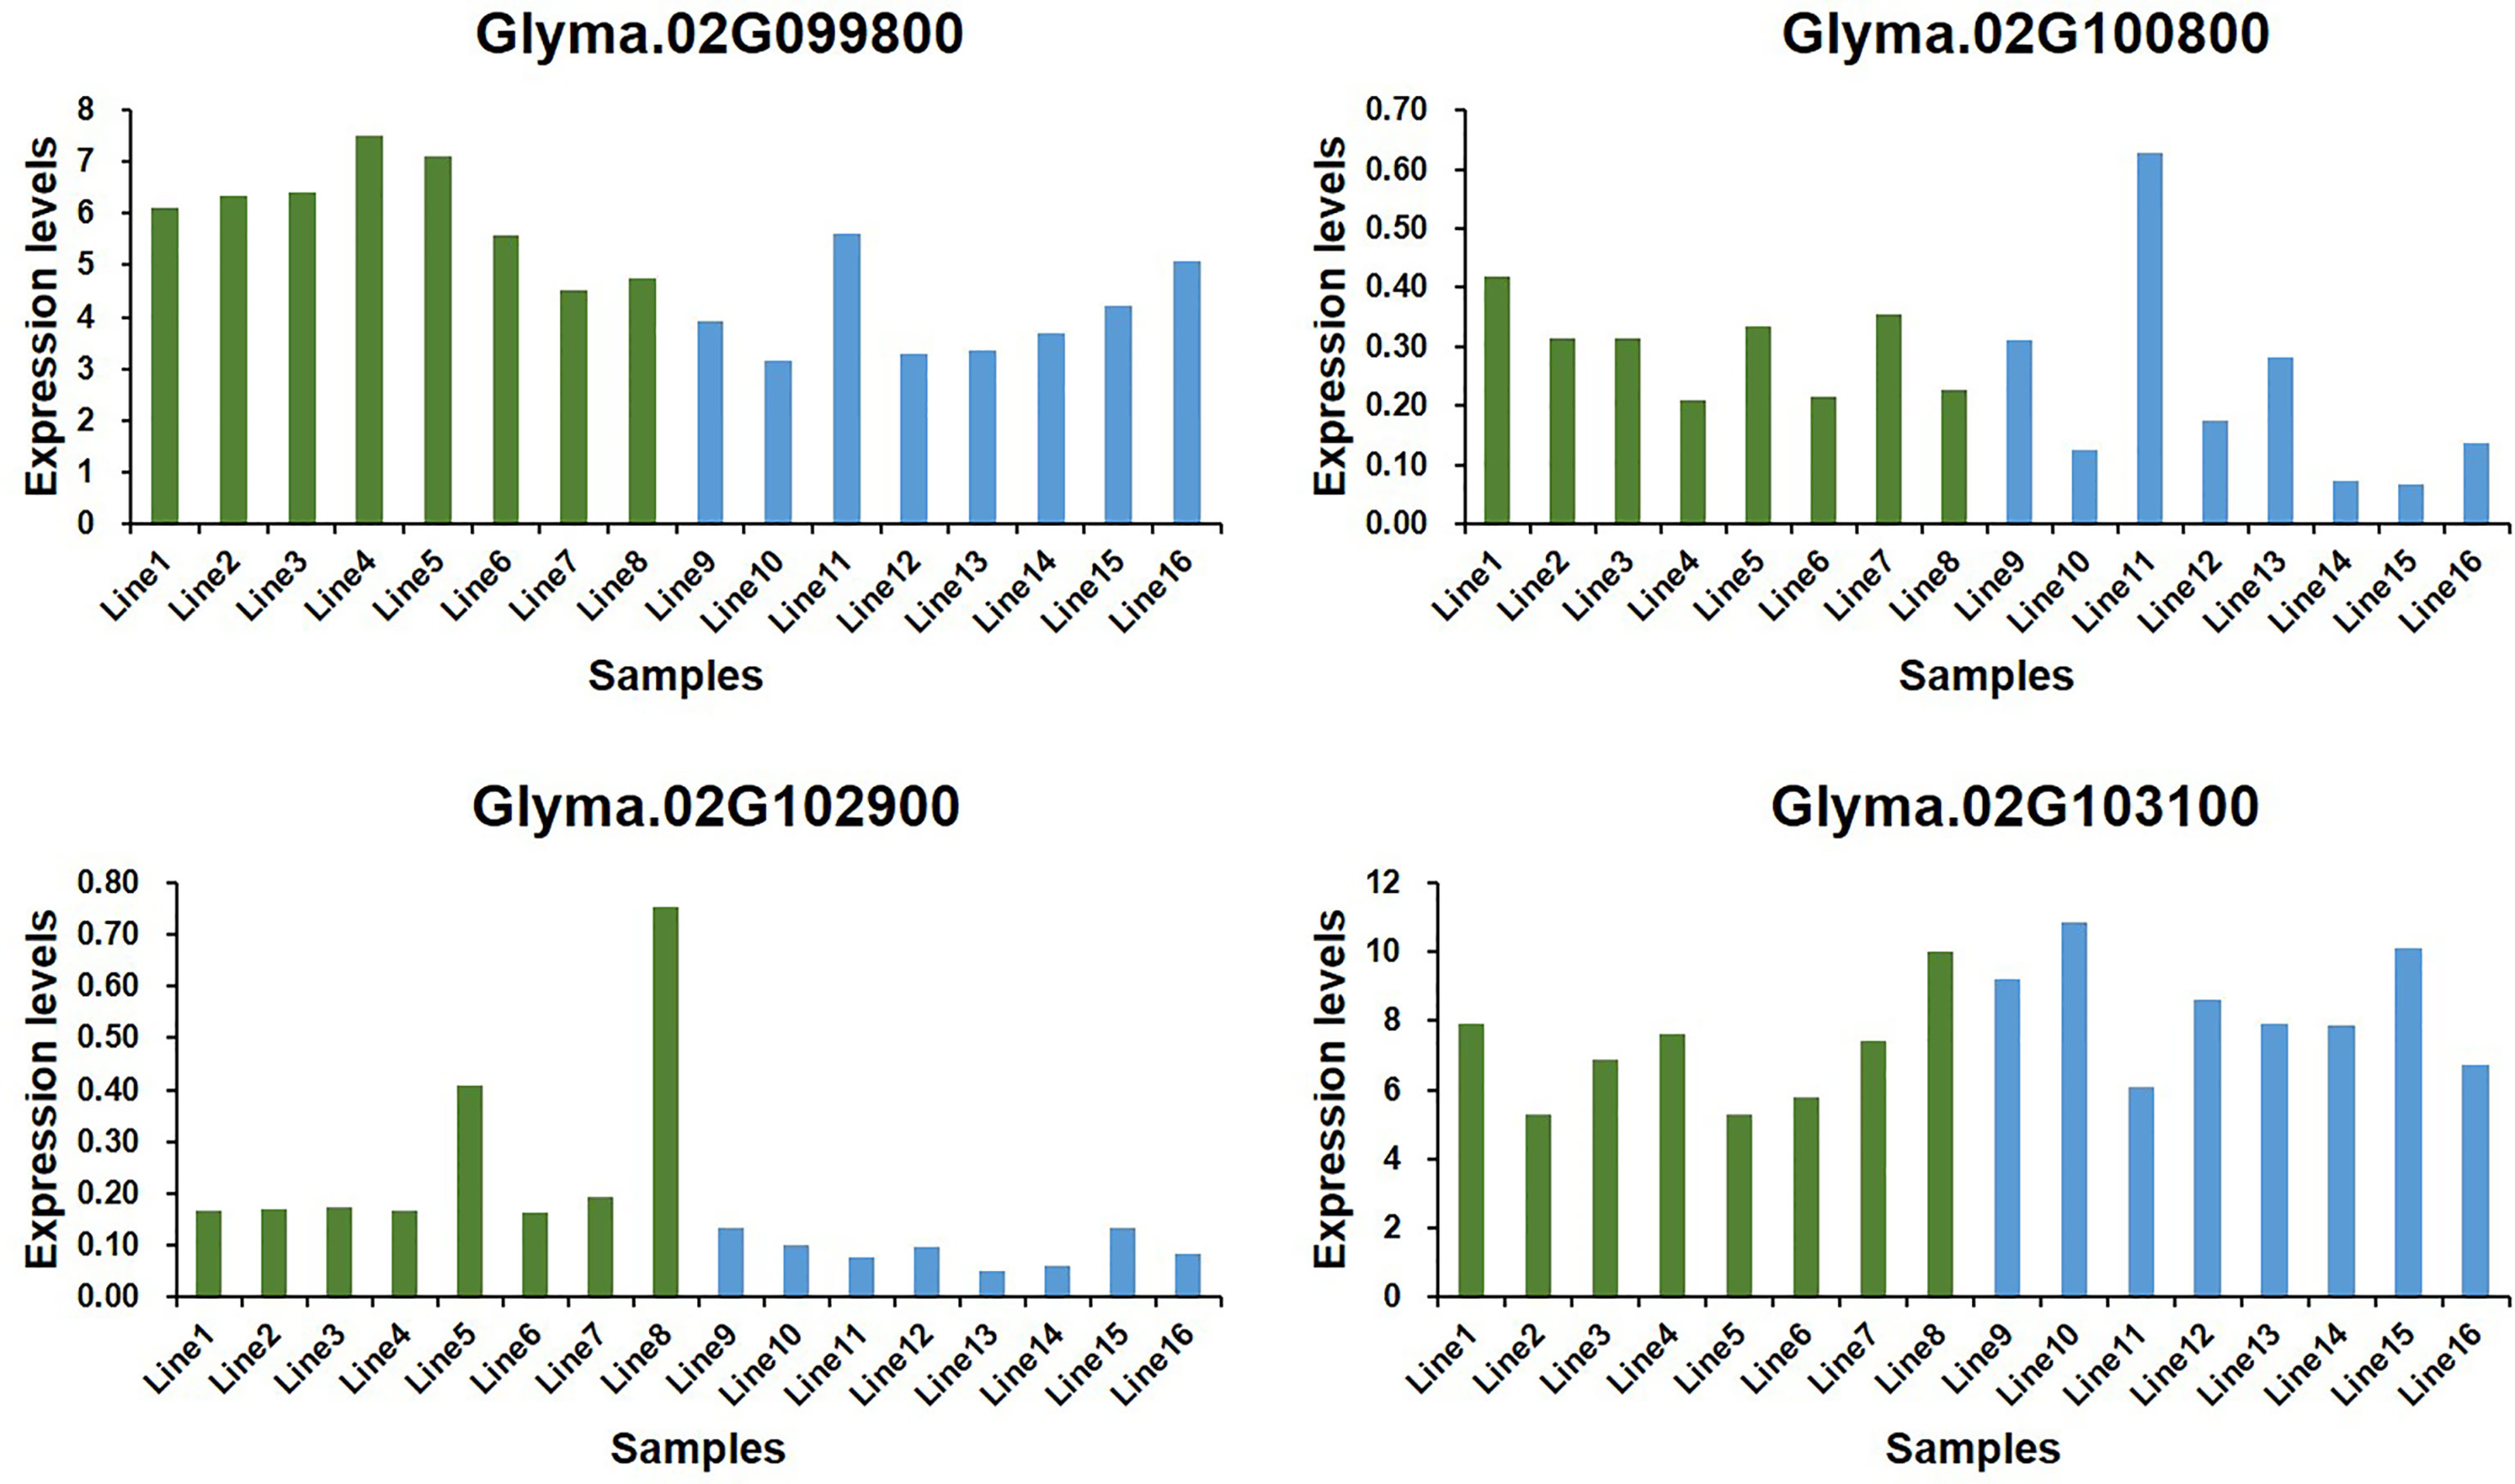
Figure 8 Expression levels of candidate genes in 16 soybean germplasms at R7 growth period.
Discussion
Toc compounds, belonging to the vitamin E family, are lipophilic antioxidants that are beneficial to human health because they can prevent the oxidation of unsaturated fatty acids (Shaw et al., 2016). Compared to other oil crops, soybean oil contains a higher total Toc concentration with the dominant form being γ-Toc, which comprises 70% of the total Toc content. The vitamin E activity of γ-Toc is only moderate due to its lower affinity with the hepatic tocopherol transfer protein. The α-Toc, with a lower content in oil, has the highest activity (Bramley et al., 2000). Therefore, increasing the α-Toc and total Toc content in soybean seeds is important. In this four-year study, a germplasm collection of 180 soybean accessions in Harbin was used for measuring individual and total Toc content. Toc levels had a wide range of variation among the different accessions but a relatively smaller range of variation among the different years. The test samples containing a higher level of α-Toc and total Toc might be the useful sources for the breeding of new soybean cultivars.
Nearly thirty QTLs have been identified associated with individual or total Toc via different mapping populations, and most of these are specific to the genetic background (www.soybase.org). Li et al. (2010) detected four, eight, four, and five QTLs related to α-Toc, γ-Toc, δ-Toc, and total Toc from “OAC Bayfield,” respectively. Shaw et al. (2017) identified 26 SSR markers linked to QTL with individual and total Toc content from the cross of ‘OAC Bayfield’ and ‘OAC Shire.’ In the present study, 18 QTLs mapped to 10 chromosomes and nine eQTLs on five different chromosomes were associated with individual and total Toc content through linkage mapping. Additionally, a GWAS for Toc-related was also performed, and 19 stable QTNs detected in more than two years were identified. Among these QTNs, 16 loci were regarded as novel for soybean Toc, and the other three contained similar genomic regions known as QTLs for Toc concentration reported by Shaw et al. (2017). The rs37703714 on Chr.17 and rs33069111 and rs35562231 on Chr.20 were close to “Seed tocopherol, gamma 3-6” and “Seed tocopherol, total 3-3,” respectively, which were detected between the SSR markers of “Sat_354–Satt135” and “Satt270–BARC-041717-08071” using the “OAC Bayfield × OAC Shire” mapping population. The allele effects in these identified QTNs were evaluated, and the results showed that these alleles occurred on diverse soybean accessions. The soybean accessions with the “beneficial” allele in these identified QTNs had a higher individual or total Toc concentration than accessions with the “inferior” allele. Thus, these QTNs, exhibiting more potential in manipulating individual or total Toc, might be useful for MAS.
Few definite genes associated with individual or total Toc have been characterized or cloned, except for the genes encoding the key enzymes involved in Toc metabolism. For accurately screening candidate genes, a total of 42 genes in the 200-kb flanking region of the locus on Chr.02 co-detected by QTL, eQTL, and GWAS analysis were selected and classified into different functional groups using the Gene Ontology database (http://geneontology.org/). Using a gene-based association by the GLM method, five genes (Glyma.02G098200, Glyma.02G099800, Glyma.02G100800, Glyma.02G101300, and Glyma.02G102900) were determined to be significantly related to α-Toc, γ-Toc, δ-Toc and total Toc in soybean seeds. Further expression level analysis of these five genes showed that the expression levels of Glyma.02G099800 and Glyma.02G102900 were significantly correlated with Toc content in soybean seeds, which might regulate Toc content. Glyma.02G102900 is a plant U-box domain-containing protein (PUB26), as an E3 ligase, which targets BIK1 for degradation and negatively regulates BIK1-mediated immunity. BIK1 is of central importance to the plant immune system, and it regulates transient bursts of reactive oxygen species (ROS) (Kadota et al., 2014; Li et al., 2014). ROS has a triggering function in the pathogen-inducible biosynthesis of tocopherols; the elevated ROS can trigger the accumulation of Toc content (Stahl et al., 2019). Glyma.02G099800, belonging to Di-glucose binding protein with Leucine-rich repeat domain, is a Receptor-like kinase (RLK). RLKs mediate a large amount of signal transmission information on the cell surface and acts as a crucial regulator in the development process (Afzal et al., 2008; Gish and Clark, 2011). The role of this gene in Toc metabolism needs to be further explored. Additional studies on the functions and mechanisms of these candidate genes are planned.
Data Availability Statement
All datasets generated for this study are included in the article/Supplementary Material.
Author Contributions
MS, YJ, and HL conceived the study and contributed to population development. YZ and HZ contributed to genotyping. JL and WT contributed to phenotypic evaluation. LQ, WL, XZ, and YH contributed to experimental design and writing the paper. All authors contributed to the article and approved the submitted version.
Funding
This study was financially supported by the Heilongjiang Provincial Project (GJ2018GJ0098, JC2018007, GX17B002, C2018016), the National Key R & D Project (2017YFD0101306, 2016YFD0100304, 2017YFD0101302), the Chinese National Natural Science Foundation (31701446,31671717, 31471517, 31971967, 31871650), the National Project (2014BAD22B01, 2016ZX08004001-007), the Youth Leading Talent Project of the Ministry of Science and Technology in China (2015RA228), The National Ten-thousand Talents Program, Postdoctoral Fund in Heilongjiang Province (LBH-Z15017, LBH-Q17015), The national project (CARS-04-PS04), The ‘Youth Innovation Talent’ Project of the general undergraduate universities in Heilongjiang province (UNPYSCT-2016145), the ‘Academic Backbone’ Project of Northeast Agricultural University (17XG22), Student Innovation Practical Training (SIPT). The funding bodies had no role in study design, data collection and analysis, decision to publish, or preparation of the manuscript.
Conflict of Interest
HZ was employed by the company Biomarker Technologies Corporation.
The remaining authors declare that the research was conducted in the absence of any commercial or financial relationships that could be construed as a potential conflict of interest.
Acknowledgments
This study was conducted in the Key Laboratory of Soybean Biology of the Chinese Education Ministry, Soybean Research & Development Center (CARS) and the Key Laboratory of Northeastern Soybean Biology and Breeding/Genetics of the Chinese Agriculture Ministry.
Supplementary Material
The Supplementary Material for this article can be found online at: https://www.frontiersin.org/articles/10.3389/fpls.2020.539460/full#supplementary-material
Supplementary Figure S1 | Manhattan plot of association mapping of the tocopherol content in soybean.
Supplementary Figure S2 | Functional classifications of the candidate genes of tocopherol content in soybean.
Supplementary Table S1 | The information of 180 soybean accessions.
Supplementary Table S2 | PCR primers used for expression analysis by RT-qPCR.
Supplementary Table S3 | Information of SSR markers among RILs.
Supplementary Table S4 | Gene models in the flanking regions of peak SNP by GWAS.
Supplementary Table S5 | Haplotype analysis of candidate genes.
Supplementary Table S6 | Basic genetic parameter statistics for expression levels of genes.
Supplementary Table S7 | Correlation analysis of tocopherol contents with expression levels of genes.
References
Afzal, A. J., Wood, A. J., Lightfoot, D. A. (2008). Plant receptor-like serine threonine kinases: roles in signaling and plant defense. Mol. Plant Microbe 21 (5), 507–517. doi: 10.1094/MPMI-21-5-0507
Bradbury, P. J., Zhang, Z., Kroon, D. E., Casstevens, T. M., Ramdoss, Y., Buckler, E. S. (2007). TASSEL: software for association mapping of complex traits in diverse samples. Bioinformatics 23 (19), 2633–2635. doi: 10.1093/bioinformatics/btm308
Bramley, P. M., Elmadfa, I., Kafatos, A., Kelly, F. J., Manios, Y., Roxborough, H. E., et al. (2000). Vitamin E. J. Sci. Food Agric. 80 (7), 913–938. doi: 10.1002/(SICI)1097-0010(20000515)80:7<913::AID-JSFA600>3.0.CO;2-
Chaubey, Y. P., Westfall, P. H., Young, S. S. (1993). Resampling-based multiple testing: examples and methods for p-value adjustment. Technometrics 35 (4), 450. doi: 10.2307/1270279
Cheng, Y., Ma, Q., Ren, H., Xia, Q., Song, E., Tan, Z., et al. (2017). Fine mapping of a Phytophthora-resistance gene RpsWY in soybean (Glycine max L.) by high-throughput genome-wide sequencing. Theor. Appl. Genet. 130 (5), 1041–1051. doi: 10.1007/s00122-017-2869-5
Cregan, P. B., Jarvik, T., Bush, A. L., Shoemaker, R. C., Lark, K. G., Kahler, A. L., et al. (1999). An integrated genetic linkage map of the soybean genome. Crop Sci. 39, 1464–1490. doi: 10.2135/cropsci1999.3951464x
Dwiyanti, M. S., Ujiie, A., Thuy, L. T. B., Yamada, T., Kitamura, K. (2007). Genetic analysis of high a-tocopherol content in soybean seeds. J. Breed. Sci. 57, 23–28. doi: 10.1270/jsbbs.57.23
Gish, L. A., Clark, S. E. (2011). The RLK/Pelle family of kinases. Plant J. 66 (1), 117–127. doi: 10.1111/j.1365-313X.2011.04518.x
Guan, R. X., Qin, J., Hu, J. S., Chen, W. X., Chang, R. Z., Liu, Z. X., et al. (2009). Genetic Composition of Elite Soybean Cultivar Hefeng 25. Acta Agronom. Sin. 35 (9), 1590–1596. doi: 10.1016/S1875-2780(08)60102-9
Han, Y., Zhao, X., Cao, G., Wang, Y., Li, Y., Liu, D., et al. (2015). Genetic characteristics of soybean resistance to HG type 0 and HG type 1.2.3.5.7 of the cyst nematode analyzed by genome-wide association mapping. BMC Genomics 16, 598. doi: 10.1186/s12864-015-1800-1
Han, Y., Zhao, X., Liu, D., Li, Y., Lightfoot, D. A., Yang, Z., et al. (2016). Domestication footprints anchor genomic regions of agronomic importance in soybeans. New Phytol. 209, 871–884. doi: 10.1111/nph.13626
Kadota, Y., Sklenar, J., Derbyshire, P., Stransfeld, L., Asai, S., Ntoukakis, V., et al. (2014). Direct regulation of the NADPH oxidase RBOHD by the PRR-associated kinase BIK1 during plant immunity. Mol. Cell 54, 43–55. doi: 10.1016/j.molcel.2014.02.021
Kamal-Eldin, A., Appelqvist, L. A. (1996). The chemistry and antioxidant properties of tocopherols and tocotrienols. J. Lipids 31 (7), 671–701. doi: 10.1007/bf02522884
Lane, D. J., Bae, D. H., Merlot, A. M., Sahni, S., Richardson, D. R. (2015). Duodenal cytochrome b(DCYTB)in iron metabolism: an update on function and regulation. Nutrients 7 (4), 2274–2296. doi: 10.3390/nu7042274
Lee, S., Van, K., Sung, M., Nelson, R., LaMantia, J., McHale, L. K., et al. (2019). Genome-wide association study of seed protein, oil and amino acid contents in soybean from maturity groups I to IV. Theor. Appl. Genet. 132 (6), 1639–1659. doi: 10.1007/s00122-019-03304-5
Li, H., Liu, H., Han, Y., Wu, X., Teng, W., Liu, G., et al. (2010). Identification of QTL underlying vitamin E contents in soybean seed among multiple environments. Theor. Appl. Genet. 120 (7), 1405–1413. doi: 10.1007/s00122-010-1264-2
Li, L., Li, M., Yu, L., Zhou, Z., Liang, X., Liu, Z., et al. (2014). The FLS2-associated kinase BIK1 directly phosphorylates the NADPH oxidase RbohD to control plant immunity. Cell Host. Microbe 15, 329–338. doi: 10.1016/j.chom.2014.02.009
Li, H., Sui, M., Nie, T., Shi, S., Han, Y., Li, W., et al. (2016). Expression analysis of five relative genes of soybean vitamin E. J. Northeast Agric. U. 05 15–22. doi: 10.3969/j.issn.1005-9369.2016.05.003
Li, D., Zhao, X., Han, Y., Li, W., Xie, F. (2018). Genome-wide association mapping for seed protein and oil contents using a large panel of soybean accessions. Genomics 111, 90–95. doi: 10.1016/j.ygeno.2018.01.004
Lipka, A. E., Tian, F., Wang, Q., Peiffer, J., Li, M., Bradbury, P. J., et al. (2012). GAPIT: genome association and prediction integrated tool. Bioinformatics 28 (18), 2397–2399. doi: 10.1093/bioinformatics/bts444
Liu, Z., Li, H., Fan, X., Huang, W., Yang, J., Wen, Z., et al. (2017). Phenotypic characterization and genetic dissection of nine agronomic traits in Tokachi nagaha and its derived cultivars in soybean (Glycine max (L.) Merr.). Plant Sci. 256, 72–86. doi: 10.1016/j.plantsci.2016.11.009
Maheswari, E., Saraswathy, G. R., Santhranii, T. (2015). Influence of vitamin E on hepatotoxicity and oxidative stress. J. Int. J. Res. Pharm. Biosci. 2 (3), 30–38.
Meng, L., Li, H., Zhang, L., Wang, J. (2015). QTL IciMapping: Integrated software for genetic linkage map construction and quantitative trait locus mapping in biparental populations. Crop J. 3 (3), 269–283. doi: 10.1016/j.cj.2015.01.001
Munné-Bosch, S., Alegre, L. (2002). The Function of Tocopherols and Tocotrienols in Plants. Crit. Rev. Plant Sci. 21 (1), 31–57. doi: 10.1080/0735-260291044179
Park, C., Dwiyanti, M. S., Nagano, A. J., Liu, B., Yamada, T., Abe, J. (2019). Identification of quantitative trait loci for increased alpha-tocopherol biosynthesis in wild soybean using a high-density genetic map. BMC Plant Biol. 19 (1), 510. doi: 10.1021/jf100455f
Seguin, P., Tremblay, G., Pageau, D. (2010). Soybean Tocopherol Concentrations Are Affected by Crop Management. J. Agric. Food Chem. 58 (9), 5495. doi: 10.1021/jf100455f
Shaw, E. J., Kakuda, Y., Rajcan, I. (2016). Effect of Genotype, Environment, and Genotype × Environment Interaction on Tocopherol Accumulation in Soybean Seed. Crop Sci. 56 (1), 40–50. doi: 10.2135/cropsci2015.02.0069
Shaw, E. J., Rajcan, I., Morris, B. (2017). Molecular mapping of soybean seed tocopherols in the cross ‘OAC Bayfield’×’OAC Shire’. Plant Breed. 136 (1), 83–93. doi: 10.1111/pbr.12437
Song, Q. J., Marek, L. F., Shoemaker, R. C., Lark, K. G., Concibido, V. C., Delannay, X., et al. (2004). A new integrated genetic linkage map of the soybean. Theor. Appl. Genet. 109 (1), 122–128. doi: 10.1007/s00122-004-1602-3
Stahl, E., Hartmann, M., Scholten, N., Zeier, E. (2019). A role for tocopherol biosynthesis in Arabidopsis thaliana basal immunity to bacterial infection. Plant Physiol. 181 (3), 618. doi: 10.1104/pp.19.00618
Sun, X., Liu, D., Zhang, X., Li, W., Liu, H., Hong, W., et al. (2013). SLAF-seq: an efficient method of large-scale de novo SNP discovery and genotyping using high-throughput sequencing. PloS One 8 (3), e58700. doi: 10.1371/journal.pone.0058700
Tanner, J. W., Luzzi, B. M., Gostovic, P., Montminy, W., Hume, D. J. (1998). OAC Bayfield soybean. Can. J. Plant Sci. 78 (4), 625–626. doi: 10.4141/P97-096
Tavva, V. S., Kim, Y. H., Kagan, I. A., Dinkins, R. D., Kim, K. H., Collins, G. B. (2007). Increased alpha-tocopherol content in soybean seed overexpressing the Perilla frutescens gamma-tocopherol methyltransferase gene. Plant Cell Rep. 26 (1), 61–70. doi: 10.1007/s00299-006-0218-2
Ujiie, A., Yamada, T., Fujimoto, K., Endo, Y., Kitamura, K. (2005). Identification of soybean varities with high levels of α-tocopherol content. Breed Sci. 55 (2), 123–125. doi: 10.1270/jsbbs.55.123
Wan, J., Zhang, W., Jiang, B., Guo, Y., Hu, C. (2008). Separation of Individual Tocopherols from Soybean Distillate by Low Pressure Column Chromatography. J. Am. Oil Chem. Soc. 85 (4), 331–338. doi: 10.1007/s11746-008-1198-x
Wang, Y., Han, Y., Teng, W., Zhao, X., Li, Y., Wu, L., et al. (2014). Expression quantitative trait loci infer the regulation of isoflavone accumulation in soybean (Glycine max L. Merr.) seed. BMC Genomics 15 (1):680. doi: 10.1186/1471-2164-15-680
Yan, L., Hofmann, N., Li, S., Ferreira, M. E., Song, B., Jiang, G., et al. (2017). Identification of QTL with large effect on seed weight in a selective population of soybean with genome-wide association and fixation index analyses. BMC Genomics 18 (1), 529. doi: 10.1186/s12864-017-3922-0
Zhang, H., Li, C., Davis, E. L., Wang, J., Griffin, J. D., Kofsky, J., et al. (2016). Genome-Wide Association Study of Resistance to Soybean Cyst Nematode (Heterodera glycines) HG Type 2.5.7 in Wild Soybean (Glycine soja). Front. Plant Sci. 7:1214:1214. doi: 10.3389/fpls.2016.01214
Zhao, X., Jiang, H., Feng, L., Qu, Y., Teng, W., Qiu, L., et al. (2019). Genome-wide association and transcriptional studies reveal novel genes for unsaturated fatty acid synthesis in a panel of soybean accessions. BMC Genomics 20 (1), 68. doi: 10.1186/s12864-019-5449-z
Keywords: soybean seed, tocopherol concentration, genome-wide association analysis, linkage mapping, candidate genes
Citation: Sui M, Jing Y, Li H, Zhan Y, Luo J, Teng W, Qiu L, Zheng H, Li W, Zhao X and Han Y (2020) Identification of Loci and Candidate Genes Analyses for Tocopherol Concentration of Soybean Seed. Front. Plant Sci. 11:539460. doi: 10.3389/fpls.2020.539460
Received: 01 March 2020; Accepted: 18 August 2020;
Published: 09 September 2020.
Edited by:
Marcelino Perez De La Vega, Universidad de León, SpainReviewed by:
Zhiwu Zhang, Washington State University, United StatesJavaid Akhter Bhat, Indian Agricultural Research Institute (IARI), India
Khalid Meksem, Southern Illinois University Carbondale, United States
Copyright © 2020 Sui, Jing, Li, Zhan, Luo, Teng, Qiu, Zheng, Li, Zhao and Han. This is an open-access article distributed under the terms of the Creative Commons Attribution License (CC BY). The use, distribution or reproduction in other forums is permitted, provided the original author(s) and the copyright owner(s) are credited and that the original publication in this journal is cited, in accordance with accepted academic practice. No use, distribution or reproduction is permitted which does not comply with these terms.
*Correspondence: Yingpeng Han, aHlwMjM0Mjg2QGFsaXl1bi5jb20=; Xue Zhao, eHVlemhhb0BuZWF1LmVkdS5jbg==
†These authors have contributed equally to this work