 W. Jesse Carmack
 Anthony Clark
 Yanhong Dong2
 Gina Brown-Guedira
 David Van Sanford
94% of researchers rate our articles as excellent or good
Learn more about the work of our research integrity team to safeguard the quality of each article we publish.
Find out more
ORIGINAL RESEARCH article
Front. Plant Sci. , 26 August 2020
Sec. Plant Pathogen Interactions
Volume 11 - 2020 | https://doi.org/10.3389/fpls.2020.01318
This article is part of the Research Topic Fungal Wheat Diseases: Etiology, Breeding, and Integrated Management View all 27 articles
Previous results from our lab have shown that using an optical sorter to identify Fusarium head blight (FHB) resistant breeding lines was effective at reducing the toxin deoxynivalenol (DON) and FHB-associated kernel damage. In this paper we quantified the proportion of desirable genotypes at FHB resistance QTL in lines from three selection cycles of optical sorting. Breeding lines were genotyped at loci on chromosomes 3BS, 2DL, and 5A using the following DNA markers: TaHRC, CFD233, and GWM304. TaHRC is a KASP marker for Fhb1, a major FHB resistance QTL on chromosome 3BS. CFD233 is an SSR marker for Qfhs.nau-2DL on chromosome 2DL. GWM304 is an SSR marker for Qfhs.ifa-5A on chromosome 5A. Sorter selection was effective at identifying lines that had the resistant genotype at TaHRC; in other words, the sorter was able to identify lines with resistance alleles at Fhb1. The sorter was less effective at selecting for the resistant genotype at CFD233 and GWM304. However, the proportion of lines with resistant genotypes at GWM304 did increase with additional sorter selection, just not to the degree that was observed for the Fhb1-associated marker. The proportion of lines with resistant alleles at CFD233 did not show a consistent trend. In addition to increasing the proportion of lines with Fhb1 and Qfhs.ifa-5A each selection cycle, optical sorter-based mass selection enhanced FHB resistance in different marker genotype combinations evaluated in this study. For example, there were net reductions in DON and kernel damage after two cycles of sorter selection in 15X110601S07002, a line with Fhb1, with Qfhs.nau-2DL, and with Qfhs.ifa-5A; final C3 DON levels were 63% of the resistant check (KY02C-3005-25). Kernel damage was also reduced in 15X110601A08221 a line without Fhb1, without Qfhs.nau-2DL, and without Qfhs.ifa-5A. Our findings suggest the increased resistance observed in different marker genotype combinations was conferred by QTL other than Fhb1, QFhs.nau-2DL, and Qfhs.ifa-5, and validate our previous results that the optical sorter is effective at selecting FHB-resistant breeding material.
Wheat (Triticum aestivum L.), considered a staple crop in numerous cultures, is widely consumed around the world. The Foreign Agricultural Service (FAS) a division of the United States Department of Agriculture (USDA), projects global consumption of wheat to be over 750,000,000 metric tons in the 2019/2020 marketing year (USDA FAS, 2020). As the world population and affluence continue to increase, the demand for staple crops like wheat is also expected to rise. Shiferaw et al. predicts a 60% increase in demand for wheat by the year 2050 (Shiferaw et al., 2013). Increasing wheat production to levels adequate enough to meet demand, while also mitigating contamination and other grain quality issues caused by plant diseases, is a major problem facing agricultural researchers today.
Fusarium head blight (FHB), caused by Fusarium graminearum, is a plant disease that limits wheat production and contaminates grain. Yield reduction, due to FHB-associated kernel damage, directly limits wheat production (Agostinelli et al., 2011). Damaged kernels also decrease market value due to reduced test weight and flour yield (McMullen et al., 1997). Deoxynivalenol (DON) accumulates in grain as a result of FHB infection; and, consumption of grain contaminated with DON is harmful to both humans and animals. DON toxicity symptoms include: nausea, vomiting, diarrhea, abdominal pain, headache, dizziness, fever, and, with enough exposure, death (Sobrova et al., 2010). Furthermore, no single management practice has provided complete suppression of FHB infection (Zhu et al., 2019). The most effective fungicide regimes provide at best 69% control for kernel damage and 54% control for DON (D’Angelo et al., 2014). Therefore, enhancing genetic resistance to FHB via plant breeding is the most promising solution to DON accumulation and kernel damage.
Quantitative trait loci (QTL) involved in FHB resistance have been identified on all 21 wheat chromosomes (Steiner et al., 2017). Two of the strongest and best-validated are Fhb1 and Qfhs.ifa-5A, both of which were derived from “Sumai-3” (Bai et al., 1999; Waldron et al., 1999; Anderson et al., 2001; Buerstmayr et al., 2003). Fhb1 was first described by Waldron et al. as Qfhs.ndsu-3B and later renamed (Waldron et al., 1999; Liu et al., 2006; Agostinelli et al., 2011). Fhb1 is a major effect QTL that confers strong Type II resistance to FHB in wheat and other small grains (Bai et al., 1999; Cuthbert et al., 2006; Petersen et al., 2017; Steiner et al., 2017; He et al., 2018; Zhu et al., 2019). Qfhs.ifa-5A contributes mainly to Type I FHB resistance (Buerstmayr et al., 2003; Steiner et al., 2019). An additional large effect resistance QTL is Qfhs.nau-2DL identified in the breeding line CJ9306 (Jiang et al., 2007a; Jiang et al., 2007b; Steiner et al., 2017). Qfhs.nau-2DL contributes to both Type I and II resistance (Agostinelli et al., 2011; Lu et al., 2013; Yi et al., 2018). Type I FHB resistance is defined as resistance to initial infection, whereas Type II is defined as resistance to disease spread within infected heads (Mesterhazy, 1995; Mesterházy et al., 1999).
Fhb1, Qfhs.ifa-5A, and Qfhs.nau-2DL all have relatively stable effects and tightly linked DNA markers; thus, marker assisted selection (MAS) for these QTL has efficiently improved FHB resistance in adapted, high-yielding wheat germplasm (Steiner et al., 2017). In addition, wheat lines with acceptable FHB resistance can be developed through accumulation of several small effect QTL present in locally adapted germplasm, i.e. what is often termed “native resistance” (Steiner et al., 2017). Accumulating numerous small effect QTL in genetic backgrounds fixed for known major effect QTL should enhance FHB resistance in wheat germplasm and potentially other small grains. Therefore, a high-throughput selection method is needed to gradually accumulate new small effect QTL while also enriching for major effect FHB resistance QTL.
Optically separating diseased from non-diseased grain has been shown to have potential as an en masse selection method to identify and enhance FHB resistance (reduce DON and kernel damage) in wheat (Carmack et al., 2019). The objective of this study was to determine if optically sorting seed from breeding material segregating visually for FHB resistance over several generations increased the proportion of lines with resistance alleles at large effect QTL on 3BS, 2DL, and 5A. In addition to assessing the proportion of lines with the FHB resistance QTL each selection cycle, the average response to selection of all marker genotype combinations was examined, and the ability of optical sorter-based mass selection to enhance FHB resistance in individual lines with and without the R alleles at the three large effect QTL was demonstrated.
The plant material used in this study consisted of 300 F4 derived soft red winter wheat (SRWW) breeding lines with KY06C-11-3-10 (Reg. No. GP-965, PI 669817) in their pedigree. KY06C-11-3-10 is a SRWW germplasm line that carries exotic FHB resistance alleles from the Chinese spring wheat cultivar “Ning7840” at QTL on chromosomes 3BS, 5A, and 2DL; the line was created via accelerated backcrossing of these QTL into “McCormick,” a domestic cultivar with nonexotic (native) moderate FHB resistance (Clark et al., 2014). Backcrossing was performed by the University of Kentucky, University of Maryland, Virginia Polytechnic Institute and State University, North Carolina State University, and the USDA-ARS. The breeding lines used in this study differed in characteristics such as level of FHB resistance, heading date, height, and other agronomic traits. All plant material was grown at the University of Kentucky Spindletop Research Farm near Lexington, KY (38°7'37.81''N, 84°29 44.85'' W) from 2016 to 2019.
The fungal material used in this study consisted of inoculum prepared using 27 F. graminearum isolates taken from scabby wheat seed collected at multiple locations across Kentucky, 2007–2010 (Bec et al., 2015). Inoculum was prepared by first allowing dry corn (Zea mays L.) kernels to imbibe water for approximately 16 hours. After 16 hours, corn kernels were autoclaved, inoculated with potato dextrose agar (PDA) plugs infected with F. graminearum, mixed with 0.2 g of streptomycin in 50 mL of sterile water, covered and allowed to incubate at room temperature (Balut et al., 2013). After complete colonization by the fungus (3 weeks), the corn kernels were spread onto a tarp and allowed to dry aided by a dehumidifier. After drying, inoculated corn kernels were placed in mesh bags and stored in a freezer at −18°C. All cultures were maintained, and inoculum was produced at the University of Kentucky Plant Science Building in Lexington, KY (38°1'36.1''N, 84°30'30.1''W) from 2016 to 2019.
The breeding lines were phenotyped in an inoculated and irrigated scab nursery. The nursery provided the intense disease pressure needed for resistance evaluation and artificial selection. During all years of the experiment (2016–2019), at Feekes growth stage 8, approximately 21 days prior to flowering of the earliest material, corn kernels infected with F. graminearum were broadcast throughout the nursery at a rate of 11.86 g m−2 (Gilbert and Woods, 2006; Balut et al., 2013). In addition to inoculating the field, an overhead irrigation system on an automatic timer was used to provide optimal moisture conditions for disease development, and the opportunity to evaluate and select for FHB resistance. The irrigation schedule was as follows: 5-minute periods every 15 minutes from 2000 to 2045 h, 2100 to 2145 h, 0200 to 0245 h, 0500 to 0530 h, and 0830 h (Balut et al., 2013). The concentration of deoxynivalenol (DON) in ppm was determined by the University of Minnesota DON testing lab using gas chromatography with mass spectrometry GC-MS (Mirocha et al., 1998; Fuentes et al., 2005) each season. The proportion of Fusarium damaged kernels in a given sample estimated using an optical seed sorter (FDKos) was collected in all years except 2016; FDKos estimates were arrived at using methods developed by the University of Kentucky Wheat Breeding Program (Carmack et al., 2019).
The breeding lines were genotyped at the Eastern Regional Small Grains Genotyping Laboratory in Raleigh, North Carolina, USA. DNA was isolated from each of the 300 breeding lines and genotypes were determined at FHB resistance QTL using two SSR markers (Benson et al., 2012). The SSR markers used were as follows: CFD233 and GWM304. CFD233 is a SSR marker for QFhs.nau-2DL, a FHB resistance QTL on chromosome 2DL (Guyomarc’h et al., 2002; Löffler et al., 2009; Agostinelli et al., 2011; Balut et al., 2013; Kollers et al., 2013; Arruda et al., 2016). GWM304 is a SSR marker for Qfhs.ifa-5A, a FHB resistance QTL on chromosome 5A (Roder et al., 1998; Chen et al., 2006; Liu et al., 2007; Arruda et al., 2016). In addition to the SSR markers, genotypes were obtained for 120 of the 300 breeding lines using one KASP marker (TaHRC); reactions were done following the manufacturer’s instructions. TaHRC is a KASP marker for Fhb1 on chromosome 3BS (Bernardo et al., 2011; Schweiger et al., 2016; Su et al., 2019). Previous findings from numerous labs have shown that DNA markers linked to Fhb1 are associated with material more resistant to DON accumulation (Roder et al., 1998; Waldron et al., 1999; Anderson et al., 2001; Zhou et al., 2002; Anderson et al., 2007; Wilde et al., 2007; Liu et al., 2008; Salameh et al., 2010; Balut et al., 2013; Arruda et al., 2016; Prat et al., 2017).
The optical sorter is a USDA/ARS and National Manufacturing Seed Sorter System that uses a high-throughput, high-resolution color camera in combination with compressed air to separate grain (Pasikatan and Dowell, 2003; Delwiche et al., 2005; Pearson et al., 2008; Pearson, 2010). Each cycle of mass selection with the optical sorter was performed in a different year; therefore, the sorter was calibrated each year. Optical sorter calibration and operation was performed as described in Carmack et al., 2019. Figure 1 provides an example of the visual differences between Fusarium damaged (rejected) and asymptomatic (accepted) kernels used to calibrate the optical sorter.
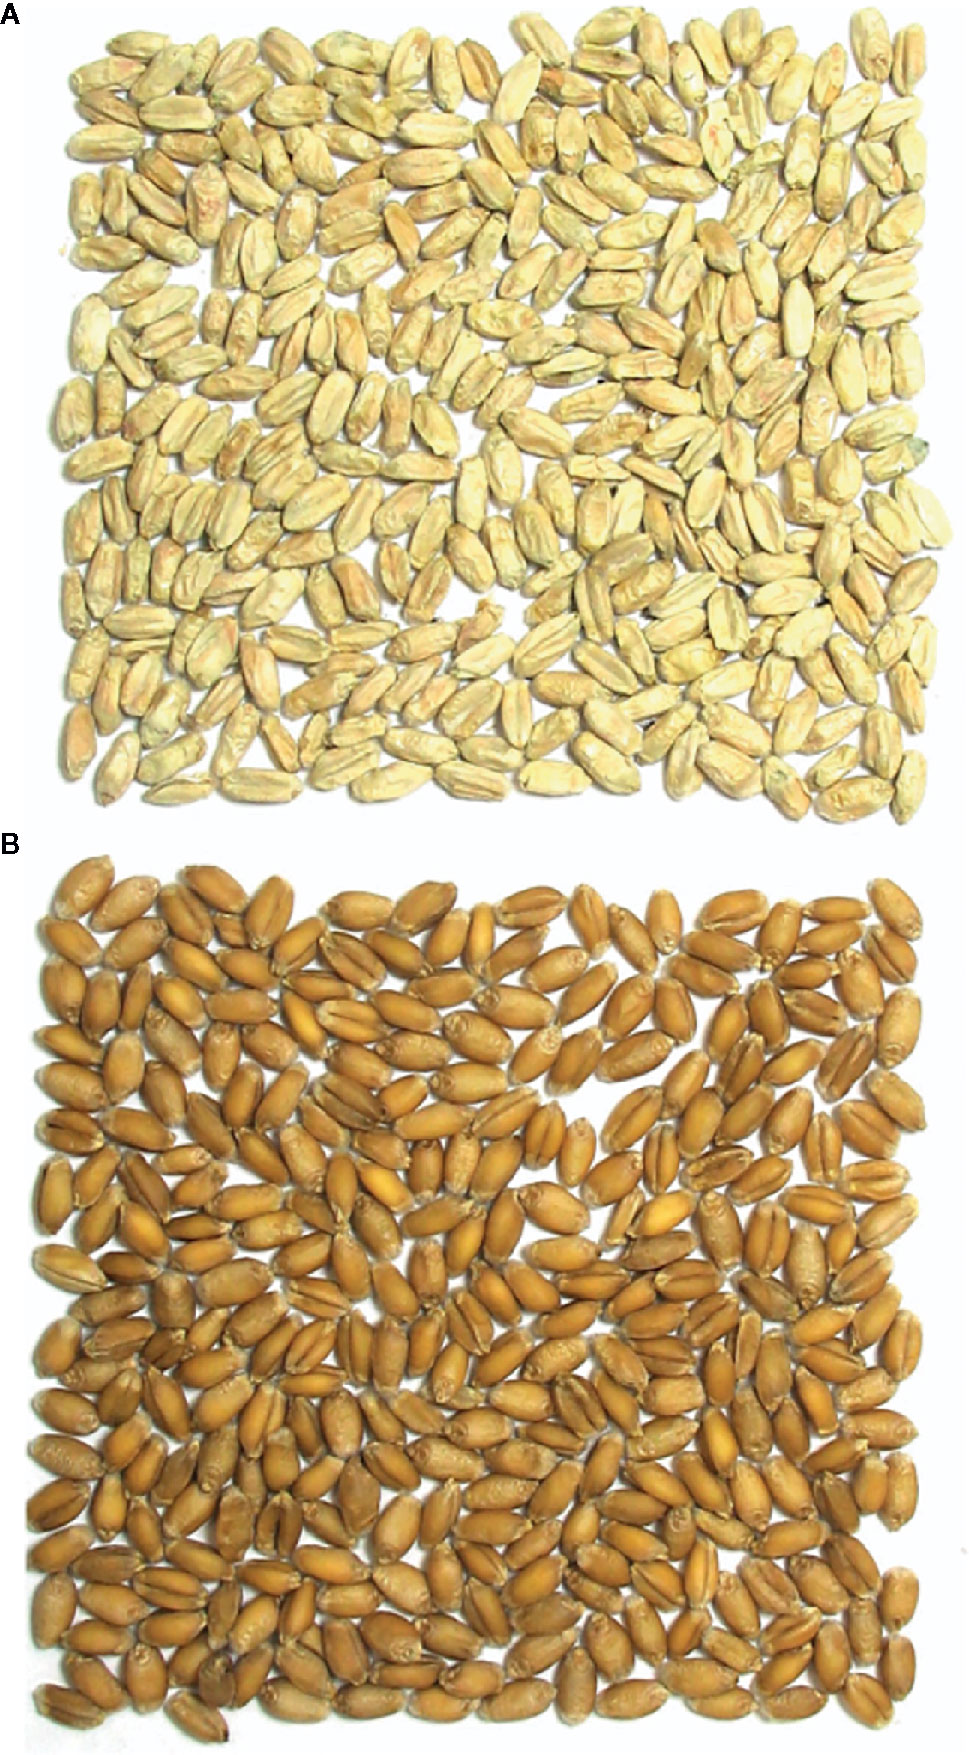
Figure 1 Visual differences between Fusarium damaged and asymptomatic kernels used to calibrate the optical sorter. (A) Fusarium damaged/rejected kernels, (B) asymptomatic/accepted kernels.
Experimental material was grown from 2016 to 2018 at Spindletop Research Farm in 1 meter (m) rows spaced 30 centimeters (cm) apart arranged in a randomized complete block design (RCBD) with one resistant (KY02C-3005-25) and one susceptible (Pioneer Brand 2555) check cultivar repeated throughout the nursery. Cycles of selection 1, 2, and 3 (C1; C2; C3) were evaluated collectively in 2019 at the same location using 1 m long six row miniplots arranged in a RCBD with the resistant and susceptible checks repeated throughout the field. Three replications per genotype were evaluated in 2018 whereas two replications were used in all other years.
During mass selection (2016–2018), each 1 m row was hand harvested with sickles and all plants in each row were bundled together to avoid mixing. Each bundle was threshed separately using a stationary threshing machine, and seed from all plants in the bundle were collected in bulk and optically sorted. After sorting, grain “accepted” by the sorter from each line/rep combination was comingled, sampled and then used to plant the subsequent generation. From 2016 to 2018, all lines were advanced to the next generation after sorting (within-line selection). In 2019, cycles 1, 2, and 3 from 54 of the 300 F4 derived lines were evaluated in an inoculated and irrigated head scab nursery. These lines were chosen because there was enough remnant seed from previous cycles of selection (C1 – C3) to allow all 3 generations to be planted collectively in 6 row miniplots in the head scab nursery. No remnant seed from the base population (C0) was available, and therefore C0 was not grown in 2019. In addition to within-line selection, among-line selection was retroactively performed using phenotypic measurements obtained with the optical sorter (FDKos); among line selection decisions were based on FDKos values obtained from 2016–2018. For among-line selection, candidates that had FDKos values greater than the resistant check (KY02C-3005-25) were dropped each cycle of selection. No among line selection was performed from C0 to C1, because FDKos was not recorded in 2016. From C1 to C2, and C2 to C3, any lines that had FDKos values greater than the resistant check were discarded.
Mean DON and FDKos values were estimated for each breeding line by year using data collected during mass selection (2016-2018) and the following model:
where Yijk = the observation in the ith year in the jth rep of the kth breeding line, µ = the overall mean, Yi = the effect of the ith year, Rj = the effect of the jth replication within the ith year, Lk = the effect of the kth breeding line, Yi × Lk = the effect of the interaction of the ith year and the kth breeding line, εijk = the residual error. Since each year represents a different cycle of selection, it was necessary to nest replications in years. The model used to determine mean DON and FDKos values for each breeding line, marker genotype, and selection cycle using data collected during the final evaluation in 2019 was:
where Yijk = the observation in the ith cycle in the jth rep of the kth breeding line or marker genotype, µ = the overall mean, Ci = the effect of the ith selection cycle, Rj = the effect of the jth replication, Gk = the effect of the kth breeding line or marker genotype, Ci × Gk = the effect of the interaction of the ith selection cycle and the kth breeding line or marker genotype, εijk = the residual error.
The results of FDKos among line selection presented in Table 1 are based on data obtained during the final evaluation (2019). Among line selection with the optical sorter resulted in a net decrease in overall DON concentration each cycle; overall FDKos values also decreased with each cycle of selection (Carmack et al., 2019). In addition to the observed decrease in cycle mean DON and FDKos, the proportion of TaHRC resistant (R) genotypes increased with each additional round of sorter-based among line selection. Specifically, the proportion of lines with Fhb1 went from 48% to 92% after two rounds of sorter-based among line selection. Average cycle DON and FDKos for TaHRC R genotypes ranged from 0.7 to 0.8 ppm and 12.8 to 19.2% respectively. Not only did the proportion of TaHRC R genotypes increase, the proportion of TaHRC susceptible (S) genotypes decreased with additional cycles of optical sorter-based among line selection. When the study was initiated, prior to optical sorting, 37% of lines did not have Fhb1, and after two cycles of sorter-based among line selection 100% of the lines had at least one R allele at Fhb1. Average DON concentration was always higher in TaHRC S genotypes than in TaHRC heterozygous (H) or R genotypes and ranged from 1.6 to 1.8 ppm. FDKos ranged from 17.5 to 23.5%. The proportion of TaHRC H genotypes decreased each round of sorter-based among line selection (from 15 to 12 to 8%). Mean DON concentrations for TaHRC H genotypes ranged from 0.3 to 0.8 ppm and FDKos values ranged from 19.7 to 25.1%.
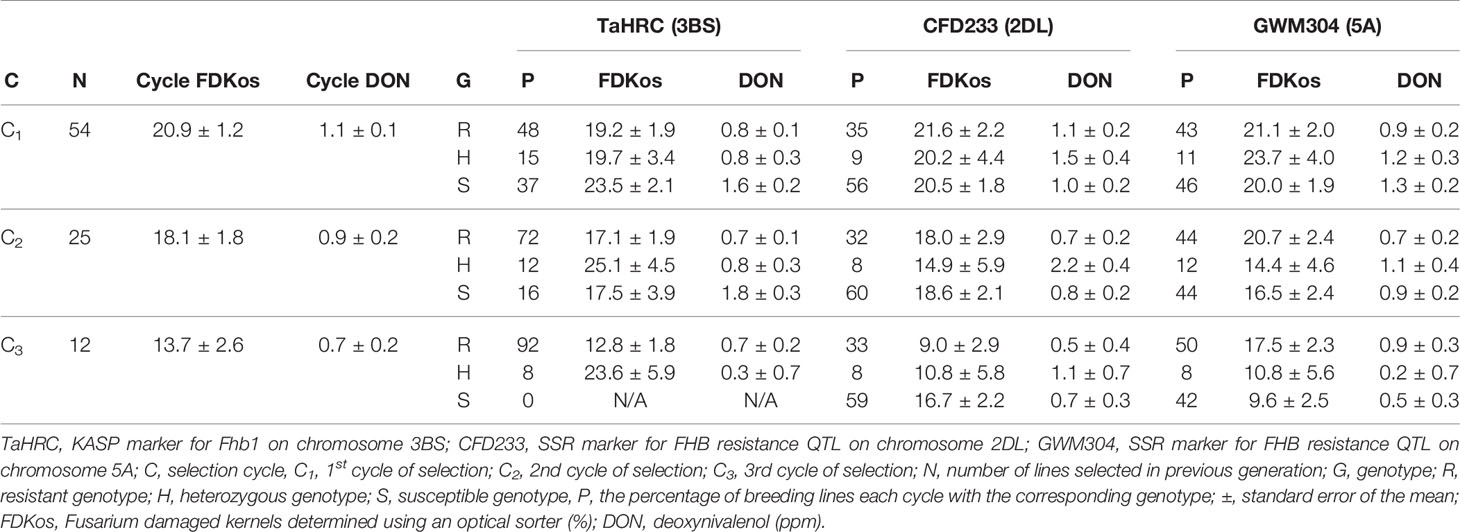
Table 1 Shift in genotype proportions by DNA marker and selection cycle due to optical sorter-based (FDKos) mass selection estimated using data collected during the final evaluation (2019), Lexington, KY.
Similar to the pattern observed for TaHRC, optical sorter-based among line selection resulted in a net increase in the proportion of lines with R genotypes at GWM304 (the SSR marker for Qfhs.ifa-5A) each cycle of sorter selection (Table 1). The proportion of lines with GWM304 R genotypes went from 43 (C1) to 50% (C3). Mean DON for GWM304 R genotypes ranged from 0.7 to 0.9 ppm, and mean FDKos ranged from 17.5 to 21.1%. Furthermore, the proportion of lines with S genotypes for GWM304 decreased each cycle of selection: C1 = 46%, C2 = 44%, and C3 = 42%. In other words, sorter-based among line selection resulted in a shift from mostly S genotypes in C1 to majority R genotypes in C3. This is a promising result. For GWM304 S genotypes, mean DON and FDKos ranged from 0.5 to 1.3 ppm and 9.6 to 20.0% respectively. The proportion of GWM304 H genotypes increased (11 to 12%) after one round of sorter-based among line selection and then decreased (12 to 8%) with an additional round of selection. Mean DON concentrations for GWM304 H genotypes ranged from 0.2 to 1.2 ppm and FDKos values ranged from 10.8 to 23.7%.
In contrast with TaHRC (the KASP marker for Fhb1) and GWM304 (the SSR marker for Qfhs.ifa-5A), the proportion of lines with CFD233 R genotypes did not consistently increase and S genotypes did not decrease with additional optical sorter-based among line selection (Table 1). The proportion of R, H, and S genotypes for the QFhs.nau-2DL marker (CFD233) remained fairly constant with additional optical sorter based-among line selection. Specifically, CFD233 R genotypes went from 35 to 33%, S genotypes went from 56 to 59%, and H genotypes went from 9 to 8% after two rounds of sorter-based among line selection. DON ranged from 0.5 to 1.1 ppm for R, 0.7 to 1.0 ppm for S, and 1.1 to 2.2 ppm for H genotypes. FDKos ranged from 9.0 to 21.6% for R, 16.7 to 20.5% for S, and 10.8 to 20.2% for H genotypes.
The results of optical sorter-based within line mass selection presented in Tables 2 and 3 are based on data obtained during the final evaluation in 2019. Contrary to what was observed for optical sorter-based among line selection, sorter-based within line selection did not result in a net decrease in overall DON and FDKos with each additional cycle of selection (Carmack et al., 2019). However, specific marker genotype combinations did respond to within line selection (Table 2). Of the 54 lines tested in 2019, 19 were heterozygous for at least one marker. The other 35 lines fit into one of eight possible genotypes (RRR, RRS, RSS, RSR, SSS, SRR, SSR, and SRS), where the first letter represents the genotype at TaHRC, the second represents CFD233, and the third represents GWM304. Net reductions in FHB-associated kernel damage (FDKos) were achieved in RRR, RRS, RSS, SSS, SSR, and SRS genotypes. Mean FDKos ranged from 7.1 to 32.2%. Similar to what was observed with FDKos, sorter-based within line selection resulted in lower net DON values in RRS, SSR, and SRS genotypes. Mean DON ranged from 0.5 to 2.2 ppm.
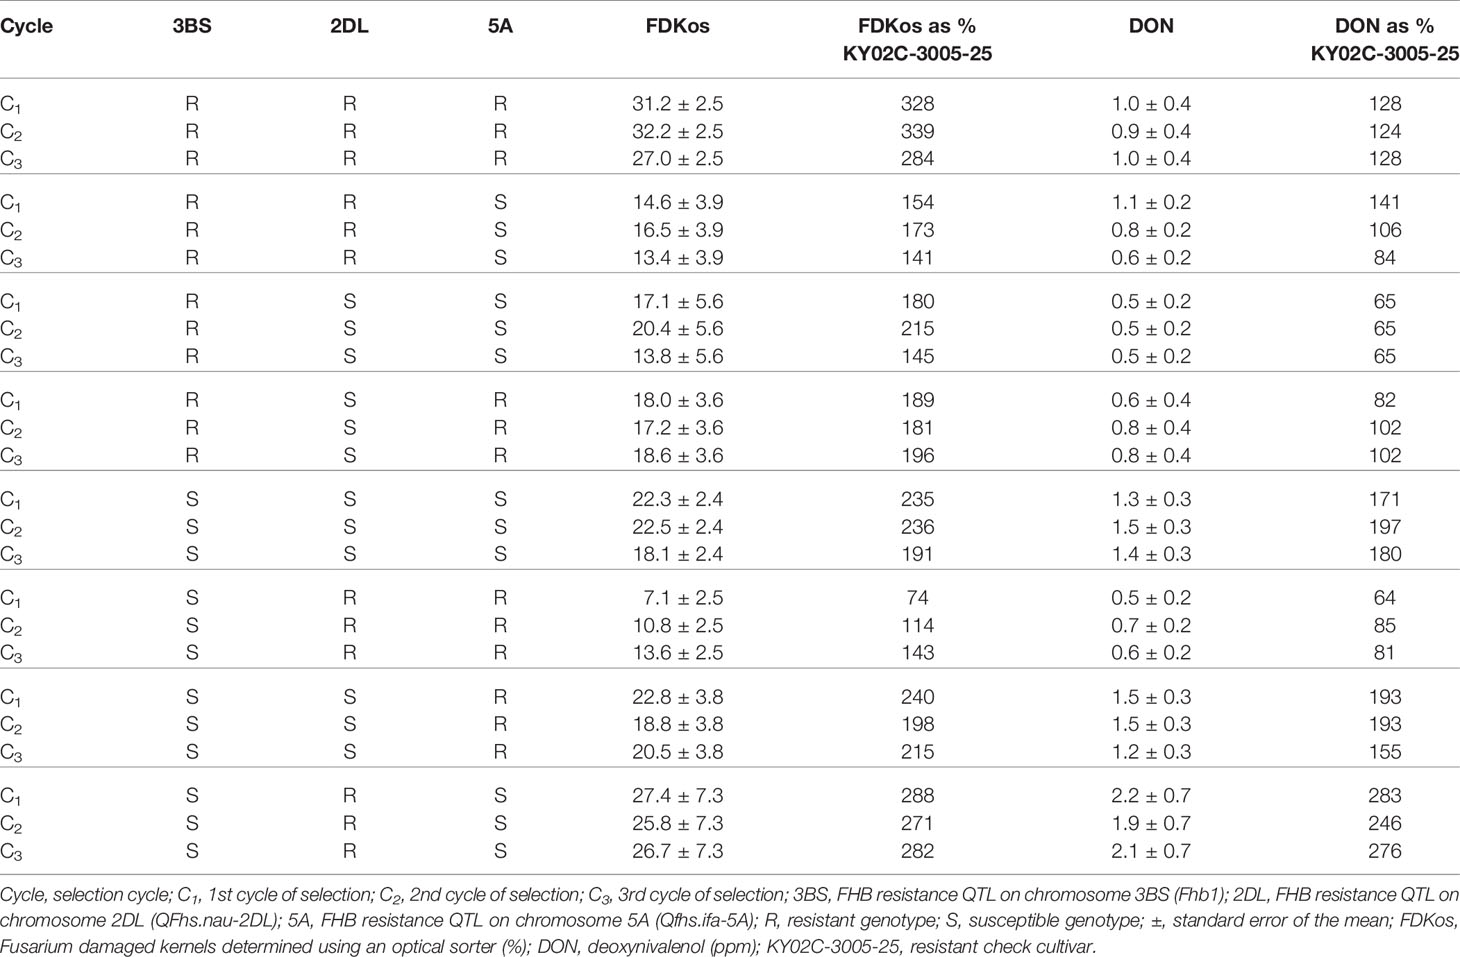
Table 2 Means and standard errors for DON and FDKos for all marker genotype combinations by selection cycle estimated using phenotypic data collected during the final evaluation (2019), Lexington, KY.
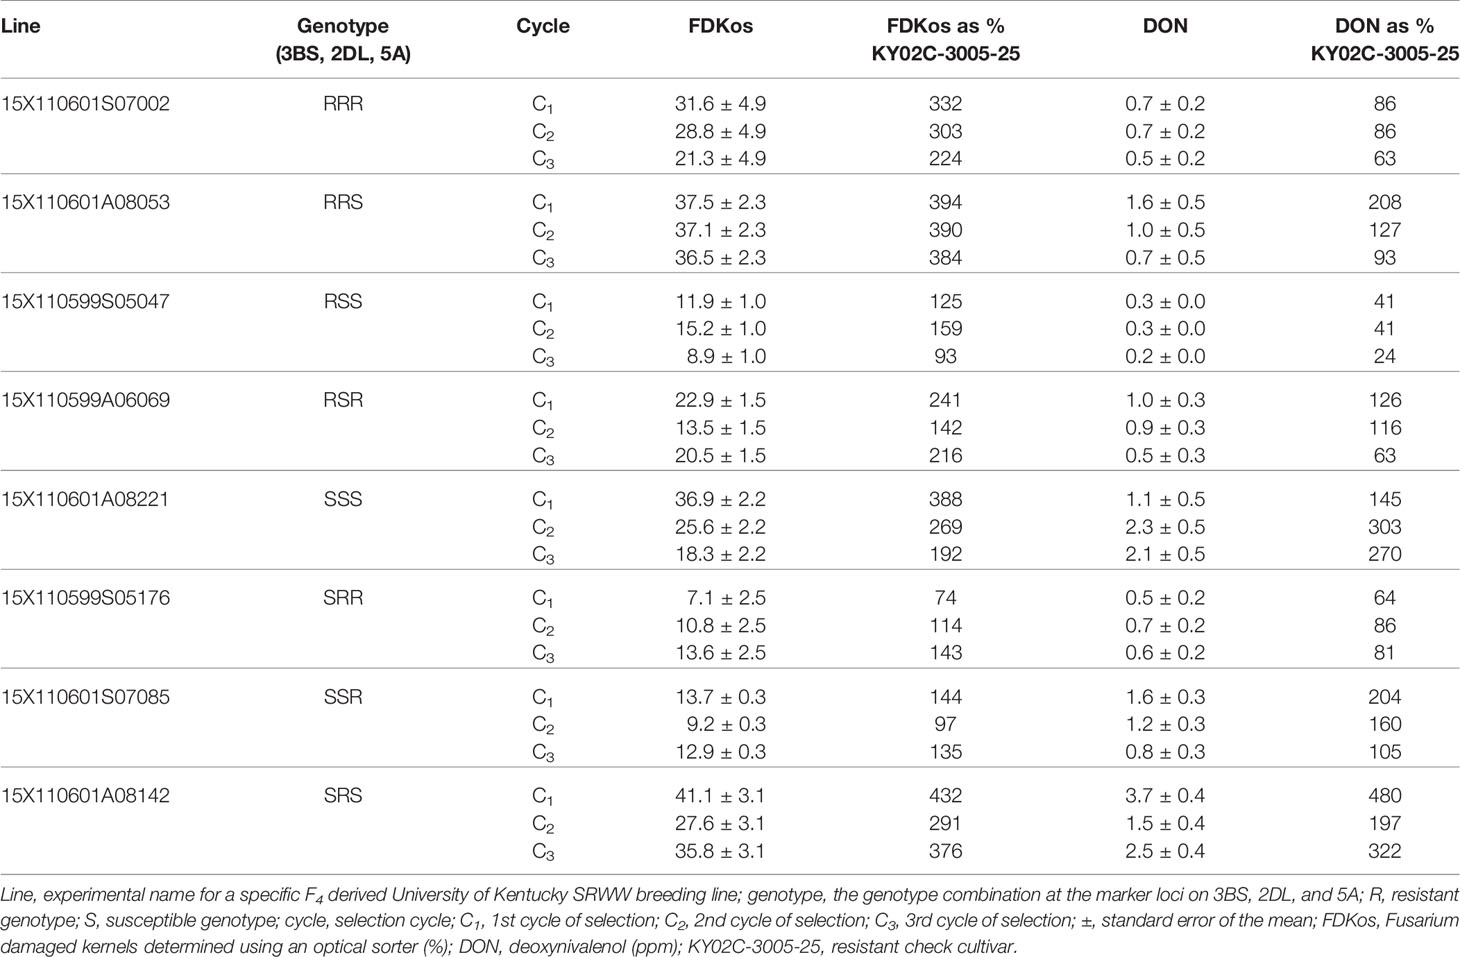
Table 3 Response of individual lines to optical sorter-based within line selection by selection cycle estimated using phenotypic data collected during the final evaluation (2019), Lexington, KY.
Individual lines in each of the eight marker genotype combinations responded to within line selection with the optical sorter. Mean DON and FDKos by cycle of selection for one individual line that responded to optical sorter-based within line selection from each marker genotype combination is presented in Table 3. Unexpectedly, DON and FDKos values increased each cycle of selection in line 15X110599S05176, an SRR genotype. Line 15X110599S05176 was the only SRR genotype evaluated in 2019; it is possible that a different SRR line may have responded positively to selection (DON and FDKos lowered with additional selection). For the other seven genotype combinations (RRR, RRS, RSS, RSR, SSS, SSR, and SRS) the individual line represented in Table 3 shows a net decrease in at least one target trait (DON and/or FDKos) each additional cycle of within line sorter selection. FDKos values ranged from 7.1 to 41.1% and DON concentrations from 0.2 to 3.7 ppm.
On the basis of our previously published results and the results of this study, it is our opinion that optical seed sorter-based selection has potential to enhance FHB resistance (reduce DON accumulation and kernel damage) in SRWW. In this paper, we determined the effectiveness of the sorter at identifying breeding material with known FHB resistance QTL on chromosomes 3BS, 2DL, and 5A, by evaluating the proportion of desirable genotypes at the QTL in lines from three selection cycles of optical sorting. In addition to assessing the proportion of lines with the FHB resistance QTL on 3BS, 2DL, and 5A each selection cycle, the average response to selection of all marker genotype combinations was examined. Furthermore, the ability of optical sorter-based mass selection to enhance FHB resistance in individual lines with and without the R alleles at the FHB resistance QTL was demonstrated.
Sorter selection was very effective at identifying lines that had the resistant genotype at TaHRC; in other words, the sorter was able to identify lines with resistance alleles at Fhb1 (Table 1). In addition to a net decrease in overall DON and FDKos each cycle, we observed that sorter-based among line selection resulted in an increased proportion of TaHRC R genotypes and a decreased proportion of S genotypes with each additional round of selection. These results are not unexpected. The majority of major effect QTL detected for reduced DON accumulation, including Fhb1, co-located with QTL for reduced disease severity on plants preharvest or grains postharvest (Somers et al., 2003; Liu et al., 2012; Liu et al., 2013; Ágnes et al., 2014; Buerstmayr and Lemmens, 2015). Furthermore, Fhb1 has been classified as a strong contributor to Type II FHB resistance, which is associated with reductions in Fusarium damaged kernels (Bai et al., 1999; He et al., 2018). The proportion of Fusarium damaged kernels determined with an optical sorter (FDKos) is a postharvest measure of disease severity on grain as well as an indicator of Type II FHB resistance; therefore, it is not surprising that optical sorter-based among line selection (lines with FDKos values greater than the resistant check were discarded each selection cycle) increased the proportion of lines with Fhb1 (a QTL known to be associated with reduced kernel damage). The increased proportion of lines with Fhb1, a QTL that has been shown time after to time to enhance head scab resistance in wheat and other small grains, validates our previous findings that optical sorter-based among line selection can be utilized to breed for lower DON and FHB-associated kernel damage (Carmack et al., 2019).
The proportion of lines with a resistant genotype at GWM304 increased with additional sorter selection to a lesser degree than what was observed for TaHRC (Table 1). We expected sorter-based among line selection to increase the proportion of GWM304 R genotypes similar to the pattern we saw with TaHRC, considering that Qfhs.ifa-5A, like Fhb1, is classified as a large effect FHB resistance QTL associated with reduced disease severity and DON content (Buerstmayr and Lemmens, 2015). Previous studies have proposed a role for Qfhs.ifa-5A in reduced disease severity on plants preharvest or grains postharvest; however, different methods for estimating disease severity were used (Miedaner et al., 2006; Wilde et al., 2007; Kang et al., 2011). Miedaner et al., and Wilde et al. estimated FHB disease severity using a rating scale on plants preharvest, whereas Kang et al. estimated disease severity using a visual estimate of the percentage of Fusarium damaged kernels in a sample of grain postharvest (FDK). Rating was a visual estimate of the proportion of diseased heads in a plot from 0 to 9, where 0 = no heads showing disease symptoms and 9 = 90% of heads showing disease symptoms. FDK was estimated as the percentage of visually infected kernels in a sample, which included shriveled and discolored seeds. Both methods were different than disease severity determined with an optical sorter (FDKos). Optical sorter-based selection operated on detectable differences in seed color only, not seed shape/size or preharvest appearance of the plant. Furthermore, previous research has shown the QTL on 5A contributes mostly to Type I resistance, unlike Fhb1 which contributes to strong Type II resistance (Bai et al., 1999; Buerstmayr et al., 2003; He et al., 2018; Steiner et al., 2019). Therefore, Qfhs.ifa-5A may be more involved in reducing physical kernel damage (shriveled seeds/FDK) and visible preharvest disease symptoms (rating), than differences in seed coat color as a result of FHB infection (FDKos). It appears Fhb1 may be heavily involved in expression of all three traits. This would explain the inability of the sorter to select for GWM304 R genotypes to the same degree as for TaHRC R genotypes. Although sorter selection did not increase the proportion of lines with R genotypes at GWM304 as was observed with TaHRC, sorter-based among line selection resulted in a shift from mostly S genotypes in C1 to majority R genotypes in C3. The results presented in Table 1 for GWM304 agree with those for TaHRC and support the notion that optical sorter-based among line selection can be used to select for R genotypes and against S genotypes at known FHB resistance QTL.
The sorter was not effective at selecting for the resistant genotype at the CFD233 marker locus (Table 1). This was unexpected, because QFhs.nau-2DL is a large effect QTL associated with reduced kernel damage and DON accumulation just like Qfhs.ifa-5A and Fhb1 (Agostinelli et al., 2011; Balut et al., 2013). Agostinelli et al. and Balut et al. both proposed the QTL on 2DL reduced kernel damage and DON accumulation, and both estimated kernel damage using a vacuum seed sorter that separates healthy from diseased kernels on the basis of weight. Heavy kernels were considered healthy and lighter kernels were considered diseased. This method of estimating the proportion of Fusarium damaged kernels did not incorporate differences in seed color, which may explain the inability of sorter-based among line selection to gradually increase the proportion of R genotypes at CFD233. Interestingly, the QTL on 2DL contributes to Type I and II resistance (Agostinelli et al., 2011; Lu et al., 2013; Yi et al., 2018). Remember that the sorter effectively selected for strong Type II (Fhb1) and to a lesser degree Type I (QTL on 5A) resistance. Failure to select for a QTL shown to be involved in both Type I and II resistance may indicate QFhs.nau-2DL has less of an effect on FHB resistance in the genetic backgrounds utilized in this study compared to those of previously published results. Regardless, the optical sorter was not effective at selecting for lines with QFhs.nau-2DL (the proportion of lines with CFD233 R genotypes did not increase with additional rounds of selection) in our selection material.
Although optical sorter-based among line selection did not result in genotype proportions equal to optimum MAS results for all three markers, 92% of C3 lines selected based on FDKos had Fhb1, compared to 48% in the C1. These proportions are comparable to the best MAS results, in which 100% of lines would have the marker. Sorter-based among line selection resulted in a shift from mostly S genotypes in C1 (R = 43%; S = 46%) to majority R genotypes in C3 (R = 50%; S = 42%) for the QTL on 5A; unfortunately, the proportion of R and S genotypes for the QTL on 2DL did not show a consistent response. MAS would have resulted in a shift to all R genotypes. Therefore, MAS outperformed sorter-based among line selection at increasing the proportion of R genotypes at the three FHB resistance QTL. However, it did not reduce DON and FDKos values lower than sorter-based among line selection. For example, MAS (selecting only RRR lines) resulted in final DON concentrations greater than and final FDKos values significantly greater than those of sorter-based among line selection: DON = 1.0 ± 0.4 ppm and FDKos = 27.0 ± 2.5% (Table 2) compared to DON = 0.7 ± 0.2 ppm and FDKos = 13.7 ± 2.6% (Table 1). In other words, phenotypic selection with the sorter outperformed genotypic selection with DNA markers. Phenotypic selection followed by genotypic selection did not consistently outperform phenotypic selection alone. None of the 12 C3 lines phenotypically selected with optical sorter-based among line selection were RRR; four lines were RRS and four lines were RSR (Table 4). Final mean DON and FDKos values for the RRS lines (identified using phenotypic followed by genotypic selection) were arithmetically less than those obtained via phenotypic selection alone (all 12 lines): DON = 0.5 ± 0.3 ppm and FDKos = 9.0 ± 1.8% (Table 4) compared to DON = 0.7 ± 0.2 ppm and FDKos = 13.7 ± 2.6% (Table 1). However, final mean DON and FDKos for the RSR lines (identified using phenotypic followed by genotypic selection) were arithmetically greater than those obtained via phenotypic selection alone (all 12 lines): DON = 0.9 ± 0.3 ppm and FDKos = 17.7 ± 1.8% (Table 4) compared to DON = 0.7 ± 0.2 ppm and FDKos = 13.7 ± 2.6% (Table 1). Even though optical sorter-based among line selection did not achieve genotype proportions equal to that of MAS, sorter-based selection was necessary to achieve the greatest reductions in DON and FDKos. These results support the efficacy of the optical sorter as a useful breeding tool for head scab resistance in SRWW and add merit to the idea of using an optical sorter to mass select for quantitative seed color traits in wheat and other crops (Chiou et al., 1994; Lee et al., 1998; Delwiche et al., 2005; Goggi et al., 2006; Yang et al., 2009; Pearson, 2010; Brabec et al., 2017).
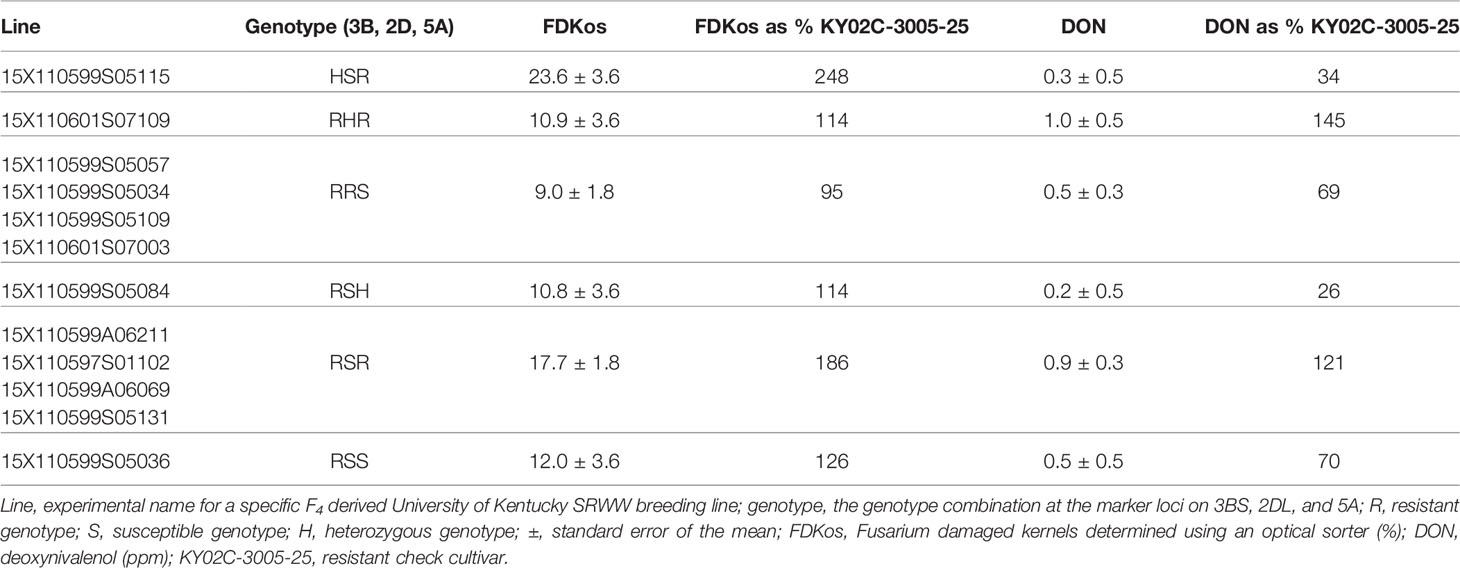
Table 4 Average DON and FDKos by marker genotype combination for the 12 C3 lines phenotypically selected with the optical sorter.
In addition to the observed increase in the proportion of lines with Fhb1 and Qfhs.ifa-5A as a result of each additional optical sorter-based among line selection cycle, optical sorter-based within line selection enhanced FHB resistance in certain genetic backgrounds (Table 2). For example, C1 FDKos values went from 235% of the resistant check to 236% and 191% in the C2 and C3 generations, respectively, for lines with the SSS genotype (lines without Fhb1 and the resistance QTL on chromosomes 2DL and 5A). These results indicate that sorter-based within line selection led to the accumulation of kernel damage resistance conferred by QTL other than the three reported in this paper, i.e. what is often termed “native resistance.” SSR genotypes (lacked Fhb1 and 2DL) also responded to within line selection: DON accumulation was reduced from 193% of the resistant check in the C2 to 155% in the C3 (no change occurred from C1 to C2). These results agree with FDKos results for SSS lines and suggest that sorter-based within line selection accumulated head scab resistance conferred by QTL other than those evaluated in this study. In addition, breeding lines with the RRS genotype (with Fhb1 and QFhs.nau-2DL; without Qfhs.ifa-5A) responded even more to within line selection; C1 DON levels went from 141% of the resistant check to 106% and 84% of the resistant check in the C2 and C3 generations (Table 2). C3 DON levels at 84% of the resistant check indicate that within line selection improved RRS genotypes on average from worse than the resistant check to better than the resistant check after just two cycles of selection. These results indicate that it is possible to use the sorter to select for resistance conferred by unknown QTL.
Furthermore, there are some very promising individual lines shown in Table 3. For example, line 15X110601S07002 (RRR genotype) started with C1 DON at 86% of the resistant check and was at 63% in C3. FDKos also decreased from 332 to 224% of the resistant check after two cycles of sorter selection. Response to within line selection to the degree observed for line 15X110601S07002 indicates that sorter-based within line selection led to the accumulation of FHB-associated kernel damage resistance conferred by QTL other than Fhb1, QFhs.nau-2DL, and Qfhs.ifa-5A. Another line, 15X110599S05047 (RSS genotype), ended up with C3 DON at 24% and FDKos at 93% of the resistant check. In addition, lines 15X110601A08053 (RRS genotype) and 15X110599A06069 (RSR genotype) started with C1 DON levels above that of the resistant check and after two rounds of selection had C3 DON levels below that of the resistant check. These results indicate that although optical sorter-based within line selection did not improve all traits in all lines each cycle, within line progress was accomplished. This observation, when coupled with the generation (F4:5) in which selection started, suggests that it may be possible to use the sorter to significantly enhance head scab resistance in wheat. Genetic variation, necessary for progress in plant breeding, is less within an F4 derived breeding line than, for example, an F2 population (Falconer, 1989). At a minimum, our results indicate further research that utilizes the optical seed sorter to enhance FHB resistance by accumulating numerous small-effect QTL (“native resistance”) is both warranted and necessary.
Previous results from our lab have shown that using an optical sorter to identify FHB resistant breeding lines was effective at reducing the toxin deoxynivalenol and FHB-associated kernel damage. In this study we examined whether optical sorter-based selection increased the proportion of lines with known FHB resistance QTL, and evaluated the response to selection of the different possible marker genotype combinations, producing a few key findings:
1. Optical sorter-based among line selection increased the proportion of breeding lines with Fhb1 and Qfhs.ifa-5A, but not QFhs.nau-2DL.
2. Phenotypic selection with the optical sorter for reduced DON and FDKos outperformed marker assisted selection (MAS); i.e., sorter-based selection was necessary to achieve the greatest reductions in DON and FDKos.
3. Optical sorter-based within line mass selection enhanced FHB resistance in certain genetic backgrounds (RRR, RRS, RSS, RSR, SSS, SRR, SSR, and SRS), which suggests the increased resistance was conferred by QTL other than Fhb1, QFhs.nau-2DL, and Qfhs.ifa-5A.
The raw data supporting the conclusions of this article will be made available by the authors, without undue reservation.
WJC helped design the study, carried out the research, analyzed data, wrote the manuscript. AC helped design the study and develop experimental materials. YD carried out mycotoxin analyses. GBG facilitated genotyping and provided genotyping data. DVS helped design the study, assisted in data analysis, edited and revised manuscript. All authors contributed to the article and approved the submitted version.
This work was funded by a grant from the U.S. Department of Agriculture, through the US Wheat and Barley Scab Initiative under agreement no. 59-0206-9-054. The funding sponsors had no role in the design of the study; in the collection, analysis or interpretation of data; in the writing of the manuscript, and in the decision to publish the results.
The authors declare that the research was conducted in the absence of any commercial or financial relationships that could be construed as a potential conflict of interest.
We thank John Connelley and Sandy Swanson for their technical support.
Ágnes, S.-H., Szabolcs, L.-K., Mónika, V., László, P., János, P., Csaba, L., et al. (2014). Differential influence of QTL linked to Fusarium head blight, Fusarium-damaged kernel, deoxynivalenol contents and associated morphological traits in a Frontana-derived wheat population. Euphytica 200 (1), 9–26. doi: 10.1007/s10681-014-1124-2
Agostinelli, A. M., Clark, A. J., Brown-Guedira, G., Van Sanford, D. A. (2011). Optimizing phenotypic and genotypic selection for Fusarium head blight resistance in wheat. Euphytica 186 (1), 115–126. doi: 10.1007/s10681-011-0499-6
Anderson, J. A., Stack, R. W., Liu, S., Waldron, B. L., Fjeld, A. D., Coyne, C., et al. (2001). DNA markers for Fusarium head blight resistance QTLs in two wheat populations. Theor. Appl. Genet. 102, 1164–1168. doi: 10.1007/s001220000509
Anderson, J. A., Chao, S., Liu, S. (2007). Molecular Breeding Using a Major QTL for Fusarium Head Blight Resistance in Wheat. Crop Sci. 47 (3, S-112–S-119). doi: 10.2135/cropsci2007.04.0006IPBS
Arruda, M. P., Brown, P., Brown-Guedira, G., Krill, A. M., Thurber, C., Merrill, K. R., et al. (2016). Genome-Wide Association Mapping of Fusarium Head Blight Resistance in Wheat using Genotyping-by-Sequencing. Plant Genome 9 (1), 1–14. doi: 10.3835/plantgenome2015.04.0028
Bai, G., Kolb, F. L., Shaner, G., Domier, L. L. (1999). Amplified Fragment Length Polymorphism Markers Linked to a Major Quantitative Trait Locus Controlling Scab Resistance in Wheat. Phytopathology™ 89 (4), 343–348. doi: 10.1094/phyto.1999.89.4.343
Balut, A. L., Clark, A. J., Brown-Guedira, G., Souza, E., Van Sanford, D. A. (2013). Validation of Fhb1 and QFhs.nau-2DL in Several Soft Red Winter Wheat Populations. Crop Sci. 53 (3), 71–80. doi: 10.2135/cropsci2012.09.0550
Bec, S., Ward, T., Farman, M., O’Donnell, K., Hershman, D., Van Sanford, D., et al. (2015). Characterization of Fusarium Strains Recovered From Wheat With Symptoms of Head Blight in Kentucky. Plant Dis. 99 (11), 1622–1632. doi: 10.1094/PDIS-06-14-0610-RE
Benson, J., Brown-Guedira, G., Paul Murphy, J., Sneller, C. (2012). Population Structure, Linkage Disequilibrium, and Genetic Diversity in Soft Winter Wheat Enriched for Fusarium Head Blight Resistance. Plant Genome J. 5 (2), 71–80. doi: 10.3835/plantgenome2011.11.0027
Bernardo, A. N., Ma, H., Zhang, D., Bai, G. (2011). Single nucleotide polymorphism in wheat chromosome region harboring Fhb1 for Fusarium head blight resistance. Mol. Breed. 29 (2), 477–488. doi: 10.1007/s11032-011-9565-y
Brabec, D., Guttieri, M. J., Pearson, T., Carsrud, B. (2017). Effectiveness of an image-based sorter to select for kernel color within early segregating hard winter wheat (Triticum aestivum L.) Populations. Cereal Res. Commun. 45 (3), 488–499. doi: 10.1556/0806.45.2017.034
Buerstmayr, H., Lemmens, M. (2015). Breeding healthy cereals: genetic improvement of Fusarium resistance and consequences for mycotoxins. World Mycotoxin J. 8 (5), 591–602. doi: 10.3920/wmj2015.1889
Buerstmayr, H., Steiner, B., Hartl, L., Griesser, M., Angerer, N., Lengauer, D., et al. (2003). Molecular mapping of QTLs for Fusarium head blight resistance in spring wheat. II. Resistance to fungal penetration and spread. Theor. Appl. Genet. 107 (3), 503–508. doi: 10.1007/s00122-003-1272-6
Carmack, W. J., Clark, A. J., Dong, Y., Van Sanford, D. A. (2019). Mass Selection for Reduced Deoxynivalenol Concentration Using an Optical Sorter in SRW Wheat. Agronomy 9 (12), 1–17. doi: 10.3390/agronomy9120816
Chen, J., Griffey, C. A., Saghai Maroof, M. A., Stromberg, E. L., Biyashev, R. M., Zhao, W., et al. (2006). Validation of two major quantitative trait loci for fusarium head blight resistance in Chinese wheat line W14. Plant Breed. 125, 99–101. doi: 10.1111/j.1439-0523.2006.01182.x
Chiou, R. Y. Y., Wu, P.-Y., Yen, Y.-H. (1994). Color sorting of lightly roasted and deskinned peanut kernels to diminish aflatoxin contamination in commercial lots. J. Agric. Food Chem. 42 (10), 2156–2160. doi: 10.1021/jf00046a016
Clark, A. J., Costa, J. M., Griffey, C. A., Brown-Guedira, G. L., Dong, Y., Souza, E. J., et al. (2014). Registration of Scab-Resistant KY06C-11-3-10 Soft Red Winter Wheat Germplasm. J. Plant Registrations 8 (2), 211–216. doi: 10.3198/jpr2013.07.0039crg
Cuthbert, P. A., Somers, D. J., Thomas, J., Cloutier, S., Brule-Babel, A. (2006). Fine mapping Fhb1, a major gene controlling fusarium head blight resistance in bread wheat (Triticum aestivum L.). Theor. Appl. Genet. 112 (8), 1465–1472. doi: 10.1007/s00122-006-0249-7
Delwiche, S. R., Pearson, T. C., Brabec, D. L. (2005). High-Speed Optical Sorting of Soft Wheat for Reduction of Deoxynivalenol. Plant Dis. 89 (11), 1214–1219. doi: 10.1094/pd-89-1214
D’Angelo, D. L., Bradley, C. A., Ames, K. A., Willyerd, K. T., Madden, L. V., Paul, P. A. (2014). Efficacy of Fungicide Applications During and After Anthesis Against Fusarium Head Blight and Deoxynivalenol in Soft Red Winter Wheat. Plant Dis. 98, 1387–1397. doi: 10.1094/PDIS-01-14-0091-RE
Falconer, D. (1989). Introduction to Quantitative Genetics (New York, NY, USA: John Wiley & Sons, Inc).
Fuentes, R. G., Mickelson, H. R., Busch, R. H., Dill-Macky, R., Evans, C. K., Thompson, W. G., et al. (2005). Resource Allocation and Cultivar Stability in Breeding for Fusarium Head Blight Resistance in Spring Wheat. Crop Sci. 45 (5), 1965–1972. doi: 10.2135/cropsci2004.0589
Gilbert, J., Woods, S. M. (2006). “Strategies and Considerations for Multi-Location FHB Screening Nurseries”, in The Global Fusarium Initiative for International Collaboration: A Strategic Planning Workshop. Ban, T., Lewis, J. M., Phipps, E. E.. (El Batán, Mexico CIMMYT).
Goggi, A. S., Adam, K. M., Sanchez, H., Westgate, M. (2006). Improving Corn Grain Purity by Using Color-Sorting Technology. Crop Manage. 5 (1), 1–8. doi: 10.1094/cm-2006-0309-01-rs
Guyomarc’h, H., Sourdille, P., Charmet, G., Edwards, J., Bernard, M. (2002). Characterisation of polymorphic microsatellite markers from Aegilops tauschii and transferability to the D-genome of bread wheat. Theor. Appl. Genet. 104 (6-7), 1164–1172. doi: 10.1007/s00122-001-0827-7
He, Y., Zhang, X., Zhang, Y., Ahmad, D., Wu, L., Jiang, P., et al. (2018). Molecular Characterization and Expression of PFT, an FHB Resistance Gene at the Fhb1 QTL in Wheat. Phytopathology 108 (6), 730–736. doi: 10.1094/PHYTO-11-17-0383-R
Jiang, G. L., Dong, Y., Shi, J., Ward, R. W. (2007a). QTL analysis of resistance to Fusarium head blight in the novel wheat germplasm CJ 9306. II. Theor. Appl. Genet. 115 (8), 1043–1052. doi: 10.1007/s00122-007-0630-1
Jiang, G. L., Shi, J., Ward, R. W. (2007b). QTL analysis of resistance to Fusarium head blight in the novel wheat germplasm CJ 9306. I. Theor. Appl. Genet. 116 (1), 3–13. doi: 10.1007/s00122-007-0641-y
Kang, J., Clark, A., Van Sanford, D., Griffey, C., Brown-Guedira, G., Dong, Y., et al. (2011). Exotic Scab Resistance Quantitative Trait Loci Effects on Soft Red Winter Wheat. Crop Sci. 51 (3), 924–933. doi: 10.2135/cropsci2010.06.0313
Kollers, S., Rodemann, B., Ling, J., Korzun, V., Ebmeyer, E., Argillier, O., et al. (2013). Whole genome association mapping of Fusarium head blight resistance in European winter wheat (Triticum aestivum L.). PLoS One 8 (2), e57500. doi: 10.1371/journal.pone.0057500
Lee, P. C., Paine, D. H., Taylor, A. G. (1998). Detection and Removal of Off-colored Bean Seeds by Color Sorting. Seed Technol. 20 (1), 43–55.
Liu, S., Zhang, X., Pumphrey, M. O., Stack, R. W., Gill, B. S., Anderson, J. A. (2006). Complex microcolinearity among wheat, rice, and barley revealed by fine mapping of the genomic region harboring a major QTL for resistance to Fusarium head blight in wheat. Funct. Integr. Genomics 6 (2), 83–89. doi: 10.1007/s10142-005-0007-y
Liu, S., Abate, Z. A., Lu, H., Musket, T., Davis, G. L., McKendry, A. L. (2007). QTL associated with Fusarium head blight resistance in the soft red winter wheat Ernie. Theor. Appl. Genet. 115 (3), 417–427. doi: 10.1007/s00122-007-0577-2
Liu, S., Pumphrey, M., Gill, B., Trick, H., Zhang, J., Dolezel, J., et al. (2008). Toward positional cloning ofFhb1, a major QTL for Fusarium head blight resistance in wheat. Cereal Res. Commun. 36 (Supplement 6), 195–201. doi: 10.1556/CRC.36.2008.Suppl.B.15
Liu, S., Christopher, M. D., Griffey, C. A., Hall, M. D., Gundrum, P. G., Brooks, W. S. (2012). Molecular Characterization of Resistance to Fusarium Head Blight in U.S. Soft Red Winter Wheat Breeding Line VA00W-38. Crop Sci. 52 (5), 2283–2292. doi: 10.2135/cropsci2012.03.0144
Liu, S., Griffey, C. A., Hall, M. D., McKendry, A. L., Chen, J., Brooks, W. S., et al. (2013). Molecular characterization of field resistance to Fusarium head blight in two US soft red winter wheat cultivars. Theor. Appl. Genet. 126 (10), 2485–2498. doi: 10.1007/s00122-013-2149-y
Löffler, M., Schön, C.-C., Miedaner, T. (2009). Revealing the genetic architecture of FHB resistance in hexaploid wheat (Triticum aestivum L.) by QTL meta-analysis. Mol. Breed. 23 (3), 473–488. doi: 10.1007/s11032-008-9250-y
Lu, Q., Lillemo, M., Skinnes, H., He, X., Shi, J., Ji, F., et al. (2013). Anther extrusion and plant height are associated with Type I resistance to Fusarium head blight in bread wheat line ‘Shanghai-3/Catbird’. Theor. Appl. Genet. 126 (2), 317–334. doi: 10.1007/s00122-012-1981-9
McMullen, M., Jones, J., Gallenberg, D. (1997). Scab of Wheat and Barley: A Re-emerging Disease of Devestating Impact. Plant Dis. 81 (12), 1340–1348. doi: 10.1094/PDIS.1997.81.12.1340
Mesterházy, Á., Bartók, T., Mirocha, C. G., Komoróczy, R. (1999). Nature of wheat resistance to Fusarium head blight and the role of deoxynivalenol for breeding. Plant Breed. 118 (2), 97–110. doi: 10.1046/j.1439-0523.1999.118002097.x
Mesterhazy, A. (1995). Types and components of resistance to Fusarium head blight of wheat. Plant Breed. 114, 377–386. doi: 10.1111/j.1439-0523.1995.tb00816.x
Miedaner, T., Wilde, F., Steiner, B., Buerstmayr, H., Korzun, V., Ebmeyer, E. (2006). Stacking quantitative trait loci (QTL) for Fusarium head blight resistance from non-adapted sources in an European elite spring wheat background and assessing their effects on deoxynivalenol (DON) content and disease severity. Theor. Appl. Genet. 112 (3), 562–569. doi: 10.1007/s00122-005-0163-4
Mirocha, C. J., Kolaczkowski, E., Xie, W., Yu, H., Jelen, H. (1998). Analysis of Deoxynivalenol and Its Derivatives (Batch and Single Kernel) Using Gas Chromatography/Mass Spectrometry. J. Agric. Food Chem. 46, 1414–1418. doi: 10.1021/jf970857o
Pasikatan, M. C. D., Dowell, F. E. (2003). Evaluation of A High-Speed Color Sorter for Segregation of Red and White Wheat. Applied Engineering in Agriculture. 19(1), 71. doi: 10.13031/2013.12725
Pearson, T., Brabec, D., Haley, S. (2008). Color image based sorter for separating red and white wheat. Sens. Instrum. Food Qual. Saf. 2 (4), 280–288. doi: 10.1007/s11694-008-9062-0
Pearson, T. (2010). High-Speed Sorting of Grains by Color and Surface Texture. Appl. Eng. Agric. 26 (3), 499–505. doi: 10.13031/2013.29948
Petersen, S., Lyerly, J. H., McKendry, A. L., Islam, M. S., Brown-Guedira, G., Cowger, C., et al. (2017). Validation of Fusarium Head Blight Resistance QTL in US Winter Wheat. Crop Sci. 57 (1), 1–12. doi: 10.2135/cropsci2015.07.0415
Prat, N., Guilbert, C., Prah, U., Wachter, E., Steiner, B., Langin, T., et al. (2017). QTL mapping of Fusarium head blight resistance in three related durum wheat populations. Theor. Appl. Genet. 130 (1), 13–27. doi: 10.1007/s00122-016-2785-0
Roder, M. S., Korzun, V., Wendehake, K., Plaschke, J., Tixier, M., Leroy, P., et al. (1998). A microsatellite map of wheat. Genetics 149, 2007–2023.
Salameh, A., Buerstmayr, M., Steiner, B., Neumayer, A., Lemmens, M., Buerstmayr, H. (2010). Effects of introgression of two QTL for fusarium head blight resistance from Asian spring wheat by marker-assisted backcrossing into European winter wheat on fusarium head blight resistance, yield and quality traits. Mol. Breed. 28 (4), 485–494. doi: 10.1007/s11032-010-9498-x
Schweiger, W., Steiner, B., Vautrin, S., Nussbaumer, T., Siegwart, G., Zamini, M., et al. (2016). Suppressed recombination and unique candidate genes in the divergent haplotype encoding Fhb1, a major Fusarium head blight resistance locus in wheat. Theor. Appl. Genet. 129 (8), 1607–1623. doi: 10.1007/s00122-016-2727-x
Shiferaw, B., Smale, M., Braun, H.-J., Duveiller, E., Reynolds, M., Muricho, G. (2013). Crops that feed the world 10. Past successes and future challenges to the role played by wheat in global food security. Food Secur. 5 (3), 291–317. doi: 10.1007/s12571-013-0263-y
Sobrova, P., Adam, V., Vasatkova, A., Beklova, M., Zeman, L., Kizek, R. (2010). Deoxynivalenol and its toxicity. Interdiscip, Toxicol. 3 (3), 94–99. doi: 10.2478/v10102-010-0019-x
Somers, D. J., Fedak, G., Savard, M. (2003). Molecular mapping of novel genes controlling Fusarium head blight resistance and deoxynivalenol accumulation in spring wheat. Genome 46 (4), 555–564. doi: 10.1139/g03-033
Steiner, B., Buerstmayr, M., Michel, S., Schweiger, W., Lemmens, M., Buerstmayr, H. (2017). Breeding strategies and advances in line selection for Fusarium head blight resistance in wheat. Trop. Plant Pathol. 42 (3), 165–174. doi: 10.1007/s40858-017-0127-7
Steiner, B., Buerstmayr, M., Wagner, C., Danler, A., Eshonkulov, B., Ehn, M., et al. (2019). Fine-mapping of the Fusarium head blight resistance QTL Qfhs.ifa-5A identifies two resistance QTL associated with anther extrusion. Theor. Appl. Genet. 132 (7), 2039–2053. doi: 10.1007/s00122-019-03336-x
Su, Z., Bernardo, A., Tian, B., Chen, H., Wang, S., Ma, H., et al. (2019). A deletion mutation in TaHRC confers Fhb1 resistance to Fusarium head blight in wheat. Nat. Genet. 51 (7), 1099–1105. doi: 10.1038/s41588-019-0425-8
USDA FAS (2020). Grain: World Markets and Trade. (United States Department of Agriculture Foreign Agricultural Service).
Waldron, B. L., Moreno-Sevilla, B., Anderson, J. A., Stack, R. W., Frohberg, R. C. (1999). RFLP mapping of QTL for Fusarium head blight resistance in wheat. Crop Sci. 39, 805–811. doi: 10.2135/cropsci1999.0011183X003900030032x
Wilde, F., Korzun, V., Ebmeyer, E., Geiger, H. H., Miedaner, T. (2007). Comparison of phenotypic and marker-based selection for Fusarium head blight resistance and DON content in spring wheat. Mol. Breed. 19 (4), 357–370. doi: 10.1007/s11032-006-9067-5
Yang, I., Delwiche, S. R., Chen, S., Lo, Y. (2009). Enhancement of Fusarium head blight detection in free-falling wheat kernels using a bichromatic pulsed LED design. Opt. Eng. 48 (2), 1–11. doi: 10.1117/1.3081092
Yi, X., Cheng, J., Jiang, Z., Hu, W., Bie, T., Gao, D., et al. (2018). Genetic Analysis of Fusarium Head Blight Resistance in CIMMYT Bread Wheat Line C615 Using Traditional and Conditional QTL Mapping. Front. Plant Sci. 9:573. doi: 10.3389/fpls.2018.00573
Zhou, W., Kolb, F. L., Bai, G., Shaner, G., Domier, L. L. (2002). Genetic analysis of scab resistance QTL in wheat with microsatellite and AFLP markers. Genome 45 (4), 719–727. doi: 10.1139/g02-034
Keywords: fusarium head blight (FHB), optical sorter, deoxynivalenol (DON), SSR markers, soft red winter wheat, fusarium damaged kernels (FDK), disease resistance, KASP markers
Citation: Carmack WJ, Clark A, Dong Y, Brown-Guedira G and Van Sanford D (2020) Optical Sorter-Based Selection Effectively Identifies Soft Red Winter Wheat Breeding Lines With Fhb1 and Enhances FHB Resistance in Lines With and Without Fhb1. Front. Plant Sci. 11:1318. doi: 10.3389/fpls.2020.01318
Received: 22 March 2020; Accepted: 11 August 2020;
Published: 26 August 2020.
Edited by:
Paul Christiaan Struik, Wageningen University and Research, NetherlandsReviewed by:
Wricha Tyagi, Central Agricultural University, IndiaCopyright © 2020 Carmack, Clark, Dong, Brown-Guedira and Van Sanford. This is an open-access article distributed under the terms of the Creative Commons Attribution License (CC BY). The use, distribution or reproduction in other forums is permitted, provided the original author(s) and the copyright owner(s) are credited and that the original publication in this journal is cited, in accordance with accepted academic practice. No use, distribution or reproduction is permitted which does not comply with these terms.
*Correspondence: David Van Sanford, ZHZzQHVreS5lZHU=
Disclaimer: All claims expressed in this article are solely those of the authors and do not necessarily represent those of their affiliated organizations, or those of the publisher, the editors and the reviewers. Any product that may be evaluated in this article or claim that may be made by its manufacturer is not guaranteed or endorsed by the publisher.
Research integrity at Frontiers
Learn more about the work of our research integrity team to safeguard the quality of each article we publish.