 Rudolph Fredua-Agyeman
 Junye Jiang
 Sheau-Fang Hwang
 Stephen E. Strelkov
95% of researchers rate our articles as excellent or good
Learn more about the work of our research integrity team to safeguard the quality of each article we publish.
Find out more
ORIGINAL RESEARCH article
Front. Plant Sci. , 03 July 2020
Sec. Plant Breeding
Volume 11 - 2020 | https://doi.org/10.3389/fpls.2020.00899
In this study, Brassica rapa subsp. rapifera (ECD 02) which exhibits broad-spectrum resistance to many Canadian Plasmodiophora brassicae isolates was crossed with two clubroot-susceptible B. rapa accessions to produce two F2 populations. The F2 plants were screened against P. brassicae pathotypes 3H, 5X, and 5G. The Chi-square goodness of fit test showed that the vast majority (≈75%) of the crosses that produced the F2 populations showed segregation ratios of 9R:7S, 7R:9S, 13R:3S, 3R:13S, 5R:11S, 11R:5S, and 1R:15S. These were modifications of the 15R:1S ratio expected for the inheritance of two dominant major clubroot resistance (CR) genes from ECD 02. The distorted segregation ratios suggest that the two resistance genes are on different chromosomes and that two genes interact in an epistatic manner to confer resistance. Genotyping was conducted with 144 PCR-based markers in the two F2 populations. Linkage and QTL analysis with the polymorphic markers identified two QTLs on chromosome A03 to be associated with resistance to P. brassicae pathotypes 5X and 5G in Popl#1 while only the second QTL on chromosome A03 was associated with resistance to pathotypes 5X and 5G in Popl#2. The QTLs clustered in genomic regions on the A03 chromosome of B. rapa where the CRa/CRbKato gene(s) are mapped. In addition, the Crr1 gene on the A08 chromosome of B. rapa was detected in the two F2 populations. Therefore, the phenotypic and molecular data confirm the existence of two CR genes in ECD 02. This is the first study that shows that major dominant genes in Brassica interact in a non-additive manner to confer resistance to different P. brassicae pathotypes.
Key Message: This study provides knowledge on the inheritance and type of gene action for clubroot resistance derived from Brassica rapa subsp. rapifera (ECD 02). The results indicated that duplicate recessive and recessive suppression epistatic interactions, digenic additivity and complementary gene action between the CRa/CRbKato gene(s) on the A03 and the Crr1 gene on the A08 chromosome of B. rapa controlled clubroot resistance to P. brassicae pathotypes 3H, 5X and 5G.
Clubroot is a soil-borne disease of the Brassicaceae caused by the obligate parasite Plasmodiophora brassicae. Disease development is associated with the formation of large galls on the roots of susceptible plants, which interfere with water and nutrient uptake and lead to significant yield losses in Brassica crops (Hwang et al., 2012; Dixon, 2014). Yield losses of 20–100% have been reported worldwide including in Canada (Tewari et al., 2005; Rahman et al., 2014), China (Chai et al., 2014), and India (Bhattacharya et al., 2014). The clubroot pathogen survives as resting spores that can persist in the soil for many years (Dixon, 2009). Given the longevity of P. brassicae in infested soils and the significant economic value of Brassica crops, the management of clubroot has been a focus of agricultural researchers for decades. In recent years, clubroot has emerged as an important constraint to canola (Brassica napus; oilseed rape) production in western Canada, further increasing interest in this disease (Strelkov and Hwang, 2014).
While many strategies have been employed for clubroot control (Hwang et al., 2014), the planting of clubroot resistance (CR) canola cultivars is the most effective and environmentally friendly approach to manage the disease (Rahman et al., 2014). The identification of effective resistance is the first step in breeding for this trait, with Brassica rapa (2n = 20, AA) considered a superior source of dominant major clubroot resistance genes than Brassica oleracea (2n = 18, CC) (Toxopeus et al., 1986; Hirai, 2006; Piao et al., 2009). Over the past 20 years, at least 15 CR genes have been identified in B. rapa, including CRa (Matsumoto et al., 1998), CRb (Piao et al., 2004), CRbKato (Kato et al., 2012, 2013), CRk (Matsumoto et al., 2012), Crr3 (Hirai et al., 2004; Saito et al., 2006), Rcr1 (Chu et al., 2014; Yu et al., 2016), CRc (Sakamoto et al., 2008; Matsumoto et al., 2012), Crr1, Crr2, Crr4 (Suwabe et al., 2003, 2006), CRd (Pang et al., 2018), BraA.Cr.a, BraA.Cr.b, BraA.Cr.c (Hirani et al., 2018), and CrrA5 (Nguyen et al., 2018). Clubroot resistance genes from B. rapa have been introgressed into several European B. napus oilseed cultivars, including ‘Mendel’ and ‘Tosca’ (Frauen, 1999).
In Canada, different Brasscia genotypes have been used as resistance donors in the breeding of CR canola/oilseed rape (B. napus). Fredua-Agyeman and Rahman (2016) found that the B. napus cultivar ‘Mendel’ contained one dominant CR gene effective against pathotype 3H of P. brassicae, as defined on the Canadian Clubroot Differential Set (Strelkov et al., 2018). This was the dominant pathotype in Alberta, Canada (Strelkov et al., 2006, 2007), at least prior to the introduction of CR canola cultivars beginning in 2009 (Strelkov et al., 2018). However, the planting of CR canola in short rotations over large acreages led to the rapid development of new pathotypes of P. brassicae (Strelkov et al., 2016, 2018), and ‘Mendel’ resistance was eroded and is no longer a good choice for breeding cultivars resistant to the new pathotypes. Rutabaga (Brassica napus ssp. napobrassica) is another potential donor of clubroot resistance genes. The rutabaga cultivars ‘Brookfield’ and ‘Polycross’ possessed excellent resistance to Canadian P. brassicae pathotypes 2, 3, 5, 6, and 8 (Hasan and Rahman, 2011, 2016; Hasan and Rahman, 2013). The ratio of resistant (R) to susceptible (S) in the F2 generation derived from crossing both Brookfield and Polycross with susceptible B. napus lines was 3R:1S while segregation in the test cross family of the latter deviated from a 1R:1S ratio. This suggested that CR in Brookfield was controlled by a single dominant gene while resistance in Polycross was more complex (Hasan and Rahman, 2011).
With the recent emergence of new pathotypes of P. brassicae and their ability to overcome clubroot resistance in most CR canola cultivars, additional sources of resistance are needed. The CRa resistance gene was first detected in the European Clubroot Differential (ECD) 02 (B. rapa ssp. rapifera line AAbbCC) (Buczacki et al., 1975; Matsumoto et al., 1998). Zhang et al. (2016) reported one marker (i3e4) that was tightly linked to CRa. While ECD 02 appears to be resistant to all P. brassicae pathotypes identified in Canada (Strelkov et al., 2006, 2018; Leboldus et al., 2012), and was used as a resistance source in studies from Japan (Hayashida et al., 2008; Sakamoto et al., 2008), its application in clubroot resistance breeding in Canada has not yet been reported. The objectives of the current study were to introgress clubroot resistance from ECD 02 (male parent) into two susceptible female B. rapa genotypes CR 2599 and CR 1505, to evaluate the genetic basis of resistance to three isolates of P. brassicae representing different pathotypes and identify molecular markers associated with resistance to the new pathotypes.
The parent B. rapa subsp. rapifera line AAbbCC (ECD 02) was resistant to all 17 P. brassicae pathotypes identified in Canada (Strelkov et al., 2018). In contrast, B. rapa accessions CR 2599 and CR 1505 (‘Emma’) were susceptible to these same pathotypes (Fredua-Agyeman et al., 2019) and served as the susceptible parents. ECD 02 is a winter-type while the two susceptible parents are spring-type.
To produce the F1 plants, genetic crosses were carried out between June 2016 and January 2017 by emasculation followed by hand-pollination, with the plants kept in a growth chamber maintained under an 18 h photoperiod and temperatures of 21/18°C (day/night). Vernalization of ECD 02 was carried out as described by Fredua-Agyeman et al. (2019). The susceptible parents were seeded much later to ensure that they flowered around the same time as ECD 02.
Seeding, vernalization and the self-pollination of single F1 plants to produce F2 seeds were carried out in a growth chamber, cold room and greenhouses, respectively, at the Crop Diversification Centre North, Alberta Agriculture and Forestry, Edmonton, Alberta from March 2017 to June 2018. The ECD 02 × CR 2599 and ECD 02 × CR 1505 derived F2 populations will be designated here as Popl#1 and Popl#2, respectively, for convenience.
Twenty-two P. brassicae field and single-spore isolates representing 17 unique pathotypes were used to screen 14–24 seedlings of ECD 02. The pathotypes (isolates indicated in parentheses) included: pathotype 2B (F183-14), 2F (SACAN-ss3), 3A (F3-14), 3D (F1-14), 3H (SACAN-ss1 and CDCN#4), 3O (F381-16), 5C (F175-14), 5G (CDCS and CDCN#6), 5I (ORCA-ss4 and CDCN#2), 5K (F10-15), 5L (F-360-13), 5X (LG-1, LG-2, and LG-3), 6M (AbtJE-ss1), 8E (F187-14), 8J (F12-15), 8N (ORCA-ss2), and 8P (UoA#37) (Xue et al., 2008; Strelkov et al., 2016, 2018). Pathotype designations follow the Canadian Clubroot Differential (CCD) Set (Strelkov et al., 2018).
The number of isolates used to screen the F1 seedlings depended on the number of seeds obtained from each cross. Five single-spore isolates (representing pathotypes 2F, 3H, 5I, 6M, and 8N) (Xue et al., 2008) and four field isolates [representing pathotypes 2B, 5X (LG-1), 5G (CDCS), and 8J] (Strelkov et al., 2016, 2018) were used to screen 25 F1 plants of the cross ECD 02 × CR 2599 (Popl#1). Two isolates [pathotypes 5X (LG-1) and 5G (CDCS)] were used to screen two F1 plants of the cross ECD 02 × CR1505 (Popl#2).
F2 plants of the two populations were screened with pathotypes 3H (predominant in Alberta and represented by the single-spore isolate SACAN-ss1), 5X (the first to overcome resistance in CR canola and represented by the field isolate LG-1; Strelkov et al., 2016), and 5G (represented by isolate CDCS, one of the most virulent isolates used in an earlier study; Fredua-Agyeman et al., 2019). Thus, segregating ratios in the two F2 populations (Popl#1 and Popl#2) × pathotypes 3H (SACAN-ss1), 5X (LG-1), and 5G (CDCS) (i.e., six combinations) were examined.
Isolates of P. brassicae were stored as galled roots at −20°C until needed. To prepare resting spore inoculum, the galls were homogenized in sterile distilled water in a Waring LB10G blender (Cole-Parmer) following Fredua-Agyeman et al. (2018). The resulting slurry was passed through eight layers of cheesecloth into a beaker to remove plant debris and other detritus, and the filtrate was collected. The resting spore concentration was estimated using a hemocytometer and adjusted to 1 × 10⁸ spores/mL with sterile distilled water. Inoculum was kept at 4°C and used within 24 h of preparation.
Seedlings were geminated in Petri dishes (100 mm × 15 mm) on moistened Whatman no. 1 filter paper for 7 days at room temperature and a 12 h photoperiod. Inoculations were carried using the root-dip method (Nieuwhof and Wiering, 1961; Strelkov et al., 2006), with additional inoculum added by the pipette method (Lamers and Toxopeus, 1977 as cited by Voorrips and Visser, 1993). Briefly, the rootlets were dipped into the pathogen resting spore suspension for about 10–20 s and then planted in 8 × 4 flat trays filled with Sunshine Mix #4 Aggregate Plus (Sun Gro Horticulture, Seba Beach, AB, Canada) potting medium. This was followed by pipetting 1 ml of inoculum and dispensing into the soil surrounding each seedling.
The seedlings were transferred to a greenhouse maintained at 20–25/15–18°C day/night with a 16 h photoperiod, and watered daily with slightly acidified water (pH ≈ 5.5–6.5, adjusted with HCL). Beginning at 3 weeks after inoculation, the plants were fertilized once a week with 20 N: 20 P: 20 K Classic Fertilizer with micronutrients (Plant Products Brampton, ON, Canada).
Eight weeks after inoculation, the plants were gently removed from the potting medium, washed in water, and assessed for clubroot severity on a 0–3 scale, where: 0 = no galls; 1 = a few small or bead-sized galls on <1/3 of the roots; 2 = medium galls on 1/3–2/3 of the roots, and 3 = large galls on >2/3 of the roots (Kuginuki et al., 1999; Xue et al., 2008). The susceptible B. napus ‘Westar’ was included as a positive control in all of the assays.
The segregating ratios in the two F2 populations (Popl#1 and Popl#2) × pathotypes 3H (SACAN-ss1), 5X (LG-1) and 5G (CDCS) (i.e., six combinations) were examined.
Three hundred sixty-eight leaves were collected from 46 F2 individuals resistant (disease score = 0) and 46 F2 individuals susceptible (disease score = 3) to each of pathotypes 5X and 5G of Popl#1 and Popl#2. Genomic DNA was extracted from the leaves of the parents and the 368 F2 individuals using the cetyltrimethyl ammonium bromide (CTAB) method (Sambrook and Russell, 2001). The DNA concentration was quantified with a ND-2000c spectrophotometer (NanoDrop Technologies, Inc., Wilmington, DE, United States) and the template DNA diluted to 20–25 ng/μL for PCR.
No molecular work was carried out on F2 plants inoculated with pathotype 3H (for the two populations) because almost all previous genetic mapping studies in Canada have utilized this pathotype. Therefore, molecular analyses were completed on four of the six plant population/P. brassicae pathotype combinations.
PCR amplification was carried out in a 12 μL reaction volume containing 2.5 μL of 5 × Taq buffer, 1.0 μL of 25 mM MgCl2, 0.25 μL of 10 mM dNTPs mix, 0.25 μL of 25 nM of each primer, 0.25 μL of 25 nM of fluorescently labeled M13 primer, 1.0 μL of 20–25 ng DNA template, and 1.25 U of Taq polymerase (Promega, Madison, WI, United States). The PCR cycling conditions consisted of an initial denaturation at 95°C for 5 min, followed by 35 cycles at 95°C for 1 min, 58°C for 1 min and 72°C for 1.5 min, and a final elongation step at 72°C for 10 min. Aliquots of the PCR products were analyzed on an ABI PRISM 3730 × l DNA analyzer (Applied Biosystems). Amplified products from resistant and susceptible plants which differed by >200 bp were separated on 3% agarose gels. The gels were stained with SYBR Safe DNA Gel Stain (Thermo Fisher Scientific, Carlsbad, CA, United States) and visualized with a Typhoon FLA 9500 Variable Mode Laser Scanner Image Analyzer (GE Healthcare Life Sciences, Mississauga, ON, Canada).
Bulk segregant analysis as described by Michelmore et al. (1991) was carried using 144 PCR-based markers with DNA of the parents and two resistant and two susceptible DNA bulks from each of the two F2 populations (Popl#1 and Pop#2). The markers included 13 markers spanning the A03 chromosome of B. rapa, 65 markers linked to six previously reported clubroot resistant genes: CRk, Crr3, CRb, CRbKato, CRa, and Crr1, as well as 66 markers designed in this study. Of the 66 markers, 50 were SSR markers designed from the identified QTL regions while the remaining 16 were designed based on the CRa gene sequence of Ueno et al. (2012). The polymorphic markers were used to genotype the parents as well as the 384 F2 individuals of Popl#1 and Pop#2, and a genotype matrix was constructed for pathotypes 5X and 5G for Popl#1 and Pop#2.
Genetic linkage analysis was performed for each of the four combinations using MAPMAKER/EXP 3.0 (Lincoln et al., 1992). The logarithm of odds (LOD) score was set for a minimum of 3.0 and a recombination fraction (O) of 0.40. The Kosambi map function was used to convert the recombination frequencies into genetic distances (in centimorgans, cM) (Kosambi, 1944). Genetic linkage maps were constructed using MapChart v. 2.32 (Voorrips, 2002). Inclusive Composite Interval Mapping-Additive (ICIM-ADD) and Single Marker Analysis (SMA) methods were performed based on stepwise regression of simultaneous consideration of all markers using the IciMapping software V4.1 with 1 cM walking speed, 1000 permutations and P < 0.05 (Meng et al., 2015). To confirm a QTL, Composite Interval Mapping (CIM) and SMA were performed at the same mapping parameters as the above (Churchill and Doerge, 1994) using WinQTL Cartographer software v2.5 (Wang et al., 2011). A definitive QTL was declared if peaks with LOD score ≥ 3.0 were identified at the same position by both the IciMapping software V4.1 and WinQTL Cartographer software V2.5. Smaller peaks in close proximity to major peaks were regarded as artifacts. The QTLs identified in this study were named using a modified gene nomenclature system for the Brassica genus proposed by Østergaard and King (2008). The QTL name was in the order genus (1 letter), species (2 letters), genome (1 letter), chromosome number (1 letter), pathotype name (3 letters), closest published gene(s) (3–6 letters), and QTL number (2 letters). The additive effects of individual QTLs and epistatic interaction (QTL × QTL) were estimated as the percentage of phenotypic variation explained (PVE) by the IciMapping software V.4.1 using the ICIM-ADD and ICIM-EPI methods, respectively.
To test for the inheritance of clubroot resistance in the two F2 populations, the phenotypic data from different crosses of the same parents were subjected to Chi-square (χ2) tests of homogeneity. In addition, individual data from the different crosses found to be uniform were pooled. The resulting data for each population were subjected to χ2 goodness-of-fit for different segregation ratios using SAS v. 9.4 (SAS Institute, United States).
In total, 98% (428 of 435) of ECD 02 plants inoculated with the 22 isolates of P. brassicae (representing 17 unique pathotypes) were completely free of clubroot symptoms (disease score = 0) 8 weeks after inoculation. Sixteen of the 22 isolates did not cause any symptoms at all (disease score = 0) on any plants, while very mild galling (disease score = 1) was observed on a single plant in response to inoculation with each of pathotypes 2B (F183-14), 5I (ORCA-ss4), 5X (F-359-13), 8N (ORCA-ss2), and 8J (F12-15). Two plants of ECD 02 inoculated with pathotype 5G (CDCS, Newell) developed moderate galling (disease score = 2).
Eleven plants of ECD 02 showing absolute resistance (disease score = 0) to pathotype 5G were used as donor parents in crosses with the two susceptible parents CR 2599 and CR 1509. The F1 plants produced from the two crosses were winter-types and required vernalization to induce flowering. Approximately 76% (25 of 33) and 25% (2 of 8) of the crosses carried out between ECD 02 and CR 2599 and CR 1509, respectively, resulted in siliques. Of the successful crosses, 24% (6 of 25) and 50% (1 of 2) produced 2–30 good quality rounded seeds per silique. All 27 of the F1 plants screened with P. brassicae (2–9 pathotypes) were resistant to the pathogen (23 disease score = 0, 4 disease score = 1) (Supplementary Table S1). The 23 F1 plants with a disease score = 0 were used as donors of clubroot resistance genes for the various crosses.
The development of two F2 mapping populations from the crosses between ECD 02 and the two susceptible parents is summarized in Figure 1. One thousand five hundred and forty-eight and 710 F2 individuals derived from 6 and 1 clubroot resistant F1 families from Popl#1 and Popl#2, respectively, were evaluated for resistance to the P. brassicae pathotypes 3H (SACAN-ss1), 5X (LG-1), and 5G (CDCS). The frequency distribution of disease scores to the three pathotypes in the two F2 populations is presented in Figure 2. All six distributions were bimodal, suggesting oligogenic or polygenic resistance to clubroot in the two F2 populations.
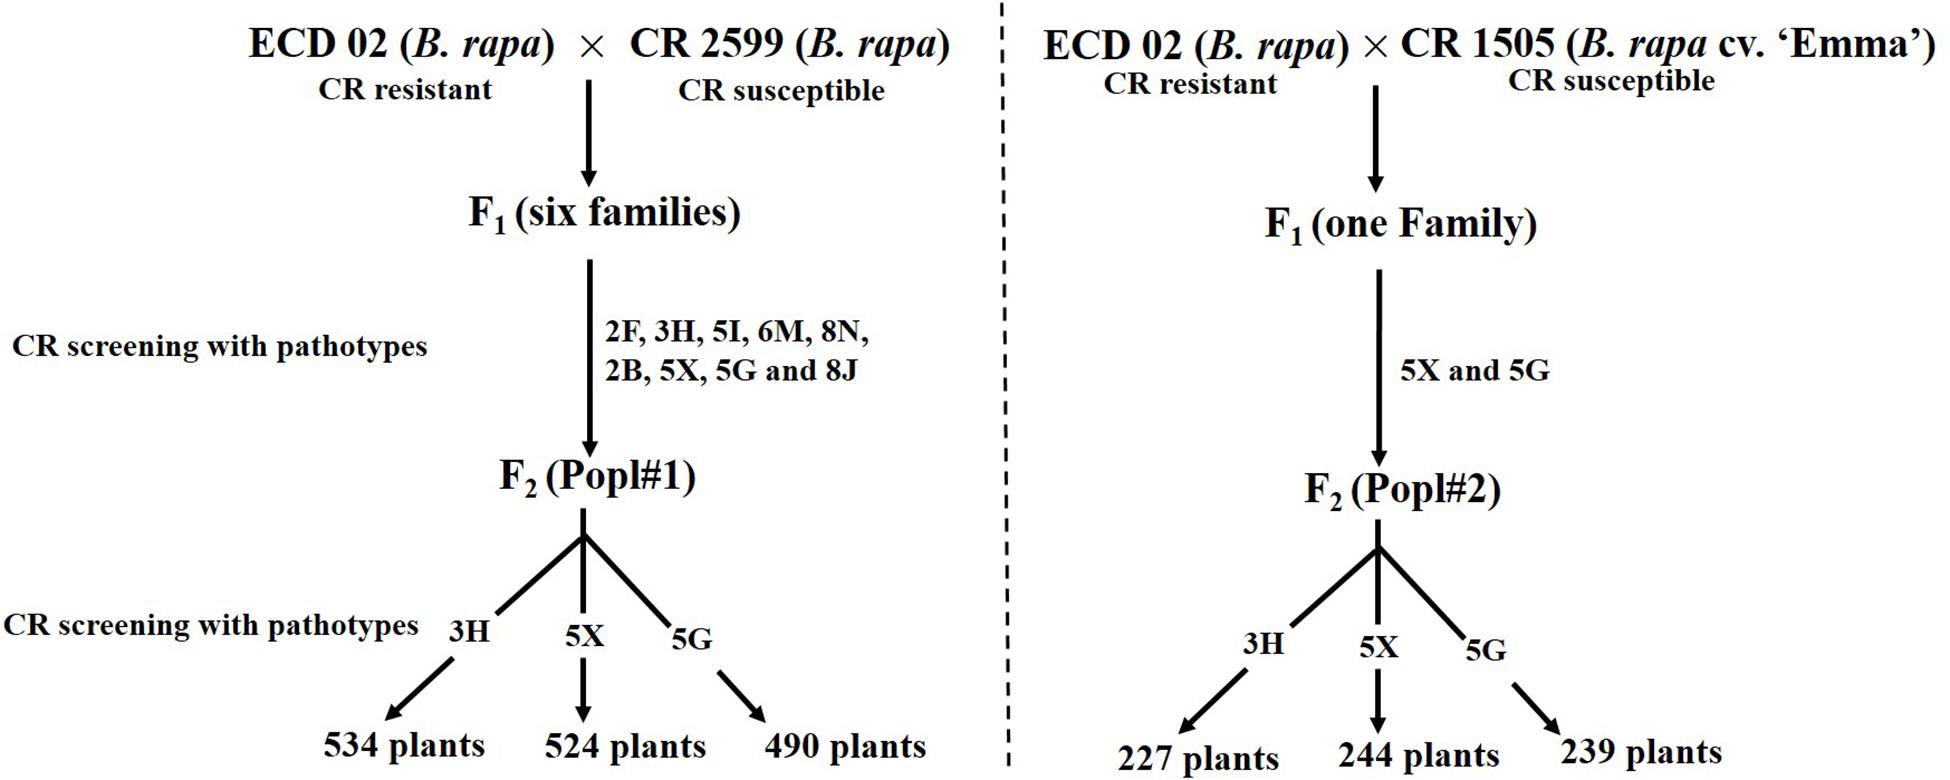
Figure 1. Development of F2 mapping population for the study of the inheritance pattern of clubroot resistance introgressed from ECD 02.
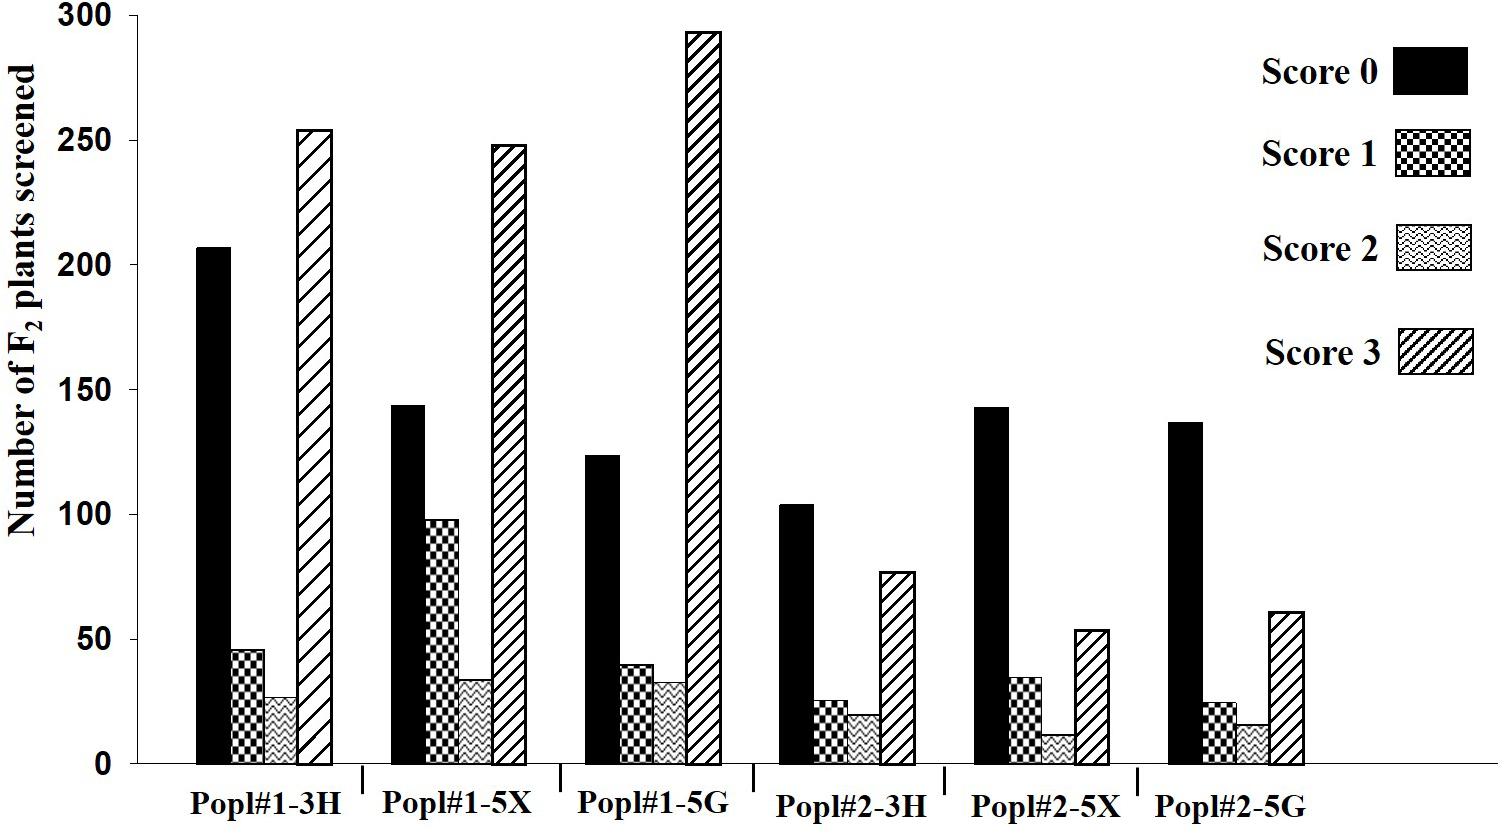
Figure 2. Frequency distribution of disease scores in two F2 populations (Popl#1 and Popl#2) derived from ECD 02 × CR 2599 and ECD 02 × CR 1505 (‘Emma’) to three Plasmodiophora brassicae pathotypes 3H, 5X, and 5G.
The χ2 tests of homogeneity indicated that the phenotypic data from the 534 F2 plants of Popl#1 inoculated with pathotype 3H and the 524 F2 plants inoculated with pathotype 5X were significantly different (P < 0.00001) and hence could not be pooled (Supplementary Tables S2, S3). In contrast, no significant differences were found in the phenotypic data from the 490 F2 plants of Popl#1 inoculated with pathotype 5G (Supplementary Table S4).
In the case of Popl#2, the 227, 244, and 239 F2 plants inoculated with pathotypes 3H, 5X, and 5G, respectively, were produced by self-pollination of a single F1 family from the cross ECD 02 × CR 1505 and hence, no χ2 tests of homogeneity were conducted. Instead, the F2 data for Popl#2 were tested directly for χ2 goodness-of-fit for different segregation ratios.
The segregation analysis was carried out in two ways. The first considered only those plants with a disease score = 0 as resistant (R), and all others as susceptible (S) (Tables 1, 2). The second considered plants with disease scores = 0 or 1 as R, and those with disease scores = 2 or 3 as S (Tables 1, 2). The Chi-square goodness of fit test showed that the segregation of clubroot resistance in the F2 populations largely deviated from the expected Mendelian segregation ratios of 3:1, 15:1, and 63:1 for resistance controlled by a single, two or three dominant genes, respectively. Instead, deviations from the normal ratios, such as those observed in the event of non-allelic or linked interactions, were obtained.
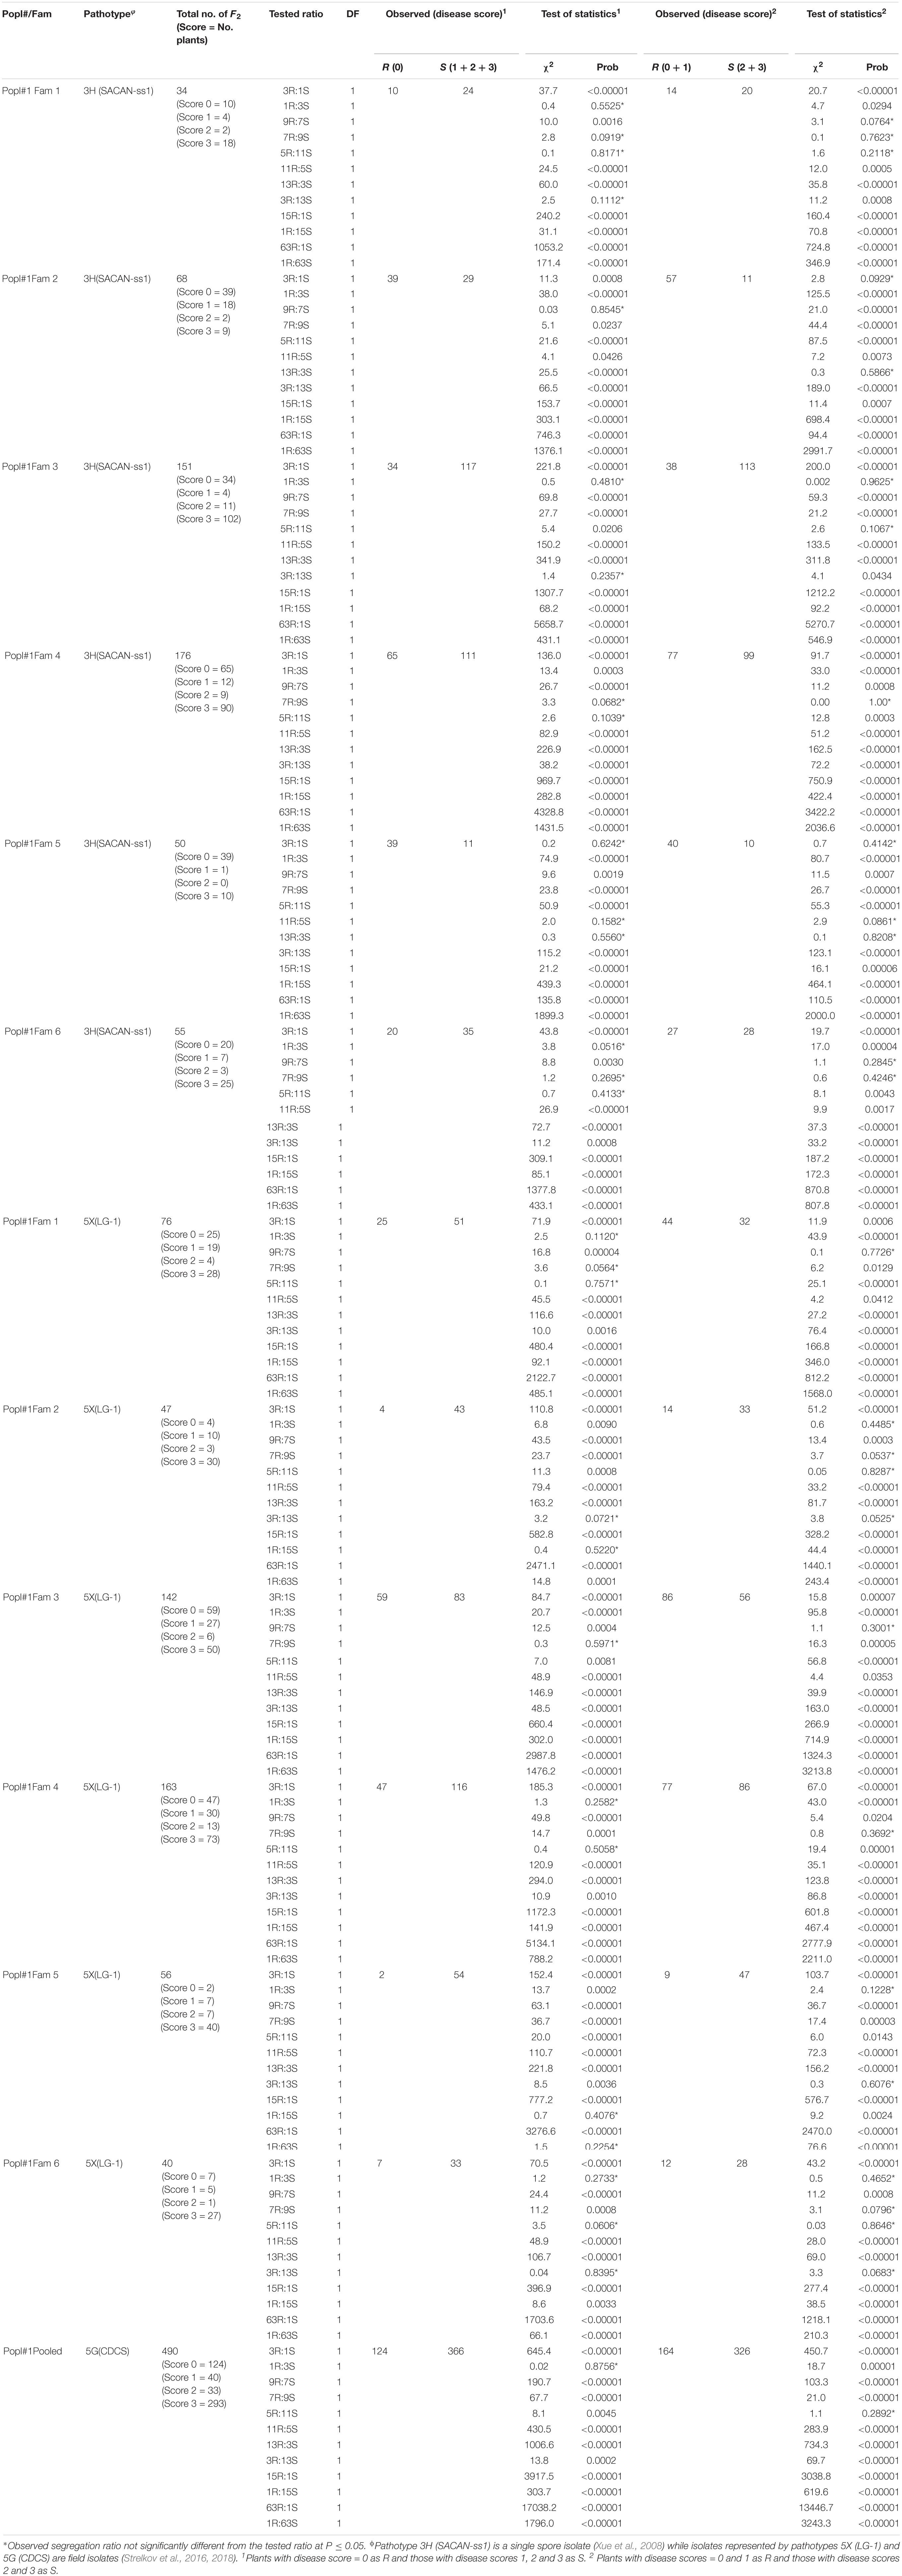
Table 1. Segregation ratios for ECD 02 × CR 2599 derived F2 population for resistance to clubroot under greenhouse conditions.
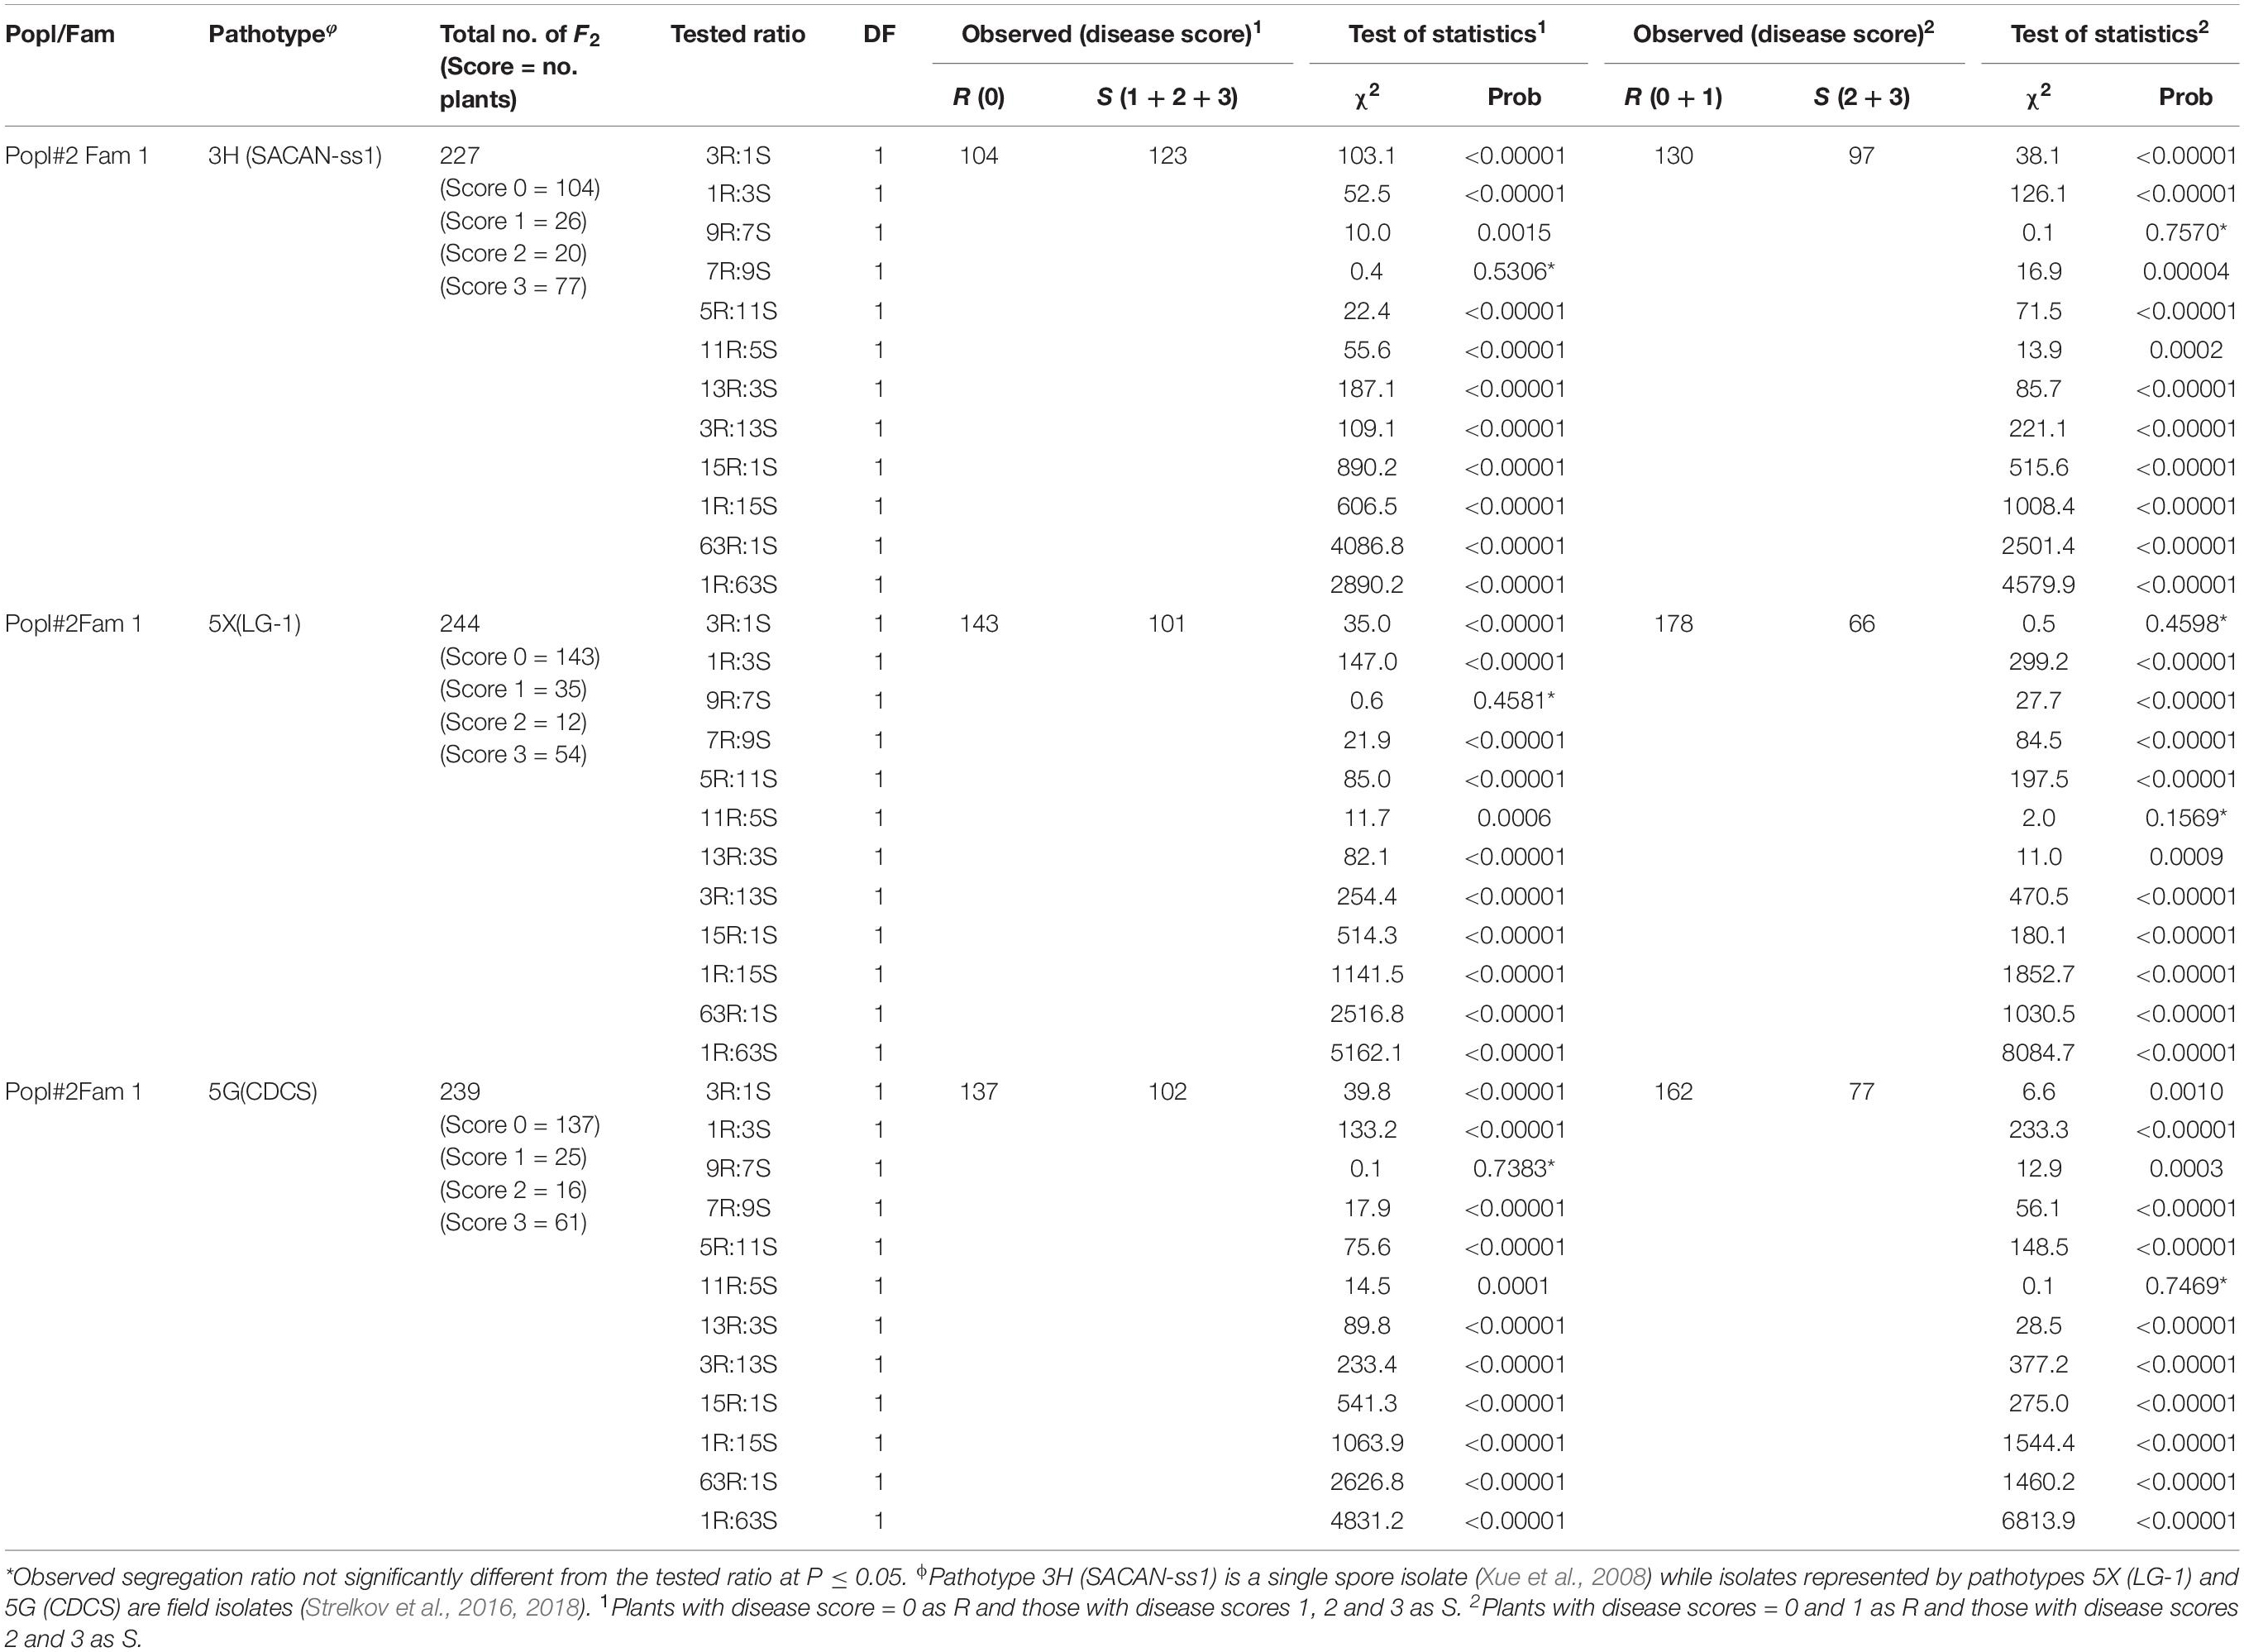
Table 2. Segregation ratios for ECD 02 × CR 1505 derived F2 population for resistance to clubroot under greenhouse conditions.
Sixty-eight and 50 plants of two of the six F2 families from Popl#1 inoculated with pathotype 3H fit the 3R:1S segregation ratio in addition to the 9R:7S, 13R:3S and or 11R:5S ratios (Table 1). Thirty-four, 151 and 55 F2 plants of three families exhibited segregation ratios of 1R:3S, 9R:7S, 7R:9S, 5R:11S, and 3R:13S to pathotype 3H while 176 F2 plants of one family exhibited segregation ratios of 7R:9S and 9R:7S (Table 1). Seventy-six, 47, 142, 163, 56, and 40 plants of the six F2 families of Popl#1 inoculated with pathotype 5X showed segregation ratios of 1R:3S, 9R:7S, 7R:9S, 5R:11S, 3R:13S, 1R:15S, and 1R:63S (Table 1). Finally, all 490 (pooled data for the six F2 families) F2 plants of Popl#1 inoculated with pathotype 5G fit a 1R:3S and 5R:11S segregation ratio (Table 1). About 73.2% of the observed segregation ratios were 9R:7S, 7R:9S, 11R:5S, 5R:11S 13R:3S, 3R:13S, and 1R:15S.
In the case of Popl#2, the 227 F2 plants (derived from a single cross) inoculated with pathotype 3H gave a good fit for 9R:7S and 7R:9S (Table 2). Three ratios, 3R:1S, 9R:7S, and 11R:5S could fit the data obtained with the 244 F2 plants inoculated with pathotype 5X. Ratios of 9R:7S and 11R:5S segregation ratios could fit the data for the 239 F2 plants inoculated with pathotype 5G (Table 2). About 85.7% of the observed segregation ratios were 9R:7S, 7R:9S, and 11R:5S. Overall, 74.6% of the observed segregation ratios were deviations from 15R:1S segregation ratio expected if two major genes controlled clubroot resistance.
Of 144 PCR-based markers screened by bulk segregant analysis, 49 markers detected polymorphism between the parents of Popl#1 (i.e., ECD 02 and CR 2599), while 45 markers detected polymorphism between the parents of Popl#2 (i.e., ECD 02 and CR 1505). Twenty-seven of the 49 and 23 of the 45 markers detected polymorphisms in Popl#1 and Popl#2, respectively. Sixteen (14 from A03 + 2 from A08) of these markers detected polymorphism in the two F2 populations, while 11 and 7 markers detected polymorphism only in Pop#1 and Popl#2, respectively. Table 3 provides the sequence information and origin of the 34 (16 + 11 + 7) polymorphic markers used to genotype the two F2 populations.
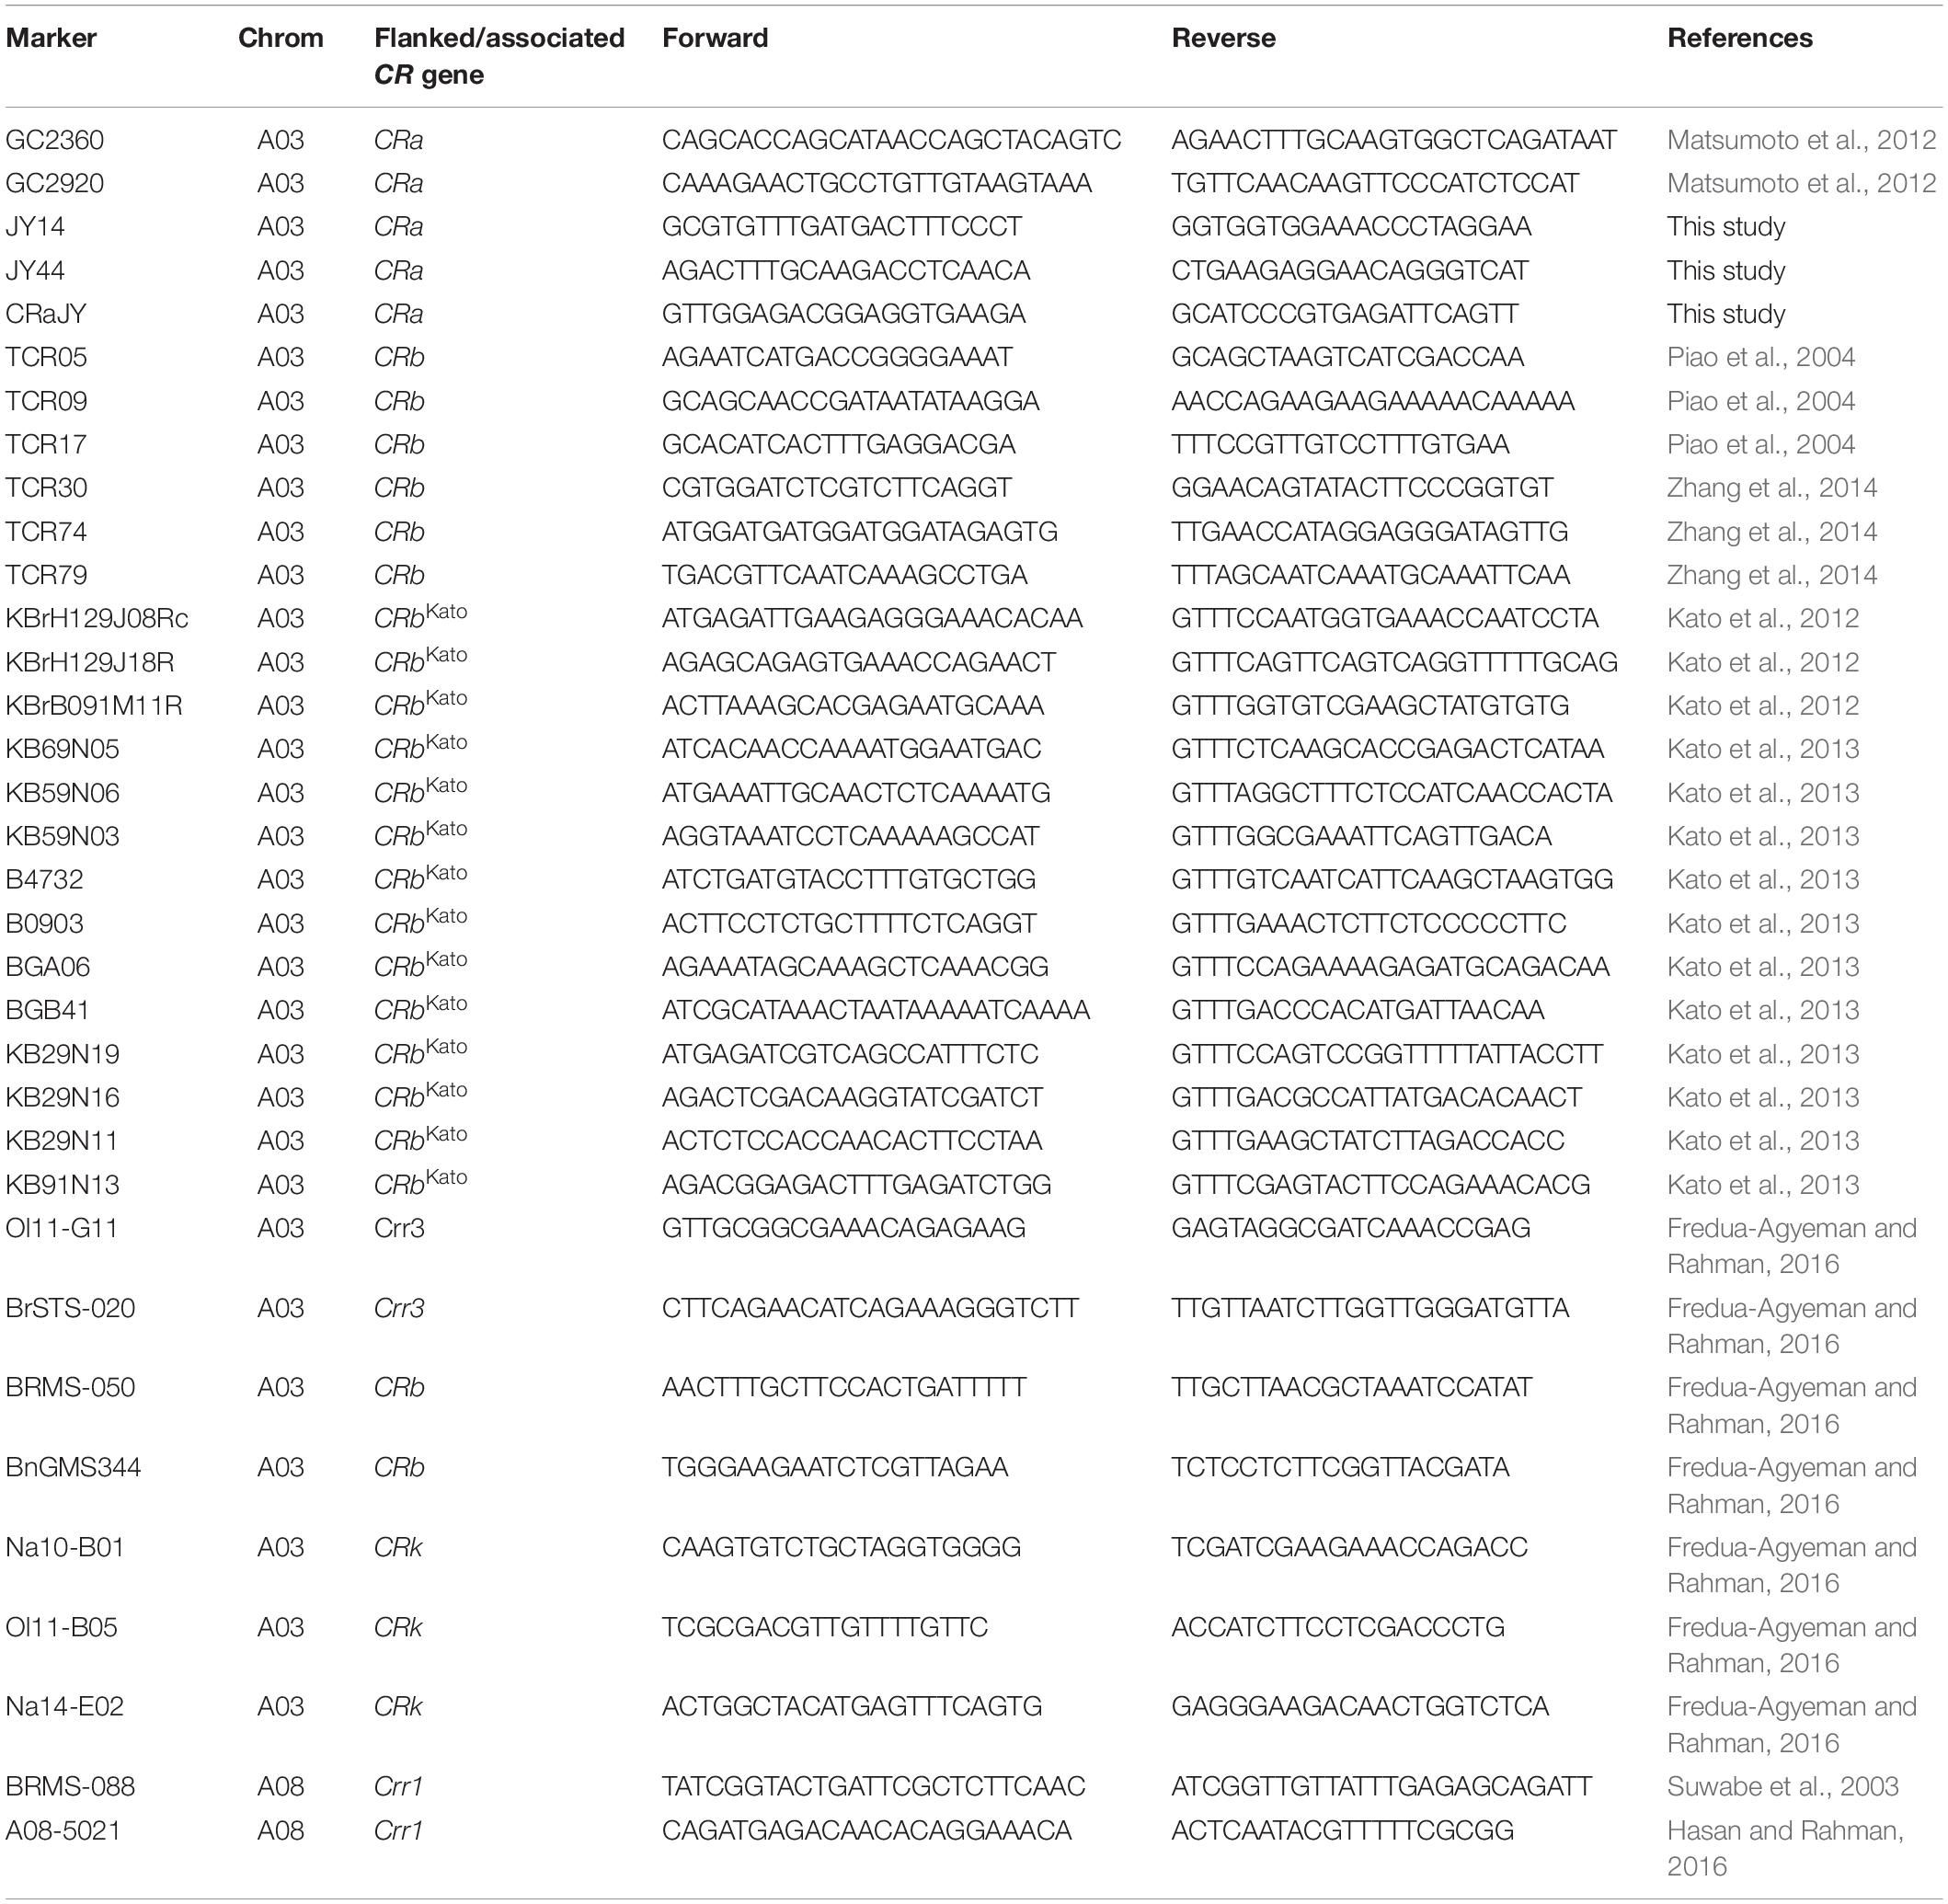
Table 3. List of polymorphic markers used for linkage map construction and QTL analysis.
At a LOD threshold of 3.0 and a recombination fraction (O) of 0.40, 14 of the 25 A03 chromosome markers used to screen the F2 plants of Popl#1 inoculated with pathotype 5X were linked, while 11 of the A03 chromosome markers remained unlinked. Based on the ICIM-ADD method, two QTLs from the A03 chromosome of B. napus were detected for resistance to pathotype 5X. The SSR markers KB69N05 and B4732 flanked the first QTL BraA3P5X.CRa/bKato1.1 [LOD score = 3.6, located between 13.4 and 21.3 cM on Figure 3A and ≈24274312–24348056 base pairs (bp) on the physical map of B. napus]. The SSR markers BGA06 and KB29N19 bordered the second QTL BraA3P5X.CRa/bKato1.2 (LOD score = 15.9, located between 33.8–41.2 cM on Figure 3A and ≈24426905–24637310 bp on the physical map of B. napus). These two QTLs explained 4.5 and 51.0% of the phenotypic variance, respectively. Single Marker Analysis (SMA) by the IciMapping software showed that the SCAR marker GC2360-1 had the highest LOD and PVE (phenotypic variation explanation) scores of 14.2 and 48.9%, respectively, followed by marker KB59N06 with a LOD and PVE scores of 5.7 and 23.8%, respectively. Overall, the linked markers explained 55.4 and 72.7% of the phenotypic variance with the ICIM-ADD and SMA methods, respectively.
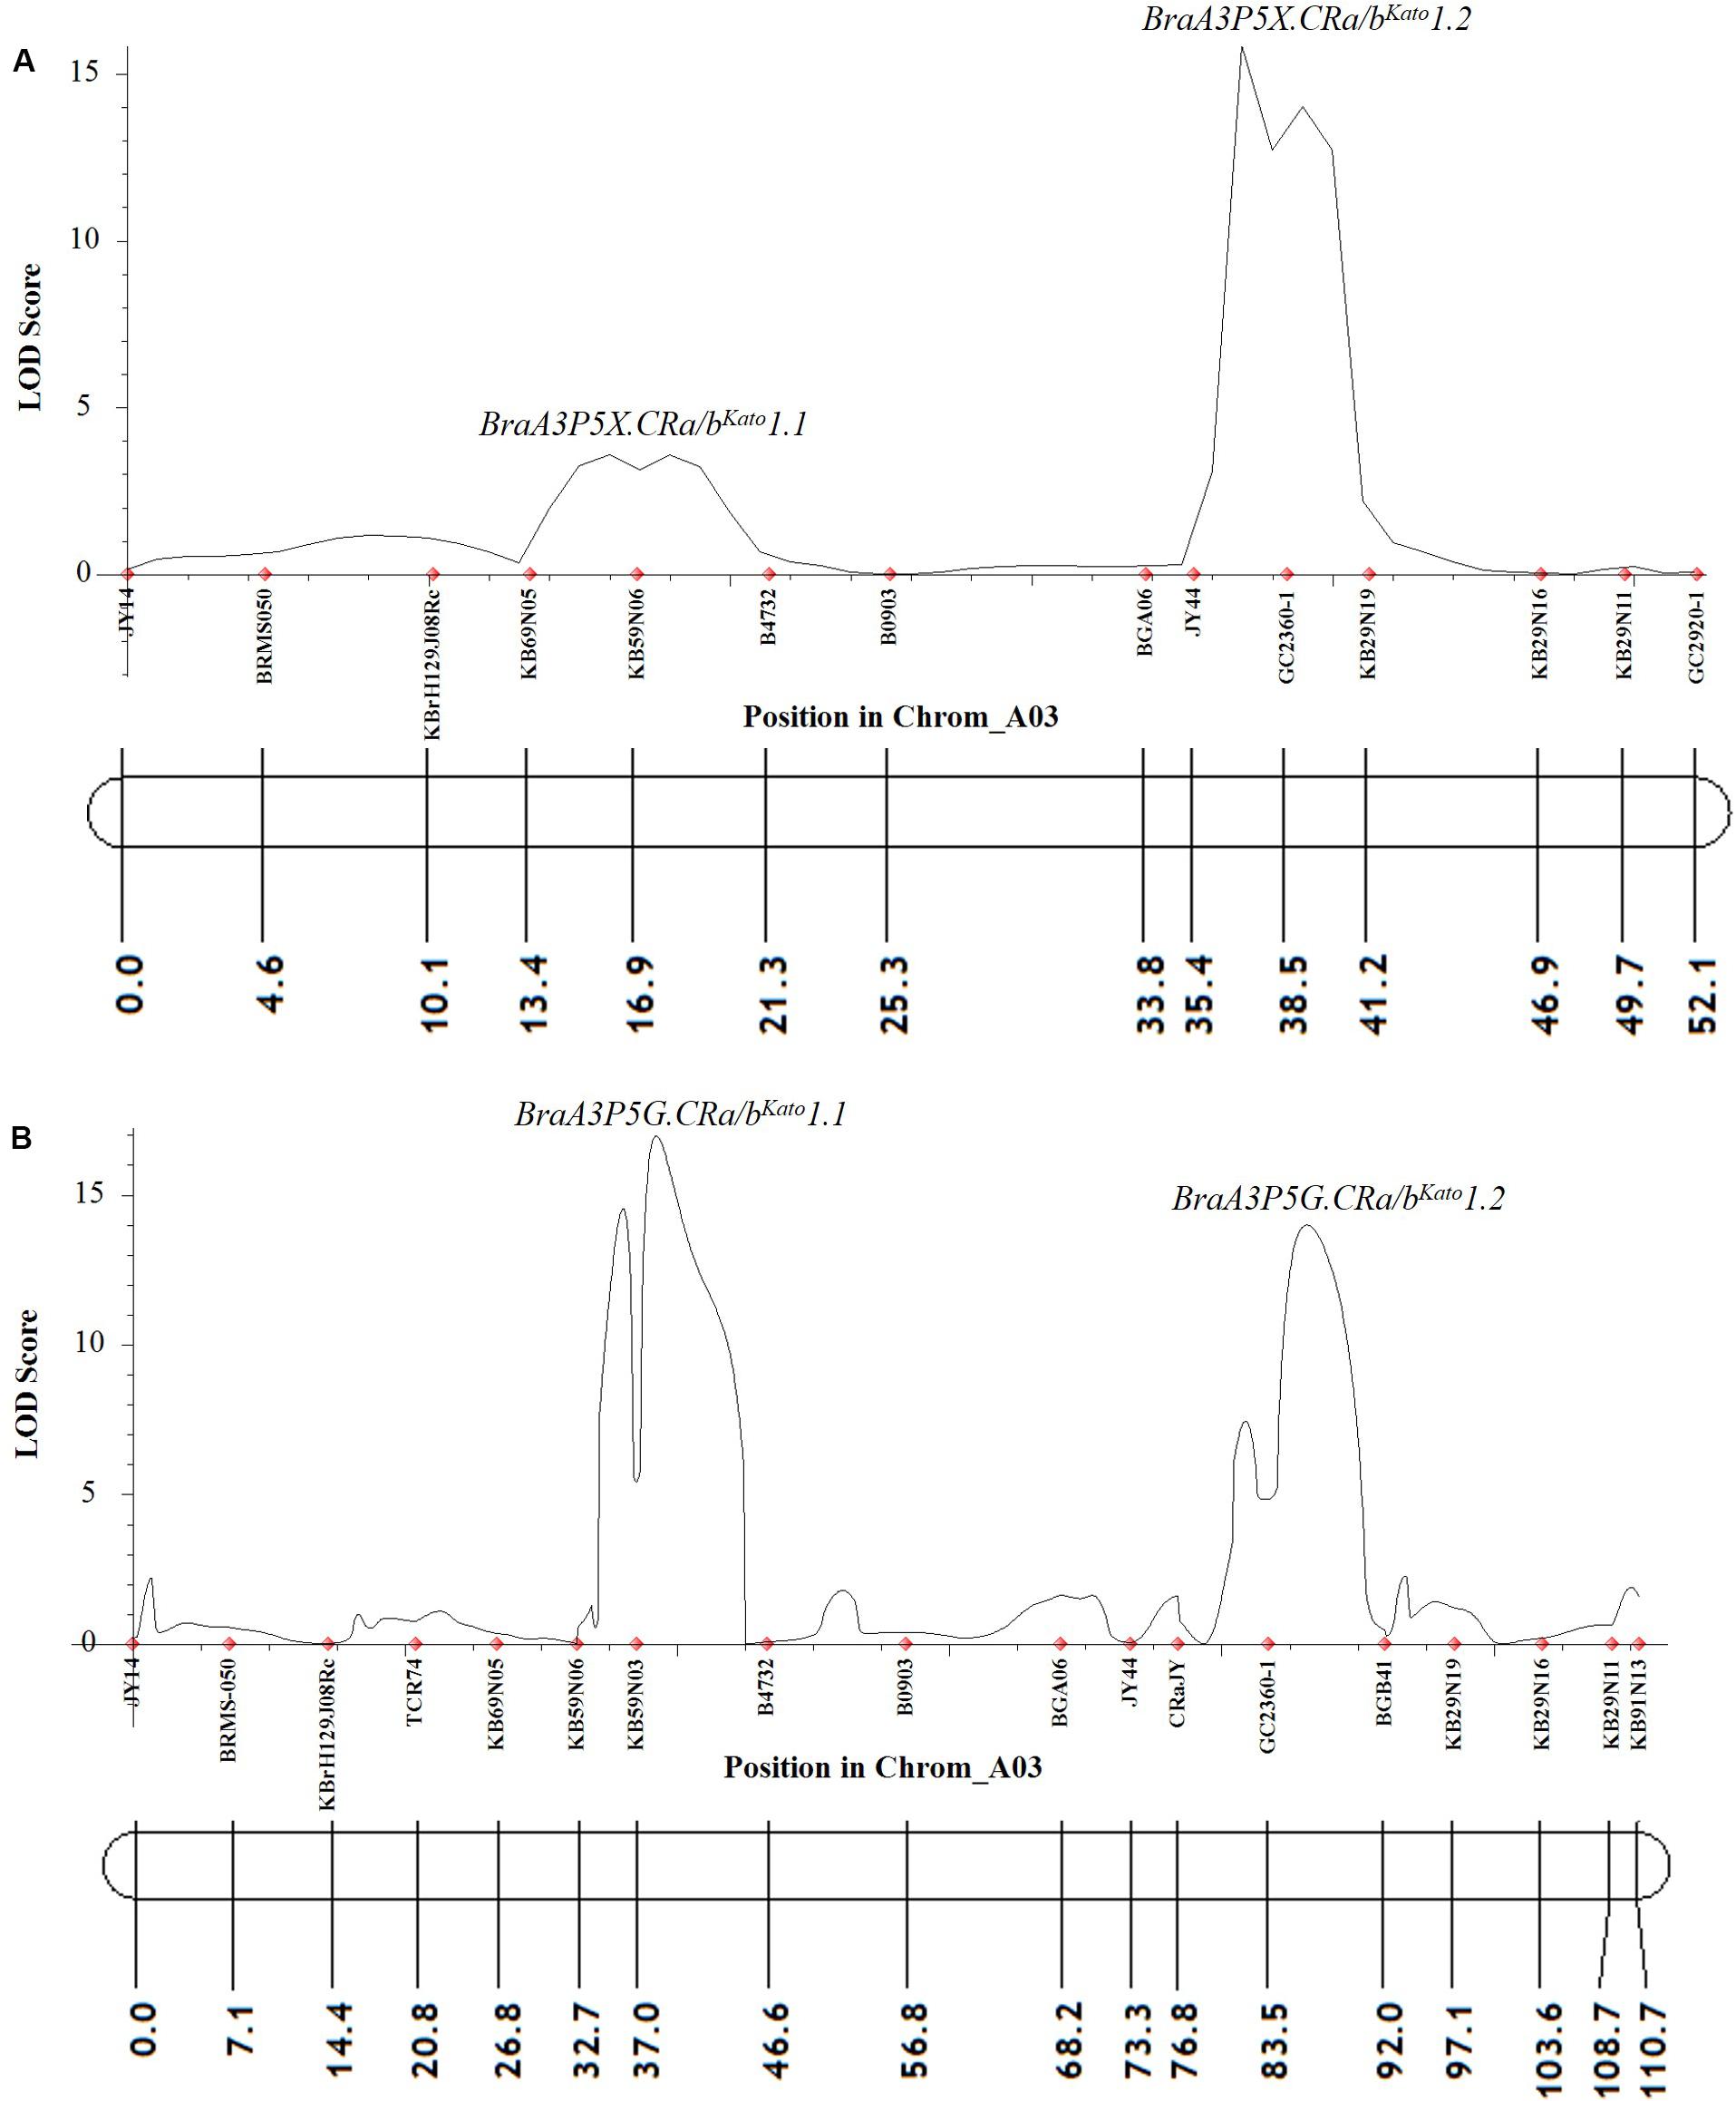
Figure 3. QTL likelihood profile and partial linkage map of the A03 chromosome of Brassica napus and Brassica rapa showing resistance to P. brassicae pathotypes 5X (A) and 5G (B) in Popl#1. The LOD scores are indicated on the y-axis while the marker names and the genetic distances (in cM) are indicated on the x-axis. Two QTLs were detected for resistance to pathotypes 5X (A) and 5G (B). The first QTL (BraA3P5X.CRa/bKato1.1 and BraA3P5G.CRa/bKato1.1) was detected in the genomic region where the CRbKato gene was mapped (Kato et al., 2012, 2013) while the second QTL (BraA3P5X.CRa/bKato1.2 and BraA3P5G.CRa/bKato1.2) was detected in the genomic region where the CRa gene was mapped (Matsumoto et al., 1998, 2012; Hayashida et al., 2008; Ueno et al., 2012).
Similarly, in the F2 plants from Popl#1 inoculated with pathotype 5G, 18 of the 25 markers on the A03 chromosome were linked, while three of the markers remained unlinked. The ICIM-ADD method identified two QTLs from the A03 chromosome of B. napus for resistance to pathotype 5G. The SSR markers KB59N06 and B4732 bordered the first QTL BraA3P5G.CRa/bKato1.1 (LOD score = 17.0, located between 32.7–46.6 cM on Figure 3B and ≈24262454–24348056 bp on the physical map of B. napus). The SSR markers CRaJY and BGB41 flanked the second QTL BraA3P5G.CRa/bKato1.2 (LOD score = 14.0, located between 76.8–92.0 cM on Figure 3B and ≈ 24557499–24579679 bp on the physical map of B. napus). These two QTLs explained 23.3 and 21.8% of the phenotypic variance, respectively. The SMA by the IciMapping software showed that SSR marker KB59N03 had the most significant association with LOD and PVE scores of 6.8 and 27.4%, respectively. This was followed by marker GC2360-1 with LOD and PVE scores of 6.3 and 25.7%, respectively. Overall, based on the IciMapping software and using the ICIM-ADD and SMA methods, the PVE by the linked markers was 45.2 and 53.1%, respectively.
For Popl#2 F2 plants inoculated with pathotype 5X and 5G, the linkage analysis revealed that almost all (at least 19 of the 21) of the polymorphic markers on the A03 chromosome were linked. However, only the QTLs BraA3P5X.CRa/bKato1.2 and BraA3P5G.CRa/bKato1.2 were detected for resistance by the ICIM-ADD method in the case of the F2 plants of Popl#2 inoculated with pathotype 5X (LOD score = 16.7, Figure 4A) and 5G (LOD score = 17.4, Figure 4B), respectively. The QTL was located in the interval between SSR markers CRaJY and KB29N19 in the genomic region located approximately 24557499–24637310 bp on the physical map of B. napus. The percent of phenotypic variance explained by the ICIM-ADD method was 35.6 and 32.5% for the F2 plants inoculated with pathotype 5X and 5G, respectively. The SMA by the IciMapping software showed that SSR marker GC2360-1 had the most significant association in response to infection by P. brassicae pathotypes 5X and 5G. The LOD scores for the SMA was 6.6 and 4.7 for the F2 plants inoculated with pathotype 5X and 5G while the PVE scores was 27.0 and 29.3%, for pathotype 5X and 5G, respectively.
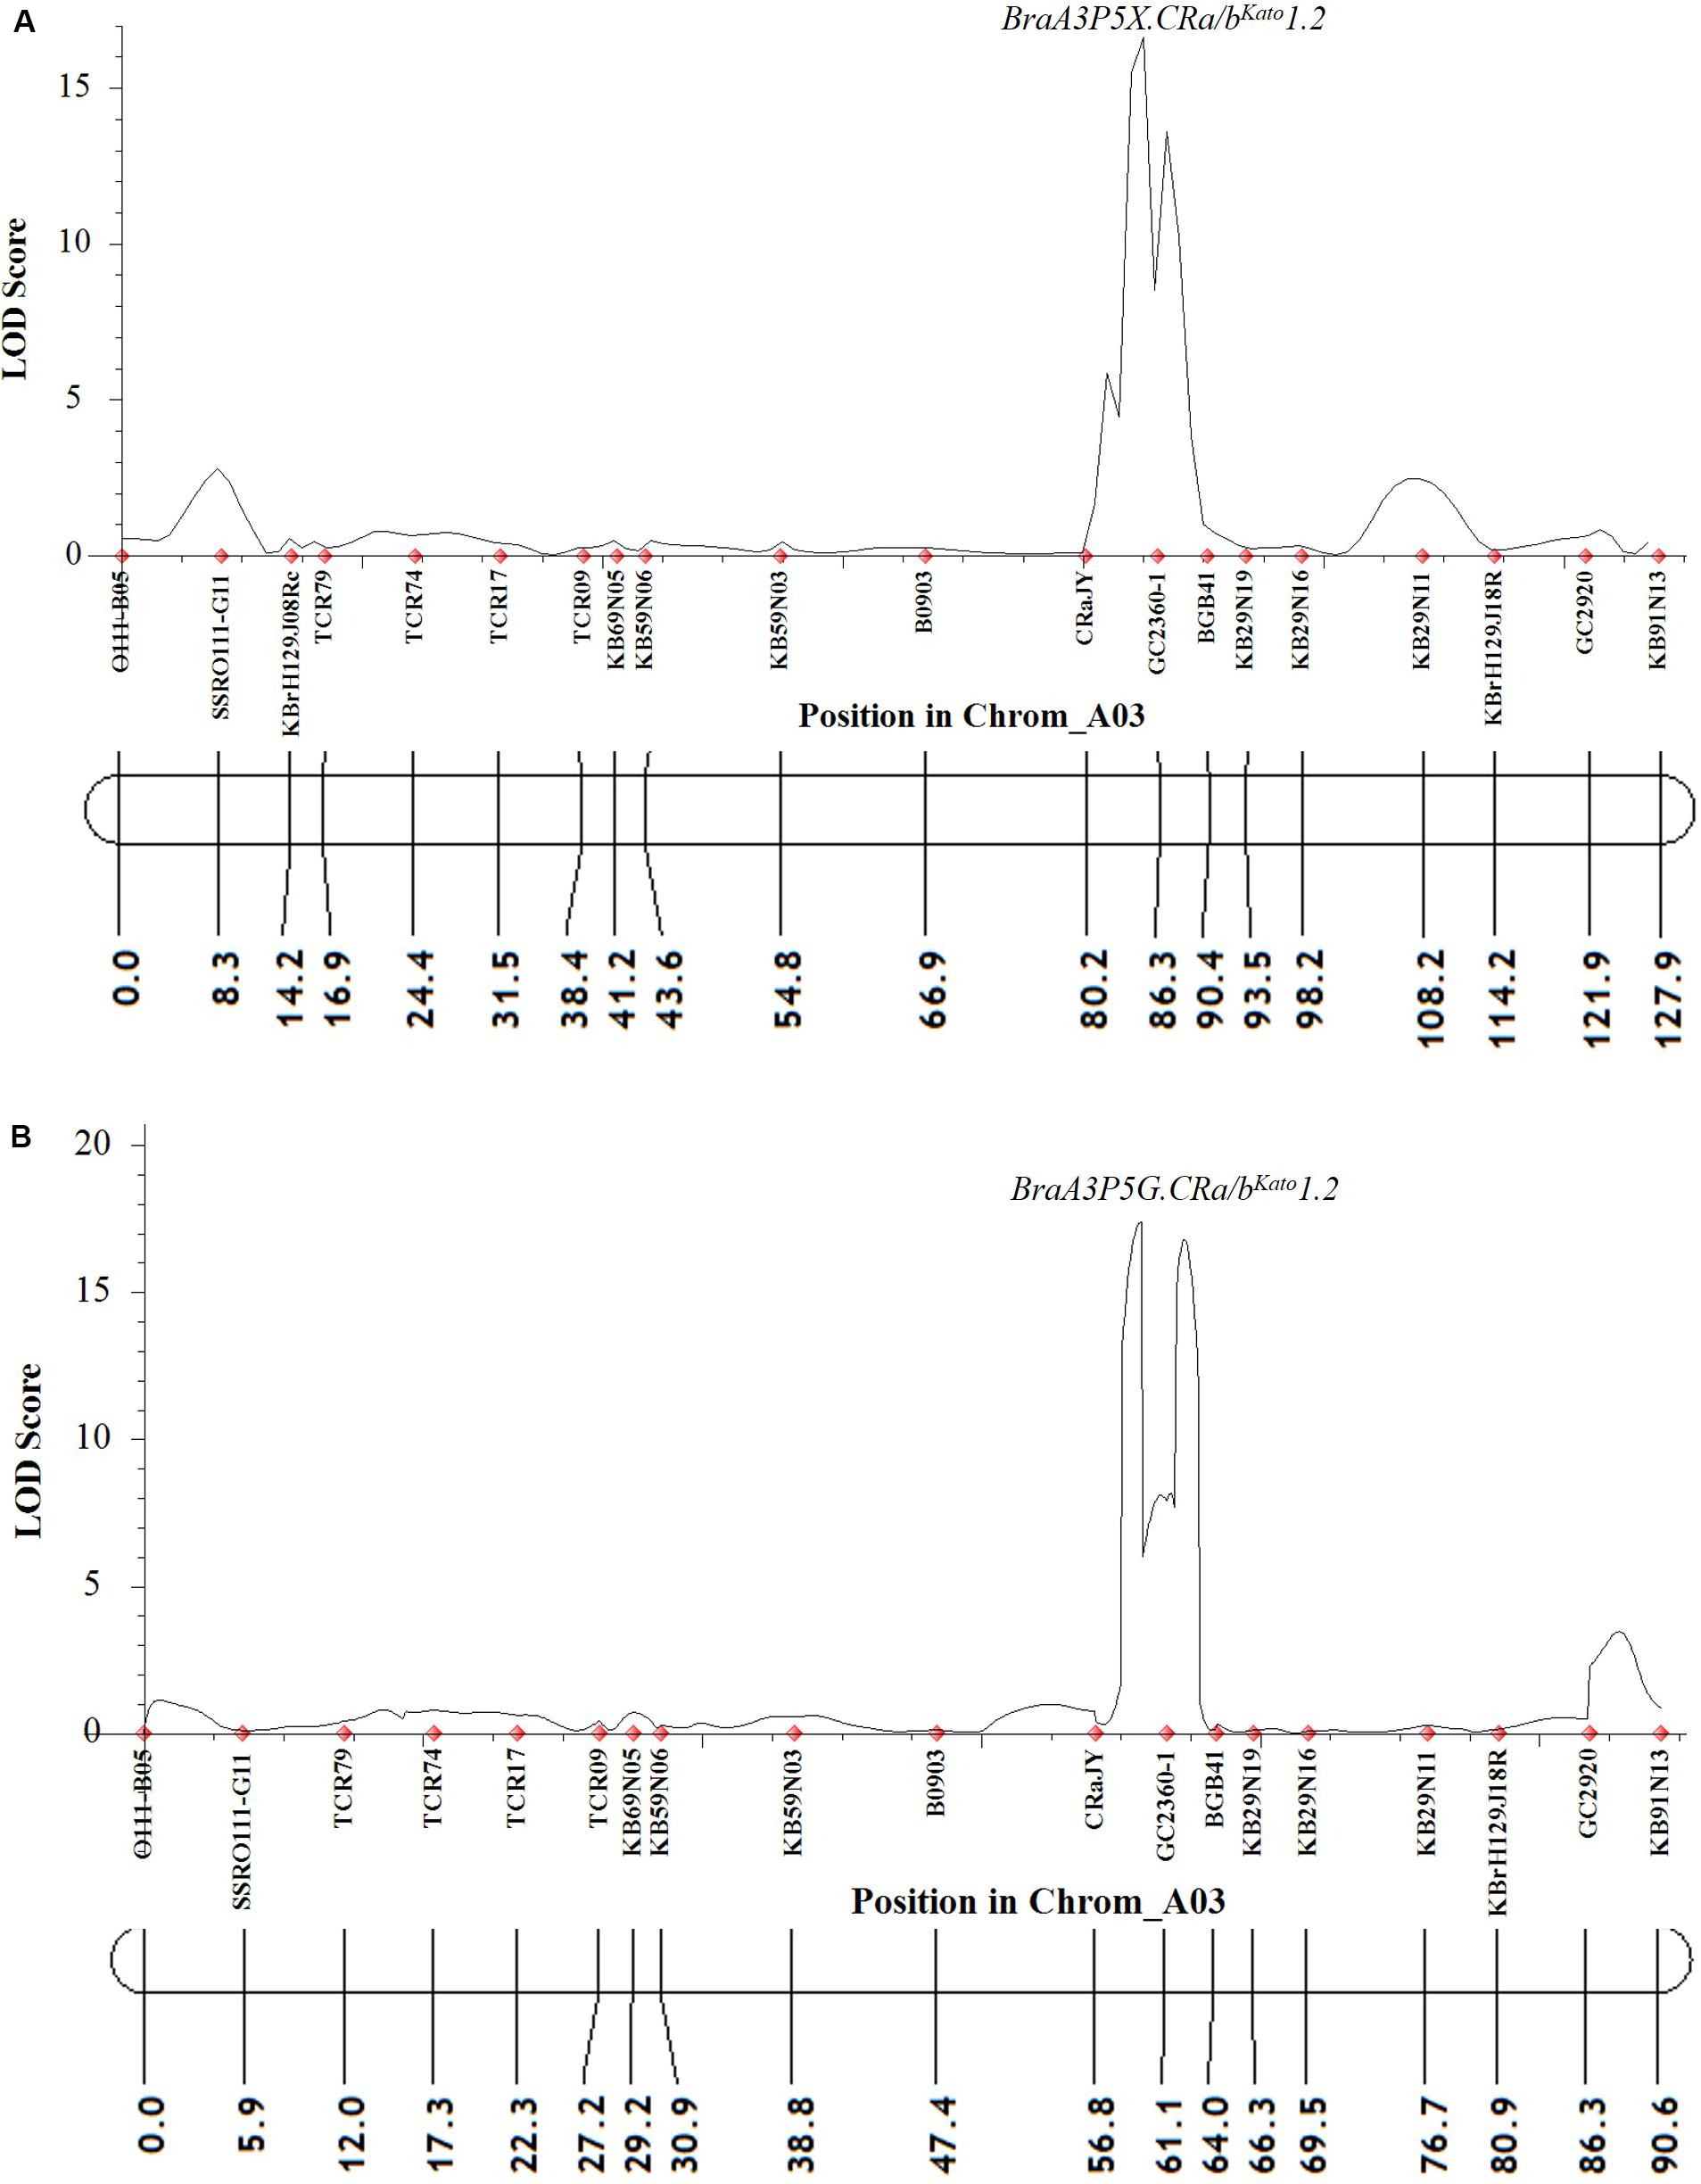
Figure 4. QTL likelihood profile partial linkage map of the A03 chromosome of B. napus and B. rapa showing resistance to two P. brassicae pathotypes 5X (A) and 5G (B) in Popl#2. Pathotypes 5X and 5G used in the inoculation experiments could overcome clubroot resistance in commercial canola cultivars (Strelkov et al., 2016, 2018). The LOD scores are indicated on the y-axis while the marker names and the genetic distances (in cM) are indicated on the x-axis. Only one QTL (BraA3P5X.CRa/bKato1.2 and BraA3P5G.CRa/bKato1.2) was detected for resistance to pathotypes 5X (A) and 5G (B). This QTL was detected in genomic regions of the A03 chromosome of B. napus and B. rapa where the CRa/CRbKato gene(s) was reported (Matsumoto et al., 1998, 2012; Hayashida et al., 2008; Kato et al., 2012, 2013; Ueno et al., 2012).
The LOD profiles and PVE determined by the CIM and SMA methods implemented in the WinQTL Cartographer software for the F2 plants from Popl#1 and Popl#2 inoculated with pathotypes 5X and 5G showed the same pattern as those determined with the IciMapping software (Supplementary Figures S1, S2). For example, the LOD score values for BraA3P5X.CRa/bKato1.1 and BraA3P5X.CRa/bKato1.2 for pathotype 5X were 4.2 and 8.2, respectively for the CIM method compared with 3.6 and 15.9 by the ICIM-ADD method. The LOD score values for BraA3P5G.CRa/bKato1.1 and BraA3P5G.CRa/bKato1.2 for pathotype 5G were 21.3 and 6.5, respectively for the CIM method compared with 17.0 and 14.0 by the ICIM-ADD method. In the case of Popl#2, the LOD scores for the QTLs BraA3P5X.CRa/bKato1.2 and BraA3P5G.CRa/bKato1.2 were 6.2 and 6.9 for pathotypes 5X and 5G, respectively, for the CIM method compared with 16.7 and 17.4 by the ICIM-ADD method. Thus, the LOD scores determined with the ICIM software were in general about two times higher than the values obtained with the WinQTL cartographer software.
Recombination between the markers KB59N06 (BraA3P5X.CRa/bKato1.1) and KB59N03 (BraA3P5G.CRa/bKato1.1) which had the most significant association with clubroot resistance in the F2 plants of Popl#1 inoculated with pathotypes 5X and 5G was 21.6 and 20.8%, respectively. Recombination in SSR marker GC2360-1(BraA3P5X.CRa/bKato1.2 and BraA3P5G.CRa/bKato1.2), which showed the most significant association with clubroot resistance in the F2 plants of Popl#1 and Popl#2 inoculated with pathotypes 5X and 5G ranged from 11.5 to 18.8% and 12.5 to 22.9%, respectively. In the case of the two co-segregating markers on the A08 chromosome, recombination between the BRMS-088 allele and clubroot resistance in the F2 plants of Popl#1 inoculated with pathotype 5X and 5G was 10.4 and 15.6%, respectively. Similarly, recombination between marker allele and phenotype was 7.3 and 25.0% in the F2 plants of Popl#2 inoculated with pathotype 5X and 5G, respectively. Recombination between the SSR marker A08-5021 allele and clubroot resistance in the F2 plants of Popl#1 inoculated with pathotypes 5X and 5G was 9.4 and 28.1%, respectively, while the recombination in Popl#2 was 7.3 and 11.5%, respectively. Thus, the recombination between the two A08 markers and clubroot resistance to pathotype 5X was much smaller (7.3–10.4%) compared with that for resistance to pathotype 5G (11.5–28.1%).
The additive effects detected by the IciMapping and the WinQTL cartographer software were positive for the QTLs, which suggested that the alleles conferring clubroot resistance were derived from the resistant parent ECD 02. Epistatic interaction (Q × Q) analysis showed PVE at levels ranging from 0.0 to 17.6% for the A03 × A03 QTLs, 35.6–53.4% for the A03 × A08 QTLs and 25.8–37.3% for the A08 × A08 QTLs. The results of the epistatic QTL analysis (Figure 5) suggested that genes from both the A03 and the A08 chromosomes are needed for resistance to be effective.
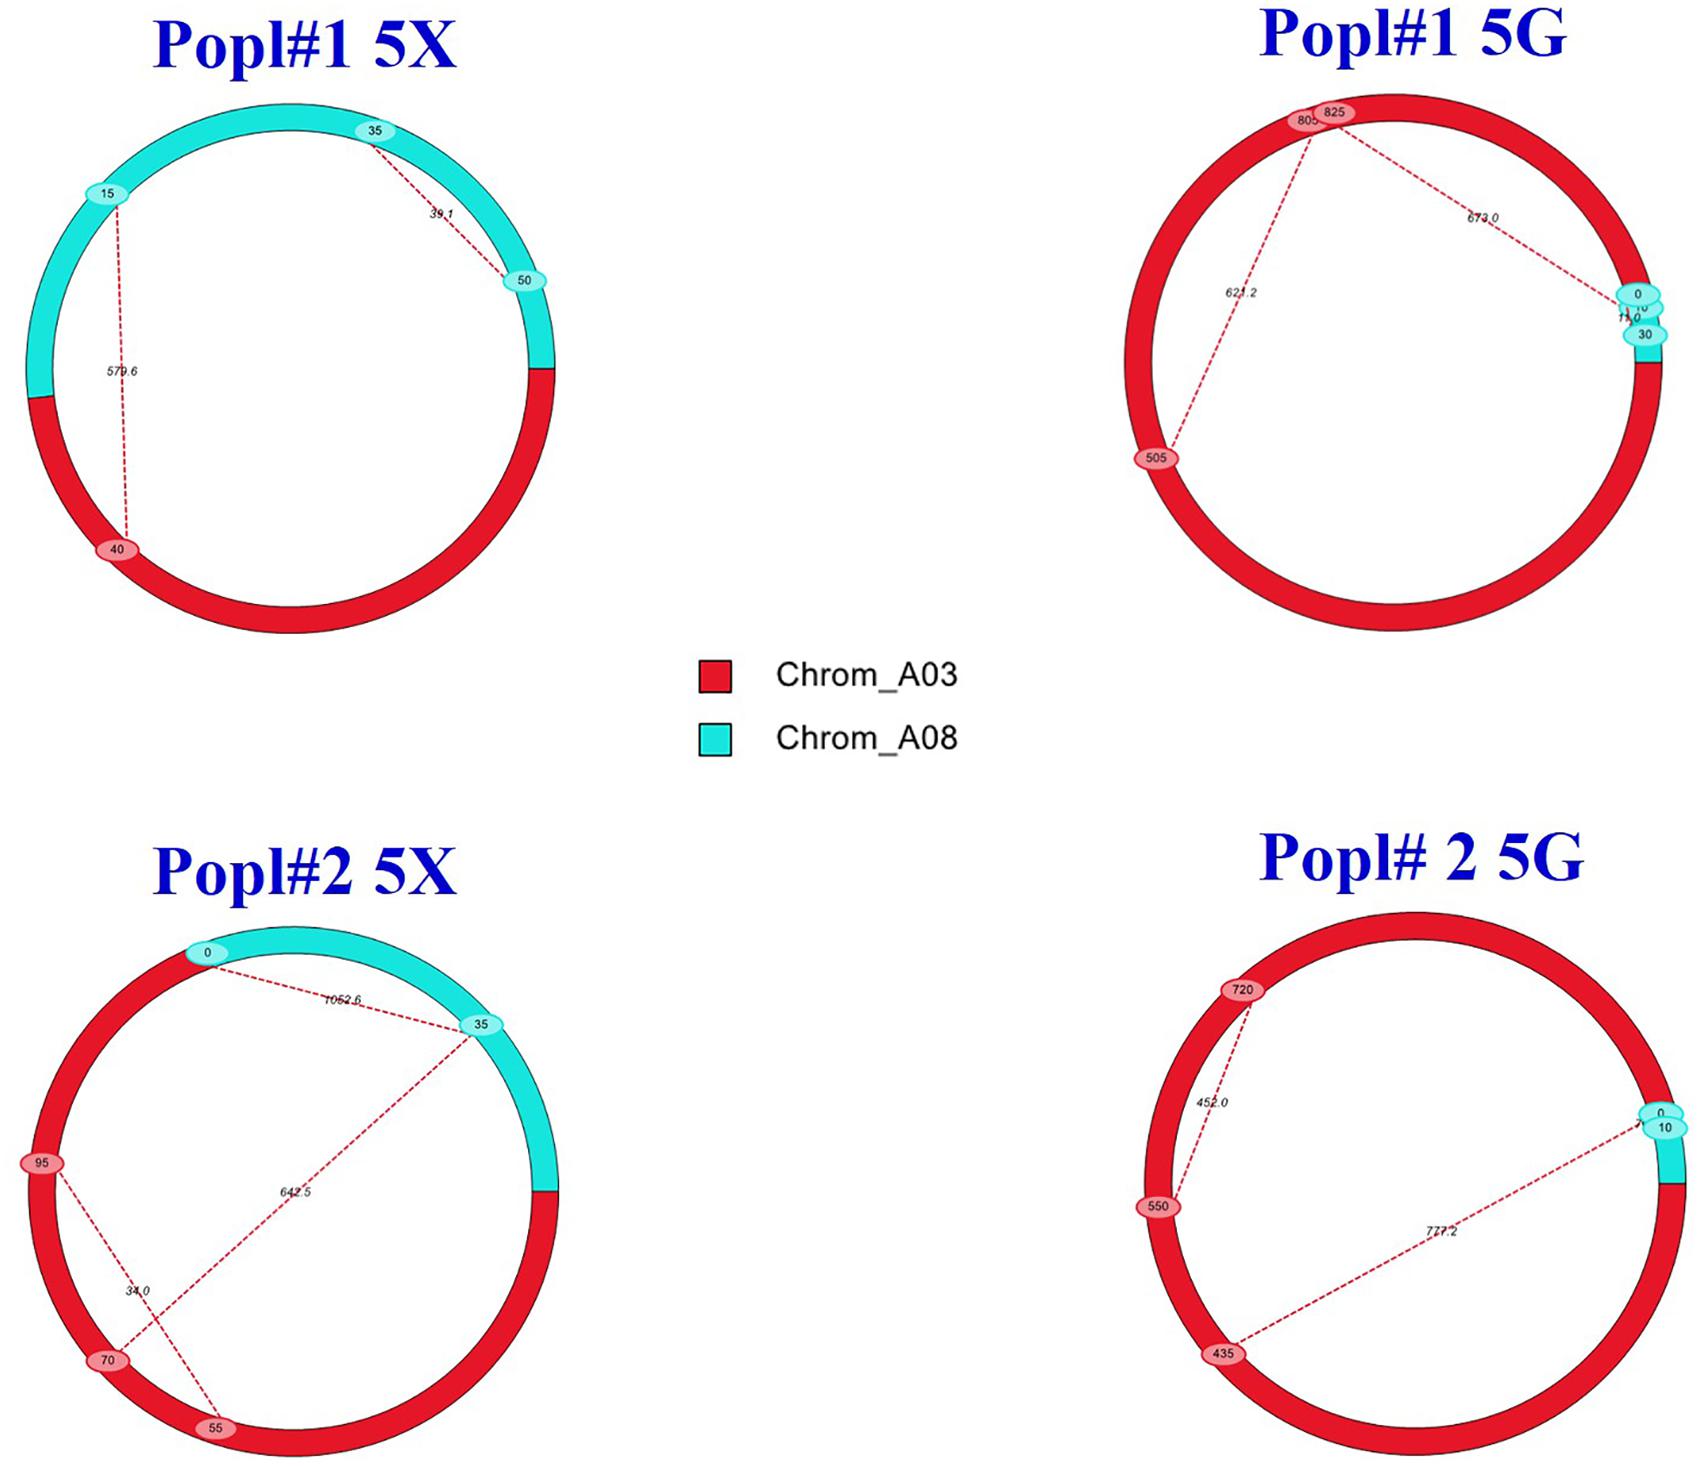
Figure 5. Epistatic QTLs conferring clubroot resistance in two F2 mapping populations (Popl#1 and Popl#2) as revealed by QTL IciMapping software V4.1. The dashed lines represent epistatic interaction pairs of CR QTLs. The red and cyan colors indicate A03 and A08 QTLs, respectively.
Clubroot is widespread in many of the Brassica growing areas of the world. Both quantitative and qualitative disease resistance have been reported in Brassica crops (Piao et al., 2009). The erosion of single dominant CR genes in commercial canola cultivars and the emergence of new virulent isolates of P. brassicae have been reported in Canada (Strelkov et al., 2016, 2018) and Europe (Oxley, 2007; Diederichsen et al., 2014; Wallenhamar et al., 2014; Zamani-Noor, 2017). The erosion of the effectiveness of CR genes has also occurred in cruciferous vegetables in Asia (Bhattacharya et al., 2014; Chai et al., 2014). The elevated infection in clubroot-resistant cultivars and volunteers would lead to increased spore load of the pathogen in the soil (Zamani-Noor and Rodemann, 2017). Hence, clubroot remains a huge problem and poses by far the most significant threat to cruciferous crop production worldwide.
One of the strategies to combat clubroot caused by the many pathotypes of P. brassicae is to deploy cultivars with multiple CR genes. The inheritance of different encoding genes provides a buffer when one resistance mechanism is overcome (Lagudah, 2011). However, the combined effects of inheriting gene combinations seems to be very complex. In durum wheat (Triticum turgidum L. ssp. durum), strong additive effects of the Lr34/Yr18 gene combination to leaf rust, stripe rust and powdery mildew were observed compared to the resistance effects of the Lr46/Yr29 gene combination to the three diseases (Lillemo et al., 2008). Therefore, in canola different gene combinations are expected to confer different levels of resistance to clubroot.
In this study, the inheritance of multiple CR genes was examined in F2 plants derived from the crossing between B. rapa L. spp. rapifera line ECD 02 (turnip) (the resistant parent) and two B. rapa accessions (the susceptible parents). The fact that all the F1 plants from the above crosses were highly resistant to pathotypes 3H, 5X, and 5G suggested that the resistance gene in ECD 02 is dominant and could be due to the combined effect of two or more genes. The F1 means of all crosses were not significantly different from the resistant parent ECD 02 but were significantly different from the mean measurements of the two susceptible parents. These results indicate the complete dominance genes controlling clubroot resistance genes came from ECD 02. The segregation of F2 plants for clubroot resistance (Tables 1, 2) and the fact that the F2 means of all crosses were significantly different from the mean measurements of both parents suggested that the genetic variance consisted of both additive and dominance effects. The 3R:1S and 1R:3S ratios are consistent with the inheritance of a trait controlled by a single dominant major gene. Digenic dominant epistasis, represented as 12R:4S and 4R:12S, gives the same 3R:1S and 1R:3S ratios, respectively. Therefore, based on 3R:1S/1R:3S ratios, we could not conclude whether there was one or two CR genes in ECD 02. On the other hand, the 9R:7S, 7R:9S, 5R:11S, 11R:5S, 13R:3S, 3R:13S, and 1R:15S ratios are modifications of the 15R:1S segregation ratio expected for a trait controlled by two dominant major genes.
The distorted segregation ratios suggested that the resistance genes were on different chromosomes (Hayman and Mather, 1955). The 9R:7S ratio confirms the existence of two genes with duplicate recessive epistasis, which suggested that the dominant allele at the two loci were necessary to control the clubroot caused by pathotypes 5X and 5G. In other words, individuals with double recessive at either locus or both loci were susceptible. The 13R:3S ratio shows recessive suppression in which the presence of two recessive alleles of one gene are needed to suppress the effects of the dominant gene. The 5R:11S, 11R:5S, 7R:9S, 3R:13S, and 1R:15S ratios indicated two-gene control of clubroot resistance with digenic additive epistasis or quantitative control of the resistance. In the current study, most of the segregation ratios fit the two-gene model although segregation patterns of 3R:1S, 1R:3S, and 1R:63S were also possible. However, the mapping population was of the F2 generation and hence it is not clear if the preponderance of non-allelic gene effects will alter at advanced generations. Pioneering studies based on segregation ratios suggested that at least two dominant major genes (originally designated A and C) controlled clubroot resistance in ECD 02 (Wit and Van De, 1964; Buczacki et al., 1975). Therefore, the results of the greenhouse screening work was in agreement with the published literature.
European turnips are a very rich source of dominant major CR genes and hence have been used as resistance donors in many breeding programs around the world. Published CR genes derived from turnips include Crr1, Crr2, Crr3, Crr4, CRa, CRb, CRbKato, CRc, CRd, CRk, Rcr1, BraA.Cr.a, BraA.Cr.b, BraA.Cr.c, and CrrA5 (Matsumoto et al., 1998, 2012; Suwabe et al., 2003, 2006; Hirai et al., 2004; Piao et al., 2004; Hirai, 2006; Saito et al., 2006; Sakamoto et al., 2008; Kato et al., 2012, 2013; Ueno et al., 2012; Hatakeyama et al., 2013; Chu et al., 2014; Zhang et al., 2014; Yu et al., 2016; Hirani et al., 2018; Nguyen et al., 2018; Pang et al., 2018). Most of the previous genetic mapping studies in Canada and Europe relied on single gene resistance resources as donors (Diederichsen et al., 2009; Chu et al., 2014; Fredua-Agyeman and Rahman, 2016; Hasan and Rahman, 2016; Yu et al., 2016). Matsumoto et al. (1998) reported that ECD 02 possessed the CRa gene. Ueno et al. (2012) mapped the CRa gene to a genomic region on the A03 chromosome of B. rapa between the SCAR markers GC2360 and GC1680. Hirani et al. (2018) reported that ECD 02 possessed another clubroot resistance gene, BraA.CR.b, on the A08 chromosome of B. rapa that could be similar to the Crr1 gene previously reported by Hatakeyama et al. (2013). Therefore, the genomic regions identified in this study was consistent with the results of previous studies that mapped the clubroot resistance loci derived from ECD 02 to the A03 and the A08 chromosomes.
In spite of the substantial contribution of non-additive effects to the variation of complex traits, gene effects controlling clubroot resistance have not been studied. Yu et al. (2017) reported that the Rcr8 gene on the A02 chromosome and Rcr9 gene on the A08 chromosome conferred resistance to pathotype 5X. However, the induced resistance to pathotype 5X was not correlated with the resistance to pathotypes 2F, 3H, 5I, 6M, and 8N conferred by the Rcr4 gene on the A02 chromosome (Yu et al., 2017). On the other hand, our study shows that resistance conferred by the CRa/CRbKato gene(s) on the A03 and the Crr1 gene on the A08 chromosome also conferred resistance to pathotype 3H. In addition, Yu et al. (2017) did not show the different interactions involving the multiple (Rcr4, Rcr8, and Rcr9) resistance genes they identified. To the best of our knowledge, our study is the first report that demonstrates that the two CR genes in ECD 02 interact in a non-additive manner to confer resistance to clubroot. Such non-allelic interactions of multiple genes have been reported in the response of many plants to fungi, bacteria, virus and insect attack. For example, barrel clover (Medicago truncatula) to aphid attack (Kamphius et al., 2020); mungbean (Vigna radiata) to mungbean yellow mosaic virus attack (Akbar et al., 2017); soybean (Glycine max) to rust infection (Pierozzi et al., 2008) and cotton (Gossypium hirsutum) to insect pest and virus attacks (Ahuja et al., 2007).
In summary, clubroot tests, linkage analysis and QTL mapping carried out in this study demonstrated that the CRa/CRbKato and the Crr1 genes on the A03 and the A08 chromosomes of ECD 02 interact in a non-allelic manner to confer resistance to pathotypes 5X and 5G. Based on the QTL analysis, the genetic control against virulent P. brassicae pathotypes may also involve additional genes modulating the action of the two major genes. The presence of at least the two dominant genes complementing each other might explain why ECD 02 confers strong and highly stable qualitative resistance to many P. brassicae pathotypes from around the world. Knowledge of gene effects controlling clubroot resistance offers the possibility of exploiting ECD 02 resistance for the breeding of clubroot resistant canola cultivars and cruciferous vegetables. In addition, the genomic regions identified in this study will provide additional resources for marker-assisted selection in Brassica breeding programs.
All datasets generated for this study are included in the article/Supplementary Material.
RF-A: conceptualization, grant application, genetic crosses to produce F1 seeds, screening of F1 plants, development of F2 mapping populations, PCR, genotyping, data analysis, and writing of the manuscript. JJ: screening of F1 plants, development of F2 mapping populations, inoculum preparation, screening of F2 plants, disease rating, DNA extraction, PCR, genotyping, and writing the basic draft of manuscript. S-FH: grant application, supervision and provision of technical support for all pathotyping work carried in the greenhouse, and revision of the manuscript. SS: grant application, supervision and provision of Plasmodiophora brassicae pathotypes, pathotyping work for clubroot, and revision of manuscript. All authors contributed to the article and approved the submitted version.
The Alberta Crop Industry Development Fund (ACIDF) under the project #2016C040R, Agriculture and Agri-Food Canada (AAFC), and the Canola Council of Canada (CCC) under the project #ASC-02 provided financial support for this research. The University of Alberta and Alberta Agriculture and Forestry (Crop Diversification Centre North) provided in-kind support, including access to greenhouse facilities and molecular laboratory equipment.
The authors declare that the research was conducted in the absence of any commercial or financial relationships that could be construed as a potential conflict of interest.
The Supplementary Material for this article can be found online at: https://www.frontiersin.org/articles/10.3389/fpls.2020.00899/full#supplementary-material
Ahuja, S. L., Monga, D., and Dhayal, L. S. (2007). Genetics of resistance to cotton leaf curl disease in Gossypium hirsutum L. under field conditions. J. Hered. 98, 79–83. doi: 10.1093/jhered/esl049
Akbar, W., Aslam, M., Atif, B. M., and Nawaz-ul-Rehman, M. S. (2017). Exploration of durable resistance in mungbean against mungbean yellow mosaic disease. Pak J. Agric. Sci. 54, 415–422. doi: 10.21162/pakjas/17.5399
Bhattacharya, I., Dutta, S., Mondal, S., and Mondal, B. (2014). Clubroot disease on Brassica crops in India. Can. J. Plant Pathol. 36, 154–160. doi: 10.1080/07060661.2013.875064
Buczacki, S. T., Toxopeus, H., Mattusch, P., Johnston, T. D., Dixon, G. R., and Hobolth, L. A. (1975). Study of physiologic specialization in Plasmodiophora brassicae: proposals for attempted rationalization through an international approach. Trans. Br. Mycol. Soc. 65, 295–303. doi: 10.1016/s0007-1536(75)80013-1
Chai, A. L., Xie, X. W., Shi, Y. X., and Li, B. J. (2014). Research status of clubroot (Plasmodiophora brassicae) on cruciferous crops in China. Can. J. Plant Pathol. 36, 142–153. doi: 10.1080/07060661.2013.868829
Chu, M. G., Song, T., Falk, K. C., Zhang, X. G., Liu, X. J., Chang, A., et al. (2014). Fine mapping of Rcr1 and analyses of its effect on transcriptome patterns during infection by Plasmodiophora brassicae. BMC Genomics 15:1166. doi: 10.1186/1471-2164-15-1166
Churchill, G. A., and Doerge, R. W. (1994). Empirical threshold values for quantitative trait mapping. Genetics 138, 963–971.
Diederichsen, E., Frauen, M., Linders, E. G. A., Hatakeyama, K., and Hirai, M. (2009). Status and perspectives of clubroot resistance breeding in crucifer crops. J. Plant Growth Regul. 28, 265–281. doi: 10.1007/s00344-009-9100-0
Diederichsen, E., Frauen, M., and Ludwig-Müller, J. (2014). Clubroot disease management challenges from a German perspective. Can. J. Plant Pathol. 36, 85–98. doi: 10.1080/07060661.2013.861871
Dixon, G. R. (2009). Plasmodiophora brassicae in its environment. J. Plant Growth Regul. 28, 212–228. doi: 10.1007/s00344-009-9098-3
Dixon, G. R. (2014). Clubroot (Plasmodiophora brassicae Woronin) – an agricultural and biological challenge worldwide. Can. J. Plant Pathol. 36, 5–18. doi: 10.1080/07060661.2013.875487
Frauen, M. (1999). “A new clubroot resistant variety in winter oilseed rape,” in Proceddings of the 10th International Rapeseed Congress, Canberra, ACT.
Fredua-Agyeman, R., Hwang, S. F., Strelkov, S. E., Zhou, Q., and Feindel, D. (2018). Potential loss of clubroot resistance genes from donor parent Brassica rapa subsp. rapifera (ECD 04) during doubled haploid production. Plant Pathol. 67, 892–901. doi: 10.1111/ppa.12816
Fredua-Agyeman, R., Hwang, S. F., Strelkov, S. E., Zhou, Q., Manolii, V., and Feindel, D. (2019). Identification of Brassica accessions resistant to ‘old’ and ‘new’ pathotypes of Plasmodiophora brassicae from Canada. Plant Pathol. 68, 708–718. doi: 10.1111/ppa.12980
Fredua-Agyeman, R., and Rahman, H. (2016). Mapping of the clubroot disease resistance in spring Brassica napus canola introgressed from European winter canola cv. ‘Mendel’. Euphytica. 211, 201–213. doi: 10.1007/s10681-016-1730-2
Hasan, M. J., and Rahman, H. (2011). “Genetics of resistance in rutabaga (Brassica napus var. napobrassica) to Canadian Plasmodiophora brassicae pathotype 3,” in Proceedings 13th International Rapeseed Congress, Prague, 691–694.
Hasan, M. J., and Rahman, H. (2013). “Genetics of resistance in rutabaga (Brassica napus var. napobrassica) to Canadian Plasmodiophora brassiceae pathotypes,” in Proceedings 2013 International Clubroot Workshop, Edmonton, MB.
Hasan, M. J., and Rahman, H. (2016). Genetics and molecular mapping of resistance to Plasmodiophora brassicae pathotypes 2, 3, 5, 6, and 8 in rutabaga (Brassica napus var. napobrassica). Genome 59, 805–815. doi: 10.1139/gen-2016-0034
Hatakeyama, K., Suwabe, K., Tomita, R. N., Kato, T., Nunome, T., Fukuoka, H., et al. (2013). Identification and characterization of Crr1a, a gene for resistance to clubroot disease (Plasmodiophora brassicae Woronin) in Brassica rapa L. PLoS One 8:e54745. doi: 10.1371/journal.pone.0054745
Hayashida, N., Takabatake, Y., Nakazawa, N., Aruga, D., Nakanishi, H., Taguchi, G., et al. (2008). Construction of a practical SCAR marker linked to clubroot resistance in Chinese cabbage, with intensive analysis of HC352b genes. J. Japan. Soc. Hort. Sci. 77, 150–154. doi: 10.2503/jjshs1.77.150
Hayman, B. I., and Mather, K. (1955). The description of genic interactions in continuous variation. Biometrics. 11, 69–82.
Hirai, M. (2006). Genetic analysis of clubroot resistance in Brassica crops. Breed Sci. 56, 223–229. doi: 10.1270/jsbbs.56.223
Hirai, M., Harada, T., Kubo, N., Tsukada, M., Suwabe, K., and Matsumoto, S. (2004). A novel locus for clubroot resistance in Brassica rapa and its linkage markers. Theor. Appl. Genet. 108, 639–643. doi: 10.1007/s00122-003-1475-x
Hirani, A. H., Gao, F., Liu, J., Fu, G., Wu, C., McVetty, P. B. E., et al. (2018). Combinations of independent dominant loci conferring clubroot resistance in all four turnip accessions (Brassica rapa) from the european clubroot differential set. Front. Plant Sci. 9:1628.
Hwang, S. F., Howard, R. J., Strelkov, S. E., Gossen, B. D., and Peng, G. (2014). Management of clubroot (Plasmodiophora brassicae) on canola (Brassica napus) in western Canada. Can. J. Plant Pathol. 36 (Suppl. 1), 49–65. doi: 10.1080/07060661.2013.863806
Hwang, S. F., Strelkov, S. E., Feng, J., Gossen, B. D., and Howard, R. J. (2012). Plasmodiophora brassicae: a review of an emerging pathogen of the Canadian canola (Brassica napus) crop. Mol. Plant Pathol. 13, 105–113. doi: 10.1111/j.1364-3703.2011.00729.x
Kamphius, L. G., Gao, L., Turnbull, C. G. N., and Singh, K. B. (2020). Medicago truncatula–aphid interactions. Model Leg. Med. Trunc. Chapter 5.2.2.1. 363–368.Chapter5221 doi: 10.1002/9781119409144.ch44
Kato, T., Hatakeyama, K., Fukino, N., and Matsumoto, S. (2012). Identificaiton of a clubroot resistance locus conferring resistance to a Plasmodiophora brassicae classified into pathotype group 3 in Chinese cabbage (Brassica rapa L.). Breed Sci. 62, 282–287. doi: 10.1270/jsbbs.62.282
Kato, T., Hatakeyama, K., Fukino, N., and Matsumoto, S. (2013). Fine mapping of the clubroot resistance gene CRb and development of a useful selectable marker in Brassica rapa. Breed Sci. 63, 116–124. doi: 10.1270/jsbbs.63.116
Kosambi, D. D. (1944). The estimation of map distances from recombination values. Ann. Eugen 12, 172–175. doi: 10.1111/j.1469-1809.1943.tb02321.x
Kuginuki, Y., Yoshikawa, H., and Hirai, M. (1999). Variation in virulence of Plasmodiophora brassicae in Japan tested with clubroot resistant cultivars of Chinese cabbage (Brassica rapa L. spp. pekinensis). Eur. J. Plant Pathol. 105, 327–332.
Lagudah, E. S. (2011). Molecular genetics of race non-specific rust resistance in wheat. Euphytica. 179, 81–91. doi: 10.1007/s10681-010-0336-3
Lamers, W., and Toxopeus, H. (1977). “New “Multipot” clubroot resistance screening method in use at the SVP,” in Woronin +100 International Conference on Clubroot, eds S. T. Buczacki, and P. H. Williams (Madison: Wisconsin), 122–123.
Leboldus, J. M., Manolii, V. P., Turkington, T. K., and Strelkov, S. E. (2012). Adaptation to Brassica host genotypes by a single-spore isolate and population of Plasmodiophora brassicae (clubroot). Plant Dis. 96, 833–838. doi: 10.1094/pdis-09-11-0807
Lillemo, M., Asalf, B., Singh, R. P., Huerta-Espino, J., Chen, X. M., He, Z. H., et al. (2008). The adult plant rust resistance loci Lr34/Yr18 and Lr46/Yr29 are important determinants of partial resistance to powdery mildew in bread wheat line Saar. Theor. Appl. Genet. 116, 1155–1166. doi: 10.1007/s00122-008-0743-1
Lincoln, S., Daly, M., and Lande, E. S. (1992). Constructing Genetic Maps with MAPMAKER/EXP 3.0. Whitehead Institute Technical Report, 3rd Edn. Cambridge, MA: Whitehead Institute.
Matsumoto, E., Ueno, H., Aruga, D., Sakamoto, K., and Hayashida, N. (2012). Accumulation of three clubroot resistance genes through marker-assisted selection in Chinese cabbage (Brassica rapa ssp. pekinensis). J. Jpn. Soc. Hortic. Sci. 81, 184–190. doi: 10.2503/jjshs1.81.184
Matsumoto, E., Yasui, C., Ohi, M., and Tsukada, M. (1998). Linkage analysis of RFLP markers for clubroot resistance and pigmentation in Chinese cabbage (Brassica rapa ssp. pekinensis). Euphytica. 104, 79–86.
Meng, L., Li, H. H., Zhang, L. Y., and Wang, J. K. (2015). QTL IciMapping: Integrated software for genetic linkage map construction and quantitative trait locus mapping in biparental populations. Crop J. 3, 269–283. doi: 10.1016/j.cj.2015.01.001
Michelmore, R. W., Paran, I., and Kesseli, R. V. (1991). Identification of markers linked to disease-resistance genes by bulked segregant analysis: a rapid method to detect markers in specific genomic regions by using segregating populations. Proc. Natl. Acad. Sci. U.S.A. 88, 9828–9832. doi: 10.1073/pnas.88.21.9828
Nguyen, M. L., Monakhos, G. F., Komakhin, R. A., and Monakhos, S. G. (2018). The new clubroot resistance locus is located on chromosome A05 in Chinese cabbage (Brassica rapa L.). Russ. J. Genet. 54, 296–304. doi: 10.1134/s1022795418030080
Nieuwhof, M., and Wiering, D. (1961). Testing cabbage plants for clubroot resistance (Plasmodiophora brassicae WORON). (Mededeling/Instituut voor de Veredeling van Tuinbouwgewassen; No. 176). Wageningen: IVT.
Østergaard, L., and King, G. J. (2008). Standardized gene nomenclature for the Brassica genus. Plant Methods. 4, 1–4. doi: 10.1186/1746-4811-4-10
Oxley, S. (2007). Clubroot Disease of Oilseed Rape and Other Brassica Crops. Technical Note, TN 620. Perth, SCT: Scottish Agricultural College.
Pang, W., Fu, P., Li, X., Zhan, Z., Yu, S., and Piao, Z. (2018). Identification and mapping of the clubroot resistance gene CRd in Chinese cabbage (Brassica rapa ssp. pekinensis). Front. Plant Sci. 9:653. doi: 10.3389/fpls.2018.00653
Piao, Z. Y., Deng, Y. Q., Choi, S. R., Park, Y. J., and Lim, Y. P. (2004). SCAR and CAPS mapping of CRb, a gene conferring resistance to Plasmodiophora brassicae in Chinese cabbage (Brassica rapa ssp. pekinensis). Theor. Appl. Genet. 108, 1458–1465. doi: 10.1007/s00122-003-1577-5
Piao, Z. Y., Ramchiary, N., and Lim, Y. P. (2009). Genetics of clubroot resistance in Brassica species. J. Plant Growth Regul. 28, 252–264. doi: 10.1007/s00344-009-9093-8
Pierozzi, P. H. B., Ribeiro, A. S., Moreira, J. U. V., Laperuta, L. C., Rachid, B. F., Lima, W. F., et al. (2008). New soybean (Glycine max, Fabales, Fabaceae) sources of qualitative genetic resistance to Asian soybean rust caused by Phakopsora pachyrhizi (Uredinales, Phakopsoraceae). Genet. Mol. Biol. 31, 505–511. doi: 10.1590/s1415-47572008000300018
Rahman, H., Peng, G., Yu, F., Falk, K. C., Kulkarni, M., and Selvaraj, G. (2014). Genetics and breeding for clubroot resistance in Canadian spring canola (Brassica napus L.). Can. J. Plant Pathol. 36 (Supp. 1), 122–134. doi: 10.1080/07060661.2013.862571
Saito, M., Kubo, N., Matsumono, S., Suwabe, K., Tsukada, M., and Hirai, M. (2006). Fine mapping of the clubroot resistance gene. Crr3, in Brassica rapa. Theor. Appl. Genet. 114, 81–91. doi: 10.1007/s00122-006-0412-1
Sakamoto, K., Saito, A., Hayashida, N., Taguchi, G., and Matsumoto, E. (2008). Mapping of isolate-specific QTL for clubroot resistance in Chinese cabbage (Brassica rapa L. ssp. pekinensis). Theor. Appl. Genet. 117, 759–767. doi: 10.1007/s00122-008-0817-0
Sambrook, J., and Russell, D. W. (2001). Molecular Cloning: a Laboratory Manual, 3rd Edn. Cold Spring Harbor, NY: Cold Spring Harbor Laboratory Press.
Strelkov, S. E., and Hwang, S. F. (2014). Clubroot in the Canadian canola crop: 10 years into the outbreak. Can. J. Plant Patho. 36, 27–36. doi: 10.1080/07060661.2013.863807
Strelkov, S. E., Hwang, S. F., Manolii, V. P., Cao, T. S., and Feindel, D. (2016). Emergence of new virulence phenotypes of Plasmodiophora brassicae on canola (Brassica napus) in Alberta. Canada. Eur. J. Plant Pathol. 145, 517–529. doi: 10.1007/s10658-016-0888-8
Strelkov, S. E., Hwang, S. F., Manolii, V. P., Cao, T. S., Fredua-Agyeman, R., Harding, M. W., et al. (2018). Virulence and pathotype classification of Plasmodiophora brassicae populations collected from clubroot resistant canola (Brassica napus) in Canada. Can. J. Plant Pathol. 40, 284–298. doi: 10.1080/07060661.2018.1459851
Strelkov, S. E., Manolii, V. P., Cao, T. S., Xue, S. M., and Hwang, S. F. (2007). Pathotype classification of Plasmodiophora brassicae and its occurrence in Brassica napus in Alberta. Canada. J Phytopathol. 155, 706–712. doi: 10.1111/j.1439-0434.2007.01303.x
Strelkov, S. E., Tewari, J. P., and Smith-Degenhardt, E. (2006). Characterization of Plasmodiophora brassicae populations form Alberta. Canada. Can. J. Plant Pathol. 28, 467–474.
Suwabe, K., Tsukada, H., Iketani, H., Hatakeyama, K., Kondo, M., Fujimura, M., et al. (2006). Simple sequence repeat based comparative genomics between Brassica rapa and Arabidopsis thaliana: the genetic origin of clubroot resistance. Genetics 173, 309–319. doi: 10.1534/genetics.104.038968
Suwabe, K., Tsukazaki, H., Iketani, H., Hatakeyama, K., Fujimura, M., Nunome, T., et al. (2003). Identification of two loci for resistance to clubroot (Plasmodiophora brassicae Woronin) in Brassica rapa L. Theor. Appl. Genet. 107, 997–1002. doi: 10.1007/s00122-003-1309-x
Tewari, J. P., Strelkov, S. E., Orchard, D., Hartman, M., Lange, R. M., and Turkington, T. K. (2005). Identification of clubroot of crucifers on canola (Brassica napus) in Alberta. Can. J. Plant Pathol. 27, 143–144. doi: 10.1080/07060660509507206
Toxopeus, H., Dixon, G. R., and Mattusch, P. (1986). Physiological specialization in Plasmodiophora brassicae: an analysis by international experimentation. Trans. Br. Mycol. Soc. 87, 279–287. doi: 10.1016/s0007-1536(86)80031-6
Ueno, H., Matsumoto, E., Aruga, D., Kitagawa, S., Matsumura, H., and Hayashida, N. (2012). Molecular characterization of the CRa gene conferring clubroot resistance in Brassica rapa. Plant Mol. Biol. 80, 621–629. doi: 10.1007/s11103-012-9971-5
Voorrips, R. E. (2002). MapChart: software for the graphical presentation of linkage maps and QTLs. J. Hered. 93, 77–78. doi: 10.1093/jhered/93.1.77
Voorrips, R. E., and Visser, D. L. (1993). Examination of resistance to clubroot in accessions of Brassica oleracea using a glasshouse seedling test. Netherlands J. Plant Pathol. 99, 269–276.
Wallenhamar, A. C., Almquist, C., Schwelm, A., Roos, J., Marzec-Schmidt, K., Jonsson, A., et al. (2014). Clubroot, a persistent threat to Swedish oilseed rape production. Can. J. Plant Pathol. 36, 135–141. doi: 10.1080/07060661.2013.870606
Wang, S., Basten, C. J., and Zeng, Z. B. (2011). Windows QTL Cartographer 2.5. Raleigh, NC: Department of Statistics, North Carolina State University.
Wit, F., and Van De, W. M. (1964). Clubroot-resistance in turnips (Brassica campestris L.). Euphytica 13, 9–18. doi: 10.1007/bf00037512
Xue, S. M., Cao, T. S., Howard, R. J., Hwang, S. F., and Strelkov, S. E. (2008). Isolation and variation in virulence of single-spore isolates of Plasmodiophora brassicae from Canada. Plant Dis. 92, 456–462. doi: 10.1094/pdis-92-3-0456
Yu, F., Zhang, X., Peng, G., Falk, K. C., Strelkov, S. E., and Gossen, B. D. (2017). Genotyping-by-sequencing reveals three QTL for clubroot resistance to six pathotypes of Plasmodiophora brassicae in Brassica rapa. Sci. Rep. 7:4516. doi: 10.1038/s41598-017-04903-2
Yu, F., Zhang, X., Zhen, H., Chu, M., and Tao, S. (2016). Identification of genome-wide variants and discovery of variants associated with Brassica rapa clubroot resistance gene rcr1 through bulked segregant RNA sequencing. PLoS One 11:e0153218. doi: 10.1371/journal.pone.0153218
Zamani-Noor, N. (2017). Variation in pathotypes and virulence of Plasmodiophora brassicae populations in Germany. Plant Pathol. 66, 316–324. doi: 10.1111/ppa.12573
Zamani-Noor, N., and Rodemann, B. (2017). Reducing the build-up of Plasmodiophora brassicae inoculum by early management of oilseed rape volunteers. Plant Pathol. 67, 426–432. doi: 10.1111/ppa.12732
Zhang, H., Feng, J., Hwang, S. F., Strelkov, S. E., Falax, I., and Sun, R. (2016). Mapping of clubroot (Plasmodiophora brassicae) resistance in canola (Brassica napus). Plant Pathol. 65, 435–440. doi: 10.1111/ppa.12422
Keywords: Plasmodiophora brassicae, Chi-square test, segregation ratios, epistatic interaction, QTL mapping
Citation: Fredua-Agyeman R, Jiang J, Hwang S-F and Strelkov SE (2020) QTL Mapping and Inheritance of Clubroot Resistance Genes Derived From Brassica rapa subsp. rapifera (ECD 02) Reveals Resistance Loci and Distorted Segregation Ratios in Two F2 Populations of Different Crosses. Front. Plant Sci. 11:899. doi: 10.3389/fpls.2020.00899
Received: 24 February 2020; Accepted: 02 June 2020;
Published: 03 July 2020.
Edited by:
Jacqueline Batley, The University of Western Australia, AustraliaReviewed by:
Xiaoming Wu, Oil Crops Research Institute, Chinese Academy of Agricultural Sciences, ChinaCopyright © 2020 Fredua-Agyeman, Jiang, Hwang and Strelkov. This is an open-access article distributed under the terms of the Creative Commons Attribution License (CC BY). The use, distribution or reproduction in other forums is permitted, provided the original author(s) and the copyright owner(s) are credited and that the original publication in this journal is cited, in accordance with accepted academic practice. No use, distribution or reproduction is permitted which does not comply with these terms.
*Correspondence: Rudolph Fredua-Agyeman, ZnJlZHVhYWdAdWFsYmVydGEuY2E=; Stephen E. Strelkov, c3RyZWxrb3ZAdWFsYmVydGEuY2E=
†These authors have contributed equally to this work
Disclaimer: All claims expressed in this article are solely those of the authors and do not necessarily represent those of their affiliated organizations, or those of the publisher, the editors and the reviewers. Any product that may be evaluated in this article or claim that may be made by its manufacturer is not guaranteed or endorsed by the publisher.
Research integrity at Frontiers
Learn more about the work of our research integrity team to safeguard the quality of each article we publish.