 Fan Yan
 Stephen M. Githiri2
 Yu Sang
 Ryoji Takahashi
94% of researchers rate our articles as excellent or good
Learn more about the work of our research integrity team to safeguard the quality of each article we publish.
Find out more
ORIGINAL RESEARCH article
Front. Plant Sci. , 31 January 2020
Sec. Plant Breeding
Volume 10 - 2019 | https://doi.org/10.3389/fpls.2019.01809
Pubescence color of soybean is controlled by two genes, T and Td. In the presence of a dominant T allele, dominant and recessive alleles of the Td locus generate tawny and light tawny (or near-gray) pubescence, respectively. Flavones, responsible for pubescence color, are synthesized via two copies of flavone synthase II genes (FNS II-1 and FNS II-2). This study was conducted to map and clone the Td gene. Genetic and linkage analysis using an F2 population and F3 families derived from a cross between a Clark near-isogenic line with light tawny pubescence (genotype: TT tdtd) and a Harosoy near-isogenic line with tawny pubescence (TT TdTd) revealed a single gene for pubescence color around the end of chromosome 3. Genome sequence alignment of plant introductions revealed an association between premature stop codons in Glyma.03G258700 (R2R3 MYB transcription factor) and recessive td allele. Cultivars and lines having near-gray or light tawny pubescence and a gray pubescence cultivar with td allele had premature stop codons in the gene. These results suggest that Glyma.03G258700 corresponds to the Td gene. It was predominantly expressed in pubescence. Compared to a tawny pubescence line, a near-isogenic line with td allele produced extremely small amounts of transcripts of Glyma.03G258700, FNS II-1, and FNS II-2 in pubescence. The promoter of FNS II-1 and FNS II-2 shared cis-acting regulatory elements for binding of MYB proteins. These results suggest that the wild type of Glyma.03G258700 protein may bind to the promoter of FNS II genes and upregulate their expression, resulting in increased flavone content and deeper pubescence color. In contrast, mutated Glyma.03G258700 protein may fail to upregulate the expression of FNS II genes, resulting in decreased flavone content and dilute pubescence color.
Pubescence color of soybean [Glycine max (L.) Merr.] is controlled by two genes (T and Td) (Palmer et al., 2004). The T gene has a major effect on pubescence color; dominant T and recessive t allele produce tawny and gray pubescence, respectively. Further, the T gene controls coloration of the seed coat and hypocotyl (Palmer and Payne, 1979; Palmer et al., 2004; Murai et al., 2016). The T gene encodes a flavonoid 3ʹ-hydroxylase and hydroxylates flavonoids at the 3ʹ-position of the B-ring to generate dihydroxylated flavonoids (Buttery and Buzzell, 1973; Toda et al., 2002). The entire coding region of F3'H was cloned from a pair of near-isogenic lines (NILs) for the T gene, To7B (TT), and To7G (tt). They differed by one base deletion in To7G, resulting in a short polypeptide lacking the consensus sequence GGEK and heme-binding domain (Toda et al., 2002).
Bernard (1975) reported another gene, Td, affecting pubescence color. In the presence of the dominant T allele, dominant and recessive alleles of the Td locus generate tawny and light tawny (or near-gray) pubescence, respectively. Recessive t allele generates gray pubescence color irrespective of the allele of the Td locus (tt TdTd or tt tdtd) (Bernard, 1975). In contrast to the T gene, Td gene affects only pubescence color (Palmer and Payne, 1979; Palmer et al., 2004).
Existence of different flavonoids is responsible for variation of tissue coloration in soybean. Iwashina et al. (2006) characterized flavonoids in soybean pubescence. A large amount of luteolin aglycone (flavone with 3ʹ4ʹ-dihydroxylation) was extracted together with small amounts of apigenin aglycone (flavone with 4ʹ-hydroxylation) and luteolin derivatives from tawny pubescence. Luteolin aglycone comprised the largest portion (95–96%). From gray pubescence, a large amount of apigenin aglycone was extracted together with small amounts of luteolin aglycone, apigenin 7-O-glucoside, and apigenin derivatives. Apigenin aglycone was most abundant (90%). Thus, the hydroxylation pattern of the B-ring is associated with the dominance of the T gene. From light tawny pubescence of Clark-td, a Clark NIL with td allele, three compounds identical to those in tawny pubescence were extracted. However, compared to tawny pubescence, the amount of luteolin aglycone was reduced to half. In addition, two high performance liquid chromatography (HPLC) peaks corresponding to isoflavonoids were occasionally found in light tawny pubescence (Iwashina et al., 2006). These results suggest that the Td gene might be involved in the biosynthesis of flavones. Flavone glycosides exist in vacuoles in pubescence whereas flavone aglycones exist outside the cell surface, and they belong to so-called surface flavonoids (Iwashina et al., 2006). Biological roles of surface flavonoids remain to be investigated (Wollenweber, 1994). Most pigments in pubescence could not be extracted from pubescence, suggesting that flavone derivatives are highly polymerized (Iwashina et al., 2006). In soybean, flavones predominantly exist in pubescence and are quite rare in other tissues (Iwashina et al., 2006).
Plants have evolved two independent enzyme systems to synthesize flavone using the same substrates, flavone synthase (FNS) I and II (Martens and Mithofer, 2006). Both enzymes never occur side by side in the same organism. FNS is a soluble 2-oxoglutarate- and Fe2+-dependent dioxygenase, occurs in Apiaceae, whereas FNS II, a membrane-bound cytochrome P450 monooxygenase, is more widespread among plant species. Soybean has two functional copies of FNS II gene, FNSII-1 (Glyma.12G067000) and FNSII-2 (Glyma.12G067100) with 93% amino acid identity, with an approximately 8 kb distance on chromosome 12 (Fliegmann et al., 2010; Jiang et al., 2010).
Genome-wide association studies (GWASs) using a total of 1,402 soybean genotypes revealed a significant signal associated with pubescence color at 47,244,893 bp on chromosome 3, presumably corresponding to the Td-td locus (Wen et al., 2015). In addition, GWAS of a total of 12,360 accessions suggest a signal associated with the Td-td locus around the end of chromosome 3 (Bandillo et al., 2017). However, the identity and nature of the Td gene has not yet been clarified. This study was conducted to map and clone the Td gene responsible for flavone content and deepening/diluting of pubescence color in soybean.
Plant materials used in this study are listed in Table 1. Pedigree and pubescence color information was obtained from the USDA GRIN database (https://www.ars-grin.gov/npgs/). Soybean NIL of US cultivar Clark, L66-260 with light tawny pubescence (Clark-td; genotype TT tdtd) was crossed with L66-707, NIL of Canadian cultivar Harosoy with tawny pubescence (Harosoy-T; TT TdTd) in 2004. Flowers of Clark-td were emasculated 1 day before opening and pollinated with pollen of Harosoy-T. Hybridity of F1 plants was ascertained by the existence of tawny pubescence color. The NILs were developed by backcrossing the pubescence color traits five times into Clark or Harosoy backgrounds (Bernard et al., 1991). In addition, five US cultivars with light tawny or near-gray pubescence (Grant, Korean, Cloud, Kingwa, and Sooty) as well as a gray-pubescence US cultivar Seneca, based on pedigree information, presumably having the recessive td allele (Bernard, 1975) were used for genotyping. Seeds of the NILs and the cultivars were provided by the USDA Soybean Germplasm Collection.
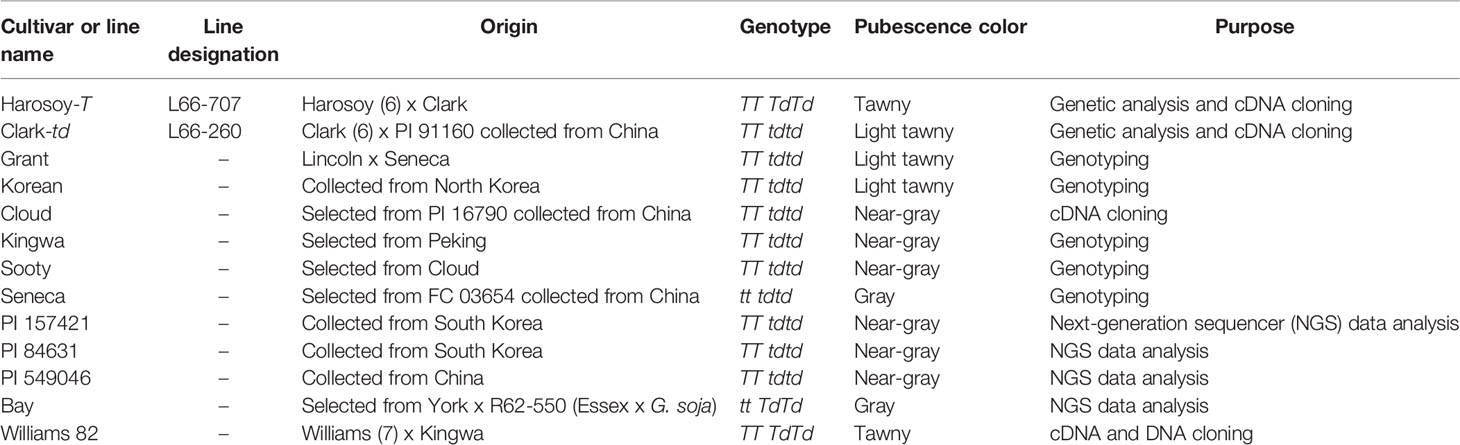
Table 1 Plant materials used in this study.
A total of 120 F2 seeds together with 30 seeds each from the parents were planted in a field at the NARO Institute of Crop Science (36°06′ N, 140°05′ E) on 14 June 2005. N, P, and K were applied at 3.0, 4.4, and 8.3 g m−2, respectively. Thirty seeds each from 98 F3 families and parents were planted in the same field on 8 June 2007. Spaces between rows and plants were 70 and 10 cm, respectively. Genotype of F2 plants was determined by pubescence color segregation of the F3 families.
A total of 94 F2 plants were randomly selected and used for linkage mapping because the PCR plates and electrophoresis apparatus are designed for multiples of 96 samples (2 parents and 94 F2 plants). Total DNA was extracted from trifoliate leaves of the parents and each of the F2 plants by the CTAB method (Murray and Thompson, 1980). Pubescence color was scored in each of the F2 plants and F3 families. Based on pubescence color in F2 and F3 generations, 24 F2 plants fixed for tawny pubescence and 24 F2 plants fixed for light tawny pubescence were identified. Two bulked DNA samples (one for tawny pubescence and another for light tawny pubescence) were obtained by mixing 10 μl from each of the selected plants and were subjected to bulked segregant simple sequence repeat (SSR) analysis. Polymorphic SSR markers in Harosoy x Clark (Nebraska) population (Cregan et al., 1999) were used for analyzing variation between the two bulked DNA samples. PCR conditions were similar to those in a previous report (Rojas Rodas et al., 2014). Variation between the two bulked samples was used to determine which chromosome harbored the pubescence color gene. Base on the results, SSR markers on chromosome 3 (Song et al., 2004) were then tested for variation among the 94 F2 plants. The linkage map was constructed using MAPMAKER/EXP version 3.0 (Lander et al., 1987) with the Kosambi function and the threshold logarithm of odds (LOD) score of 3.0. To fill the gap in the linkage group, SSRs were screened and an SSR marker designated as Gm03:45226162-45226406 was constructed using the Simple Sequence Repeat Identification Tool (http://archive.gramene.org/db/markers/ssrtool).
Based on information provided by Zhou et al. (2015), whole genome sequences of three USDA plant introductions with near-gray pubescence (PI 157421: SRR1533292; PI 84631: SRR1533280; PI 549046: SRR1533204) were downloaded using the DRA Search of the DNA Data Bank of Japan (http://ddbj.nig.ac.jp/DRASearch/query?keyword=PI+196166&show=20) (Table 1). The genome sequences together with our next-generation sequencer (NGS) data of US cultivar Bay with gray pubescence were uploaded to the Integrative Genomics Viewer (http://software.broadinstitute.org/software/igv/) (Robinson et al., 2011) and were compared with those of Williams 82 having tawny pubescence.
Total RNA was isolated from trifoliate leaves (100 mg) of Harosoy-T, Clark-td, Cloud, and Williams 82 using the Spin Column Plant Total RNA Purification Kit (Sangon Biotech, Shanghai, China) according to the manufacturer's instructions. cDNA was synthesized by reverse transcription polymerase chain reaction of 5 μg of total RNA using the PrimeScript II 1st Strand cDNA Synthesis Kit (Takara, Dalian, China) and an oligo (dT) primer following the manufacturer's instructions. cDNA was amplified by end-to-end PCR using primers (Table 2) that were based on the genome sequence of US cultivar Williams 82 deposited in the soybean genome database (Phytozome, https://phytozome.jgi.doe.gov/pz/portal.html#). The total volume of 50 μl PCR mixture contained 10 pmol of each primer, 1 × PrimeSTAR Max Premix (Takara), and 200 ng cDNA. The PCR program was 35 cycles of 10 s denaturation at 98°C, 15 s annealing at 56°C and 1 min extension at 72°C. PCR was performed in an Applied Biosystems 9700 thermal cycler (Thermo Fisher Scientific, Waltham, USA). Each target band was TA cloned into the plasmid vector pMD18-T (Takara). The plasmids were sent to the Sangon Biotech for sequencing.
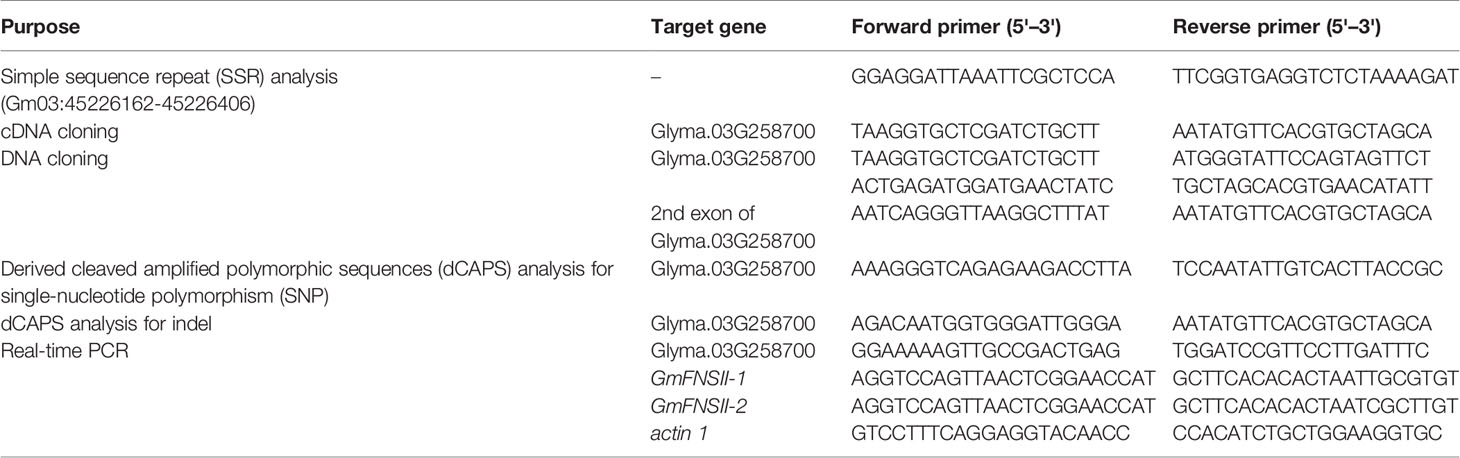
Table 2 PCR primers used in this study.
Genomic DNA was extracted from trifoliate leaves of Grant, Korean, Cloud, Kingwa, Sooty, Harosoy-T, Clark-td, and Williams 82 by the CTAB method. Entire genomic fragment was amplified from Williams 82 whereas the second exon was amplified from the other cultivars using the PCR primers in Table 2. PCR mixture contained 10 pmol of each primer, 1 × PrimeSTAR Max Premix, and 50 ng genomic DNA in a total volume of 50 μl. The PCR program was 35 cycles of 10 s denaturation at 98°C, 5 s annealing at 56°C, and 10 s extension at 72°C. The PCR products were sent to Sangon Biotech for direct sequencing.
Nucleotide sequences of both strands were determined with the BigDye terminator cycle method using an ABI 3730XL (Thermo Fisher Scientific). Nucleotide sequences and the putative amino acid translations were analyzed with the BLAST program (Altschul et al., 1997). Nucleotide and amino acid sequences were aligned using ClustalW (http://clustalw.ddbj.nig.ac.jp/top-j.html) with default settings. The amino acid alignment was used to construct a phylogenetic tree of MYB genes related to flavonoid biosynthesis (Additional File 1: Table S1) using the neighbor-joining method with MEGA version 10.0.5 (http://www.megasoftware.net/) (Kumar et al., 2018). Bootstrap test of 1,000 replications was performed. Nucleotide sequences of the putative promoter region (up to 1,500 bp upstream from the start codon) of two FNSII genes, GmFNSII-1 (Glyma.12G067000) and GmFNSII-2 (Glyma.12G067100) of Williams 82 were downloaded from Phytozome. Cis-acting regulatory elements of these genes were investigated using New PLACE, a database of plant cis-acting regulatory DNA elements (https://sogo.dna.affrc.go.jp/cgi-bin/sogo.cgi?lang=en&pj=640&action=page&page=newplace), using default settings (Higo et al., 1999).
Two pairs of PCR primers containing mismatched nucleotides were designed to detect a single-nucleotide polymorphism (SNP) existing in Clark-td and one base deletion in Cloud. The SNP of Clark-td was expected to result in the presence of the restriction site of BsrBI in the amplicons. The deletion in Cloud was expected to result in the presence of the restriction site of EcoRV in the PCR products. The total volume of 25 μl PCR mixture contained 10 pmol of each primer, 1 × PrimeSTAR Max Premix, and 50 ng genomic DNA. The PCR program was 35 cycles of 10 s denaturation at 98°C, 5 s annealing at 56°C, and 10 s extension at 72°C. The PCR products were digested with BsrBI or EcoRV, and the digests were separated on 8% nondenaturing polyacrylamide gels. After electrophoresis, the gels were stained with ethidium bromide and the DNA fragments were visualized under UV light.
Tissue samples were collected in three replicates. Pubescence was sampled with razor blades from pods and stems of Harosoy-T and Clark-td at the R3 stage (Fehr et al., 1971). Petals were collected on the day of opening from Harosoy-T. Leaves, stems, roots, root nodules, and immature seeds were sampled from Harosoy-T at the R3 stage. Total RNA was extracted from 50 mg of pubescence, and 100 mg of the other tissue samples. cDNA was synthesized by reverse transcription polymerase chain reaction of 1 μg of total RNA using the PrimeScript RT reagent Kit with gDNA Eraser (Perfect Real Time) (Takara) and an oligo (dT) primer following the manufacturer's instructions. Six concentration gradients (0, 1/2, 1/4, 1/8, 1/16, 1/32) were used to set up a standard curve. The testing samples of cDNA were diluted five times. Three biological replications and three technical repetitions were tested for quantification. The real-time PCR mixture contained 1 × TB Green Premix Ex Taq (Tli RNaseH Plus) (Takara), 10 pmol of each primer, 1 × ROX reference dye, 50 ng of cDNA, and water to a final volume of 20 μl. The PCR was performed using the StepOnePlus Real-Time PCR instrument (Thermo Fisher Scientific). The initial 30 s denaturation at 95°C was followed by 40 cycles of 5 s denaturation at 95°C and 30 s annealing at 60°C. The expression level of the target gene was normalized using soybean actin 1 gene (GenBank accession number: J01298). The PCR primers are listed in Table 2.
From a total of 120 F2 seeds planted, 104 plants grew normally. Some of the F2 plants were difficult to classify into tawny or light tawny pubescence class as previously reported (Bernard, 1975) so F3 progeny tests were performed. A total of 98 F2 plants were randomly selected, and their F3 seeds were planted in the field. Ninety-eight F3 families were segregated into 24 families fixed for tawny pubescence, 50 segregating families, and 24 families fixed for light tawny pubescence. The segregation fitted to a single gene control model of 1:2:1 (χ2 = 0.04, P = 0.98), in accordance with the previous report (Bernard, 1975).
Bulked segregant analysis suggested that the Td gene was located in chromosome 3. Seven SSR markers in chromosome 3 had good separation and were used for linkage mapping. The Td gene was mapped toward the end of chromosome 3. To fill the gap between the Td gene and Satt022, a new SSR marker Gm03:45226162-45226406 was designed (Table 2). The primers were constructed flanking nine repeats of the AT motif. The Td gene was mapped 1.1 cM away from the marker toward the chromosome end, generating a linkage group spanning 86.1 cM (Figure 1).
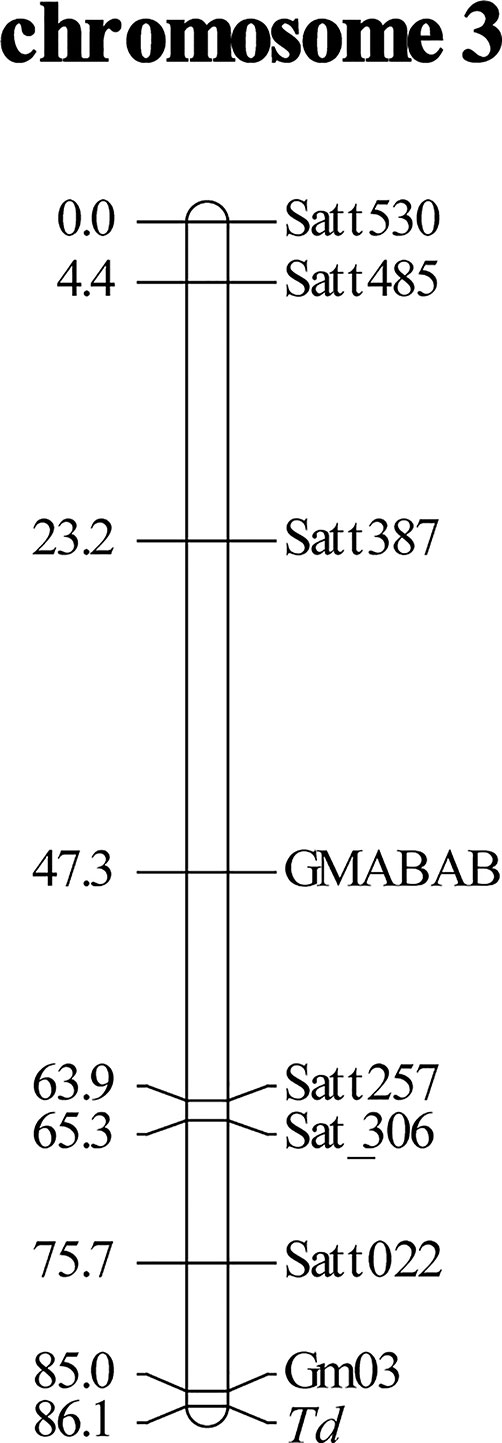
Figure 1 Linkage mapping of soybean pubescence color gene Td using an F2 population derived from a cross of near-isogenic lines, Clark-td x Harosoy-T. Distances of markers (cM) from the top of linkage group are shown on the left. Gm03 is an abbreviation of a newly developed simple sequence repeat (SSR) marker, Gm03:45226162-45226406.
There are 71 genes (Glyma.03G257900 to Glyma.03G254900) from Gm03:45226162-45226406 to the chromosome end in Williams 82. Based on genome sequence comparison with Williams 82 (Glycine max Wm82.a2.v1), plant introductions with near-gray pubescence (PI 157421, PI 84631, and PI 549046) had mutations in the coding region of Glyma.03G258700, which is annotated as a MYB transcription factor (Figure 2). In PI 157421, base substitution from TGG to TGA generated a stop codon in the coding region. In PI 549046 and PI 84631, a single-base deletion occurred at different positions 3 bp apart from each other in the second exon, resulting in premature translation termination. These results suggest that Glyma.03G258700 might correspond to the Td gene.
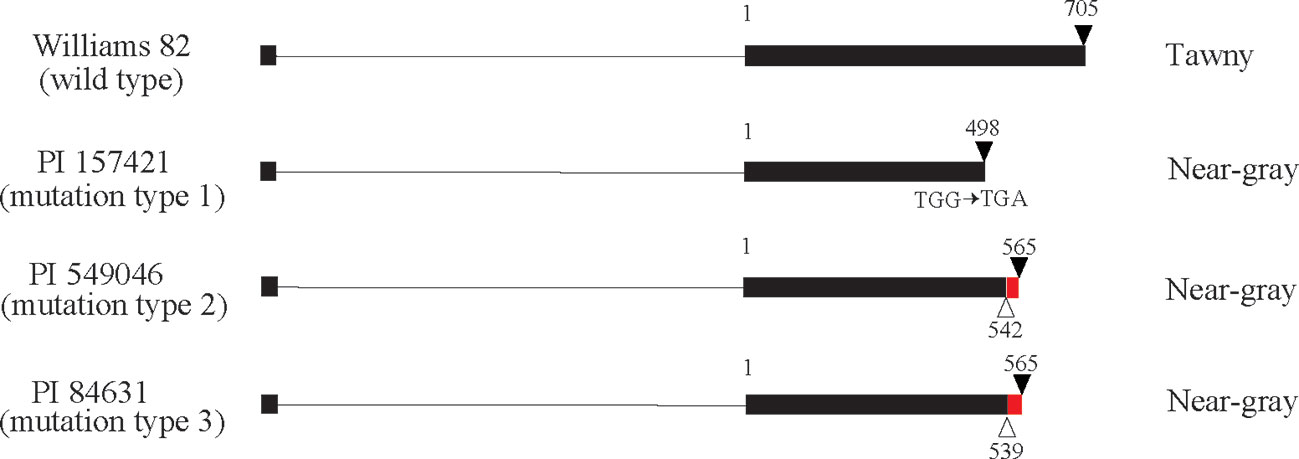
Figure 2 Gene structure of Glyma.03G258700 in Williams 82 with tawny pubescence and three plant introductions with near-gray pubescence. Exons and introns are shown by boxes and lines, respectively. White and black triangles indicate deletions and stop codons, respectively. Red box represents a region where frameshift mutation occurred due to deletion. Numbers indicate nucleotide position starting from second exon.
However, according to the reference genome of Williams 82, cDNA of Glyma.03G258700 is truncated and lacks a start codon (Figure 2). Genome sequence alignment of the plant introductions and cultivar Bay indicated that no NGS reads were allocated to a 58-nucleotide region (Gm03:45302852 to Gm03:45302909) corresponding to the middle of the first exon in all genotypes (Additional File 1: Figure S1). We designed a forward primer in the upstream region to amplify the entire coding region of Glyma.03G258700 (Table 2, Additional File 1: Figure S1, and Additional File 3: Figure S2).
RT-PCR using primers for Glyma.03G258700 generated fragments of approximately 1 kb length in Harosoy-T, Clark-td, Cloud, and Williams 82. The coding region of Harosoy-T and William 82 was 840 bp long and encoded 279 amino acids (Figure 3A). BLAST analysis confirmed that Glyma.03G258700 belongs to a MYB transcription factor of the R2R3 type (Figure 3A). A single base was substituted from G to A at the nucleotide position 633 in Clark-td compared with Harosoy-T. The SNP generated a premature stop codon (TGA) resulting in a short polypeptide consisting of 210 amino acids (Figure 3B). Cloud had one base deletion at the nucleotide position 677. This deletion changed a subsequent reading frame and generated a truncated polypeptide consisting of 232 amino acids (Figure 3B). Sequencing of the second exon revealed that Korean, Seneca, Kingwa, Grant, and Sooty had the same SNP as Clark-td.
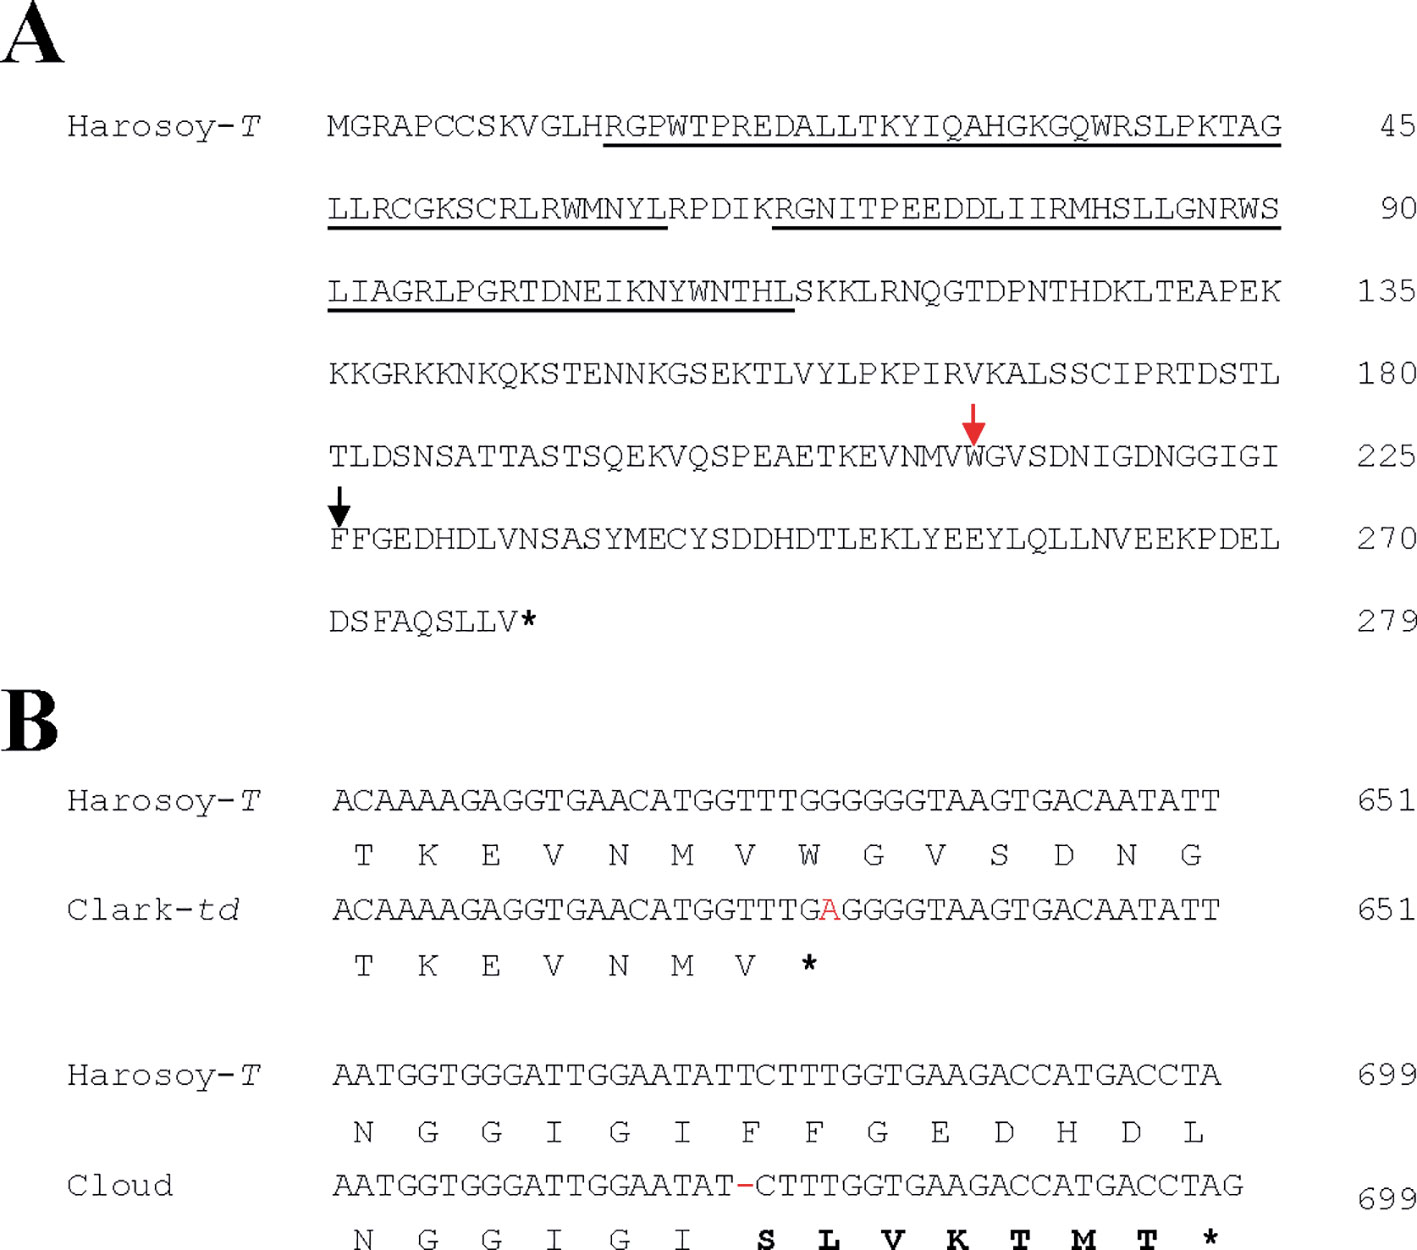
Figure 3 Nucleotide and amino acid polymorphisms of the soybean gene Glyma.03G258700 in Harosoy-T, Clark-td, and Cloud. Asterisk represents stop codon. (A) Amino acid sequence of Harosoy-T. The position of single-nucleotide polymorphism (SNP) and indel found in Clark-td and Cloud are indicated by red and black arrows, respectively. MYB DNA-binding domains are underlined. (B) Alignment of partial cDNA and amino acid sequences. The SNP in Clark-td and an indel in Cloud are shown in red font. The altered amino acids caused by frameshift mutation in Cloud are shown in bold font.
Glyma.03G258700 of Harosoy-T had an amino acid identity of 58% with a persimmon MYB gene, DkMYB4, which activates proanthocyanidin biosynthesis (Akagi et al., 2009) (Figure 4). Particularly, the N-terminal region, including R2R3 MYB-binding domains as well as the C-terminal region, were quite similar. Amino acid identify of the MYB-binding domain was 89%. Plant MYB proteins are classified into 28 subclasses (S1 to S28), and many of them are involved in flavonoid biosynthesis (Liu et al., 2015). In soybean, two flavonoid-related genes, flower color gene W2 (Glyma.14G154400) and seed coat color gene R (Glyma.09G235100), are known to encode R2R3 MYB transcription factors (Gillman et al., 2011; Takahashi et al., 2011; Takahashi et al., 2013; Yan et al., 2015). Based on phylogenetic analysis, Glyma.03G258700 belongs to S5 together with DkMYB4, whereas R and W2 genes belong to S6 and S27, respectively (Figure 5 and Additional File 2: Table S1).
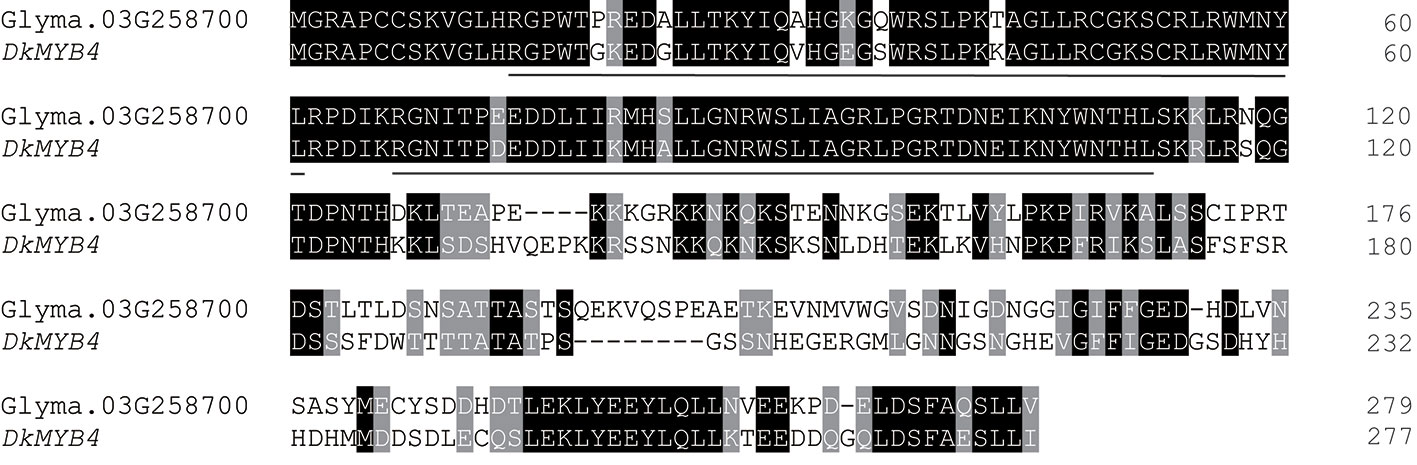
Figure 4 Amino acid alignment of soybean MYB gene, Glyma.03G258700 with persimmon MYB4 gene, DkMYB4. Dashes represent gaps introduced to improve the alignment. Identical and similar amino acids are shown in white font highlighted in black and gray, respectively. MYB DNA-binding domains are underlined.
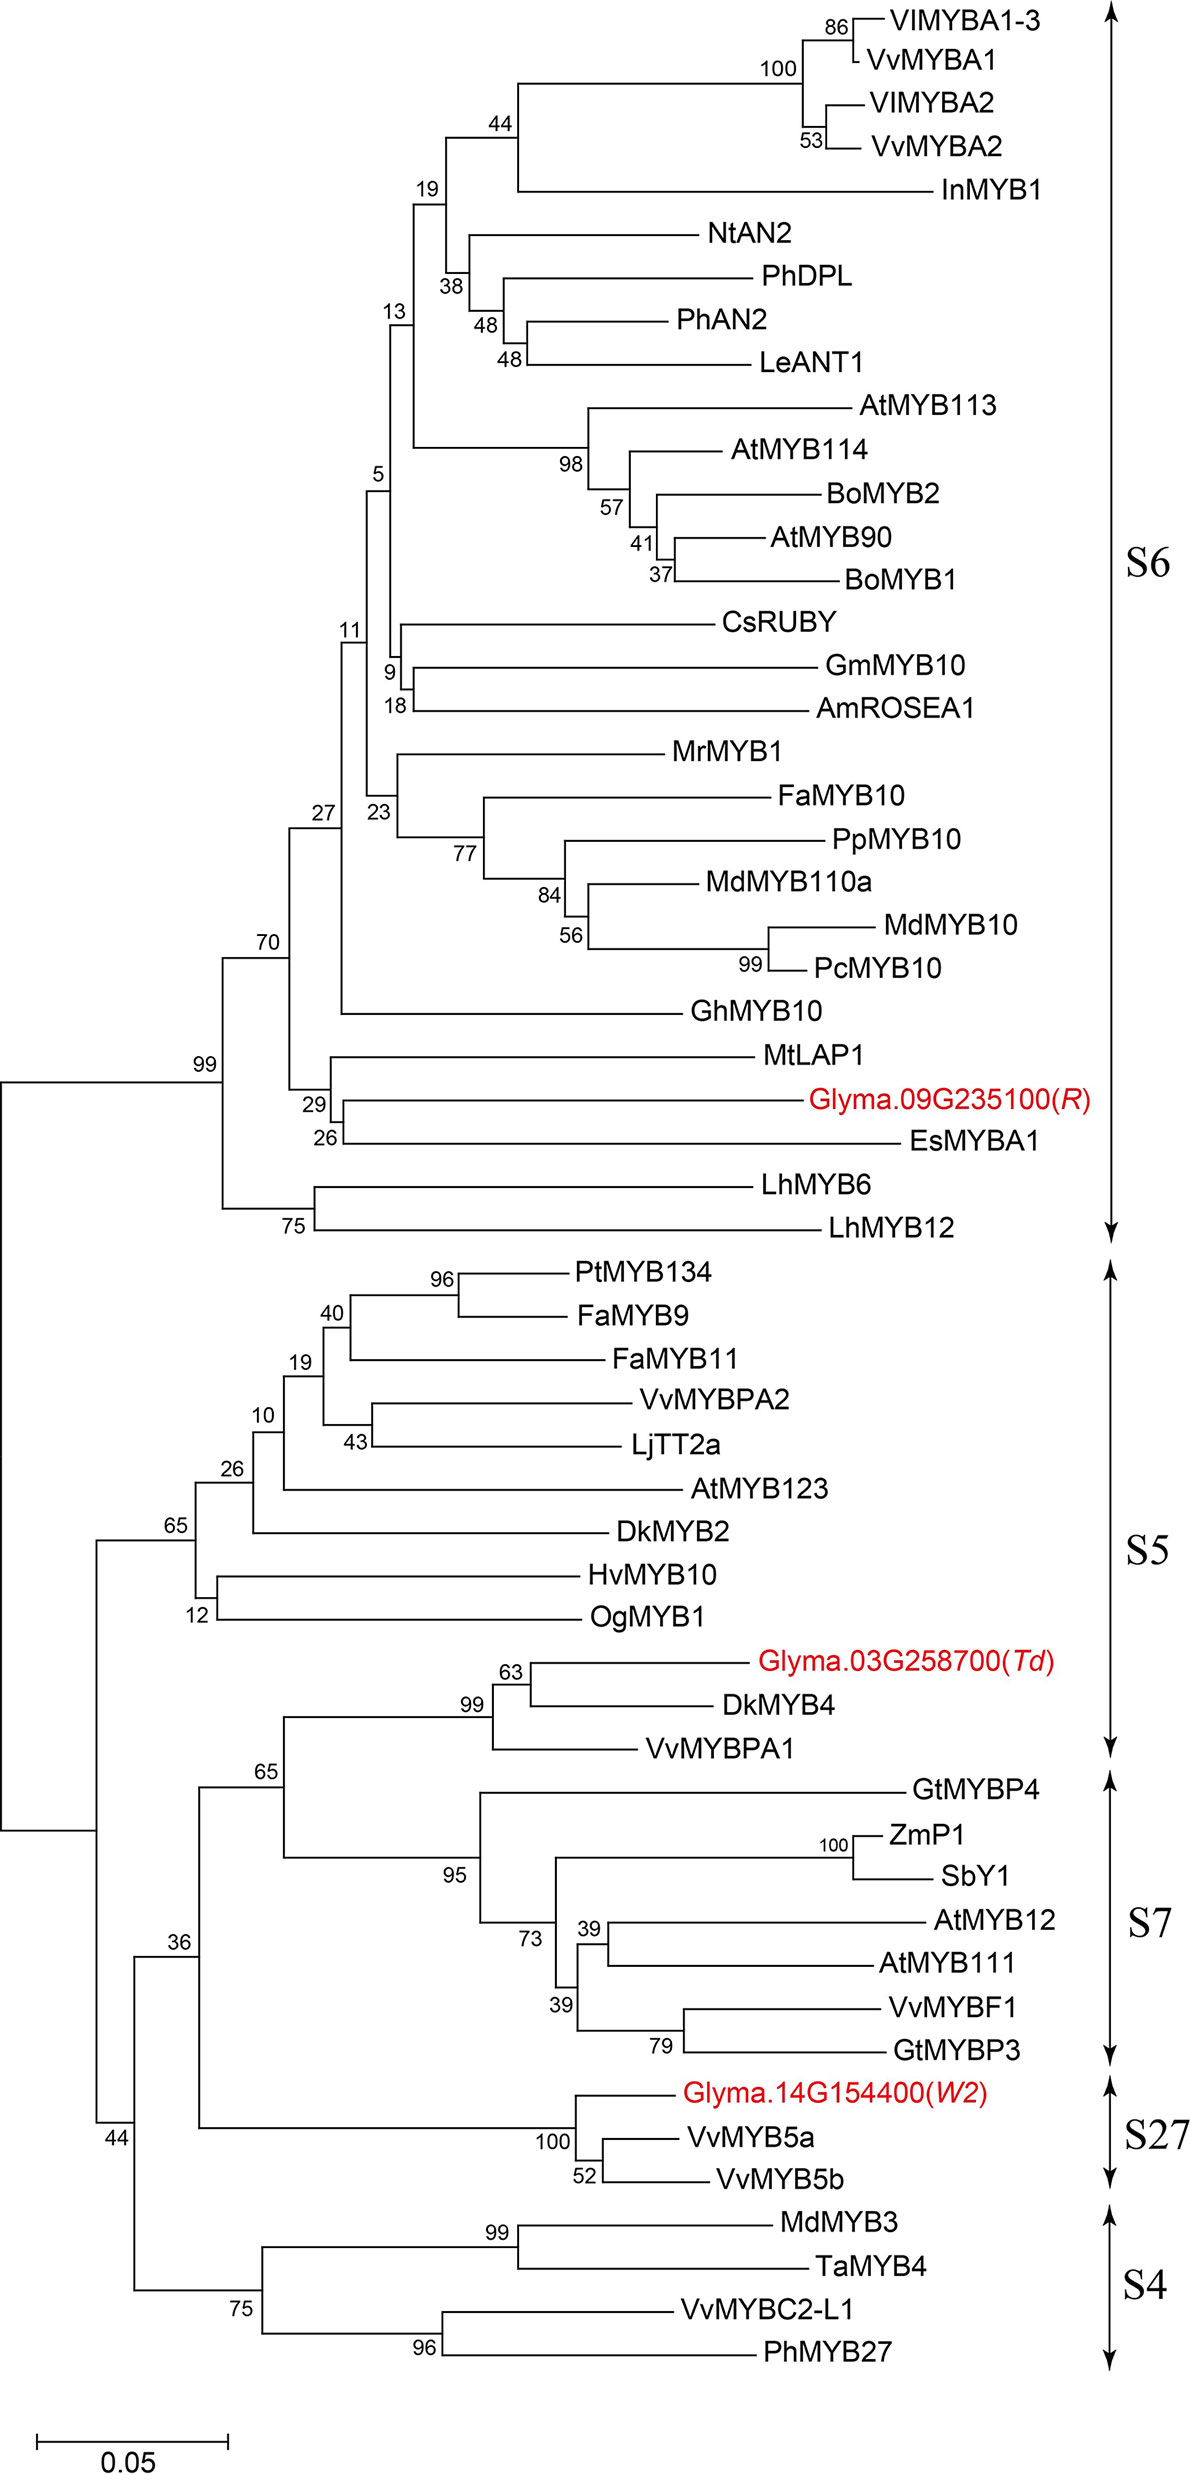
Figure 5 Phylogenetic tree of plant R2R3 MYB transcription factors related to flavonoid biosynthesis. Soybean MYBs are shown in red font. Bar represents 0.05 amino acid substitution/site.
The scheme of derived cleaved amplified polymorphic sequences (dCAPS) analysis for SNP and indel are shown in Figures 6A, B, respectively. Results of dCAPS analyses are shown in Figure 6C. PCR using dCAPS primers for SNP generated amplified products of approximately 210 bp in all genotypes (Korean, Cloud, Seneca, Kingwa, Grant, Sooty, Harosoy-T, and Clark-td). Digestion with BsrBI generated a fragment of approximately 185 bp in Korean, Seneca, Kingwa, Grant, Sooty, and Clark-td, whereas PCR products of Cloud and Harosoy-T were undigested. PCR using dCAPS primers for indel generated fragments of approximately 270 bp in all genotypes. Digestion with EcoRV generated a fragment of approximately 250 bp in Cloud, whereas PCR products of the other genotypes were unaffected. Thus, Korean, Seneca, Kingwa, Grant, Sooty, and Clark-td have the same SNP as PI 157421, whereas Cloud has the same deletion as PI 549046 (Additional File 3: Figure S2).
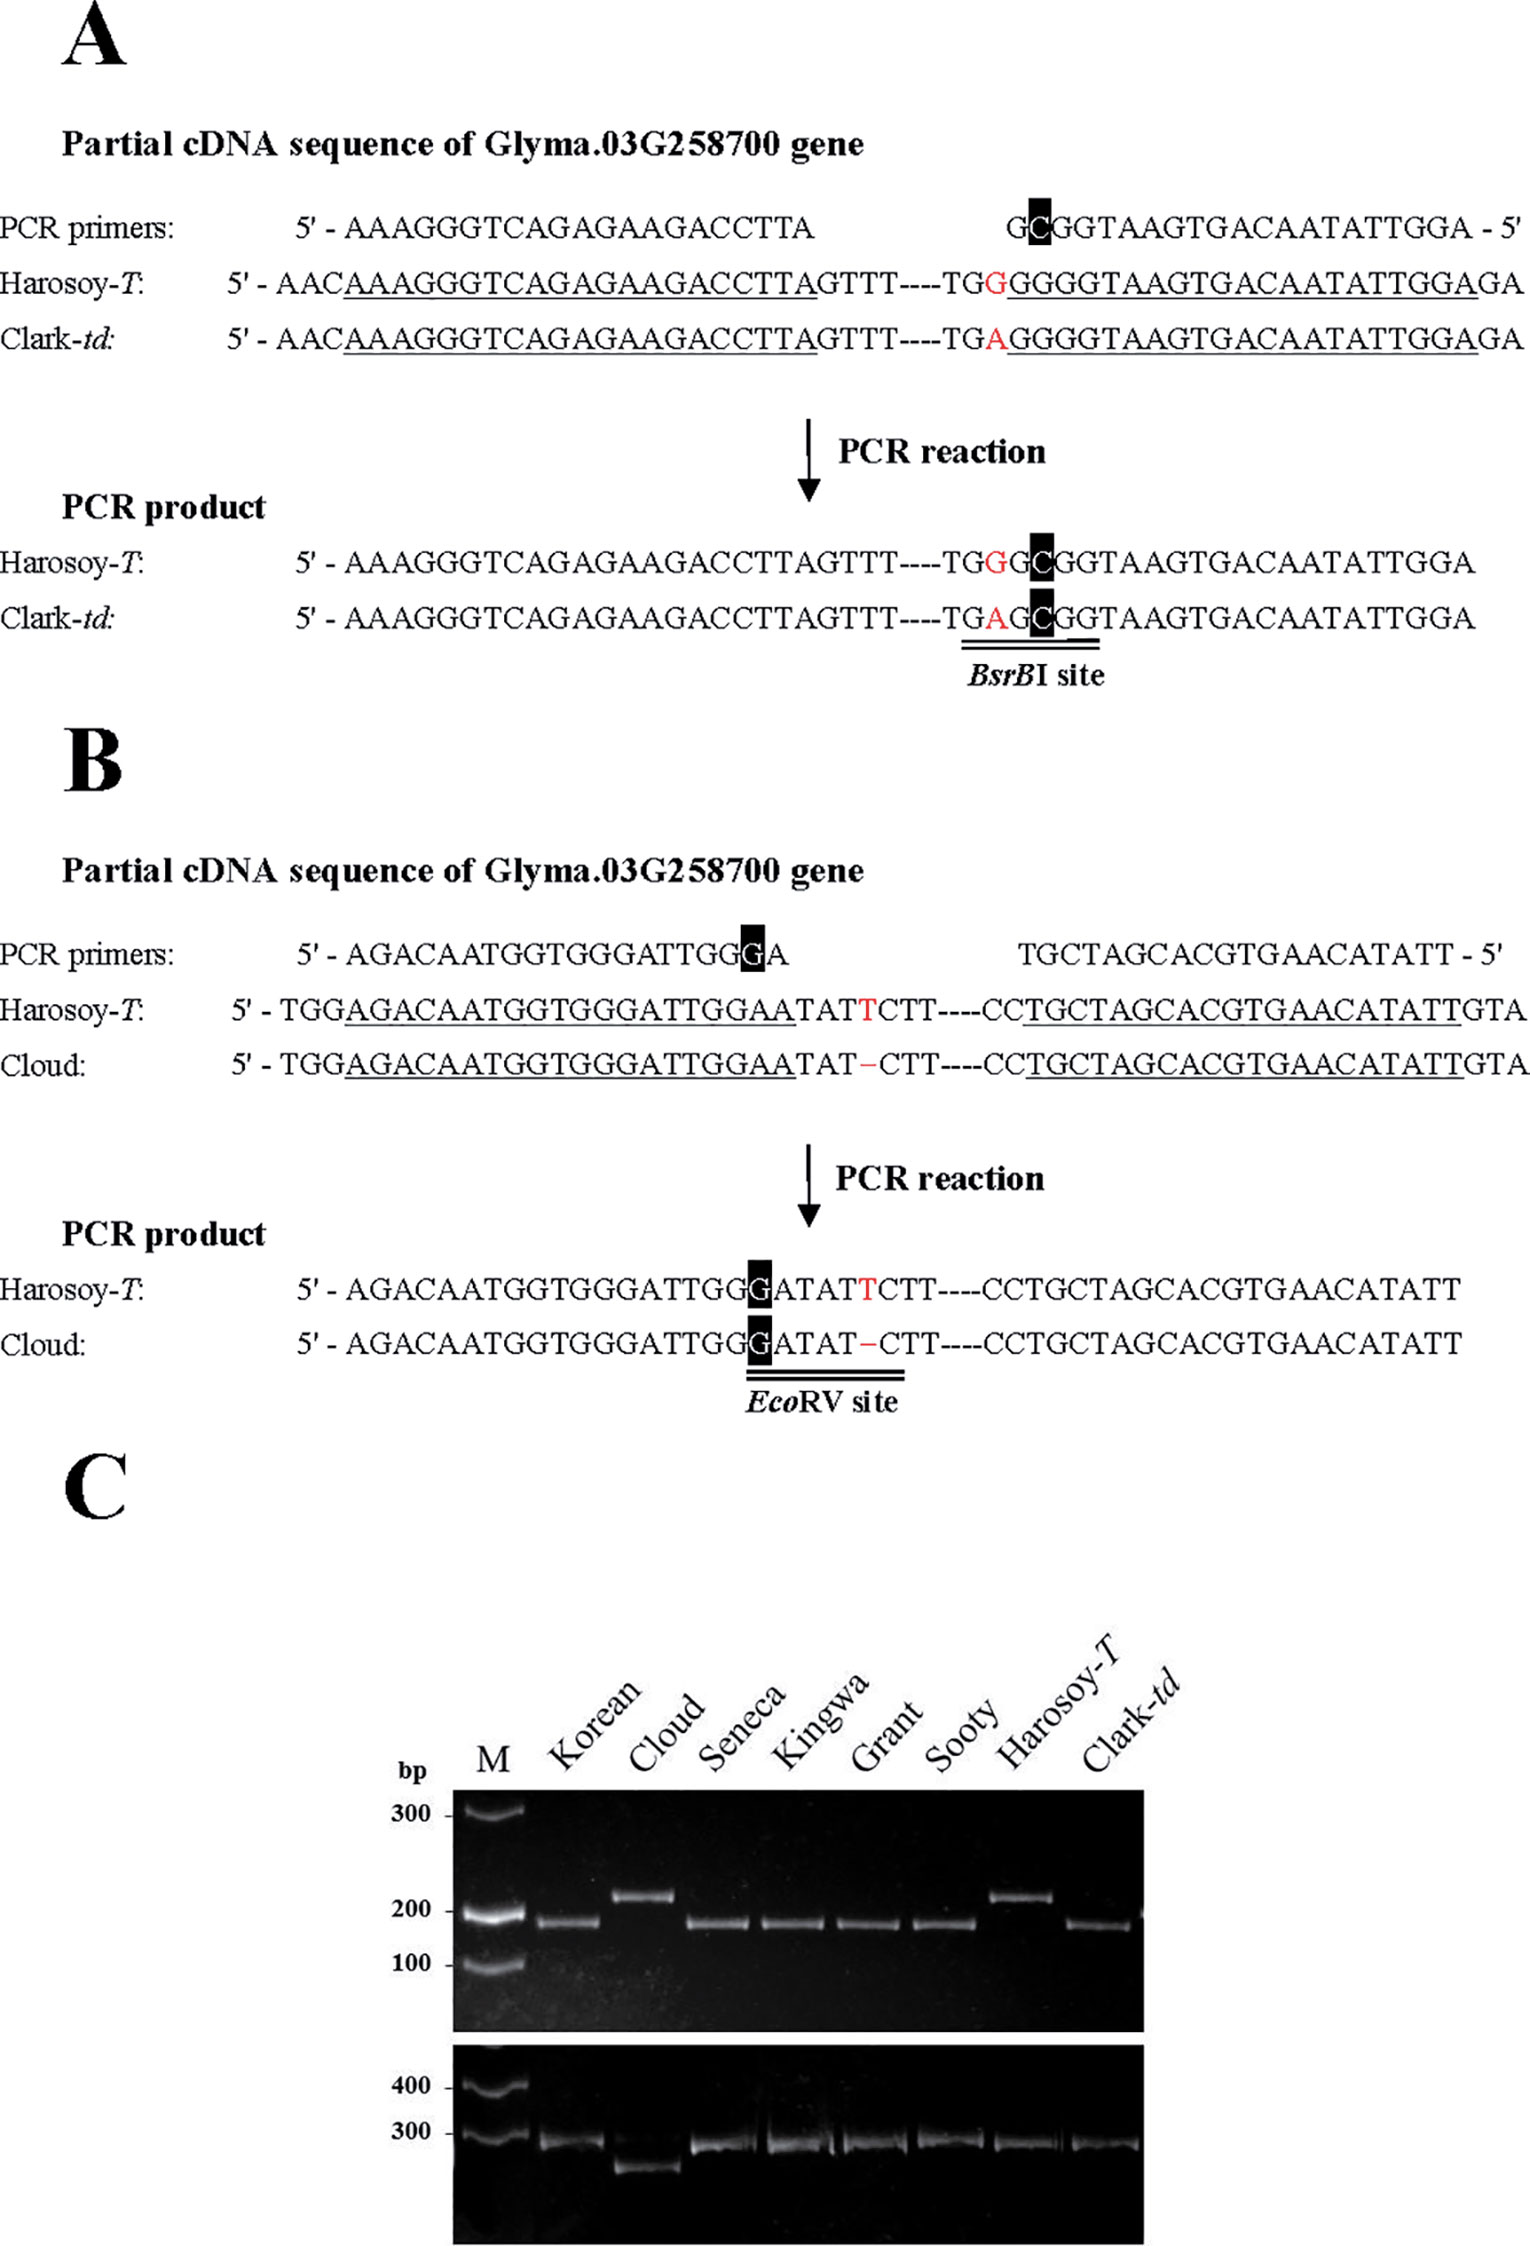
Figure 6 Schematic presentation and results of derived cleaved amplified polymorphic sequences (dCAPS) analysis. (A) dCAPS analysis to detect an SNP. A mismatched nucleotide (C, in white font highlighted in black) was incorporated in the reverse primer to generate a BsrBI site in the PCR product of Clark-td. (B) dCAPS analysis to detect an indel. A mismatched nucleotide (G, in white font highlighted in black) was incorporated in the forward primer to generate an EcoRV site in the PCR product of Cloud. Annealing sites of PCR primers are single-underlined. Polymorphic nucleotides are shown in red font. (C) Results of dCAPS analysis in pubescence color variants. (Upper panel) Results of dCAPS analysis for SNP. PCR products were digested by BsrBI. (Lower panel) Results of dCAPS analysis for indel. PCR products were digested by EcoRV. M: DNA ladder molecular weight marker.
The transcript level of Glyma.03G258700 in pubescence was extremely high (151.6 times of the immature seed), whereas that in the other tissues was comparable with immature seed (leaf: 0.57 time; stem: 0.46 time; root: 2.26 times; root nodule: 5.02 times; flower: 1.38 times) in Harosoy-T (Figure 7A). In pubescence, the transcript level of Glyma.03G258700 was approximately 12% in Clark-td compared with that in Harosoy-T (Figure 7B). Similarly, the transcript levels of two flavone synthase genes, GmFNSII-1 and GmFNSII-2, in Clark-td were approximately 23% and 10%, respectively, of that in Harosoy-T.
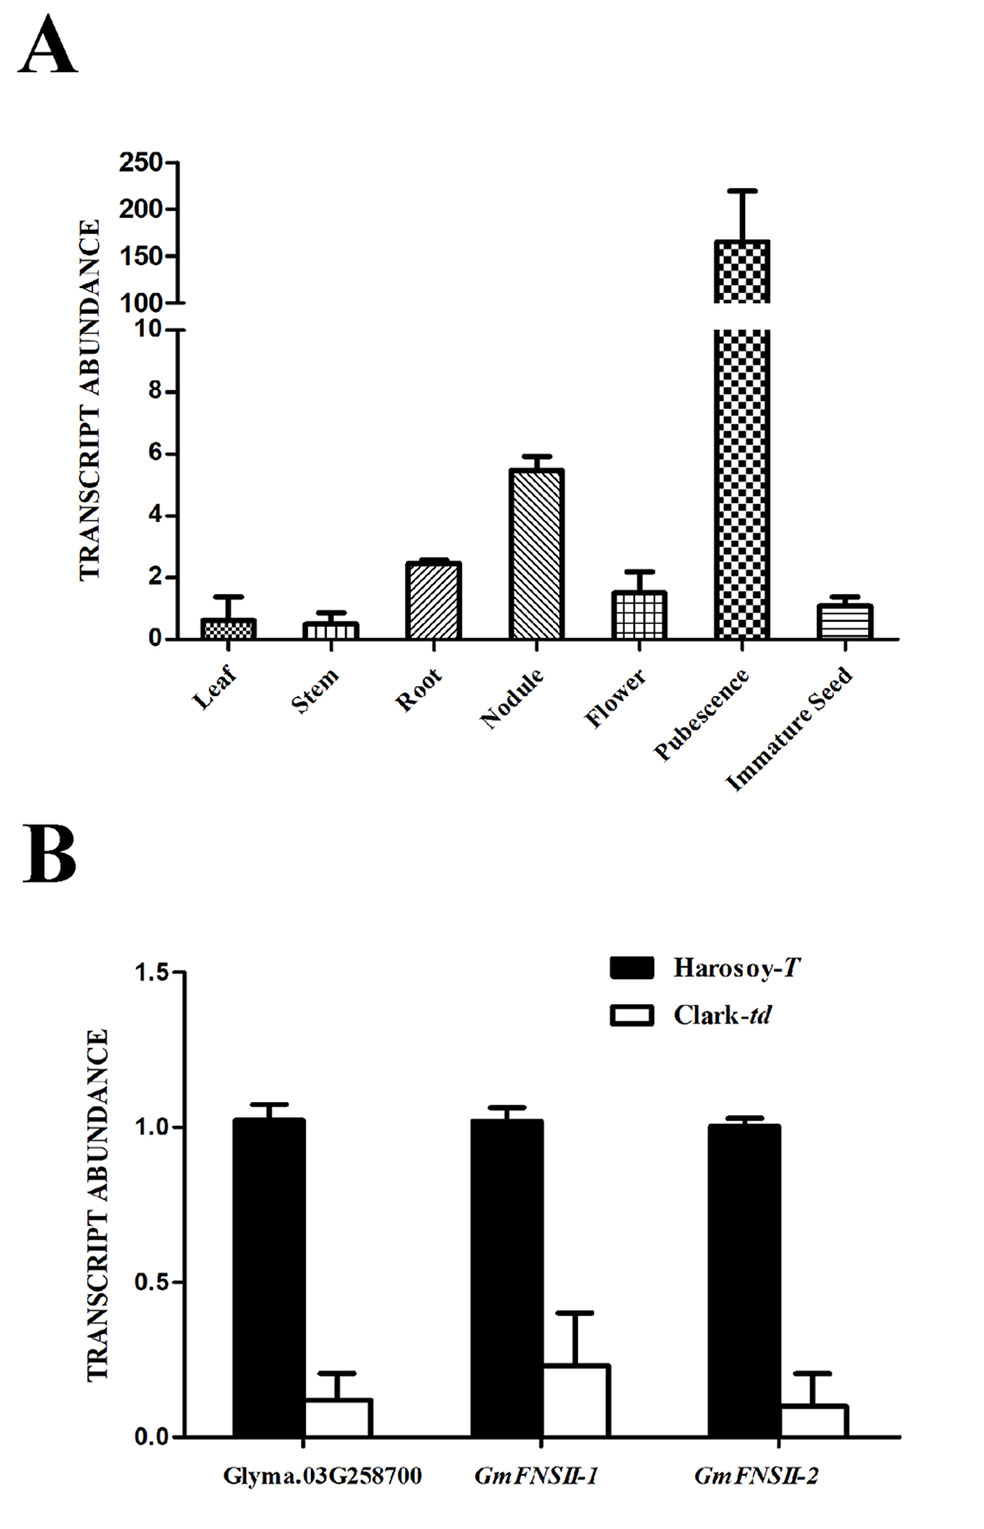
Figure 7 Relative expression of MYB gene (Glyma.03G258700) and two flavone synthase II genes (GmFNSII-1 and GmFNSII-2) in soybean near-isogenic lines. (A) Relative expression of Glyma.03G258700 in various tissues of Harosoy-T. (B) Relative expression of Glyma.03G258700, GmFNSII-1 and GmFNSII-2 in pubescence of Harosoy-T and Clark-td. Transcript levels were standardized by the expression of actin 1 gene. Means and SDs of three biological replications are shown.
The nucleotide sequence of the promoter region had generally a low identity (18%) among the two flavone synthase II genes, GmFNSII-1 and GmFNSII-2, in Williams 82. However, nucleotides around the end of the region were relatively similar (Figure 8). There are six kinds of cis-acting regulatory elements for binding of MYB transcription factors (MYBCORE, MYB2CONSENSUSAT, MYBCOREATCYCB1, MYBPZM, MYB1AT, and MYBPLANT) slightly upstream of the coding region, majority of which are shared by the two genes (Figure 8).
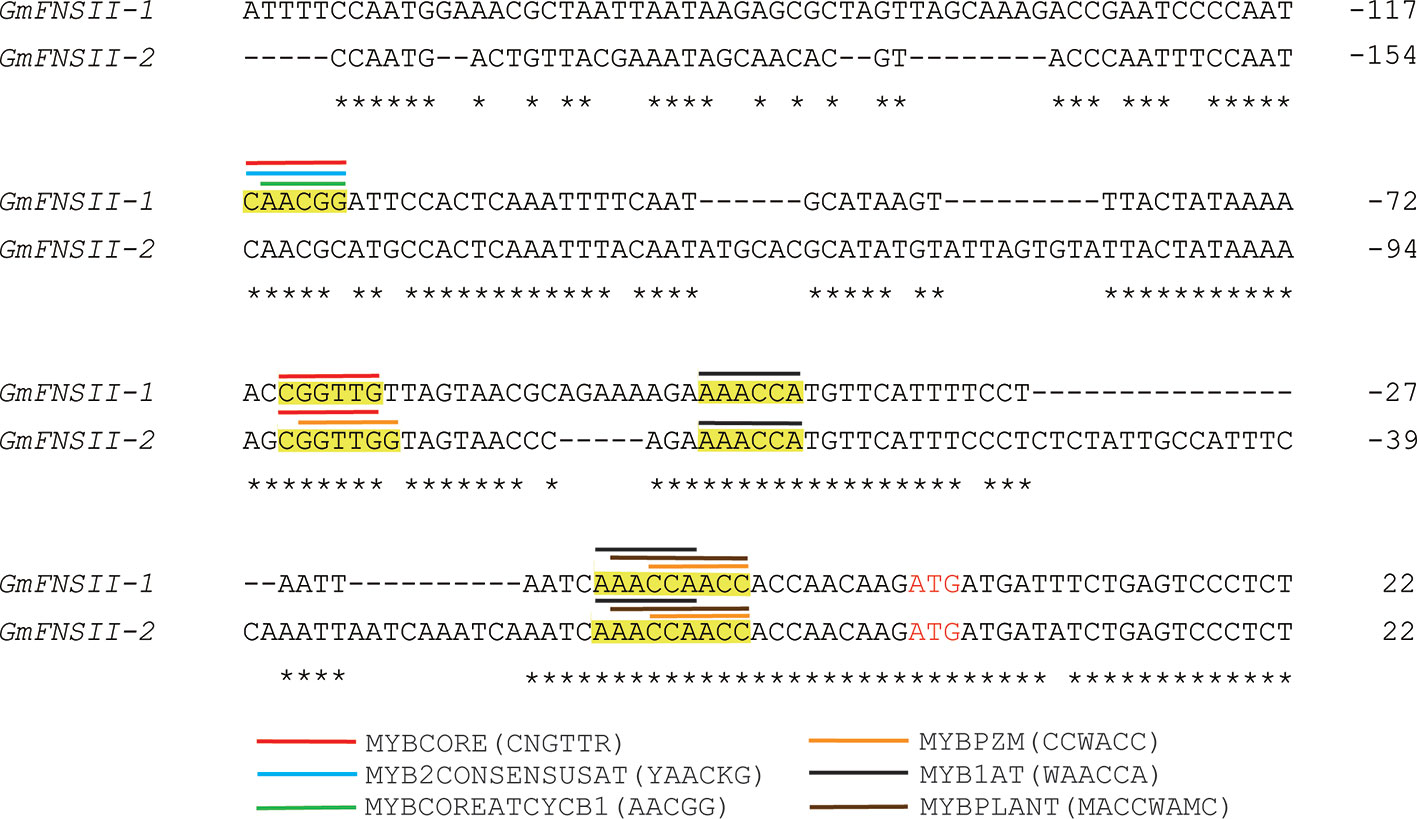
Figure 8 Nucleotide alignment of upstream region of two soybean flavone synthase II genes, GmFNSII-1 and GmFNSII-2, derived from reference genome of cultivar Williams 82. Dashes represent gaps introduced to improve the alignment. Identical nucleotides are indicated by asterisks. Start codon is shown by red font. Putative cis-acting regulatory element regions for MYB transcription factors are highlighted in yellow. Position of each element is shown by bars above nucleotide sequences.
Pubescence color of soybean is controlled by two genes T and Td (Bernard, 1975; Palmer et al., 2004). The T gene encodes a flavonoid 3ʹ-hydroxylase and hydroxylates the 3ʹ-position of the B-ring to generate dihydroxylated flavonoids (Buttery and Buzzell, 1973; Toda et al., 2002). The dominant T allele generates luteolin derivatives and tawny color in pubescence, whereas the recessive t allele produces apigenin derivatives and gray color (Iwashina et al., 2006). Thus, T gene alters pubescence color by changing the structure of flavones. Under the dominant T allele, dominant Td allele generates higher amount of luteolin derivatives and tawny color in pubescence (Iwashina et al., 2006). In contrast, recessive td allele produces less amount of luteolin derivatives and light tawny (or near-gray) pubescence color. These results suggest that the Td gene may control amounts of flavones.
Genetic analysis and linkage mapping using the F2 population and F3 families derived from a cross between NILs with tawny and light tawny pubescence suggested that a gene responsible for pubescence color was located around the end of chromosome 3, which is consistent with the results of GWAS analysis (Wen et al., 2015; Zhou et al., 2015). Flavones are dependent for their biosynthesis on two functional copies of FNS II genes, FNSII-1 and FNSII-2, on chromosome 12 (Fliegmann et al., 2010; Jiang et al., 2010). Accordingly, the FNS II genes may not correspond to the Td gene. There remains a possibility that the Td gene encodes a transcription factor that controls the expression of FNS II genes. Genome sequence alignment of plant introductions revealed that near-gray pubescence is associated with premature stop codons in the coding region of Glyma.03G258700 encoding an R2R3 MYB transcription factor.
However, cDNA of Glyma.03G258700 is truncated and lacks a start codon in the reference genome of Williams 82. Genome sequence alignment indicated that no NGS reads were allocated to the 58-nucleotide region in the middle of the first exon. We presume that the reference sequence of Williams 82 has a mistake at this region. We designed a forward primer upstream of the region and successfully cloned the entire cDNA of Harosoy-T, Clark-td, Cloud, and Williams 82 as well as the entire genomic fragment of Williams 82. The 58-nucleotide sequence of these cDNAs including Williams 82 was completely different from the reference sequence of Williams 82 (Additional File 1: Figure S1 and Additional File 3: Figure S2). Reference sequence of Williams 82 needs to be corrected.
Glyma.03G258700 of Harosoy-T consisted of 840 nucleotides and encoded 279 amino acids. In contrast, cDNA of Clark-td had a nonsense mutation at the nucleotide position 633 and generated a truncated polypeptide comprising 210 amino acids. Further, Cloud had one base deletion at the nucleotide position 677, resulting in a truncated polypeptide comprising 232 amino acids. dCAPS analysis revealed that Grant, Korean, Kingwa, Sooty, and Seneca with td allele had the same SNP with Clark-td. Thus, dCAPS analysis confirmed that Seneca with gray pubescence has the td allele as expected by pedigree information (Bernard, 1975). R2R3 MYB transcription factors have a conserved DNA-binding domain at the N terminus and a more variable C-terminal transcriptional activation domain (Pireyre and Burow, 2015). These results suggest that Glyma.03G258700 corresponds to the Td gene and that premature stop codons disable the transactivating ability of the MYB protein.
There are three types of mutations (type 1 to 3) in the gene (Figure 2 and Additional File 3: Figure S2). Under genetic background of dominant TT allele, cultivars of type 2 and 3 have near-gray pubescence whereas type 1 cultivars have either near-gray or light tawny pubescence. Thus, these types were not directly associated with pubescence color, suggesting that other genetic backgrounds may affect the lightness of pubescence color. The expression level of the gene in pubescence of Clark-td was very low compared with Harosoy-T, probably because of nonsense-mediated mRNA decay, an mRNA surveillance mechanism that eliminates aberrant mRNAs (Chang et al., 2007). Similar observations were made with pubescence color gene T (flavonoid 3'-hydroxylase) and flower color gene Wm (flavonol synthase) in soybean (Toda et al., 2002; Takahashi et al., 2007).
A large number of R2R3 MYB transcription factors are involved in flavonoid biosynthesis. An additional data file shows that majority of the MYB proteins are involved in biosynthesis of anthocyanins, proanthocyanidins, or flavonols (Additional File 2: Table S1) (Liu et al., 2015). The Td gene specifically controls color of pubescence, but not changes the color of flower, seed, or hypocotyl (Bernard, 1975; Palmer and Payne, 1979). The allele at the Td locus did not affect the amounts of anthocyanins, flavonol glycosides, or dihydroflavonol in petals (Iwashina et al., 2007). In addition, the present study revealed that Glyma.03G258700 expresses predominantly in pubescence where flavones are almost exclusively deposited. These results suggest a hypothesis that Glyma.03G258700 has evolved to upregulate biosynthesis of flavones existing in pubescence. Further investigation including expression assays of other flavonoid biosynthesis genes may be necessary to ascertain this hypothesis.
Expression levels of Glyma.03G258700, GmFNSII-1, and GmFNSII-2 in pubescence of Clark-td were extremely low compared with those in Harosoy-T. In addition, the promoter region of FNSII-1 and FNSII-2 shared cis-regulatory elements for MYB transcription factors, including the MYBCORE element. Persimmon DkMYB4 protein having a quite similar MYB-binding domain was proven to bind to the MYBCORE element by electrophoretic mobility shift assays (Akagi et al., 2009). These results strongly suggest that the Glyma.03G258700 protein may also bind to a similar element in the promoter of FNSII genes and upregulate their transcription.
In summary, the wild-type Glyma.03G258700 protein may bind to the promoter of FNS II genes and upregulate their transcription, resulting in high flavone amounts and tawny pubescence color. In contrast, premature stop codons in Glyma.03G258700 may cause a dysfunction in the transactivating ability of the MYB protein. The mutated proteins fail to promote the expression of FNSII genes, resulting in lower flavone amounts and dilute pubescence color. FNS II converts flavanones to flavones. Clark-td occasionally produces isoflavonoids in pubescence (Iwashina et al., 2006). Mutated MYB protein may have failed to promote catalysis of flavanones to flavones. The remaining flavanones may have been transformed by isoflavone synthase to generate isoflavonoids. Electrophoretic mobility shift assays may be necessary to ascertain the interaction between the Glyma.03G258700 protein and the cis-acting regulatory elements in the promoter of FNSII genes. Gene editing and transgenic experiments to prove our hypothesis that Glyma.03G258700 corresponds to the Td gene, upregulates flavone biosynthesis, and deepens pubescence color, remain as future work. Investigations of its promoter may help identify cis-acting regulatory elements involved in pubescence-specific gene expression and develop a genetic system to overproduce specific proteins in the pubescence of soybean.
This study revealed that soybean Td gene encodes a unique R2R3 MYB transcription factor, which controls flavone content and pubescence color. The wild type of MYB protein binds to the promoter of FNS II genes and upregulates their expression, resulting in higher flavone content and deeper pubescence color. Loss-of-function mutation of the MYB gene fails to promote expression of FNSII genes, resulting in diluted pubescence color.
Sequence data from this article have been deposited to DDBJ, with the accession numbers LC485152, LC485153, LC485154, LC512739 and LC512740. The datasets used and/or analyzed during the current study are available from the corresponding author on reasonable request.
FY and RT designed experiments. SG did genetic analysis and linkage mapping. FY, YL, YS, and QW carried out molecular cloning, dCAPS analysis, and gene expression assays.
FY is supported by National Key Research Project (2017YFD0101304), National Natural Science Foundation of China (31671714), Science and Technology Department of Jilin Province (20180201030), and the Fundamental Research Funds for the Central Universities. SG is funded by the Invitational Fellowships for Research in Japan (L08553) (Japan Society for the Promotion of Science).
The authors declare that the research was conducted in the absence of any commercial or financial relationships that could be construed as a potential conflict of interest.
We thank Dr. R.L. Nelson at USDA/ARS University of Illinois for supplying the seeds of the NILs, the Genetic Type Collections, and the cultivars. We are grateful to Dr. Qiu Lijuan at Institute of Crop Science, Beijing, China, for help in NGS analysis of Bay.
The Supplementary Material for this article can be found online at: https://www.frontiersin.org/articles/10.3389/fpls.2019.01809/full#supplementary-material
Additional File 1: Figure S1 | Comparison of nucleotide sequence around the 1st exon of soybean Glyma.03G258700 among reference genome of cultivar Williams 82 (Wm82.a2.v1), genome of three plant introductions and cultivar Bay, and cDNA of Harosoy-T. Genome alignment was created by the Integrative Genomics Viewer. Nucleotide position in chromosome 3 is indicated by arrows above panel. Genome sequence of Williams 82 is shown below panel and aligned with cDNA of Harosoy-T. Identical nucleotides are shown by asterisks. PCR primer for cDNA cloning is single-underlined. Start codon is double-underlined. Exon and intron of Harosoy-T are drawn by black box harboring amino acids and black line, respectively. Gene orientation is indicated by an arrow underneath. Only amino acids in yellow font are indicated as 1st exon in Wm82.a2.v1.
Additional File 2: Table S1 | List of R2R3 MYB transcription factors used in phylogenetic analysis.
Additional File 3: Figure S2 | Gene structure of Glyma.03G258700 deduced from sequencing or dCAPS analysis in pubescence color variants. Exons and introns are shown by boxes and lines, respectively. White and black triangles indicate start codons and stop codons, respectively. Red box represents a region where frameshift mutation occurred due to deletion. Numbers indicate nucleotide position starting from second exon.
Akagi, T., Ikegami, A., Tsujimoto, T., Kobayashi, S., Sato, A., et al. (2009). DkMyb4 is a Myb transcription factor involved in proanthocyanidin biosynthesis in persimmon fruit. Plant Physiol. 151, 2028–2045. doi: 10.1104/pp.109.146985
Altschul, S. F., Madden, T. L., Schaffer, A. A., Zhang, J. H., Zhang, Z., et al. (1997). Gapped BLAST and PSI-BLAST: a new generation of protein database search programs. Nucleic Acids Res. 25, 3389–3402. doi: 10.1093/nar/25.17.3389
Bandillo, N. B., Lorenz, A. J., Graef, G. L., Arquin, D., Hyten, D. L., et al. (2017). Genome-wide association mapping of qualitatively inherited traits in a germplasm collection. Plant Genome 10. doi: 10.3835/plantgenome2016.06.0054
Bernard, R. L., Nelson, R. L., Cremeens, C. R. (1991). USDA soybean genetic collections: isoline collection. Soyb. Genet. Newsl. 18, 27–57.
Buttery, B. R., Buzzell, R. I. (1973). Varietal differences in leaf flavonoids of soybeans. Crop Sci. 13, 103–106. doi: 10.2135/cropsci1973.0011183X001300010033x
Chang, Y. F., Imam, J. S., Wilkinson, M. E. (2007). The nonsense-mediated decay RNA surveillance pathway. Annu. Rev. Biochem. 76, 51–74. doi: 10.1146/annurev.biochem.76.050106.093909
Cregan, P. B., Jarvik, T., Bush, A. L., Shoemaker, R. C., Lark, K. G., et al. (1999). An integrated genetic linkage map of the soybean genome. Crop Sci. 39, 1464–1490. doi: 10.2135/cropsci1999.3951464x
Fehr, W. R., Caviness, C. E., Burmood, D. T., Pennington, J. S. (1971). Stage of development descriptions for soybeans, glycine-max (L) merrill. Crop Sci. 11, 929–931. doi: 10.2135/cropsci1971.0011183X001100060051x
Fliegmann, J., Furtwangler, K., Malterer, G., Cantarello, C., Schuler, G., et al. (2010). Flavone synthase II (CYP93B16) from soybean (Glycine max L.). Phytochemistry 71, 508–514. doi: 10.1016/j.phytochem.2010.01.007
Gillman, J. D., Tetlow, A., Lee, J. D., Shannon, J. G., Bilyeu, K. (2011). Loss-of-function mutations affecting a specific Glycine max R2R3 MYB transcription factor result in brown hilum and brown seed coats. BMC Plant Biol. 11, 155. doi: 10.1186/1471-2229-11-155
Higo, K., Ugawa, Y., Iwamoto, M., Korenaga, T. (1999). Plant cis-acting regulatory DNA elements (PLACE) database: 1999. Nucleic Acids Res. 27, 297–300. doi: 10.1093/nar/27.1.297
Iwashina, T., Benitez, E. R., Takahashi, R. (2006). Analysis of flavonoids in pubescence of soybean near-isogenic lines for pubescence color loci. J. Hered. 97, 438–443. doi: 10.1093/jhered/esl027
Iwashina, T., Githiri, S. M., Benitez, E. R., Takemura, T., Kitajima, J., et al. (2007). Analysis of flavonoids in flower petals of soybean near-isogenic lines for flower and pubescence color genes. J. Hered. 98, 250–257. doi: 10.1093/jhered/esm012
Jiang, Y. N., Wang, B. A., Li, H., Yao, L. M., Wu, T. L. (2010). Flavonoid production is effectively regulated by RNAi interference of two flavone synthase genes from Glycine max. J. Plant Biol. 53, 425–432. doi: 10.1007/s12374-010-9132-9
Kumar, S., Stecher, G., Li, M., Knyaz, C., Tamura, K. (2018). MEGA X: Molecular evolutionary genetics analysis across computing platforms. Mol. Biol. Evol. 35, 1547–1549. doi: 10.1093/molbev/msy096
Lander, E. S., Green, P., Abrahamson, J., Barlow, A., Daly, M. J., et al. (1987). MAPMAKER: an interactive computer package for constructing primary genetic linkage maps of experimental and natural populations. Genomics 1, 174–181. doi: 10.1016/0888-7543(87)90010-3
Liu, J. Y., Osbourn, A., Ma, P. D. (2015). MYB transcription factors as regulators of phenylpropanoid metabolism in plants. Mol. Plant 8, 689–708. doi: 10.1016/j.molp.2015.03.012
Martens, S., Mithofer, A. (2006). Flavones and flavone synthases. Phytochemistry 67, 521–521. doi: 10.1016/j.phytochem.2006.01.004
Murai, Y., Yan, F., Iwashina, T., Takahashi, R. (2016). Analysis of anthocyanin pigments in soybean hypocotyl. Can. J. Plant Sci. 96, 935–938. doi: 10.1139/cjps-2016-0055
Murray, M. G., Thompson, W. F. (1980). Rapid isolation of high molecular weight plant DNA. Nucleic Acids Res. 8, 4321–4325. doi: 10.1093/nar/8.19.4321
Palmer, R. G., Payne, R. C. (1979). Genetic control of hypocotyl pigmentation among white-flowered soybeans grown in continuous light. Crop Sci. 19, 124–126. doi: 10.2135/cropsci1979.0011183X001900010033x
Palmer, R. G., Pfeiffer, T. W., Buss, G. R., Kilen, T. C. (2004). “Qualitative genetics,” in Soybeans: Improvement, Production, and Uses,” 3rd edition. Eds. Boerma, H. R., Specht., J. E. (Madison, WI: American Society of Agronomy).
Pireyre, M., Burow, M. (2015). Regulation of MYB and bHLH transcription factors: a glance at the protein level. Mol. Plant 8, 378–388. doi: 10.1016/j.molp.2014.11.022
Robinson, J. T., Thorvaldsdottir, H., Winckler, W., Guttman, M., Lander, E. S., et al. (2011). Integrative genomics viewer. Nat. Biotechnol. 29, 24–26. doi: 10.1038/nbt.1754
Rojas Rodas, F., Rodriguez, T. O., Murai, Y., Iwashina, T., Sugawara, S., et al. (2014). Linkage mapping, molecular cloning and functional analysis of soybean gene Fg2 encoding flavonol 3-O-glucoside (1→6) rhamnosyltransferase. Plant Mol. Biol. 84, 287–300. doi: 10.1007/s11103-013-0133-1
Song, Q. J., Marek, L. F., Shoemaker, R. C., Lark, K. G., Concibido, V. C., et al. (2004). A new integrated genetic linkage map of the soybean. Theor. Appl. Genet. 109, 122–128. doi: 10.1007/s00122-004-1602-3
Takahashi, R., Githiri, S. M., Hatayama, K., Dubouzet, E. G., Shimada, N., et al. (2007). A single-base deletion in soybean flavonol synthase gene is associated with magenta flower color. Plant Mol. Biol. 63, 125–135. doi: 10.1007/s11103-006-9077-z
Takahashi, R., Benitez, E. R., Oyoo, M. E., Khan, N. A., Komatsu, S. (2011). Nonsense mutation of an MYB transcription factor is associated with purple-blue flower color in soybean. J. Hered. 102, 458–463. doi: 10.1093/jhered/esr028
Takahashi, R., Yamagishi, N., Yoshikawa, N. (2013). A MYB transcription factor controls flower color in soybean. J. Hered. 104, 149–153. doi: 10.1093/jhered/ess081
Toda, K., Yang, D. J., Yamanaka, N., Watanabe, S., Harada, K., et al. (2002). A single-base deletion in soybean flavonoid 3'-hydroxylase gene is associated with gray pubescence color. Plant Mol. Biol. 50, 187–196. doi: 10.1023/A:1016087221334
Wen, Z. X., Boyse, J. F., Song, Q. J., Cregan, P. B., Wang, D. C. (2015). Genomic consequences of selection and genome-wide association mapping in soybean. BMC Genomics 16, 671. doi: 10.1186/s12864-015-1872-y
Wollenweber, E. (1994). “Flavones and flavonols.,” in The flavonoids, advances in research since 1986. Ed. Harborne, J. B. (London, UK: Chapman & Hall), 259–335.
Yan, F., Di, S., Takahashi, R. (2015). CACTA-superfamily transposable element is inserted in MYB transcription factor gene of soybean line producing variegated seeds. Genome 58, 365–374. doi: 10.1139/gen-2015-0054
Keywords: soybean, MYB transcription factor, flavone synthase II, pubescence color, Td gene
Citation: Yan F, Githiri SM, Liu Y, Sang Y, Wang Q and Takahashi R (2020) Loss-of-Function Mutation of Soybean R2R3 MYB Transcription Factor Dilutes Tawny Pubescence Color. Front. Plant Sci. 10:1809. doi: 10.3389/fpls.2019.01809
Received: 29 September 2019; Accepted: 24 December 2019;
Published: 31 January 2020.
Edited by:
Roberto Papa, Marche Polytechnic University, ItalyReviewed by:
Francesca Sparvoli, Istituto di Biologia E Biotecnologia Agraria (IBBA), ItalyCopyright © 2020 Yan, Githiri, Liu, Sang, Wang and Takahashi. This is an open-access article distributed under the terms of the Creative Commons Attribution License (CC BY). The use, distribution or reproduction in other forums is permitted, provided the original author(s) and the copyright owner(s) are credited and that the original publication in this journal is cited, in accordance with accepted academic practice. No use, distribution or reproduction is permitted which does not comply with these terms.
*Correspondence: Fan Yan, eWFuZmFuQGpsdS5lZHUuY24=
Disclaimer: All claims expressed in this article are solely those of the authors and do not necessarily represent those of their affiliated organizations, or those of the publisher, the editors and the reviewers. Any product that may be evaluated in this article or claim that may be made by its manufacturer is not guaranteed or endorsed by the publisher.
Research integrity at Frontiers
Learn more about the work of our research integrity team to safeguard the quality of each article we publish.