 Yunna Zhu1,2
 Yanwei Hao
 Houcheng Liu
 Shiwei Song
- 1College of Horticulture, South China Agricultural University, Guangzhou, China
- 2College of Yingdong Agricultural Science and Engineering, Shaoguan University, Shaoguan, China
The provision of ammonium (NH4+) and nitrate (NO3−) mixture increases the total nitrogen (N) than the supply of sole NH4+ or NO3– with the same concentration of total N; thus, the mixture contributes to better growth in Brassica campestris. However, the underlying mechanisms remain unknown. In this study, we analyzed NH4+ and NO3– fluxes using a scanning ion-selective electrode technique to detect under different N forms and levels in B. campestris roots. We observed that the total N influxes with NH4+ and NO3− mixture were 1.25- and 3.53-fold higher than those with either sole NH4+ or NO3−. Furthermore, NH4+ and NO3– might interact with each other under coexistence. NO3– had a positive effect on net NH4+ influx, whereas NH4+ had a negative influence on net NO3– influx. The ammonium transporter (AMT) played a key role in NH4+ absorption and transport. Based on expression analysis, BcAMT1.2 differed from other BcAMT1s in being upregulated by NH4+ or NO3−. According to sequence analysis and functional complementation in yeast mutant 31019b, AMT1.2 from B. campestris may be a functional AMT. According to the expression pattern of BcAMT1.2, β-glucuronidase activity, and the cellular location of its promoter, BcAMT1.2 may be responsible for NH4+ transport. Following the overexpression of BcAMT1.2 in Arabidopsis, BcAMT1.2-overexpressing lines grew better than wildtype lines at low NH4+ concentration. In the mixture of NH4+ and NO3–, NH4+ influxes and NO3– effluxes were induced in BcAMT1.2-overexpressing lines. Furthermore, transcripts of N assimilation genes (AtGLN1.2, AtGLN2, and AtGLT1) were significantly upregulated, in particular, AtGLN1.2 and AtGLT1 were increased by 2.85–8.88 times in roots, and AtGLN1.2 and AtGLN2 were increased by 2.67–4.61 times in leaves. Collectively, these results indicated that BcAMT1.2 may mediate in NH4+ fluxes under the coexistence of NH4+ and NO3– in B. campestris.
Introduction
The efficiency and availability of nitrogen (N) have decisive influences on plant growth and crop productivity (Hachiya and Sakakibara, 2017). For most plants, nitrate (NO3–) and ammonium (NH4+) are major sources of inorganic N. In C3 plants, NO3– reduction is inhibited by elevated carbon dioxide (CO2), whereas NH4+ assimilation is affected little (Bloom et al., 2010). NH4+ is believed to be a preferable N source for the future when global levels of CO2 are predicted to increase (Hachiya and Sakakibara, 2017). However, NH4+ at millimolar concentrations in the soil solution or hydroponic culture causes growth suppression and chlorosis (ammonium toxicity) in plants, unlike NO3– at the same concentration (Miller and Cramer, 2004).
Extensive studies suggest that a mixture of NO3– and NH4+ nutrition stimulates plant growth beyond that observed with NO3– or NH4+ alone (Britto and Kronzucker, 2001). The use of the mixture enhances N-use efficiency and improves crop productivity (Wang and Shen, 2011; Hachiya et al., 2012). The mixture greatly improves plant growth and population productivity in maize, especially in high planting density (Wang et al., 2019). When NO3– and NH4+ co-exist, NH4+ responses are altered by NO3– and vice versa (Hachiya and Sakakibara, 2017). Previous researchers have investigated the interaction between NH4+ and NO3– fluxes. Compared with the influx with sole NH4+, net NH4+ influx has been shown to increase with a mixture of NH4+ and NO3– in rice using an N labeling technique (Kronzucker et al., 1999); and a similar effect has been observed in Brassica napus (Babourina et al., 2007), Populus popularis (Luo et al., 2013), and Triticum aestivum (Zhong et al., 2015) using the microelectrode technique, whereas a negative effect has been observed in tea (Ruan et al., 2016). Similarly, NH4+ affects NO3– fluxes (Kronzucker et al., 1999; Zhong et al., 2015; Ruan et al., 2016). Therefore, the interaction between NH4+ and NO3– may depend on plant species or N conditions.
Under natural conditions, plant growth and development are typically limited by N availability; thus, plants have evolved different transport and signaling mechanisms to adapt to different N sources (Kiba and Krapp, 2016). NH4+ and NO3– fluxes are mediated by specific genes for ammonium transporters (AMTs) and nitrate transporters (NRTs), respectively (Nacry et al., 2013). In Arabidopsis, NRTs include 72 members belonging to four families: nitrate transporter 1/peptide transporter family (NRT1/PTR), NRT2, chloride channels (CLC), and slow anion channel-associated 1/slow anion channel homologs (SLAC1/SLAH) (Krapp et al., 2014). Some of these genes are related to NO3– uptake, xylem loading, and efflux systems (Krapp et al., 2014). AMTs generally contain AMT1 and AMT2 subfamilies (Loque and von Wirén, 2004; McDonald and Ward, 2016). In Arabidopsis, AtAMT1.1, AtAMT1.2, AtAMT1.3, and AtAMT1.5 are expressed in roots (Yuan et al., 2007), and play different roles during NH4+ assimilation (Yuan et al., 2007). AtAMT1.1, AtAMT1.3 and AtAMT1.5 contribute to NH4+ absorption from the soil, whereas AtAMT1.2 mediates NH4+ uptake via the apoplastic transport route (Yuan et al., 2007), and exclusively regulates NH4+ flux into the vasculature (Straub et al., 2017). Furthermore, plant cells eliminate the activity of AMT1.1 (Lanquar et al., 2009) or AMT1.3 (Wang et al., 2013) to avoid excessive NH4+ accumulation.
AMTs transcript levels are affected by the N status of plants. N deficiency strongly induces AMT1.1, AMT1.3, and AMT1.5 transcription (Yuan et al., 2007; Camañes et al., 2009), whereas that of AMT1.2 is not affected to a large extent (Pearson et al., 2002). When NH4+ is resupplied to N-deficient plants, AMT1.1, AMT1.3, and AMT1.5 genes are downregulated (Yuan et al., 2007); whereas AMT1.2 is upregulated (Pearson et al., 2002; Yuan et al., 2007). Furthermore, AMTs transcript levels are subjected to control by NO3– (Camañes et al., 2009). However, AMT homologs in different species are often not similarly regulated, which may reflect the different nutritional needs of particular species (Loque and von Wirén, 2004).
Flowering Chinese cabbage (Brassica campestris L. ssp. chinensis var. utilis Tsen et Lee) is a prominent vegetable in South China due to the taste and nutrient content of its flower stalk, and it has the largest growing area and yield in South China (Song et al., 2012). In our previous study, we showed that NH4+ and NO3– mixtures were more beneficial to B. campestris qualities than sole N source, and they improved N-use efficiency (Song et al., 2012). However, there is no information regarding the interactions between NH4+ and NO3– and how this affects N uptake at physiological, morphological, and molecular levels. In this study, we examined the characteristics of NH4+ and NO3– fluxes and their interactions in B. campestris using the scanning ion-selective electrode technique (SIET). Regarding the analysis of AMT1s transcripts, we observed that the expression pattern of BcAMT1.2 differed from those of other BcAMT1s in B. campestris. Furthermore, the GUS activity of BcAMT1.2pro::GUS and used reverse genetic approaches in Arabidopsis suggested to elucidate the physiological roles of BcAMT1.2 in response to the coexistence of NH4+ and NO3–. Altogether, these results indicated that BcAMT1.2 participated in the interaction between NH4+ and NO3– in B. campestris.
Materials and Methods
Plant Materials and Culture Conditions
The flowering Chinese cabbage variety “Youlv80”, which was provided by the Guangzhou Academy of Agriculture Sciences (Guangdong Province, China), was used in this study. Experiments were carried out in a controlled-environment growth chamber programmed for 16 h light/8 h dark and a 25/23°C day/night cycle, relative humidity of 70%, and light intensity of 150 μmol m–2 s–1. Seeds were sterilized in 2.5% (w/v) NaClO for 10 min, washed five times with sterile distilled water, and cultured on vertical 0.7% agar plates (17.5 cm long × 16 cm wide × 3 cm high). The agar medium contained 1/2 no-N basal modified MS salt (pH 5.8), supplemented with 4 mmol L–1 NaNO3 as the N source. On the 6th day of germination, the seedlings were hydroponically cultured in 1/2 MS as an N-deficient treatment for 7 d. The nutrient solution was replaced every 2 days and continually aerated by air pumps. After N starvation, the seedlings were harvested to measure ion fluxes or other treatments.
Measurement of NH4+ and NO3– Ion Fluxes on the Surface of B. campestris Roots
To monitor net fluxes of NH4+ and NO3– in B. campestris roots in response to different N treatments, the primary roots were selected and immersed in measuring solutions with different treatment [A. 0.25 mmol L–1 NH4+: 0.1 mmol L–1 CaCl2, 0.3 mmol L–1 2-(N-morpholino) ethanesulfonic acid hydrate buffer (MES) (pH5.8, same as below), and 0.25 mmol L–1 NH4Cl; B. 1.0 mmol L–1 NH4+: 0.1 mmol L–1 CaCl2, 0.3 mmol L–1 MES, and 1.0 mmol L–1 NH4Cl; C. 0.25 mmol L–1 NO3–: 0.1 mmol L–1 CaCl2, 0.3 mmol L–1 MES, and 0.25 mmol L–1 NaNO3; D. 1.0 mmol L–1 NO3–: 0.1 mmol L–1 CaCl2, 0.3 mmol L–1 MES, and 1.0 mmol L–1 NaNO3; E. NH4+ + NO3–: 0.1 mmol L–1 CaCl2, 0.3 mmol L–1 MES, 0.25 mmol L–1 NH4Cl, and 0.75 mmol L–1 NaNO3]. Prior to analysis, B. campestris roots were transferred to Petri dishes containing 10 mL of measuring solution and equilibrated for 10 min. The equilibrated roots were moved to another Petri dish containing fresh measuring solution to measure NH4+ or NO3– flux. Ion flux was measured using SIET (MA01002 system; Younger USA Science and Technology Limited Liability Company, Amherst, MA, USA), which was conducted on-site at Xuyue Science and Technology Company Limited (Beijing, China). The SIET system and its application process for ion flux detection have been previously described in detail (Zhong et al., 2015; Ruan et al., 2016).
To determine the regions along the root where the maximal ion influxes of NH4+ or NO3– occurred, a preliminary experiment was conducted, in which an initial measurement was performed at different points from the root tip (1, 2, 4, 10, 15, 20, 25, 30, and 35 mm). Based on this experiment, we selected 20 and 30 mm from the root apex as the measurement site of NH4+ and NO3– influxes (Supplementary Figure S2). The recording rate of ion flux was one reading every 6 s and this lasted for 10 min in each root. Six similar seedlings per treatment were measured.
To evaluate the interaction of NH4+ and NO3– fluxes, the roots of B. campestris were soaked in measurement solutions. The effect of NO3– on NH4+ flux [F (with NO3–): 0.1 mmol L–1 CaCl2, 0.3 mmol L–1 MES, 0.1 mmol L–1 NH4Cl, and 1 mmol L–1 NaNO3; G (without NO3–): 0.1 mmol L–1 CaCl2, 0.3 mmol L–1 MES, 0.1 mmol L–1 NH4Cl]. The NH4+ flux was measured using SIET for 3 min after equilibration in measuring solution for 10 min. Thereafter, 1.0 mmol L–1 NH4Cl was added to the measuring solution, which was mixed thoroughly by expelling and drawing it into a pipette during the first 1–2 min. NO3– flux was measured using SIET for 17 min. The effect of NH4+ on NO3– flux [H (with NH4+): 0.1 mmol L–1 CaCl2, 0.3 mmol L–1 MES, 0.1 mmol L–1 NaNO3, with 1 mmol L–1 NH4Cl; I (without NH4+): 0.1 mmol L–1 CaCl2, 0.3 mmol L–1 MES, 0.1 mmol L–1 NaNO3]. NO3– flux was measured utilizing SIET for 3 min after equilibrated in measurement solution for 10 min. Thereafter, 1.0 mmol L–1 NaNO3 was added to the measuring solution. The test process was the same as that described above. Six biological replicates were used for each measurement.
Analysis of AMTs and NRTs Transcripts in Roots
B. campestris seedlings that had been N-starved for 7 d were subjected to different N treatments. The treatments were as follows: (1) exposure to different N levels: 0, 0.25, and 1.0 mmol L–1 NaNO3/NH4Cl were added, then roots were harvested after 20 min during the N-resupply treatments; (2) effect of NH4+ on NO3–: 1 mmol L–1 NH4Cl was added into the solution with or without NaNO3, then roots were harvested at 0, 10, and 20 min after adding NH4Cl; (3) effect of NO3– on NH4+: 1 mmol L–1 NaNO3 was added into the solution with or without NH4Cl, then roots were harvested at 0, 10, and 20 min after adding NaNO3. All samples were immediately frozen in liquid nitrogen and stored at –80°C for quantitative real-time polymerase chain reaction (qPCR).
qPCR
Total RNA was extracted from samples using an Eastep® Super Total RNA Extraction Kit (Promega, Beijing, China) and was reverse transcribed using a PrimeScript™ RT reagent Kit with gDNA Eraser (TaKaRa Bio, Dalian, China). The qPCR was performed in a LightCycler 480 Real-Time PCR System (Roche, Basel, Switzerland), using SYBR® Premix Ex Taq™ (TaKaRa Bio). The primer pairs used are listed in Supplementary Table S1. GAPDH was used as an internal control. Three biological replicates were used to calculate relative gene expression levels.
BcAMT1.2 Cloning and Sequence Analysis
Based on the AMT1.2 sequence of Brassica rapa (retrieved from GenBank, accessions no. XM_009113156.2), primers (Supplementary Table S1) were designed to amplify the full-length of BcAMT1.2 by PCR using the cDNA of B. campestris as the template. The PCR product was cloned into binary vector pCAMBIA3301 (Dingguo Biotechnology, Beijing, China) that carried two CaMV 35S promoters (35Spro) and phosphinothricin resistance marker genes and was sequenced. Based on the deduced amino acid sequence, transmembrane motifs, subcellular localization, and signature motifs were predicted using Protter (http://wlab.ethz.ch/protter/), Softberry (http://www.softberry.com), and Weblogo (http://weblogo.berkeley.edu/logo.cgi/), respectively. The multiple sequence alignment of 32 AMT proteins from plants was performed using the ClustalW method and a phylogenetic tree was constructed using MEGA 6.0 based on the neighbor-joining algorithm. Bootstrap analysis was carried out with 1000 replicates. The accession numbers of the amino acid sequences of the AMTs are listed in Supplementary Table S2.
Heterologous Expression of BcAMT1.2 in Yeast
The open reading frame (ORF) of BcAMT1.2 was amplified by PCR using the primers (Supplementary Table S1) and constructed into pYES2 vector (Waryong Biotechnology, Beijing, China). As described by Yuan et al. (2007), pYES2 and pYES2-BcAMT1.2 plasmids were transformed into yeast mutant cells 31019b (Δmep1, Δmep2, Δmep3, and ura3). Growth complementation assays were performed on a solid yeast N base medium at pH 5.8 and were supplemented with 2% galactose and 2 mmol L–1 arginine or NH4Cl as the sole N source. Yeast cells were incubated at 30°C for 3 days.
BcAMT1.2::GUS Constructs Used for Arabidopsis Transformation and β-Glucuronidase (GUS) Assays
The BcAMT1.2::GUS construct, containing 1519 bp of BcAMT1.2 promoter cloned by our lab, was amplified by PCR from the DNA of B. campestris using special primers (Supplementary Table S1). They were ligated into the pCAMBIA1391 vector which harbored GUS, without a promoter (Dingguo Biotechnology), yielding a pCAMBIA1391-BcAMT1.2pro::GUS construct. Via Agrobacterium tumefaciens-mediated transformation, BcAMT1.2pro::GUS transgenic plants were generated in a wildtype (Col-0) background. Second generation (T2) seeds were germinated on a medium containing 1/2 modified MS, 4 mmol L–1 NaNO3 and 0.7% agar for 14 d (growth conditions as described above). Some seedlings were subjected to N-free MS treatment for 4 d, and transferred to either the nutrition of N-free MS or the one of N-free MS containing 0.25 mmol L–1 NH4+/NO3–, and incubated with gentle shaking for 2 h. Histochemical GUS assays were performed as described by Yao et al. (2008). After histochemical staining, seedlings were cleared in 70% ethanol. The images were examined under a digital microscope (VHX-5000; Keyence, Osaka, Japan).
Generation of BcAMT1.2-Overexpressing Arabidopsis Transgenic Lines
Wildtype Arabidopsis (Col-0) was transformed with Agrobacterium GV3101 harboring the pCAMBIA3301-35Spro::BcAMT1.2 construct. Several transformants were screened by Basta on soil and subjected to PCR analysis using bar primers and qPCR tests of leaves using special BcAMT1.2 primers (Supplementary Table S1). Independent homozygous BcAMT1.2-transformed lines were generated in the T4 generation.
Plant Culture for Growth Test, NH4+ Content, Ion Fluxes, and Gene Expression
For the growth test, surface-sterilized Arabidopsis seeds were germinated on a 1/2 MS agar-medium (containing 4 mmol L–1 NaNO3 as N source) for 4 d and the seedlings were transferred to vertical plates containing 0.25 mmol L–1 NH4Cl for 10 d. Ten seedlings were used for the measurements of biomass and primary root length. Then, seedlings were mixed to measure the NH4+ content; 3 biological replicates were used for each line. The measurement of NH4+ content has been previously described by Ivančič and Degobbis (1984).
For the ion flux test, surface-sterilized Arabidopsis seeds were germinated on a 1/2 MS agar-medium (containing 4 mmol L–1 NaNO3 as N source) for 4 d and transferred to an N-free 1/2 MS agar-medium for 7 d. Arabidopsis roots were transferred to a measuring solution (0.1 mmol L–1 CaCl2, 0.3 mmol L–1 MES, 0.25 mmol L–1 NH4Cl, and 0.75 mmol L–1 NaNO3) and NO3– and NH4+ fluxes were measured using SIET. Six similar seedlings per treatment were selected to measure ion flux.
Arabidopsis seeds were pre-cultured for 4 d (as described above for the ion flux test) and transferred to a 1/2 MS agar-medium (containing 0.25 mmol L–1 NH4Cl + 0.75 mmol L–1 NaNO3) for 10 d. Shoots and roots were harvested to isolate total RNA for qPCR analysis and measure the content of NH4+ and NO3–, as described by Ivančič and Degobbis (1984) and Downes (1978), respectively. Three biological replicates were used for each measurement. The wildtype was used as control in the above tests.
Statistical Analysis
Microsoft Excel (Microsoft Corporation, USA) and SPSS 17 (SPSS Incorporation, Chicago, USA) were used to analyze the data. An one-way ANOVA was performed. SigmaPlot 11.1 (Jandel Scientific Software, San Rafael, CA, USA) was utilized to draw figures for data presentation. For gene expression analysis, Hem I software (Heatmap Illustrator, version 1.0) (Deng et al., 2014) was used to generate hierarchical cluster heat maps.
Results
Net Fluxes of NO3– and NH4+ in Response to Treatment With Different N Forms and Levels
After 7 d N-starvation, B. campestris roots were immersed in measuring solutions containing different N forms (1 mmol L–1 NH4Cl, 1 mmol L–1 NaNO3, 0.25 mmol L–1 NH4Cl + 0.75 mmol L–1 NaNO3) to monitor net NO3– and NH4+ fluxes. Net NO3– and NH4+ flux curves are shown in Figures 1A–C. Net NO3– fluxes fluctuated gently in sole NO3– (Figure 1A) or mixed N (Figure 1C). In contrast, net NH4+ fluxes increased transitorily, then decreased gradually and subsequently increased in sole NH4+ (Figure 1B), whereas net NH4+ fluxes changed stably in the mixed N treatment (0.25 mmol L–1 NH4Cl + 0.75 mmol L–1 NaNO3) (Figure 1C). Compared with fluxes in sole N source, NO3– fluxes were decreased in mixed N forms and NH4+ fluxes were close to the fluxes of sole NH4+ (1 mmol L–1 NH4Cl) which did not decrease with increasing NH4+ concentration (Figures 1A–C). Thus, the mixed N treatment significantly enhanced total N fluxes (Figure 1D) under the same total N conditions (i.e. 3.53-fold for sole NO3–, 1.25-fold for sole NH4+).
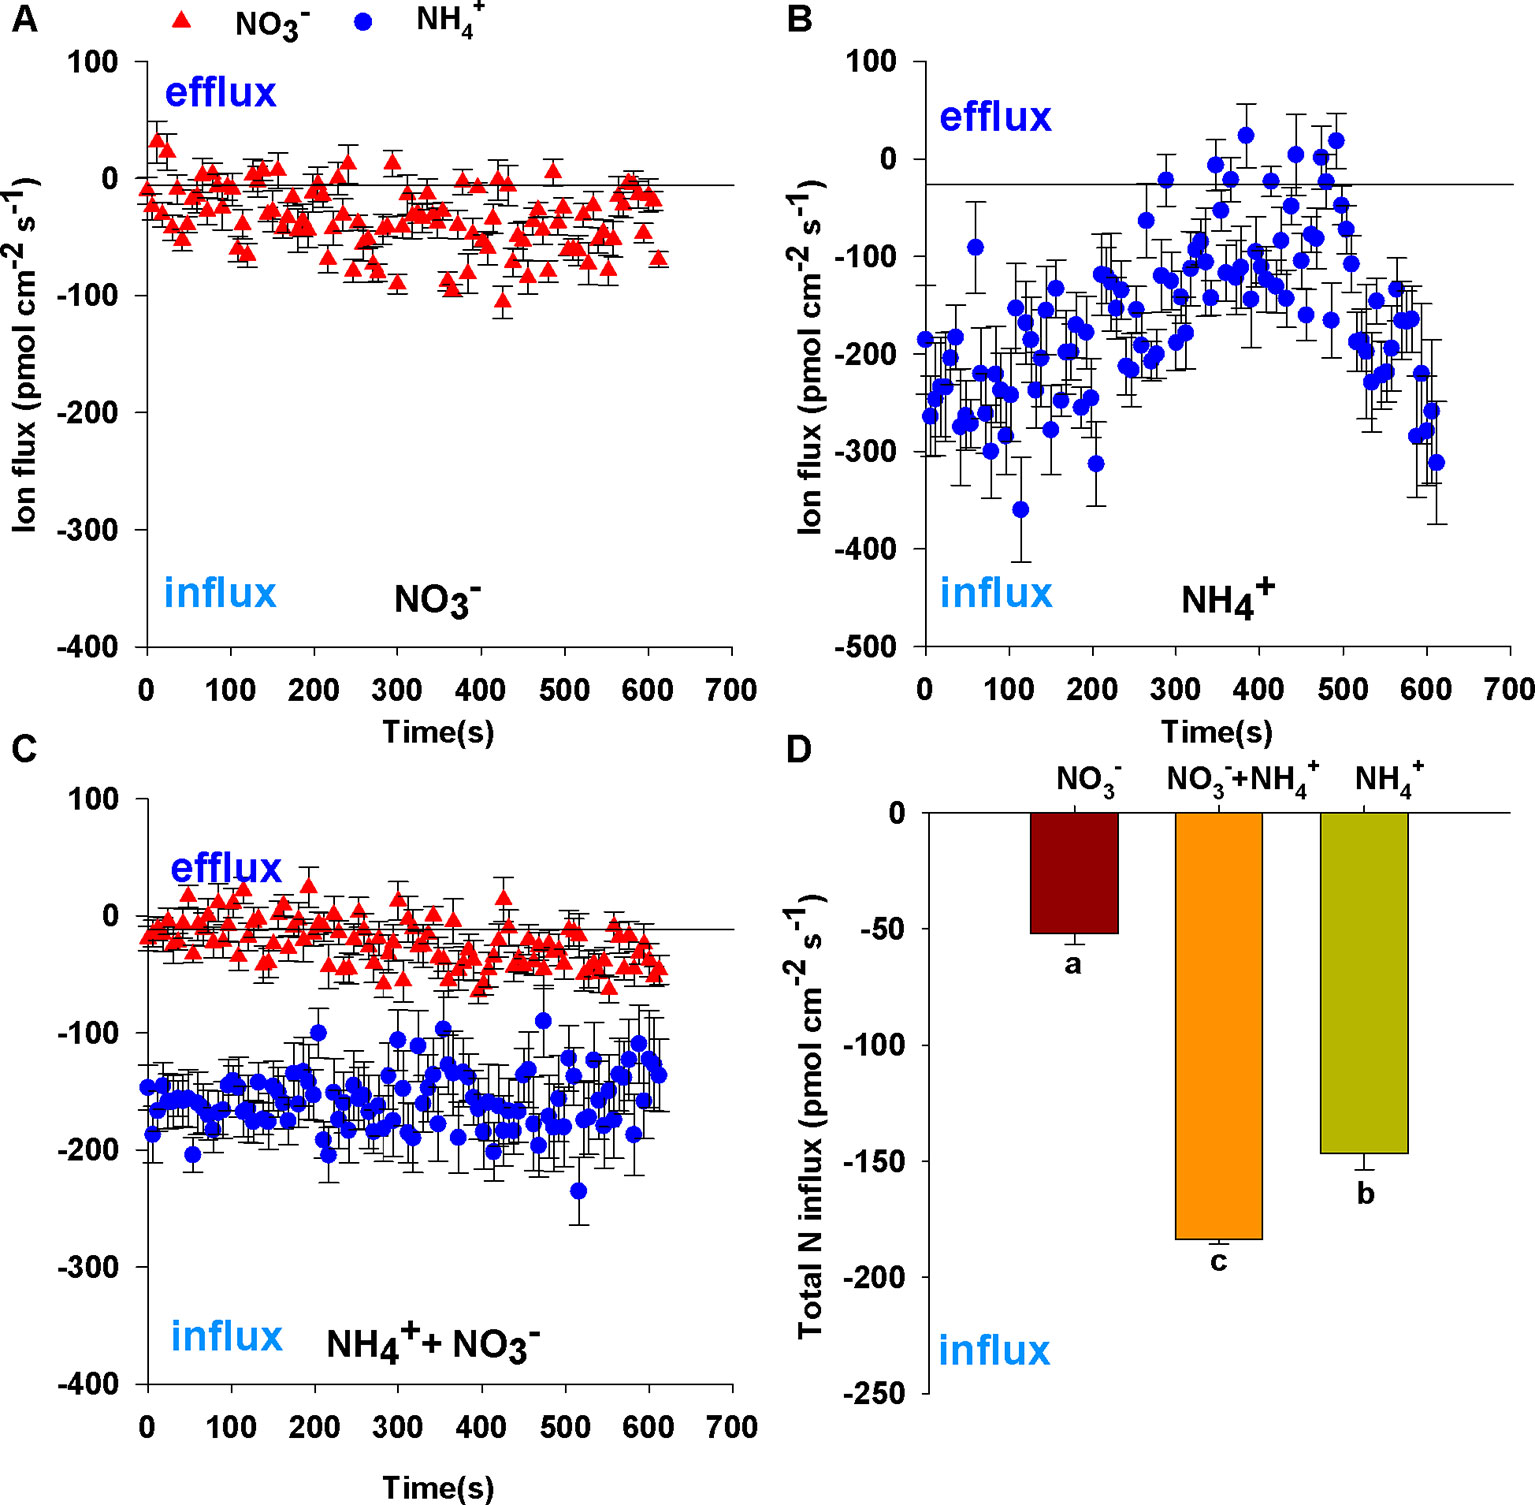
Figure 1 Net fluxes of NO3– and NH4+ on root surfaces of Brassica campestris in response to treatments with different N forms. (A) Net NO3– fluxes under 1 mmol L–1 NO3–; (B) net NH4+ fluxes under 1 mmol L–1 NH4+; (C) net NO3– and NH4+ fluxes under mixture of 0.25 mmol L–1 NH4+ and 0.75 mmol L–1 NO3–; (D) total N fluxes under different N forms. Net influxes are suggested by negative values, whereas net effluxes are indicated by positive values. The data represent mean ± SE (n = 6). Different letters indicate significant differences at P < 0.05.
To eliminate the effect of N concentration on N fluxes, we measured that net NO3– and NH4+ fluxes under different N levels. The influx rates of NH4+ or NO3– increased significantly with an increase in N concentration, NH4+ and NO3– influx rates in 1 mmol L–1 N were 2.66-fold and 1.33-fold of those in 0.25 mmol L–1, respectively (Figures 2A, B). In addition, NH4+ influx rates were 1.42 and 2.88 times higher than those of NO3– at N levels of 0.25 and 1 mmol L–1, respectively. This indicated that the roots of B. campestris showed a preference for NH4+ over NO3–.
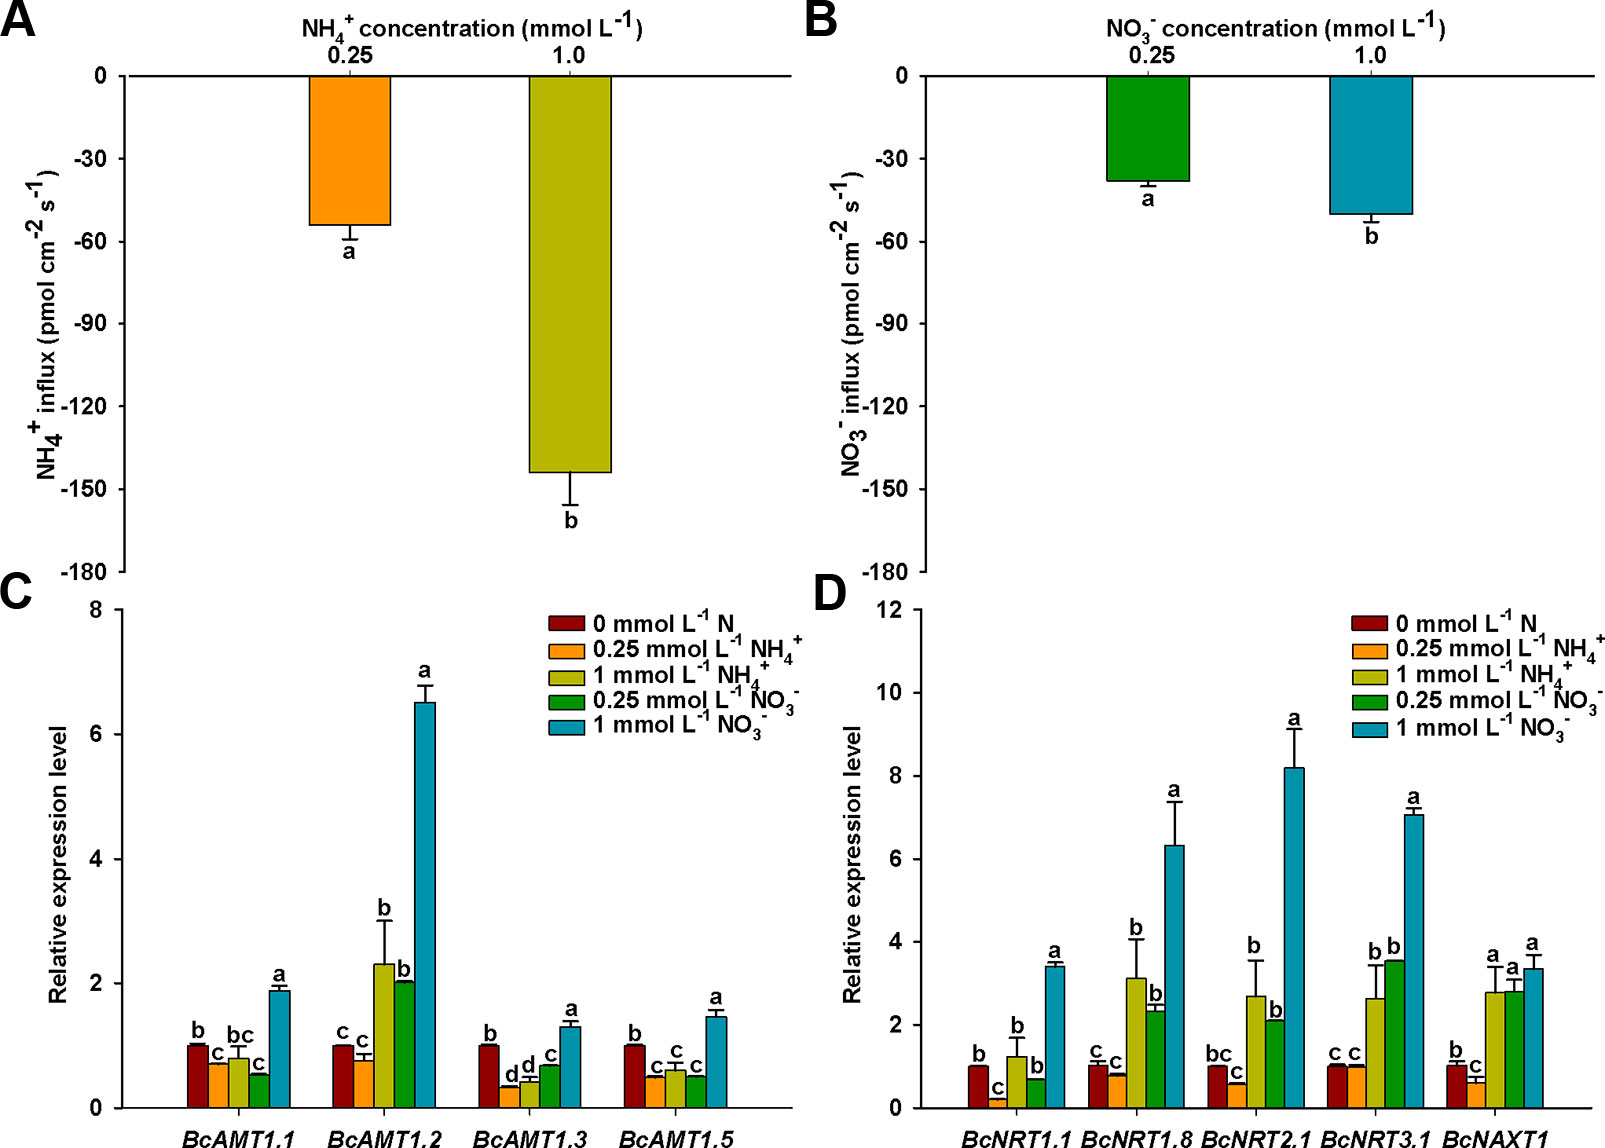
Figure 2 NO3– and NH4+ net fluxes and expressions of BcAMTs and BcNRTs in B. campestris roots in response to treatments with different N levels. (A) Net NH4+ fluxes in different NH4+ levels (0.25, and 1 mmol L–1 NH4+). (B) Net NO3– fluxes in different NO3– levels (0.25, and 1 mmol L–1 NO3–). (C, D) BcAMTs and BcNRTs expression in different N levels, respectively (0.25, and 1 mmol L–1 NH4+/NO3–). GAPDH was used as internal control. The data represent the mean ± SE (n = 6 in A–B, n = 3 in C–D). Significant differences (P < 0.05) between treatments are indicated by different letters.
The absorption of NH4+ and NO3– are mediated by AMTs and NRTs, respectively. To investigate how the expression of the N transporter genes was affected in roots in response to the addition of NH4+ or NO3–, we measured the mRNA levels of four BcAMT genes (BcAMT1.1, BcAMT1.2, BcAMT1.3, and BcAMT1.5) and five BcNRT genes (BcNRT1.1, BcNRT1.8, BcNRT2.1, BcNRT3.1, and BcNAXT1) using qPCR. After a 7-d period of N-starvation, the addition of different N levels had significant effects on the expression levels of BcAMT and BcNRT genes. Compared with the expression levels at nitrogen starvation (0 mmol L–1 N), the expression levels of BcAMT1.1, BcAMT1.3, and BcAMT1.5 decreased in response to NH4+ (0.25 and 1 mmol L–1) and 0.25 mmol L–1 NO3–, but they increased in response to 1 mM NO3– treatment (i.e. 1.30–1.88 times) (Figure 2C). In contrast, BcAMT1.2 expression increased significantly under 1 mM NH4+ (i.e. 2.30 times higher), and it was also significantly enhanced with an increase in NO3– concentration (i.e. 2.01 and 6.51 times higher in response to 0.25 mmol L–1 and 1 mmol L–1 NO3– treatment, respectively) (Figure 2C). BcAMT1s expression levels were increased by supplying 1 mmol L–1 NO3–, with the expression of BcAMT1.1, BcAMT1.2, BcAMT1.3, and BcAMT1.5 being 2.36, 2.83, 3.12, and 2.41 times higher, respectively, than that with the same NH4+ concentration (Figure 2C). In contrast to 0.25 mmol L–1 NH4+, adding NO3– enhanced BcAMT1.2 expression levels (Supplementary Figure S3A).
Compared with the expression in nitrogen starvation, BcNRT1.1 expression was lower following treatment with 0.25 mmol L–1 NH4+, although it did not appear to be affected by treatment with 1 mmol L–1 NH4+. In contrast, although the expression of other BcNRTs was not affected by treatment with 0.25 mmol L–1 NH4+, the expression was significantly enhanced in response to treatment with 1 mmol L–1 NH4+ (Figure 2D). Except for BcNRT1.1, the expression of other BcNRTs increased gradually with the concentration of NO3– (Figure 2D). BcNRTs expression was increased by supplying 1 mmol L–1 NO3–, with the expression of BcNRT1.1, BcNRT1.8, BcNRT2.1, BcNRT3.1, and BcNAXT1 being 2.74, 2.03, 3.06, 2.68, and 1.20 times higher than that with the same NH4+ concentration, respectively (Figures 2C, D). In contrast to treatment with 1 mmol L–1 NO3–, adding a mixture of 0.25 mmol L–1 NH4+ and 1 mmol L–1 NO3– decreased the expression levels of BcNRT1.8, BcNRT2.1, BcNRT3.1, and BcNAXT1 (Supplementary Figure S3B).
Interactions Between NH4+ and NO3– in Roots of B. Campestris
To elucidate the interaction between NH4+ and NO3–, we undertook dynamic monitoring of NH4+ fluxes after adding NH4+ to the bathing solution either with or without NO3–. Before adding NH4+, net NH4+ influxes of bathing solution with NO3– were higher than that of bathing solution without NO3– (Figure 3A). Regardless of whether the bathing solution contained NO3– or not, net NH4+ influxes rates after adding NH4+ increased markedly for 30 to 90 s (t1 stage), then decreased quickly for 180 s (t2 stage), then increased gradually (t3 stage), followed by a slow relaxation to the stable level (t4 stage) (Figure 3A). With the exception of several time points in the t2 stage, net NH4+ influxes of the solution with NO3– was higher than that of the solution without NO3–. There was no obvious difference between NH4+ flux rates in the bathing solution with or without Na+, indicating that adding Na+ had no obvious effect on NH4+ flux in this study (Supplementary Figure S4). It indicated that NO3– influenced NH4+ flux rates.
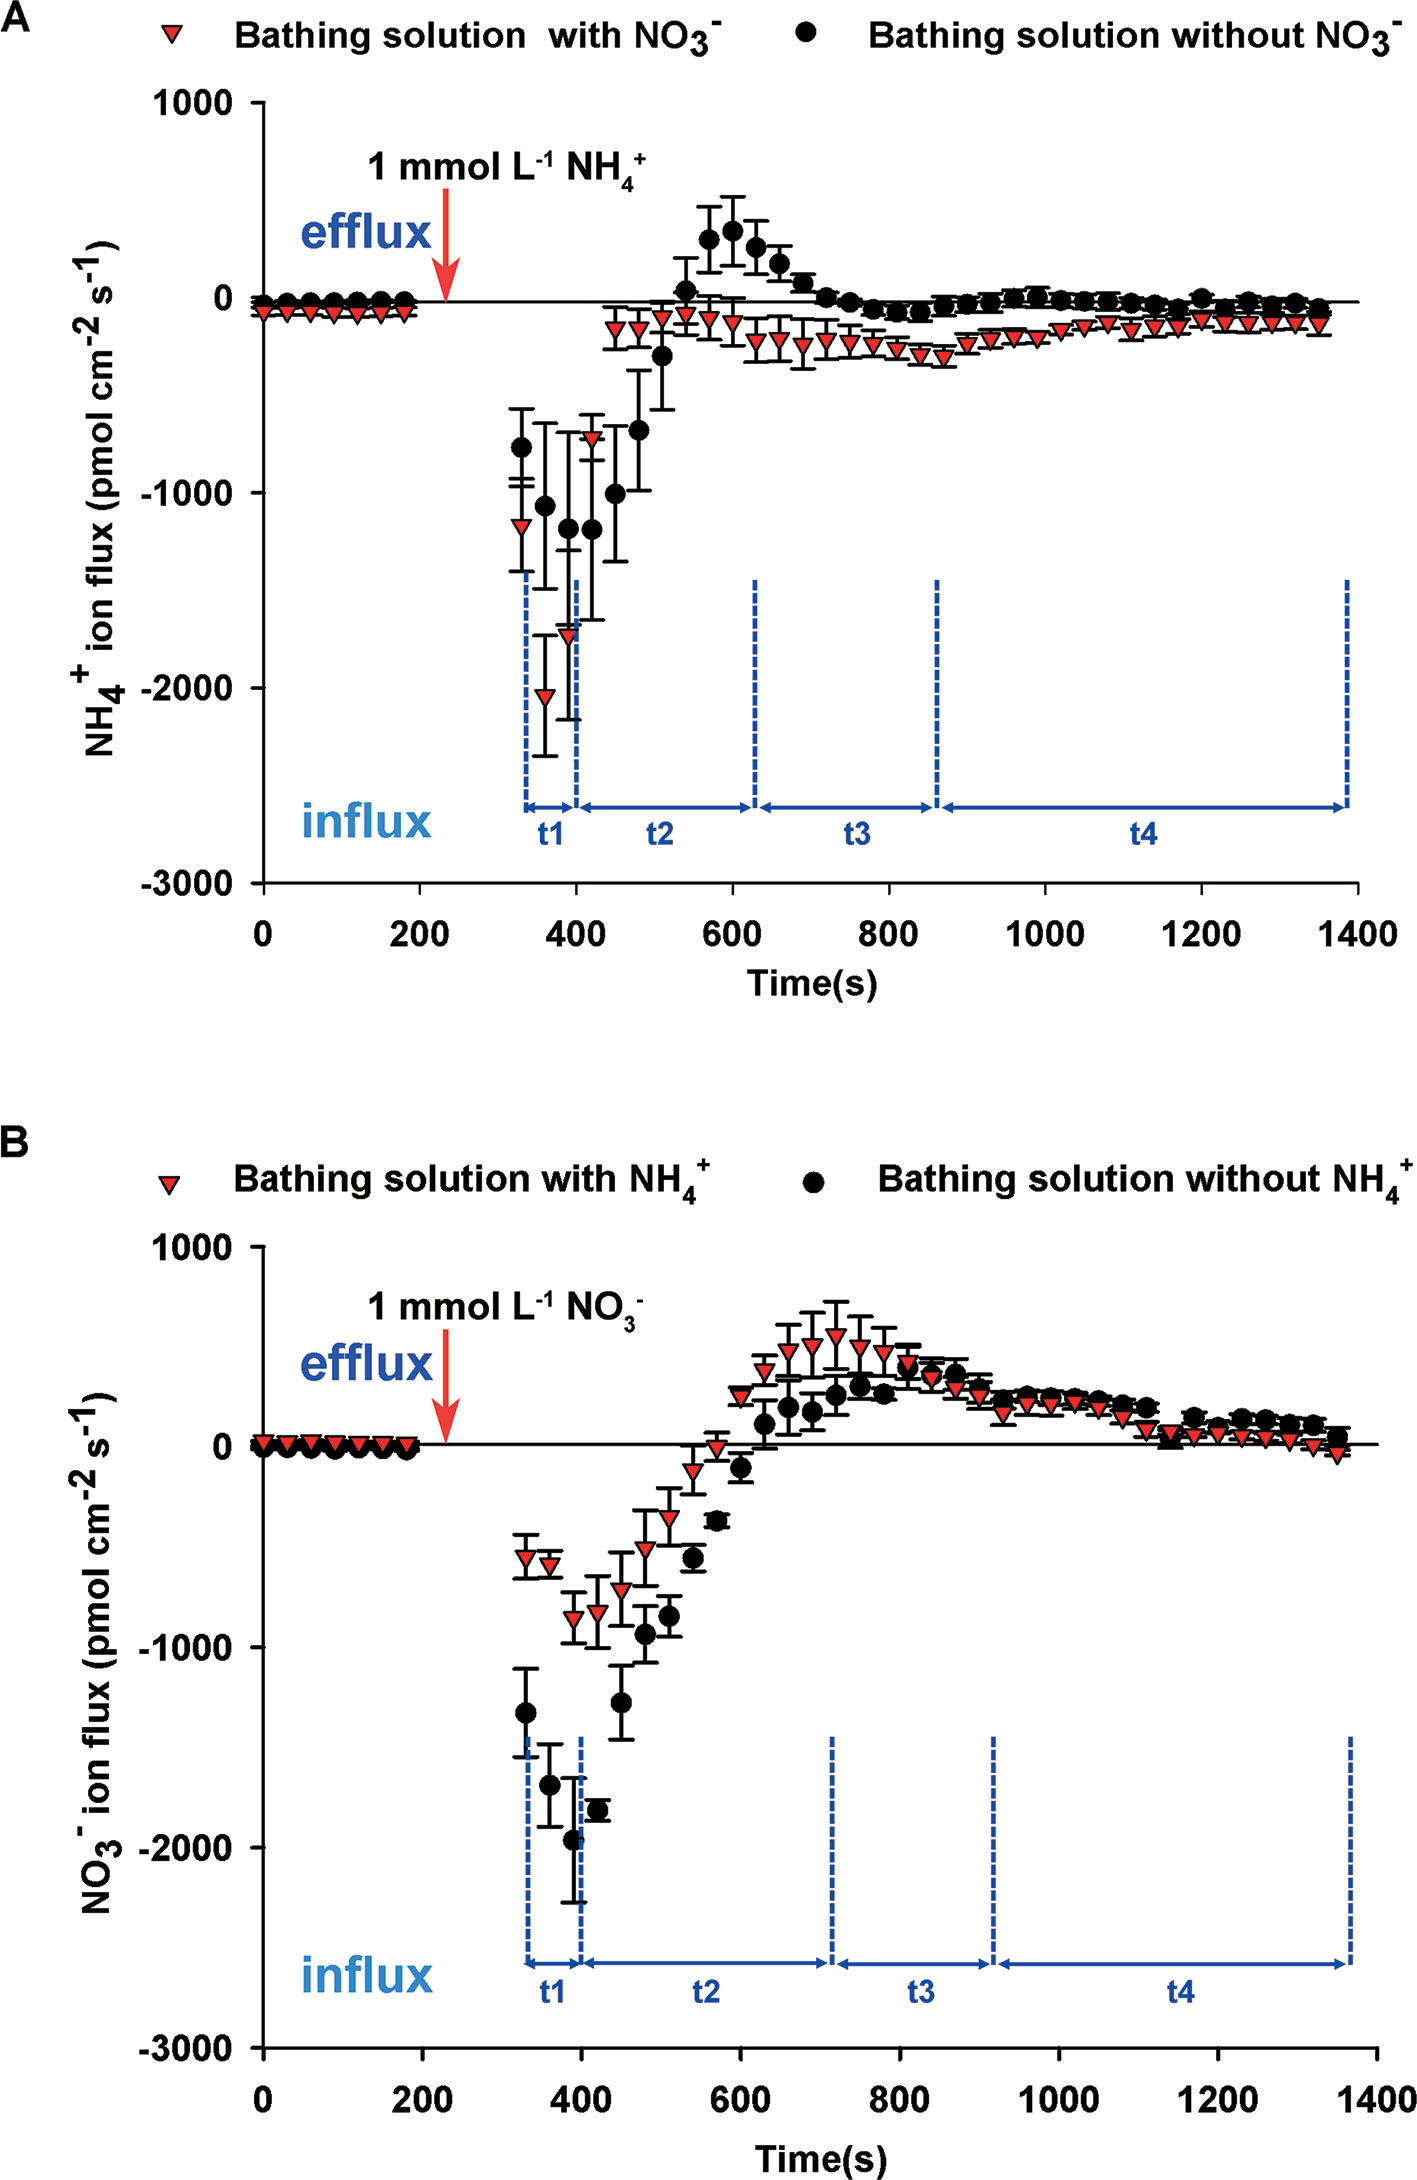
Figure 3 Interaction between NO3– and NH4+ fluxes on root surfaces of B. campestris. (A) Influence of NO3– on net NH4+ fluxes after adding 1 mmol L–1 NH4+ to the bathing solution with or without 1 mmol L–1 NO3–. (B) Influence of NH4+ on net NO3– fluxes after adding 1 mmol L–1 NO3– to the bathing solution with or without 1 mmol L–1 NH4+. Changes in net NH4+/NO3– fluxes in roots at 30 s intervals are presented. The vertical arrow indicates the point at which 1 mmol L–1 NH4+ or NO3– was added. t1–t4 represent the stages of net NH4+/NO3– fluxes after adding NH4+/NO3– to the bathing solution. The data represent the mean ± SE (n = 4–6) during the measurement period.
Before adding NO3–, NO3– fluxes of the bathing solution without NH4+ showed net influxes, whereas those with NH4+ showed net effluxes (Figure 3B). Net NO3– influx began to increase rapidly for 60 s (t1 stage) after adding NO3– and decreased gradually for 330–420 s (t2 stage). Subsequently, net NO3– influx rates increased slowly for approximately 210 s (t3 stage) and remained stable (t4 stage). During the stages t1 and t2, net NO3– influx rates of the bathing solution with NH4+ were lower than those for the bathing solution without NH4+. There was no obvious difference between the bathing solution with and without NH4+ during the stages t3 and t4, indicating that NH4+ affected net NO3– influxes.
BcAMTs and BcNRTs Expression in Response to Treatment With Adding NH4+ or NO3– in B. campestris Roots
Compared with the expression in N deficiency, adding NH4+ without NO3– markedly reduced the expression levels of BcAMT1.1, BcAMT1.3, and BcAMT1.5, whereas it induced the expression of BcAMT1.2 after 20 min (Figure 4A). Moreover, adding NH4+ with NO3–, resulted in a sharp increase in the expression of BcAMT1.2 and a weak transient increase in the expression of BcAMT1.1, BcAMT1.3, and BcAMT1.5 (Figure 4A). Sole NO3– treatment increased the expression of BcAMT1.2 and BcAMT1.5 and decreased that of BcAMT1.1 and BcAMT1.3 (Figures 4A, B), whereas adding NO3– to the nutrient solution containing NH4+ resulted in a decrease in the transcript levels of four BcAMT1s (Figure 4B).
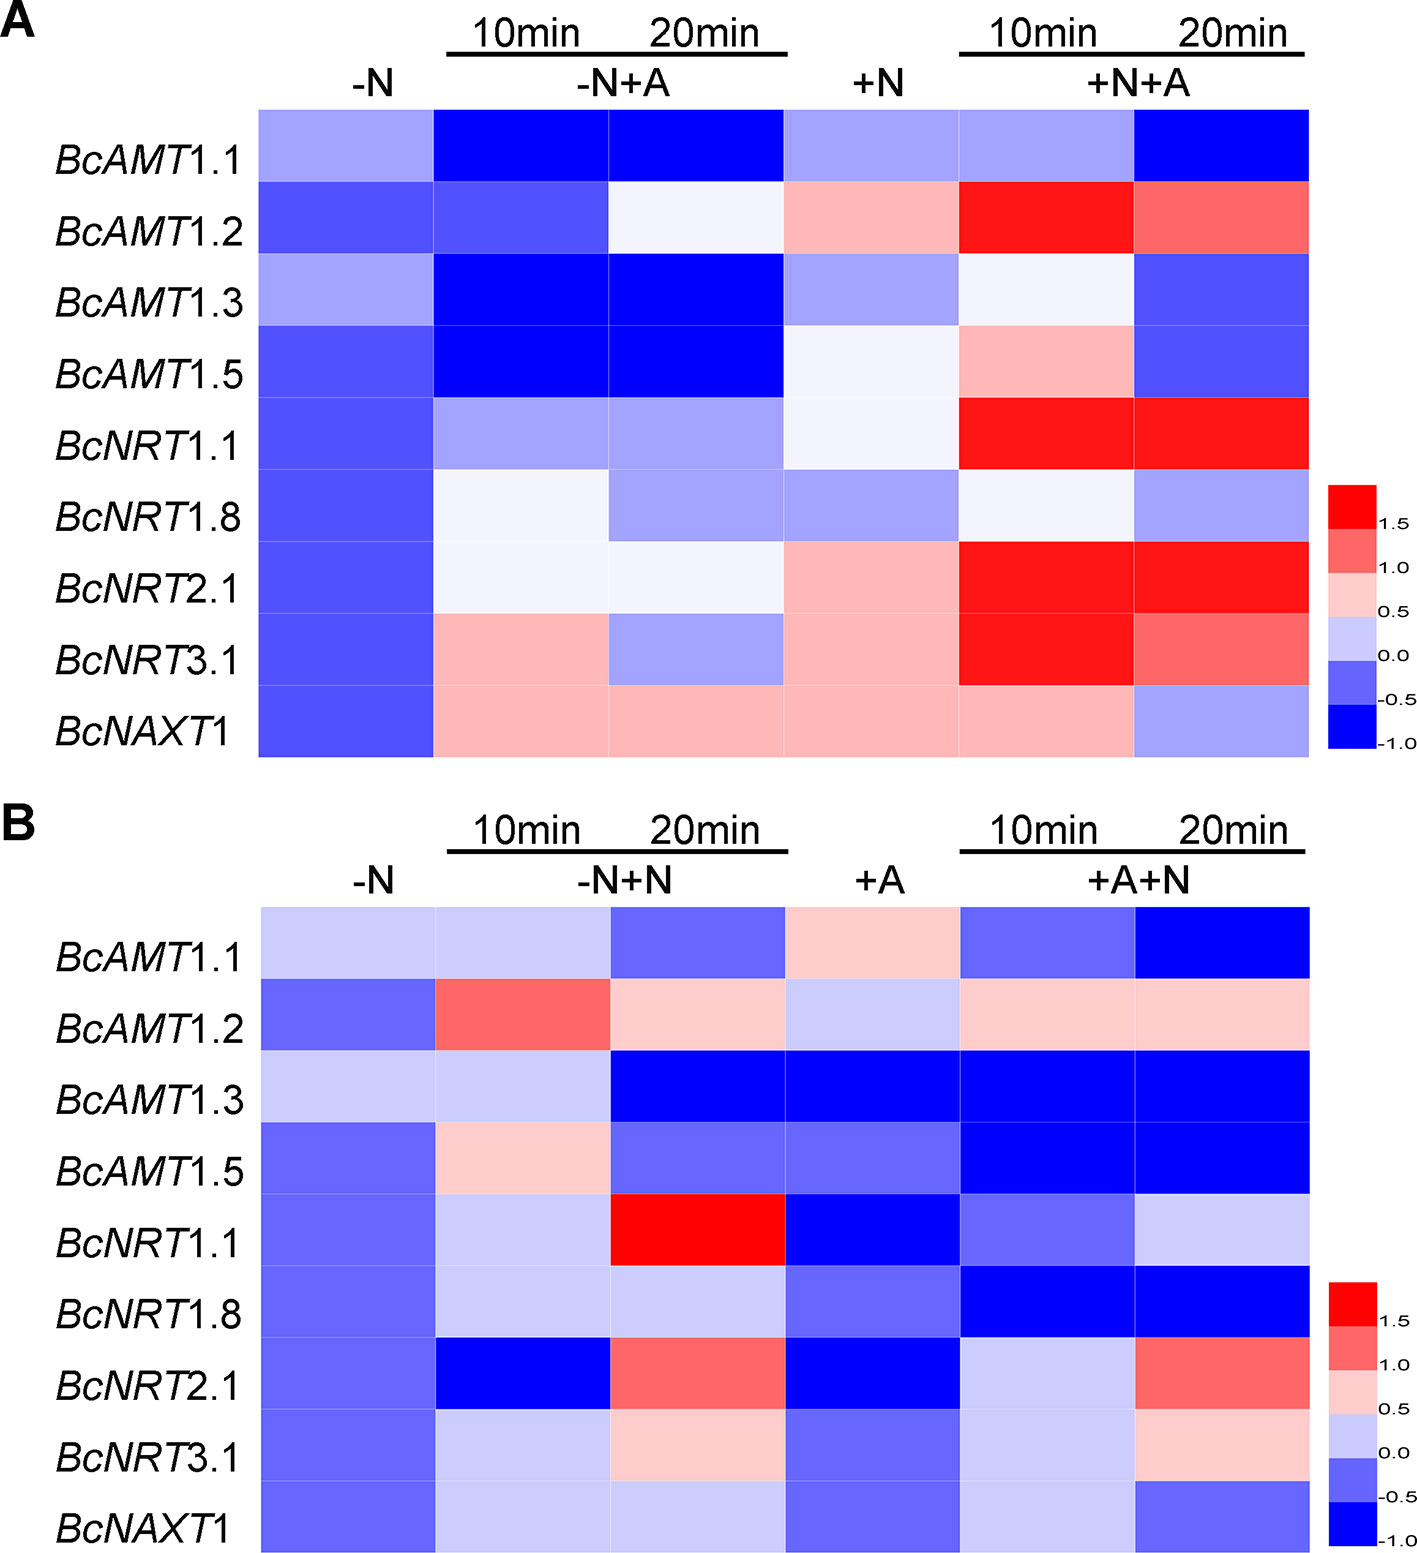
Figure 4 The expression of AMTs and NRTs in B. campestris roots in response to adding NH4+ or NO3– to different N nutrient. (A) AMTs and NRTs expression in seedlings by adding NH4+ to the nutrient without or with NO3–. (B) AMTs and NRTs by adding NO3– to nutrient solution without or with NH4+. After 7 d N-starvation, seedlings were transferred to different nutrients. –N: Nitrogen starvation; –N + NH4+: adding 1 mmol L–1 NH4+ for 10 min and 20 min; +NO3–: adding 1 mmol L–1 NH4+ for 10 min and 20 min; +NO3–: adding 1 mmol L–1 NO3–; +NO3– + NH4+: after adding 1 mmol L–1 NO3– for 10 min, adding 1 mmol L–1 NH4+ for 10 min and 20 min; –N + NO3–: adding 1 mmol L–1 NO3– for 10 min and 20 min; +NH4+: adding 1 mmol L–1 NH4+; +NH4+ + NO3–: after adding 1 mmol L–1 NH4+ for 10 min, adding 1 mmol L–1 NO3– for 10 min and 20 min. GAPDH was used as internal control. The heat map represents the values of normalization for different genes.
In terms of NRTs expression, sole NH4+ treatment resulted in a slight increase in the expression of BcNRT1.1, BcNRT1.8, BcNRT2.1, and BcNRT3.1, and clearly increased the expression of BcNAXT1 compared with N starvation (Figure 4A), whereas sole NO3– treatment resulted in a marked increase of five NRTs transcripts (Figure 4B). However, the effect of adding NO3– was more pronounced than that obtained with the combined addition of NO3– and NH4+ (Figure 4A). The transcript levels of five NRTs were upregulated in response to the addition of NO3–, whereas BcNRT1.1, BcNRT2.1, and BcNRT1.8 expression levels were clearly downregulated by adding NH4+ and slightly upregulated by the subsequent addition of NO3– (Figure 4B). However, the expression levels were lower than those obtained in response to the N mixture in which NO3– was added for 10 min and NH4+ was added for another 10–20 min (Figure 4A).
Most BcNRTs transcripts were induced by NO3– and inhibited by NH4+, whereas BcAMT1s transcripts were inhibited by NH4+ except for BcAMT1.2, which was induced by adding NH4+ and the effect was strengthened by adding NO3–. Regarding the analysis of AMT1s and NRTs transcripts, we speculated that BcAMT1.2 might play an important role in the coexistence of NO3– and NH4+.
Cloning of a Putative ORF Encoding an AMT1.2 Homolog From B. campestris
To isolate the AMT1.2 gene from B. campestris, we designed primers based on the sequence of AMT1.2 from B. rapa (accession no. XM_009113156.1) (Supplementary Table S1), we obtained the homologous sequence using cDNA from B. campestris, designated BcAMT1.2 (GenBank accession no. MF966937.1). The complete ORF of BcAMT1.2 consisted of 1539 nucleotides and encoded a 54.94 kD polypeptide. Phylogenetic analysis of AMT1 and AMT2 subfamily members from other plant species showed that BcAMT1.2 belonged to the AMT1 cluster (Figure 5A), shared high sequence identity with Populus trichocarpa and Arabidopsis AMT1.2, and shared 99% identity with B. rapa AMT1.2 (Figure 5B). It was predicted to be a member protein exhibiting nine transmembrane domains with an N-terminus outside and C-terminus inside the cytoplasm (Figure 5B). The sequence of BcAMT1.2 contained the signature motif “210DFAGSGVVHMVGGIAGLWGALIEGPR235” near the 5th transmembrane domain (Figure 5B). The subcellular location in onion cells also showed that BcAMT1.2 was located in the plasma membrane (Supplementary Figure S5).
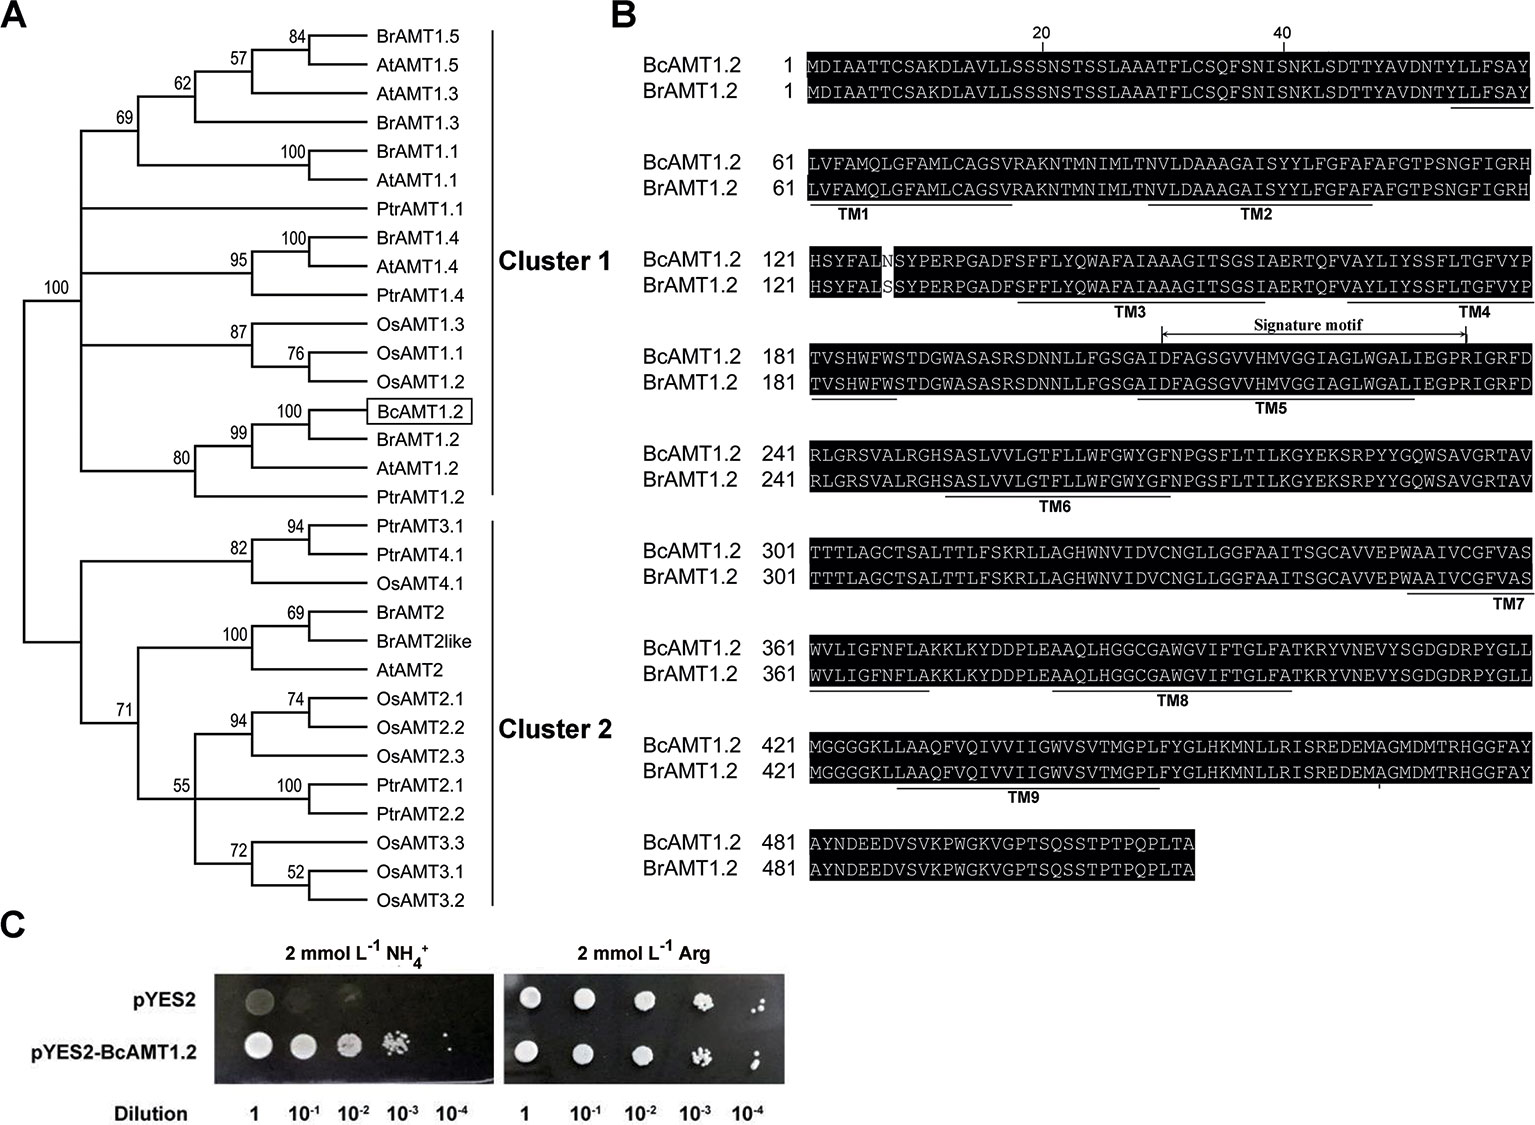
Figure 5 Sequence analysis of BcAMT1.2 and functional complementation in yeast mutant 31019b cells by BcAMT1.2. (A) Phylogenetic tree of AMT homologs. It was constructed by the Neighbor-Joining method in MEGA 6.0. Bootstrap values were derived from 1000 replications, and evolutionary distances were estimated in terms of the number of amino acid substitutions per site. The numbers at the nodes are bootstrap values. Accession numbers of protein sequences of AMTs from given plant species are listed in Supplementary Table S2. At, Arabidopsis thaliana; Bc, Brassica campestris; Br, Brassica rapa; Os, Oryza sativa; Ptr, Populus trichocarpa. BcAMT1.2 was represented by a black box. (B) Amino acid sequence alignment of AMT1.2 from B. campestris and B. rapa. The alignment was performed using ClustalW. Amino acids are presented as capital letters; residues are shown in white letters on black if two sequences have identical residues at the aligned positions. Thick lines below sequences show the positions of potential transmembrane α-helices (TMs) as predicted using Protter (http://wlab.ethz.ch/protter/). The sequences marked signature motif indicated a motif specific to the AMT1 sub-family identified using Weblogo (http://weblogo.berkeley.edu/logo.cgi/). (C) Functional complementation in yeast mutant 31019b cells by BcAMT1.2. pYES2: empty vector was used as negative control, pYES2-BcAMT1.2: BcAMT1.2 ORFs was cloned into pYES2 vector. Yeast cell suspensions were adjusted to an optical density at 600 nm of 1.0 (dilution 1), and serially diluted by factors of 10. For each dilution, 3 μL of the yeast cell suspensions were spotted on yeast N base medium with 2 mmol L–1 NH4+ or arginine.
To investigate whether BcAMT1.2 is a functional ammonium transporter, we recombined the ORF of BcAMT1.2 into pYES2 vector, and transformed this into yeast mutants 31019b. Negative control cells transformed into pYES2 did not grow normally on a solid medium with 2 mmol L–1 NH4+ as the only N source, whereas recombinant strains harboring pYES2-BcAMT1.2 grew normally (Figure 5C). This indicated that BcAMT1.2 may be a functional ammonium transporter. BcAMT1.2 was constitutively expressed throughout the growth period, mainly in roots and leaves, whereas the expression in stems and flowers was lower (Supplementary Figure S6A). In roots and leaves, BcAMT1.2 expression decreased significantly as N starvation progressed (Supplementary Figures S6B, C).
We subsequently investigated that histochemical staining for BcAMT1.2pro::GUS transformants that were treated with NH4+, NO3–, or N-deficiency and stained for GUS activity. In leaves and roots, GUS activity was greater in response to treatment with NH4+ or NO3– (Figures 6C–F) than that with N-deficiency (Figures 6A, B). GUS was mainly expressed in the vascular tissues of roots and shoots (Figures 6A–F). Two lines showed a similar pattern in response to N-deficiency and a low concentration of NH4+ or NO3– after N-deficiency.
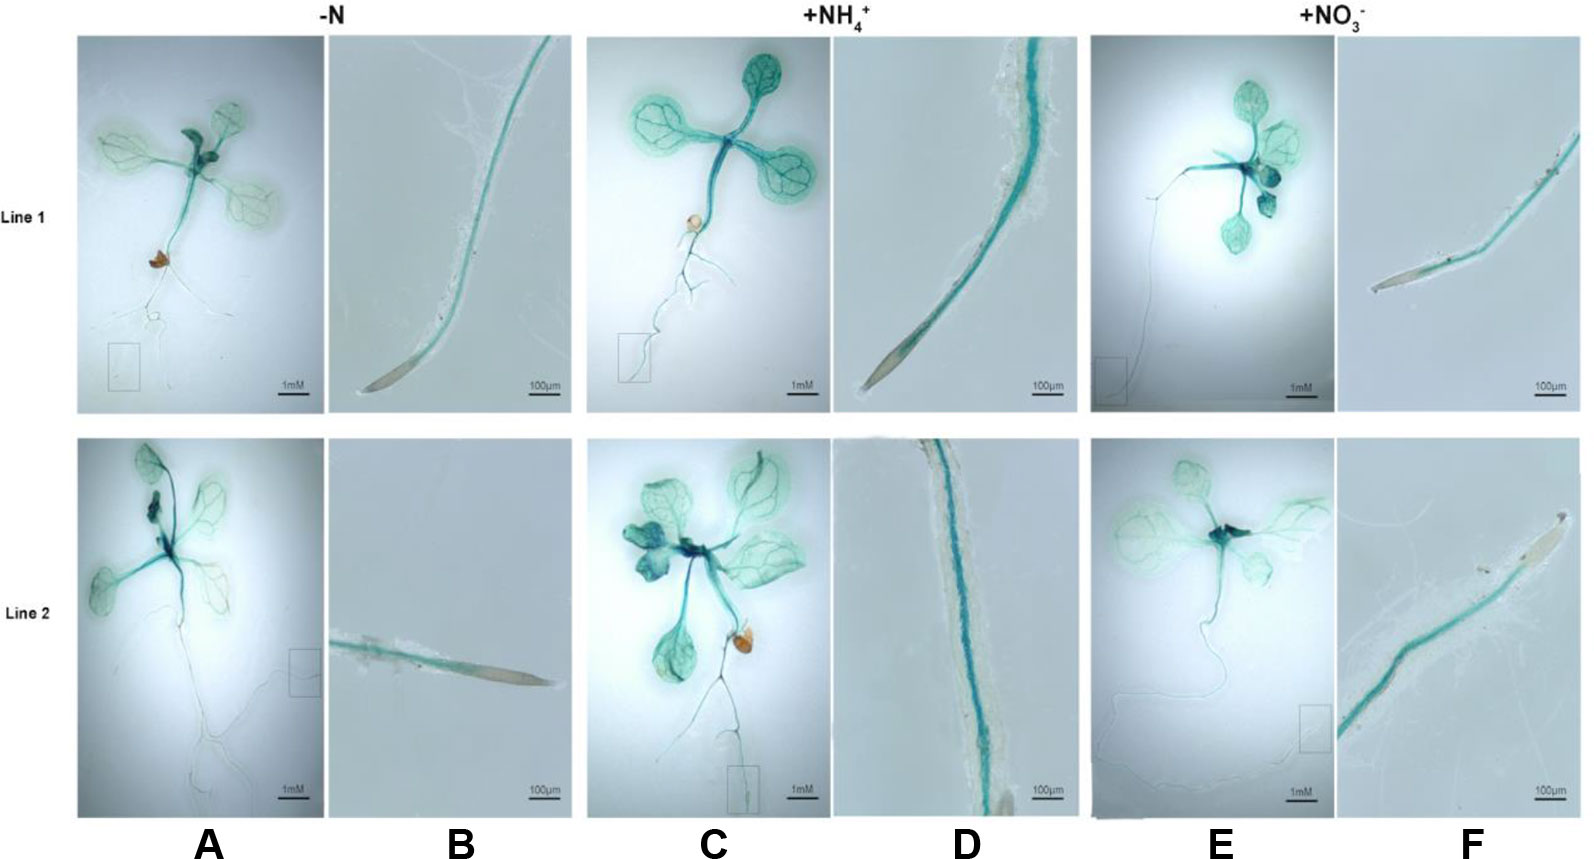
Figure 6 Histochemical staining for GUS activity in Arabidopsis seedlings transformed with BcAMT1.2pro::GUS. (A, B) Seedlings of two lines of transforming with BcAMT1.2pro::GUS in Arabidposis (Line1, Line2) were subjected to N-deficiency for 4 d. (C, D) Seedlings were subjected to 0.25 mmol L–1 NH4+ for 2 h after N-deficiency. (E, F) Seedlings were subjected to 0.25 mmol L–1 NO3– for 2 h after N-deficiency. (B), (D), and (F) were the magnification of root zones in a rectangular box of (A), (C), and (E), respectively.
Heterologous Expression of BcAMT1.2 in Arabidopsis
To gain an insight into the possible function of BcAMT1.2 in NH4+ transportation and utilization in plants, BcAMT1.2 was overexpressed in the Arabidopsis wildtype line (Col-0), which was supplied with 0.25 mmol L–1 NH4+ as the sole N source. Several independent homozygous lines harboring BcAMT1.2 were constructed and the expression of BcAMT1.2 in Arabidopsis was confirmed by qPCR (Figure 7A). These seedlings were grown for 10 d on vertical agar plates containing 0.25 mmol L–1 NH4Cl after a 4-d pre-culture on 4 mmol L–1 NaNO3. The growth phenotype of transgenic lines showed that the overexpression of BcAMT1.2 could promote the growth of Arabidopsis seedlings at a low concentration of NH4+ (Figure 7B). Compared with the biomass in the wildtype, three BcAMT1.2-overexpressing (BcAMT1.2-ox) lines significantly increased the biomass of shoots and roots (Figure 7C), and the length of primary root (Figure 7D). Furthermore, NH4+ content was increased by 17.9–32.0% in BcAMT1.2-ox lines (Figure 7E).
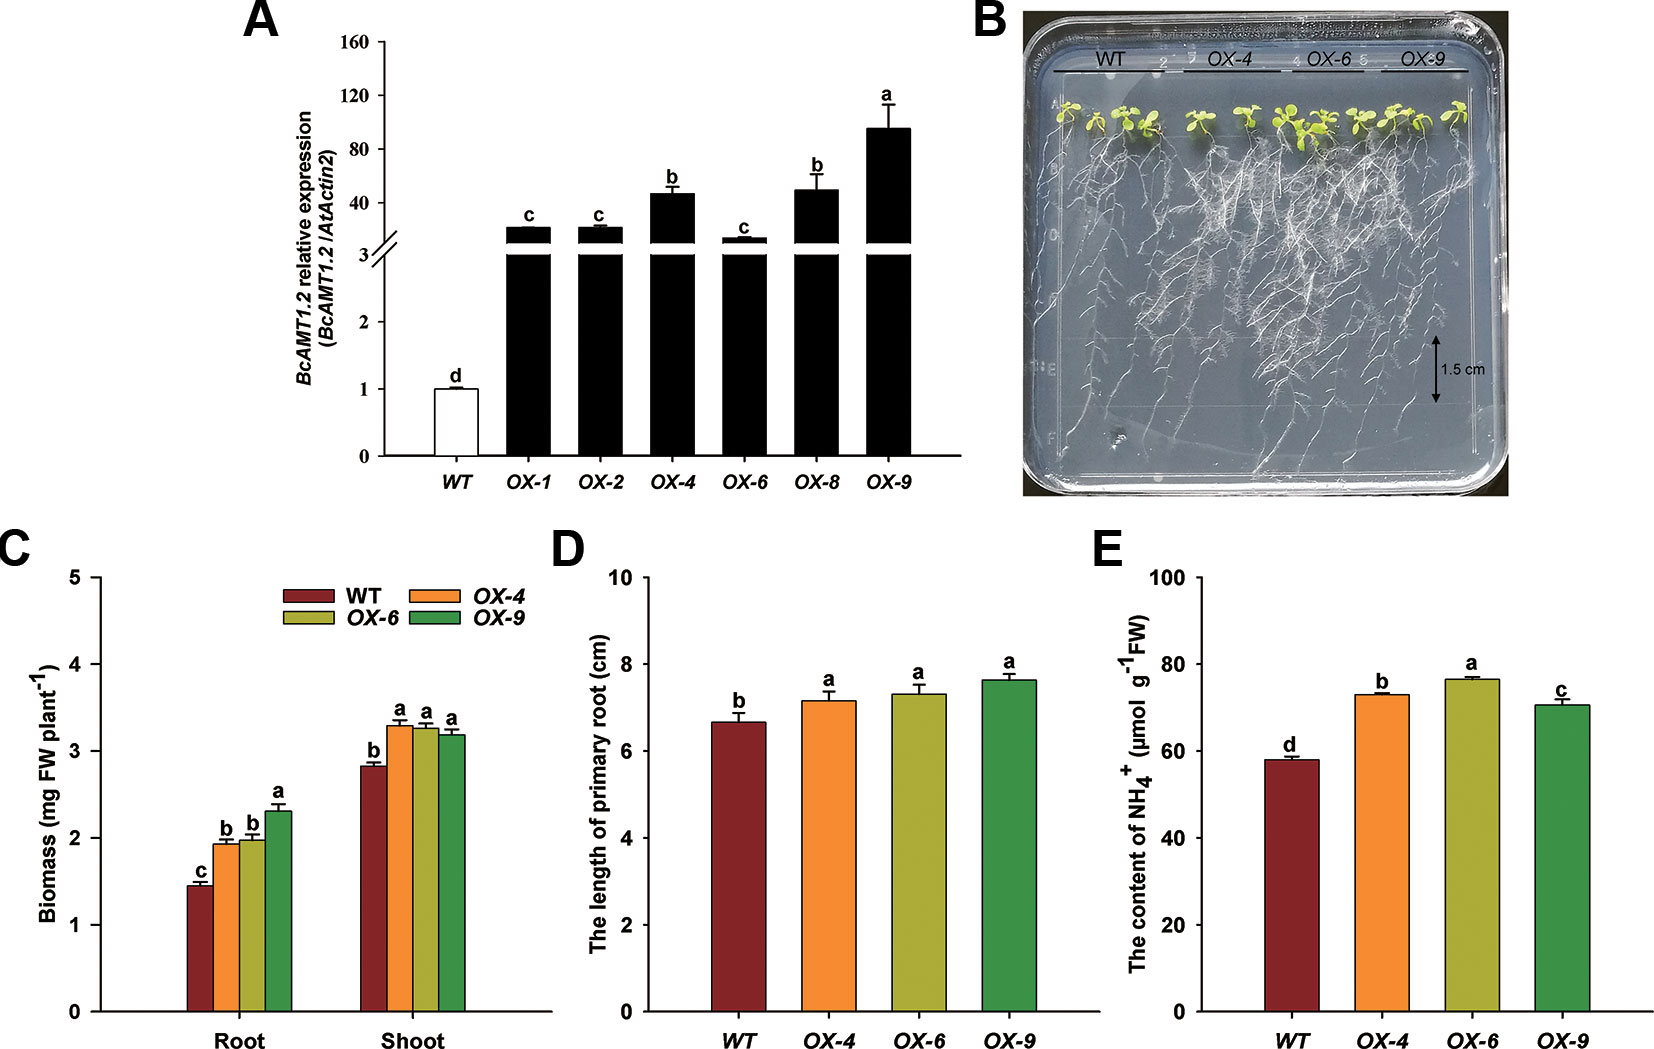
Figure 7 Overexpression of BcAMT1.2 in Arabidopsis promoted plant growth on 0.25 mmol L–1 NH4+. (A) Detection of BcAMT1.2 expression in several transgenic Arabidopsis lines. The qPCR was performed on total RNA extracted from the leaves of 2-week-old T1 seedlings; Arabidopsis ACTIN2 was used as internal control. (B) Growth phenotype of T4 transgenic lines and wildtype on low NH4+. Seedlings were grown vertically on solid medium containing 0.25 mmol L–1 NH4+ for 10 d after a 4-d pre-culture on 4 mmol L–1 NO3–. Three independent transgenic lines of overexpressed BcAMT1.2 were used. (C) Biomass fresh weight of shoots and roots. (D) The length of primary roots. (E) NH4+ content of the whole plants. Each value represents the mean ± SE (n = 3 in A, C and n = 10 in D, E). Different lowercase letters indicate significant differences at P < 0.05.
Ion Fluxes of Overexpression BcAMT1.2 Lines in Arabidopsis Under Coexistence of NH4+ and NO3–
To examine how BcAMT1.2-ox lines affected the absorption of NH4+ and NO3–, we measured ion flux rates of Arabidopsis seedlings in response to the mixture of N (0.25 mmol L–1 NH4+ and 0.75 mmol L–1 NO3–) using SIET. BcAMT1.2-ox lines OX-6 and OX-9 showed larger net NH4+ influxes than the wildtype, and but had little difference in the last minutes of the experiment (Figure 8A). BcAMT1.2-ox lines influenced NO3– flux, which was changed significantly from net influxes to net effluxes in the BcAMT1.2-ox line (Figure 8B). During the test process, BcAMT1.2-ox lines increased 32.8–45.7% in net NH4+ influx and 2.50–2.72-fold in net NO3– efflux in response to a mixture of NH4+ and NO3– (Figures 8A–C). These observations indicated that overexpression of BcAMT1.2 increased NH4+ influxes and NO3– effluxes in Arabidopsis. The results of NO3– content showed a similar tendency (Figure 8D); however, BcAMT1.2-ox lines had little influence on NH4+ content and even reduced it (Figure 8D).
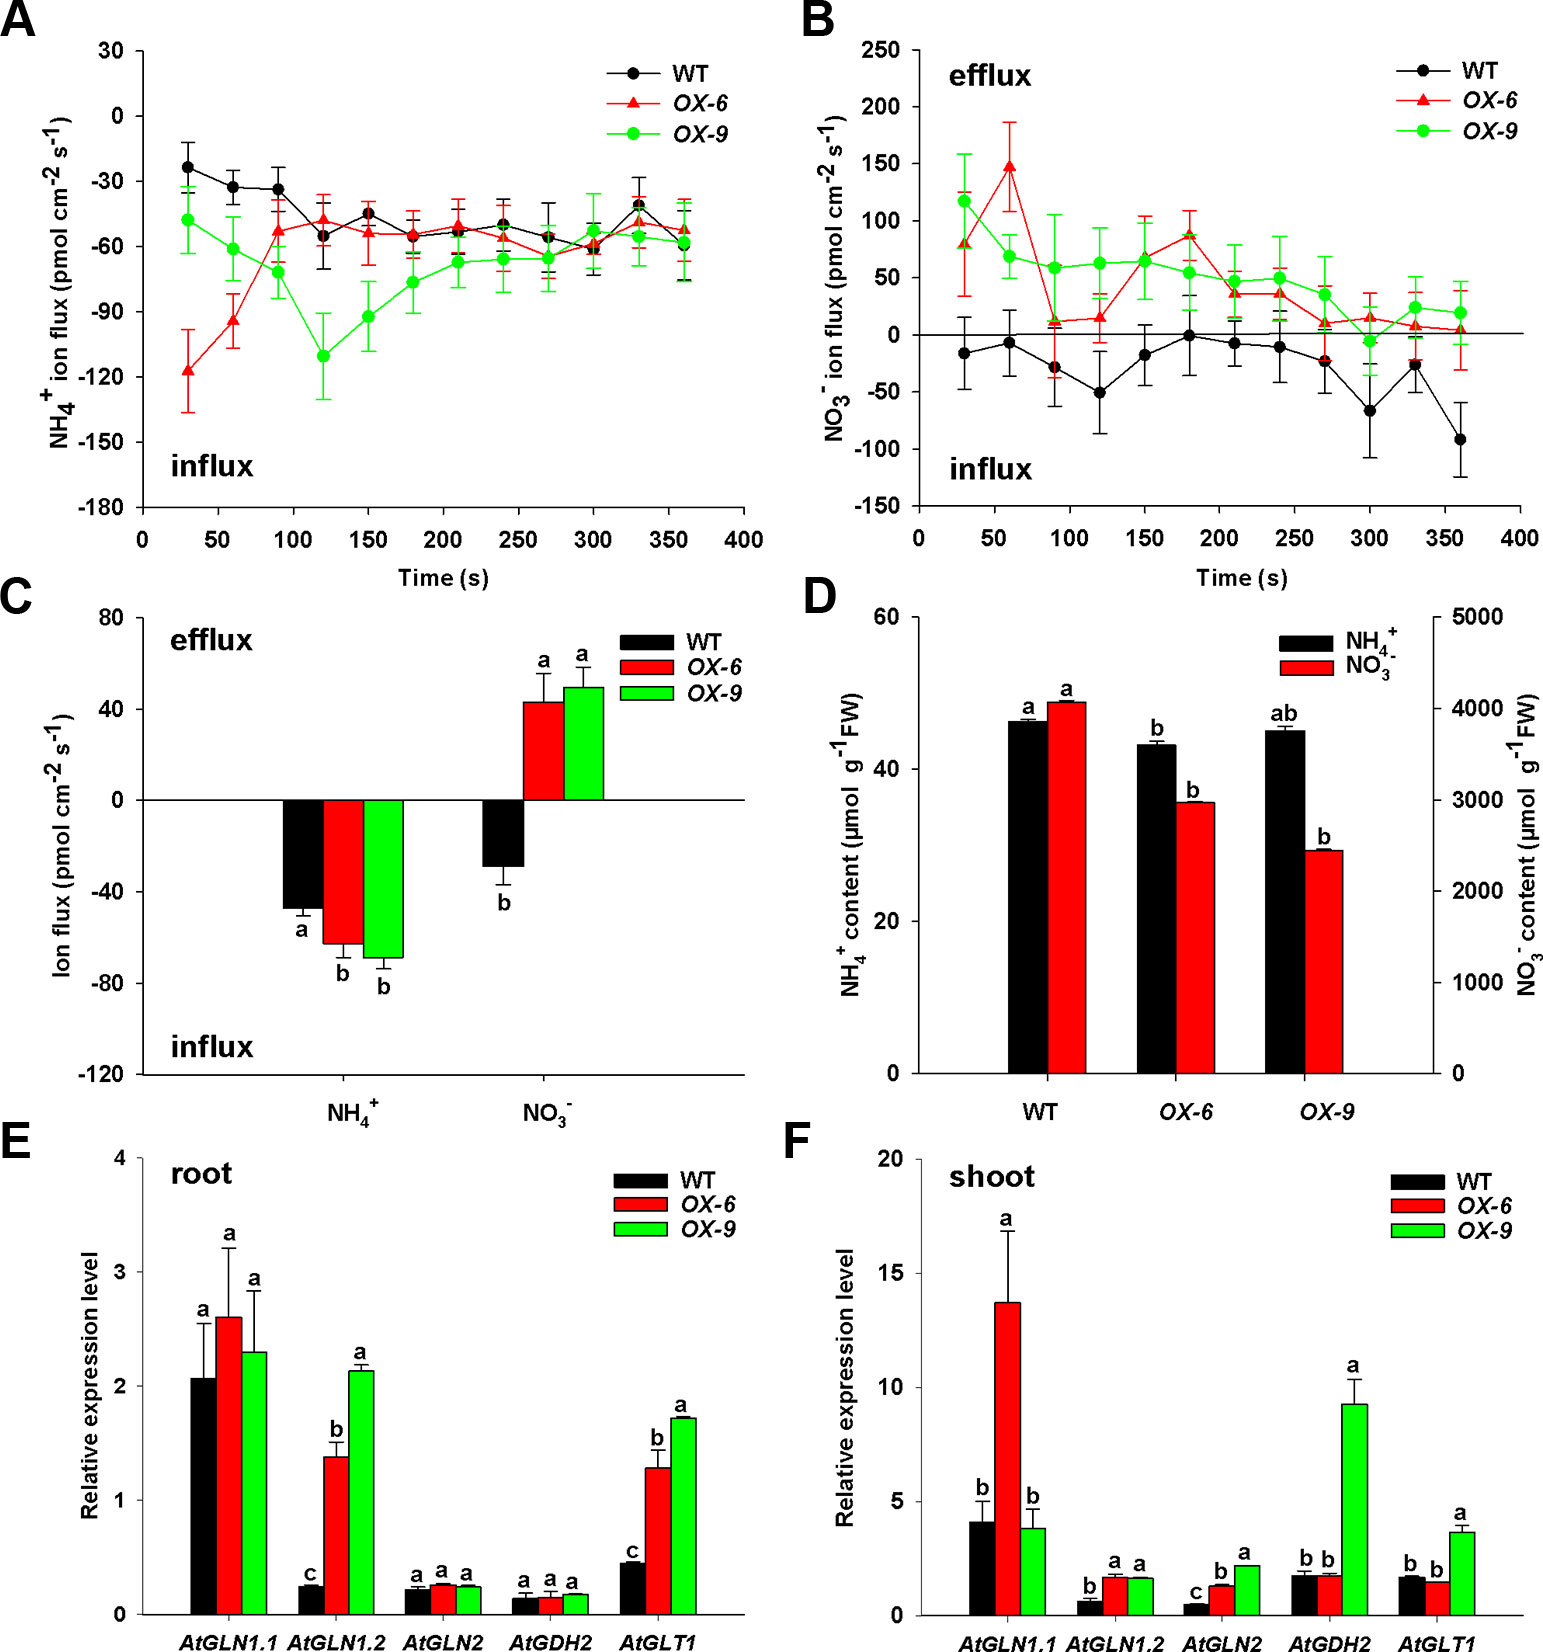
Figure 8 Net ion fluxes and content of NH4+, NO3–, and expression of N assimilation genes in Arabidopsis wildtype and BcAMT1.2-ox lines (OX-6, OX-9) under a mixture of 0.25 mmol L–1 NH4+ and 0.75 mmol L–1 NO3–. (A, B) Net fluxes NH4+ and NO3– of wildtype and BcAMT1.2-ox lines. (C) Mean values of NH4+ and NO3– net fluxes during the whole test time from (A) and (B). (D) The content of NH4+ and NO3– in wildtype and BcAMT1.2-ox lines. (E, F) The expression levels of N assimilation genes in roots and leaves, respectively. Arabidopsis ACTIN2 was used as internal control. Each value represents the mean ± SE (n = 6 in A–D, n = 3 in E–F). Different lowercase letters indicate significant differences at P < 0.05.
To understand if the overexpression of BcAMT1.2 will affect N assimilation, we investigated the expression levels of five N assimilation genes in Arabidopsis under a mixture of NH4+ and NO3–. GLN, GDH and GLT encode glutamine synthetase (GS), glutamate dehydrogenase (GDH), and NADH-dependent glutamate synthase (GOGAT), respectively. In roots, the transcript levels of AtGLN1.2 and AtGLT1 were 5.73–8.88-fold and 2.85–3.83-fold higher in BcAMT1.2-ox lines than those in the wildtype (Figure 8E), respectively; in leaves, AtGLN1.2 and AtGLN2 transcript levels were 2.67–2.76-fold and 2.71–4.61-fold higher in both BcAMT1.2-ox lines than those in the wildtype, respectively (Figure 8F). Other genes were affected little, either significantly or inconsistently, between two BcAMT1.2-ox lines (Figures 8E, F). Elevated transcription of N assimilation genes (i.e. GLN1.2, GLN2, and GLT1) might be physiologically crucial for the plants to effectively assimilate and utilize the higher levels of NH4+ induced by overexpressing BcAMT1.2, to retain NH4+ at a relatively stable level.
Discussion
Characteristics of NH4+, NO3– Fluxes, and Related Genes Expression in the Roots of B. Campestris
Compared with the growth with a sole N source, a mixture of NO3– and NH4+ accelerates plant growth (Supplementary Figure S1) (Wang and Shen, 2011; Song et al., 2012). Plants often show a preference for the uptake of NH4+ or NO3– (Song et al., 2016). Previous studies have shown that molecule-specific activities associated with net NO3– and NH4+ fluxes can be evaluated non-invasively using SIET (Xu et al., 2006). In this study, we observed that the total N influx of the NH4+ and NO3– mixture was higher than that of sole NH4+ or NO3– at the same N amount (Figures 1A–D), which is consistent with previous studies on wheat (Zhong et al., 2015) and tea (Ruan et al., 2016). However, it is contrary to the results reported by Arkon et al. (2012), who show a significant decrease of total N uptake in B. napus by an NH4+ and NO3– mixture. NH4+ or NO3– uptake is affected by the depolarization of electrical membrane potential which increases with the increase in NH4+ or NO3– concentration, reaches the peak and changes to be steady, according to the Michaelis-Menten equation (Wang et al., 1994). We observed similar results in Figures 2A, B. However, at the same concentration, the net influx of NH4+ was greater than that of NO3– in the roots of B. campestris (Figures 1A–D; Figures 2A, B), and at the concentrations of 0.25 mmol L–1 and 1 mmol L–1, net NH4+ uptake was 1.42-fold and 2.88-fold higher than net NO3– uptake, respectively (Figures 2A, B). This indicated that B. campestris exhibited a preference for NH4+ over NO3–. Previous studies have made similar observations (Zhong et al., 2015; Ruan et al., 2016). Indeed, many plants use NH4+ as their preferred N form (Socci and Templer, 2011) and most plants prefer to absorb NH4+ rather than NO3– when NH4+ and NO3– are supplied at the same concentration (Zhong et al., 2015; Ruan et al., 2016). Arkon et al. (2012) reported that N uptake and plant growth in B. napus are no significantly affected by adding NH4+ or mixed N during the first 24–72 h, whereas causes N uptake and plant growth to decrease after 15 days of treatment compared with NO3– treatment. This may be associated with ammonium toxicity (Arkon et al., 2012; Hachiya et al., 2012; Hachiya and Sakakibara, 2017). Therefore, B. campestris plant prefers NH4+ to NO3– on the premise that ammonium toxicity cannot affect plant cells in a short time.
In plants, the absorption of NH4+ or NO3– is mainly regulated by AMT or NRT genes, respectively (Glass et al., 2002), and their expression levels are regulated by N status and forms (Gazzarrini et al., 1999; Yuan et al., 2007). In this study, compared with the transcripts in N-deficiency, BcAMT1.1, BcAMT1.3, and BcAMT1.5 transcripts were repressed by adding NH4+ and affected slightly by NO3–, whereas BcAMT1.2 expression was induced by both NH4+ and NO3– (Figure 2C). The response of BcAMT1.1, BcAMT1.3, and BcAMT1.5 to NH4+ was similar to the results in Arabidopsis (Gazzarrini et al., 1999; Yuan et al., 2007). Those of BcAMT1.2 to NH4+ and NO3– were consistent with previous results (Pearson et al., 2002; Yusuf and Deepa, 2017). BcNRTs transcripts were more affected by NO3– than NH4+, as they were upregulated with an increase in NO3– concentration (Figure 2D). This is consistent with previous studies (Fan et al., 2016; Qu et al., 2016). Consequently, we conclude that N status and form influence AMT and NRT transcripts and that these genes are involved in the regulation of NH4+ and NO3– fluxes, respectively.
NO3– Accelerates Net NH4+ Influxes in B. campestris
Previous studies have reported that NH4+ and NO3– might interact with each other under coexistence (Hachiya et al., 2012). Net N fluxes include total N influxes and total N effluxes. When net N influxes increased, total N influxes were enhanced, and/or total N effluxes were reduced (Hachiya and Sakakibara, 2017). In this study, net NH4+ influxes, with and without containing NO3–, increased sharply, then decreased rapidly, and slowly relaxed to a stable level with the addition of NH4+ (Figure 3A). Drastic initial changes in NH4+ fluxes may be caused by depolarization and polarization which are affected by electrical membrane potential after adding more NH4+ (Wang et al., 1994).
In addition, at a high external concentration of NH4+, plants may activate the NH4+ efflux system to cope with high NH4+ influx (Britto and Kronzucker, 2001; Babourina et al., 2007; Hachiya and Sakakibara, 2017). However, to date there have been no reports of any gene that encodes protein that is specifically involved in the NH4+ efflux system (Babourina et al., 2007), NH4+ effluxes may be mediated via aquaporin channels or non-selective K+ channels (Hachiya and Sakakibara, 2017). Babourina et al. (2007) reported that K+ net fluxes are not correlated with net NH4+ fluxes. Moreover, before adding NH4+, net NH4+ influxes in bathing solution containing NO3– were higher than in those lacking NO3–. A similar tendency was observed after adding NH4+ (Figure 3A). This indicated that the presence of NO3– might have a positive effect on net NH4+ uptake, which is consistent with previous studies performed on other species (Kronzucker et al., 1999; Babourina et al., 2007; Luo et al., 2013); however, it is contrary to the results reported by Arkon et al., 2012. Using isotope labeling, Kronzucker et al. (1999) reported that a larger proportion of 13NH4+ signal is allocated to the xylem in the presence of both NH4+ and NO3– than that with sole NH4+. NO3– may influence the expression of AMTs involved in cytosolic NH4+ homeostasis or be involved in a more complex feedback response via plant metabolism (Babourina et al., 2007; Hachiya and Sakakibara, 2017). In Arabidopsis, NO3– mediates NH4+ uptake and assimilation by NRT1.1 (Jian et al., 2018).
Compared with the transcript levels in N-deficiency, BcAMT1.1, BcAMT1.3, and BcAMT1.5 transcript levels were repressed by NH4+ to the growth medium, whereas levels were unaffected or increased slightly in response to NO3– (Figures 4A, B). Nevertheless, BcAMT1.2 expression was significantly reduced by N-deficiency (Supplementary Figures S6B, C), and enhanced by the addition of NH4+, particularly in the presence of NO3– (Figures 4A, B). The increased AMT activity may lead to a higher rate of NH4+ uptake into internal compartments (vacuole or plastids) or further transport to the xylem. Both events would lead to a lower NH4+ concentration in the cytoplasm of root cells (Babourina et al., 2007). In Arabidopsis, AtAMT1.1, AtAMT1.3, and AtAMT1.5 are located in rhizodermal cells, and AtAMT1.2 is located in root endodermal and cortical cells (Yuan et al., 2007). Specific localization in the root zone of AMTs determines the pathways of NH4+ uptake, transport and allocation to shoots (Duan et al., 2018). When external NH4+ is high, apoplastic transport mediated by AtAMT1.2 prevails at the root endodermis (Yuan et al., 2007; Duan et al., 2018). AtAMT1.2 exclusively regulates NH4+ flux into the vasculature (Yuan et al., 2007; Straub et al., 2017) and favors N allocation to the shoot (Duan et al., 2018). BcAMT1.2pro::GUS activity, which was expressed mainly in the vascular tissues in Arabidopsis, was enhanced by adding NH4+ or NO3– compared with that in N-deficiency (Figures 6A–F). Therefore, we speculated that BcAMT1.2 may participate in the interaction of NH4+ and NO3–.
NH4+ Decreases Net NO3– Influxes in B. campestris
NH4+ had an influence on NO3– fluxes. Before and after adding NO3–, net NO3– influxes of bathing solution containing NH4+ were lower than those without NO3–, whereas net NO3– effluxes of bathing solution with NH4+ were lower than those without NH4+ (Figure 3B). This indicated that NH4+ might decrease net NO3– influxes, which is consistent with the discoveries in other plants (Kronzucker et al., 1999; Arkon et al., 2012; Luo et al., 2013). BcNRT1.1 and BcNRT2.1, a dual-affinity transport system and high affinity transport system, respectively, were downregulated by NH4+ (Figures 4A, B). Furthermore, the expression of BcNRT1.8, which regulates the xylem loading of NO3–, was decreased by NH4+, whereas that of BcNAXT1, which regulates NO3– efflux system, was increased (Figures 4A, B). The addition of NH4+ not only decreased NO3– absorption, but also NO3– xylem loading, and consequently NO3– influxes were decreased or NO3– effluxes were increased. Previous studies have reported that the acidification of the rhizosphere caused by NAXT1 inhibits NO3– absorption (Hachiya and Sakakibara, 2017). Furthermore, the overexpression of OsNRT2.3b enhances NO3– uptake in response to sole NO3– treatment, whereas OsNRT2.3b expression is inhibited in response to treatment with mixtures of NH4+ and NO3– (Fan et al., 2016). Therefore, NH4+ may affect the absorption of NO3– by regulating NRT transcripts in the coexistence of NH4+ and NO3–.
BcAMT1.2 Mediated the Interaction of NH4+ and NO3– Coexistence
One AMT1-type homologous gene, namely BcAMT1.2, was isolated from B. campestris (Figures 5A, B). The protein encoded by BcAMT1.2, which is located in the plasma membrane, may be a functional AMT (Supplementary Figure S4). In a low concentration of NH4+, overexpressing BcAMT1.2 lines accelerated the growth of Arabidopsis which increased NH4+ content compared with the wildtype (Figures 7B–E). This is consistent with overexpressing AtAMT1.2 in Arabidopsis mutant lines (Yuan et al., 2007). In the NH4+ and NO3– mixture, net NH4+ influxes of BcAMT1.2-ox lines were obviously increased (Figure 8A), and net NO3– influxes were decreased and changed from net influxes to net effluxes (Figure 8B), NO3– content of BcAMT1.2-ox lines was lower than that of the wildtype (Figure 8D), indicating that the constitutive expression of BcAMT1.2 clearly reduced the NO3– influx into roots. Although net NH4+ influxes of BcAMT1.2-ox line were increased (Figures 8A, C), NH4+ content was not increased, in contrast to the wildtype (Figure 8D).
The expression of N assimilation genes is regulated by NH4+ in plants (Ranathunge et al., 2014). Previous studies have shown that GS and GOGAT can remove NH4+ from the cytoplasm to relieve its toxicity (Babourina et al., 2007; Hachiya and Sakakibara, 2017). In Arabidopsis, GLN1 and GLN2 encode GS isoenzymes, located in the cytosol (GS1) and chloroplast (GS2), respectively (Lothier et al., 2011; Guan et al., 2016). GLN1.2 in Arabidopsis is essential for NH4+ detoxification and N assimilation under ample nitrate supply (Lothier et al., 2011). GOGAT, encoded by GLT1, is responsible for NH4+ assimilation in non-photorespiratory organs with GDH (Liu and von Wirén, 2017). We observed that the expression levels of N assimilation genes (AtGLN1.2, AtGLN2, and AtGLT1) were significantly increased (Figures 8E, F), implying that an increase in BcAMT1.2 mRNA abundance could also directly or indirectly affect NH4+ assimilation. SaAMT1.2 expression levels have been observed to be positively correlated with GS-specific activity in sandalwood (Santalum album) (Yusuf and Deepa, 2017). Overexpressing OsAMT1.1 in rice increases the amounts of amino acids, photosynthetic pigments, and sugars with higher NH4+ levels to improve nitrogen use efficiency, plant growth, and grain yield (Ranathunge et al., 2014). Therefore, overexpressing BcAMT1.2 may affect the homeostasis between nitrogen and carbon to regulate plant growth.
However, the mechanisms underlying this phenomenon remain unknown; thus, warrant further investigation in the future. Co-expression experiments in oocytes have revealed that a complex of AMT1.2 with CBL1 and the active CIPK23 kinase is required for AMT1.2 regulation, whereas a noncatalytic CIPK23 is not sufficient to inactivate NH4+ transportation. CIPK23 and CBL1 appear to occupy a key position in cellular NH4+ and NO3– homeostasis (Straub et al., 2017). Interestingly, the phosphorylation of NRT1.1 is also regulated by CIPK23 (Ho and Tsay, 2010).
In addition, Giehl et al. (2017) reported that AtAMT2.1 contributes to NH4+ uptake in the millimolar range, and mediates a high accumulation of NH4+ in xylem sap, which contributes to long-distance translocation from root to shoot. Further studies are required to clarify whether BcAMT2s play a similar role in the interaction between NH4+ and NO3– in B. campestris. It may be related to NO3– signaling, uptake, and reduction during the interaction of NH4+ and NO3– (Hachiya et al., 2012). How AMT1.2 affects the interaction between NH4+ and NO3– to exert its effects, and whether other proteins and signaling cascades are involved, are interesting questions that await future research.
Data Availability Statement
All datasets for this study are included in the article/Supplementary Material.
Author Contributions
SS and RC conceived and designed the research. YZ and XH carried out the experiments. WS analyzed the data. YH, GS, and HL reviewed and edited the manuscript.
Funding
This work was supported by the National Natural Science Foundation of China (31972481, 31401855) and the China Agriculture Research System (CARS-25-C-04).
Conflict of Interest
The authors declare that the research was conducted in the absence of any commercial or financial relationships that could be construed as a potential conflict of interest.
Acknowledgments
We are grateful to Dr. Bruno André (Université Libre de Bruxelles, Belgium) for providing the yeast mutant strain 31019b.
Abbreviations:
AMT, ammonium transporter; CBL, calcineurin B-like protein; CIPK, CBL-interacting serine/threonine-protein kinase; GAPDH, glyceraldehyde-3-phosphate dehydrogenase; GDH, glutamate dehydrogenase; GOGAT, glutamate dehydrogenase and NADH-dependent glutamate synthase; GS, glutamine synthetase; GUS, β-glucuronidase; HATS, high-affinity transport system; KD, kilo-dalton; MES, 2-(N-morpholino) ethanesulfonic acid hydrate buffer; LATS, low-affinity transport system; N, nitrogen; NH4+, ammonium; NO3–, nitrate; NRT, nitrate transporter; ORF, open reading frame; qPCR, quantitative real-time polymerase chain reaction; SIET, scanning ion-selective electrode technique; TM, transport membrane.
Supplementary Material
The Supplementary Material for this article can be found online at: https://www.frontiersin.org/articles/10.3389/fpls.2019.01776/full#supplementary-material
References
Arkon, M., Sarda, X., Jannin, L., Laîné, P., Etienne, P., Garcia-Mina, J., et al. (2012). Hydroponics versus field lysimeter studies of urea, ammonium, and nitrate uptake by oilseed rape (Brassica napus L.). J. Exp. Bot. 63, 5245–5258. doi: 10.1093/jxb/ers183
Babourina, O., Voltchanskii, K., McGann, B., Newman, I., Rengel, Z. (2007). Nitrate supply affects ammonium transport in canola roots. J. Exp. Bot. 58, 651–658. doi: 10.1093/jxb/erl238
Bloom, A. J., Burger, M., Rubio, A. J., Cousins, A. B. (2010). Carbon dioxide enrichment inhibits nitrate assimilation in wheat and Arabidopsis. Science 328, 899–903. doi: 10.1126/science.1186440
Britto, D. T., Kronzucker, H. J. (2001). Can unidirectional influx be measured in higher plants? A mathematical approach using parameters from efflux analysis. New Phytol. 150, 37–47. doi: 10.1046/j.1469-8137.2001.00080.x
Camañes, G., Cerezo, M., Primo-Millo, E., Gojon, A., García-Agustín, P. (2009). Ammonium transport and CitAMT1 expression are regulated by N in Citrus plants. Planta 229, 331–342. doi: 10.1007/s00425-008-0833-y
Deng, W. K., Wang, Y. B., Liu, Z. X., Cheng, H., Xue, Y. (2014). HemI: a toolkit for illustrating heatmaps. PLoS One 9, e111988. doi: 10.1371/journal.pone.0111988
Downes, M. T. (1978). An improved hydrazine reduction method for the automated determination of low nitrate levels in freshwater. Water Res. 12, 673–675. doi: 10.1016/0043-1354(78)90177-X
Duan, F. Y., Giehl, R. F. H., Geldner, N., Salt, D. E., von Wirén, N. (2018). Root zone-specific localization of AMTs determines ammonium transport pathways and nitrogen allocation to shoots. PLoS Biol. 16, e2006024. doi: 10.1371/journal.pbio.2006024
Fan, X., Tang, Z., Tan, Y., Zhang, Y. (2016). Overexpression of a pH-sensitive nitrate transporter in rice increases crop yields. PNAS 113, 7118–7123. doi: 10.1073/pnas.1714238114
Gazzarrini, S., Lejay, L., Gojon, A., Ninnemann, O., Frommer, W. B., von Wirén, N. (1999). Three functional transporters for constitutive, diurnally regulated. Plant Cell 11, 937–947. doi: 10.1105/tpc.11.5.937
Giehl, R. F. H., Laginha, A. M., Duan, F., Rentsch, D., Yuan, L., von Wirén, N. (2017). A critical role of AMT2;1 in root-to-shoot translocation of ammonium in Arabidopsis. Mol. Plant 10, 1449–1460. doi: 10.1016/j.molp.2017.10.001
Glass, A. D., Britto, D. T., Kaiser, B. N., Kinghorn, J. R., Kronzucker, H. J., Kumar, A., et al. (2002). The regulation of nitrate and ammonium transport systems in plants. J. Exp. Bot. 53, 855–864. doi: 10.1093/jexbot/53.370.855
Guan, M., de Bang, T. C., Pedersen, C., Schjoerring, J. K. (2016). Cytosolic glutamine synthetase Gln1;2 is the main isozyme contributing to GS1 activity and can be up-regulated to relieve ammonium toxicity. Plant Physiol. 171, 1921–1933. doi: 10.1104/pp.16.01195
Hachiya, T., Sakakibara, H. (2017). Interactions between nitrate and ammonium in their uptake, allocation, assimilation, and in plants. J. Exp. Bot. 68, 2501–2512. doi: 10.1093/jxb/erw449
Hachiya, T., Watanabe, C. K., Fujimoto, M., Ishikawa, T., Takahara, K., Kawai-Yamada, M., et al. (2012). Nitrate addition alleviates ammonium toxicity without lessening ammonium accumulation, organic acid depletion and inorganic cation depletion in Arabidopsis thaliana shoots. Plant Cell Physiol. 53, 577–591. doi: 10.1093/pcp/pcs012
Ho, C. H., Tsay, Y. F. (2010). Nitrate, ammonium, and potassium sensing and signaling. Curr. Opin. Plant Biol. 13, 604–610. doi: 10.1016/j.pbi.2010.08.005
Ivančič, I., Degobbis, D. (1984). An optimal manual procedure for ammonia analysis in natural waters by the indophenol blue method. Water Res. 18, 1143–1147. doi: 10.1016/0043-1354(84)90230-6
Jian, S., Liao, Q., Song, H., Liu, Q., Lepo, J. E., Guan, C., et al. (2018). NRT1.1-related NH4+ toxicity is associated with a disturbed balance between NH4+ uptake and assimilation. Plant Physiol. 178, 1473–1488. doi: 10.1104/pp.18.00410
Kiba, T., Krapp, A. (2016). Plant nitrogen acquisition under low availability: regulation of uptake and root architecture. Plant Cell Physiol. 57, 707–714. doi: 10.1093/pcp/pcw052
Krapp, A., David, L. C., Chardin, C., Girin, T., Marmagne, A., Leprince, A., et al. (2014). Nitrate transport and signalling in Arabidopsis. J. Exp. Bot. 65, 789–798. doi: 10.1093/jxb/eru001
Kronzucker, H. J., Siddiqi, M. Y., Anthony, D. M. G., Guy, J. D. K. (1999). Nitrate-ammonium synergism in rice. A subcellular flux analysis. Plant Physiol. 119, 1041–1045. doi: 10.1104/pp.119.3.1041
Lanquar, V., Loqué, D., Hörmann, F., Yuan, L., Bohner, A., Engelsberger, W. R., et al. (2009). Feedback inhibition of ammonium uptake by a phospho-dependent allosteric mechanism in Arabidopsis. Plant Cell 21, 3610–3622. doi: 10.1105/tpc.109.068593
Liu, Y., von Wirén, N. (2017). Ammonium as a signal for physiological and morphological responses in plants. J. Exp. Bot. 68, 2581–2592. doi: 10.1093/jxb/erx086
Loque, D., von Wirén, N. (2004). Regulatory levels for the transport of ammonium in plant roots. J. Exp. Bot. 55, 1293–1305. doi: 10.1093/jxb/erh147
Lothier, J., Gaufichon, L., Sormani, R., Lemaître, T., Azzopardi, M., Morin, H., et al. (2011). The cytosolic glutamine synthetase GLN1;2 plays a role in the control of plant growth and ammonium homeostasis in Arabidopsis rosettes when nitrate supply is not limiting. J. Exp. Bot. 62, 1375–1390. doi: 10.1093/jxb/erq299
Luo, J., Qin, J., He, F., Li, H., Liu, T., Polle, A., et al. (2013). Net fluxes of ammonium and nitrate in association with H+ fluxes in fine roots of Populus popularis. Planta 237, 919–931. doi: 10.1007/s00425-012-1807-7
McDonald, T. R., Ward, J. M. (2016). Evolution of electrogenic ammonium transporters (AMTs). Front. Plant Sci. 7, 352. doi: 10.3389/fpls.2016.00352
Miller, A. J., Cramer, M. D. (2004). Root nitrogen acquisition and assimilation. Plant Soil 274, 1–36. doi: 10.1007/s11104-004-0965-1
Nacry, P., Bouguyon, E., Gojon, A. (2013). Nitrogen acquisition by roots: physiological and developmental mechanisms ensuring plant adaptation to a fluctuating resource. Plant Soil 370, 1–29. doi: 10.1007/s11104-013-1645-9
Pearson, J. N., Finnemann, J., Schjoerring, J. K. (2002). Regulation of the high-affinity ammonium transporter (BnAMT1;2) in the leaves of Brassica napus by nitrogen status. Plant Mol. Biol. 49, 483–490. doi: 10.1023/A:1015549115471
Qu, C. P., Xu, Z. R., Hu, Y. B., Lu, Y., Yang, C. J., Sun, G. Y., et al. (2016). RNA-seq reveals transcriptional level changes of poplar roots in different forms of nitrogen treatments. Front. Plant Sci. 7, 51. doi: 10.3389/fpls.2016.00051
Ranathunge, K., El-Kereamy, A., Gidda, S., Bi, Y. M., Rothstein, S. J. (2014). AMT1;1 transgenic rice plants with enhanced NH4+ permeability show superior growth and higher yield under optimal and suboptimal NH4+ conditions. J. Exp. Bot. 65, 965–979. doi: 10.1093/jxb/ert458
Ruan, L., Wei, K., Wang, L. Y., Cheng, H., Zhang, F., Wu, L. Y., et al. (2016). Characteristics of NH4+ and NO3– fluxes in tea (Camellia sinensis) roots measured by scanning ion-selective electrode technique. Sci. Rep. 6, 38370. doi: 10.1038/srep38370
Socci, A. M., Templer, P. H. (2011). Temporal patterns of inorganic nitrogen uptake by mature sugar maple (Acer saccharum Marsh.) and red spruce (Picea rubens Sarg.) trees using two common approaches. Plant Ecolog. Divers. 4, 141–152. doi: 10.1080/17550874.2011.624557
Song, S. W., Yi, L. Y., Liu, H. C., Sun, G. W., Chen, R. Y. (2012). Effect of ammonium and nitrate ratio on nutritional quality of flowering Chinese cabbage. Appl. Mech. Mater. 142, 188–192. doi: 10.4028/www.scientific.net/AMM.142.188
Song, S. W., Li, G., Sun, G. W., Liu, H. C., Chen, R. Y. (2016). Uptake kinetics of different nitrogen forms by Chinese Kale. Commun. Soil Sci. Plant Anal. 47, 1372–1378. doi: 10.1080/00103624.2016.1178279
Straub, T., Ludewig, U., Neuhäuser, B. (2017). The kinase CIPK23 inhibits ammonium transport in Arabidopsis thaliana. Plant Cell 29, 409–422. doi: 10.1105/tpc.16.00806
Wang, B., Shen, Q. R. (2011). NH4+-N/NO3—N ratios on growth and NO3—N remobilization in root vacuoles and cytoplasm of lettuce genotypes. Can. J. Plant Sci. 91, 411–417. doi: 10.4141/CJPS10044
Wang, M. Y., Glass, A. D. M., Shaff, J. E., Kochian, L. N. (1994). Ammonium uptake by rice roots: III. Electrophysiology. Plant Physiol. 104, 899–906. doi: 10.1104/pp.104.3.899
Wang, Q. L., Zhao, Y. Y., Luo, W. X., Li, R. L., He, Q. H. (2013). Single-particle analysis reveals shutoff control of the Arabidopsis ammonium transporter AMT1;3 by clustering and internalization. PNAS 110, 13204–13209. doi: 10.1073/pnas.1301160110
Wang, P., Wang, Z. K., Sun, X. C., Mu, X. H., Chen, H., Chen, F. J., et al. (2019). Interaction effect of nitrogen form and planting density on plant growth and nutrient uptake in maize seedlings. J. Integr. Agr. 18, 1120–1129. doi: 10.1007/s11104-018-03918-6
Xu, Y., Sun, T., Yin, L. P. (2006). Application of non-invasive microsensing system to simultaneously measure both H+ and O2 fluxes around the pollen tube. J. Integr. Plant Biol. 48, 823–831. doi: 10.1111/j.1744-7909.2006.00281.x
Yao, S. G., Sonoda, Y., Tsutsui, T., Nakamura, H., Ichikawa, H., Ikeda, A., et al. (2008). Promoter analysis of OsAMT1;2 and OsAMT1;3 implies their distinct roles in nitrogen utilization in rice. Breed. Sci. 58, 201–207. doi: 10.1270/jsbbs.58.201
Yuan, L. X., Loqué, D., Kojima, S., Rauch, S., Ishiyama, K., Inoue, E., et al. (2007). The organization of high-affinity ammonium uptake in Arabidopsis roots depends on the spatial arrangement and biochemical properties of AMT1-type transporters. Plant Cell 19, 2636–2652. doi: 10.1105/tpc.107.052134
Yusuf, A., Deepa, P. (2017). Influence of N nutrients on GS activity and putative ammonium transporter1; 2 (SaAMT1;2) expression in sandal plants (Santalum album L.). Trees 31, 1773–1784. doi: 10.1007/s00468-017-1583-x
Keywords: AMT1.2, Brassica campestris, interaction, NH4+ flux, NO3– flux
Citation: Zhu Y, Huang X, Hao Y, Su W, Liu H, Sun G, Chen R and Song S (2020) Ammonium Transporter (BcAMT1.2) Mediates the Interaction of Ammonium and Nitrate in Brassica campestris. Front. Plant Sci. 10:1776. doi: 10.3389/fpls.2019.01776
Received: 20 September 2019; Accepted: 19 December 2019;
Published: 04 February 2020.
Edited by:
Jose M. Garcia-Mina, University of Navarra, SpainReviewed by:
Laura Zanin, University of Udine, ItalyPetronia Carillo, University of Campania Luigi Vanvitelli, Italy
Copyright © 2020 Zhu, Huang, Hao, Su, Liu, Sun, Chen and Song. This is an open-access article distributed under the terms of the Creative Commons Attribution License (CC BY). The use, distribution or reproduction in other forums is permitted, provided the original author(s) and the copyright owner(s) are credited and that the original publication in this journal is cited, in accordance with accepted academic practice. No use, distribution or reproduction is permitted which does not comply with these terms.
*Correspondence: Riyuan Chen, cnljaGVuQHNjYXUuZWR1LmNu; Shiwei Song, c3dzb25nQHNjYXUuZWR1LmNu