 Junji Su
 Caixiang Wang1,2
 Fushun Hao
94% of researchers rate our articles as excellent or good
Learn more about the work of our research integrity team to safeguard the quality of each article we publish.
Find out more
ORIGINAL RESEARCH article
Front. Plant Sci. , 02 August 2019
Sec. Plant Breeding
Volume 10 - 2019 | https://doi.org/10.3389/fpls.2019.00964
Upland cotton (Gossypium hirsutum L.) is the most important source of natural fiber in the world. Early-maturity upland cotton varieties are commonly planted in China. Nevertheless, lint yield of early-maturity upland cotton varieties is strikingly lower than that of middle- and late-maturity ones. How to effectively improve lint yield of early maturing cotton, becomes a focus of cotton research. Here, based on 72,792 high-quality single nucleotide polymorphisms of 160 early-maturing upland cotton accessions, we performed genome-wide association studies (GWASs) for lint percentage (LP), one of the most lint-yield component traits, applying one single-locus method and six multi-locus methods. A total of 4 and 45 significant quantitative trait nucleotides (QTNs) were respectively identified to be associated with LP. Interestingly, in two of four planting environments, two of these QTNs (A02_74713290 and A02_75551547) were simultaneously detected via both one single-locus and three or more multi-locus GWAS methods. Among the 42 genes within a genomic region (A02: 74.31–75.95 Mbp) containing the above two peak QTNs, Gh_A02G1269, Gh_A02G1280, and Gh_A02G1295 had the highest expression levels in ovules during seed development from 20 to 25 days post anthesis, whereas Gh_A02G1278 was preferentially expressed in the fibers rather than other organs. These results imply that the four potential candidate genes might be closely related to cotton LP by regulating the proportion of seed weight and fiber yield. The QTNs and potential candidate genes for LP, identified in this study, provide valuable resource for cultivating novel cotton varieties with earliness and high lint yield in the future.
As one of the most important cash crops, upland cotton (Gossypium hirsutum L.) is widely cultivated around the world and supplies the most raw materials for the textile industry. China is one of the largest nations producing cotton fiber with the highest per unit area yield in the world (Dai and Dong, 2014). At present, the increased average yield of cotton is mainly ascribed to the application of many improved varieties as well as precise farming technologies in China (Dai and Dong, 2014; Feng et al., 2017). It is well-known that upland cotton can be classified into early-, middle-, and late- maturity varieties based on the duration of their growth periods. Early-maturity upland cotton features early flowering, early boll-opening, and short and compact plant architecture (Gwathmey et al., 2016). It is appropriate for the precise cultivation or production patterns including double cropping, high-density planting, and mechanical harvesting (Yu et al., 2005; Song et al., 2015; Feng et al., 2017; Su et al., 2018). Therefore, the early-maturity cotton varieties are becoming increasingly important in Chinese cotton production. However, cotton fiber yield of early-maturity varieties was strikingly lower than that of middle- and late- maturity ones. Hence, improving fiber yield is a major goal in Chinese early-maturity cotton breeding practice.
Over the past 40 years, traditional breeding strategy has played important roles in early-maturity cotton breeding in China, and a series of early-maturity cotton varieties like “Liaomian,” “Xinluzao,” and “Zhongmiansuo” had been bred by using hybridization and backcrossing. However, due to the striking negative correlation between high yield and early maturity, it is hard to cultivate varieties with high lint yield and earliness by means of traditional breeding strategy (Song et al., 2005; Fan et al., 2006; Su et al., 2016b). LP is one of the most lint-yield component traits in cotton, and its heritability and stability are high, even though it is influenced by different natural environmental conditions (Su et al., 2016a). Therefore, illuminating the molecular mechanisms underlying LP is very essential for improving lint yield in early-maturity cotton breeding.
Lint percentage was mainly controlled by many QTL, which can be detected by linkage analysis and association mapping. Over the past two decades, a number of QTL for LP had been identified via linkage analysis in upland cotton (Zhang et al., 2005; Abdurakhmonov et al., 2007; Shen et al., 2007; Liu et al., 2012; Yu et al., 2013; Wang et al., 2014). Compared with QTL mapping based on linkage analysis for LP, detections of marker-trait association with LP in upland cotton were relatively few. For example, a few QTNs associated with LP had been identified via GWASs in upland cotton (Su et al., 2016a; Fang et al., 2017; Huang et al., 2017; Ma et al., 2018). Among these association studies, single-locus GWAS (SL-GWAS) models, based on the MLM, were utilized. Nevertheless, multi-locus GWAS (ML-GWAS) models were seldom applied to dissect genetic basis for cotton LP.
In general, multiple tests and Bonferroni correction are made to reduce the false positive rate in the SL-GWAS experiments. These may result in exclusion of some important locus-trait associations because of the strict significance-test criterion. As an excellent complement to SL-GWAS, the new ML-GWAS models, which are beneficial to identifying more loci associated with the target traits, were applied in the past 10 years, because the stringent Bonferroni correction was not needed using these models. In the last 3 years, researchers had developed six new multi-locus GWAS (ML-GWAS) models including mrMLM (Wang et al., 2016), ISIS EM-BLASSO (Tamba et al., 2017), FASTmrEMMA (Wen et al., 2018), pLARmEB (Zhang et al., 2017), FASTmrMLM (Tamba and Zhang, 2018), and pKWmEB (Ren et al., 2018). Some of them had also been used in upland cotton recently (Hou et al., 2018; Su et al., 2018). Moreover, application of a combination of both SL- and ML-GWAS methods was reported to be useful for improving accuracy of GWAS results (Li et al., 2018; Xu et al., 2018).
In this study, to decrypt genetic basis for LP in Chinese early-maturity upland cotton, we integrated one single-locus method (MLM) and six multi-locus methods (mrMLM, ISIS EM-BLASSO, FASTmrEMMA, pLARmEB, FASTmrMLM, and pKWmEB), and performed GWAS analyses for LP using 72,792 high-quality SNPs of 160 early-maturing cotton accessions. The favorable allelic variations of the peak QTNs and the potential candidate genes for objective trait were further identified. This effort will lay the basis for breeding excellent upland cotton varieties with high lint yield and earliness in the future.
An association panel which comprises 160 Chinese early-maturity upland cotton accessions (Supplementary Table S1) was reported in our previous study (Su et al., 2018). These accessions were collected from the germplasm gene bank of the Institute of Cotton Research of Chinese Academy of Agricultural Sciences (ICR-CAAS). Based on cotton growing areas in China, the germplasms were divided into three categories: the Yellow River Region (YRR, 81 accessions), the NIR (58 accessions) and the NSEMR (21 accessions), respectively. All the early-maturity cotton accessions, which were planted for more than 3 years, had relatively wide LP distributions ranging from 28 to 48%.
A total of 160 early-maturity upland cotton accessions were examined under four planting conditions: two locations: Anyang (AY), Henan, China (36.13° N, 114.80° E) and Shihezi (SHZ), Xinjiang, China (44.52° N, 86.02° E); 2 years: 2014 and 2015. Four planting environments were respectively designated as AY-2014, AY-2015, SHZ-2014, and SHZ-2015. All the trials adopted a randomized complete block design and had three replications. Each accession was planted in a plot with 4.00 m2 (0.80 m × 5.00 m) in AY-2014 and AY-2015, whereas each accession was sown in a plot with about 3.00 m2 (0.76 m × 4.00 m) in SHZ-2014 and SHZ-2015. Both experiments, at SHZ, were conducted with conditions of drip irrigation under plastic film, while two trials at AY were furrow irrigated as required. The field management measures were conducted according to local agronomic practices.
After maturing, 20 spontaneously opened bolls were gathered from middle part of the plants from each accession in each replicate for 2 years. For each cotton sample, 20-BW and their LW were measured by electronic balance. LP was calculated according to the formula of LP (%) = LW (g)/BW (g) × 100%. The ANOVA for LP phenotypic data was conducted using SPSS 24.0 software.
The approaches of DNA extraction, SLAF-seq, and SNP calling were reported in detail in the previous study (Su et al., 2018). In the light of filtering criterion of missing rate < 20% and MAF ≥ 0.05, a total of 72,792 high-quality SNPs were obtained and used to the following analysis (Su et al., 2018). In this study, both SL-GWAS and ML-GWAS were respectively conducted for four individual environments. The SL-GWAS was performed in MLM (PCs + K) by using the Tassel 5.2 program (Bradbury et al., 2007). Its P-value threshold for significant association was 6.87E-05 (5/total SNPs used), that is to say, those with -lgP ≥ 4.16 were considered the significant marker-trait associations. The six ML-GWAS methods including the mrMLM (Wang et al., 2016), ISIS EM-BLASSO (Tamba et al., 2017), FASTmrEMMA (Wen et al., 2018), pLARmEB (Zhang et al., 2017), FASTmrMLM (Tamba and Zhang, 2018), and pKWmEB (Ren et al., 2018) were used in this study. For the above six ML-GWAS methods, all the parameters were set to defaults, and the PCs and K covariates were added to the model. All the significant-association thresholds were set to LOD = 3.00. The SNPs loci, which satisfied the above criterion, were regarded as the QTNs with the significant marker-trait associations.
For the peak QTNs, the phenotypic value of each allelic variation was estimated by the phenotypic values for the accessions with each type of QTN. The favorable allelic variations of the QTNs were subsequently identified according to the breeding objectives of target trait. Box plots for the relative phenotypic values were performed using R software.
The physical positions of the pivotal locus-trait associations were applied to identify putative candidate genes in the Gossypium hirsutum L reference genomes v1.1 (Zhang et al., 2015). According to LD decay distance and the positions of the significant QTNs, we determined the prediction intervals, which contained the potential candidate genes. Then, the genes, which were distributed in these regions, were picked out, and their expression levels were estimated by a RNA-seq. The RNA-seq datasets of 17 cotton tissues [root, stem, leaf, ovules from -3, -1, 0, 1, 3, 5, 10, 20, 25, and 35 DPA, and fibers from 5, 10, 20, and 25 DPA of G. hirsutum “TM-1”] were available on the NCBI SRA database1 (Zhang et al., 2015). Normalized FPKM values were reckoned to show the gene expression levels. The mean of the two biological replicates was considered as the final FPKM values. Heatmaps of the putative candidate gene expression styles were drawn using the R package “pheatmap.” The biological functions of putative candidate genes were annotated by GO items on the cotton website2.
The LP phenotypic values among these 160 upland cotton accessions were used for the variation analysis across four environments. In the four experiments, the mean LP values (± SD) were 40.96 ± 2.77, 39.78 ± 3.19, 41.77 ± 2.60, and 42.05 ± 2.46% in AY-2014, AY-2015, SHZ-2014, and SHZ-2015, respectively. In AY-2015, the LP values ranged from 28.58 to 47.22%, with the maximum coefficient of variation (CV) of 8.01%; whereas in SHZ-2015, the LP had the minimum variation ranging from 31.59 to 47.03%, with a smallest CV value of 5.84% (Table 1). The phenotypic evaluation results indicate that the early-maturity upland cotton varieties have broad variation of LP among the 160 accessions.
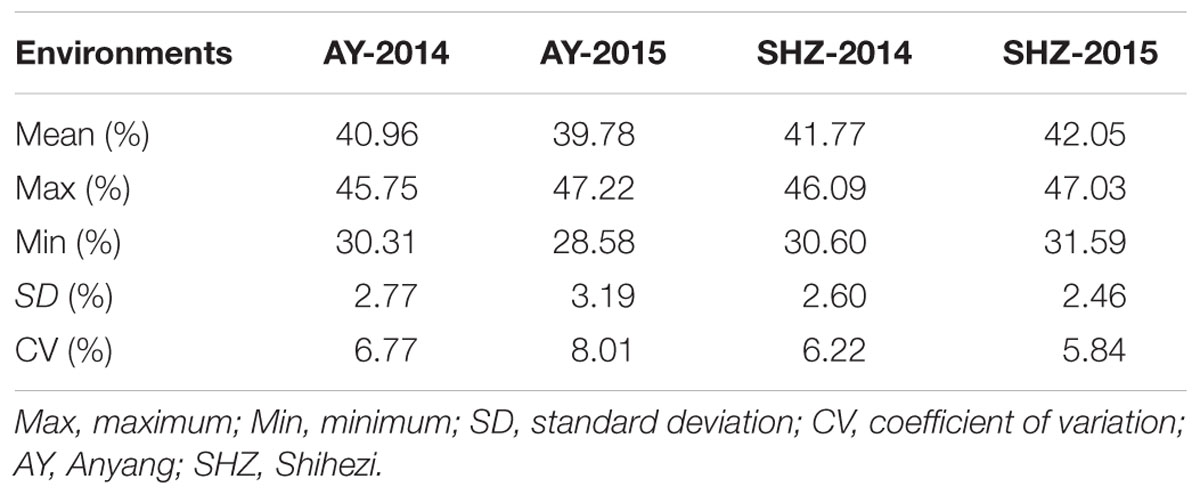
Table 1. Phenotypic distribution range of lint percentage (LP) of 160 early-maturity upland cotton accessions.
To examine whether LP variances were significantly influenced by the external environments, comparative analyses were conducted among the LP values across the four different environments. We observed that the LP values at SHZ were obviously higher than those at AY among these 160 accessions (Figure 1). Furthermore, the ANOVA showed that there were significant differences (P < 0.001) for LP among genotypes (G), environments (E), and the G × E interactions (Supplementary Table S2). These results imply that the LP is clearly affected by the external environmental conditions.
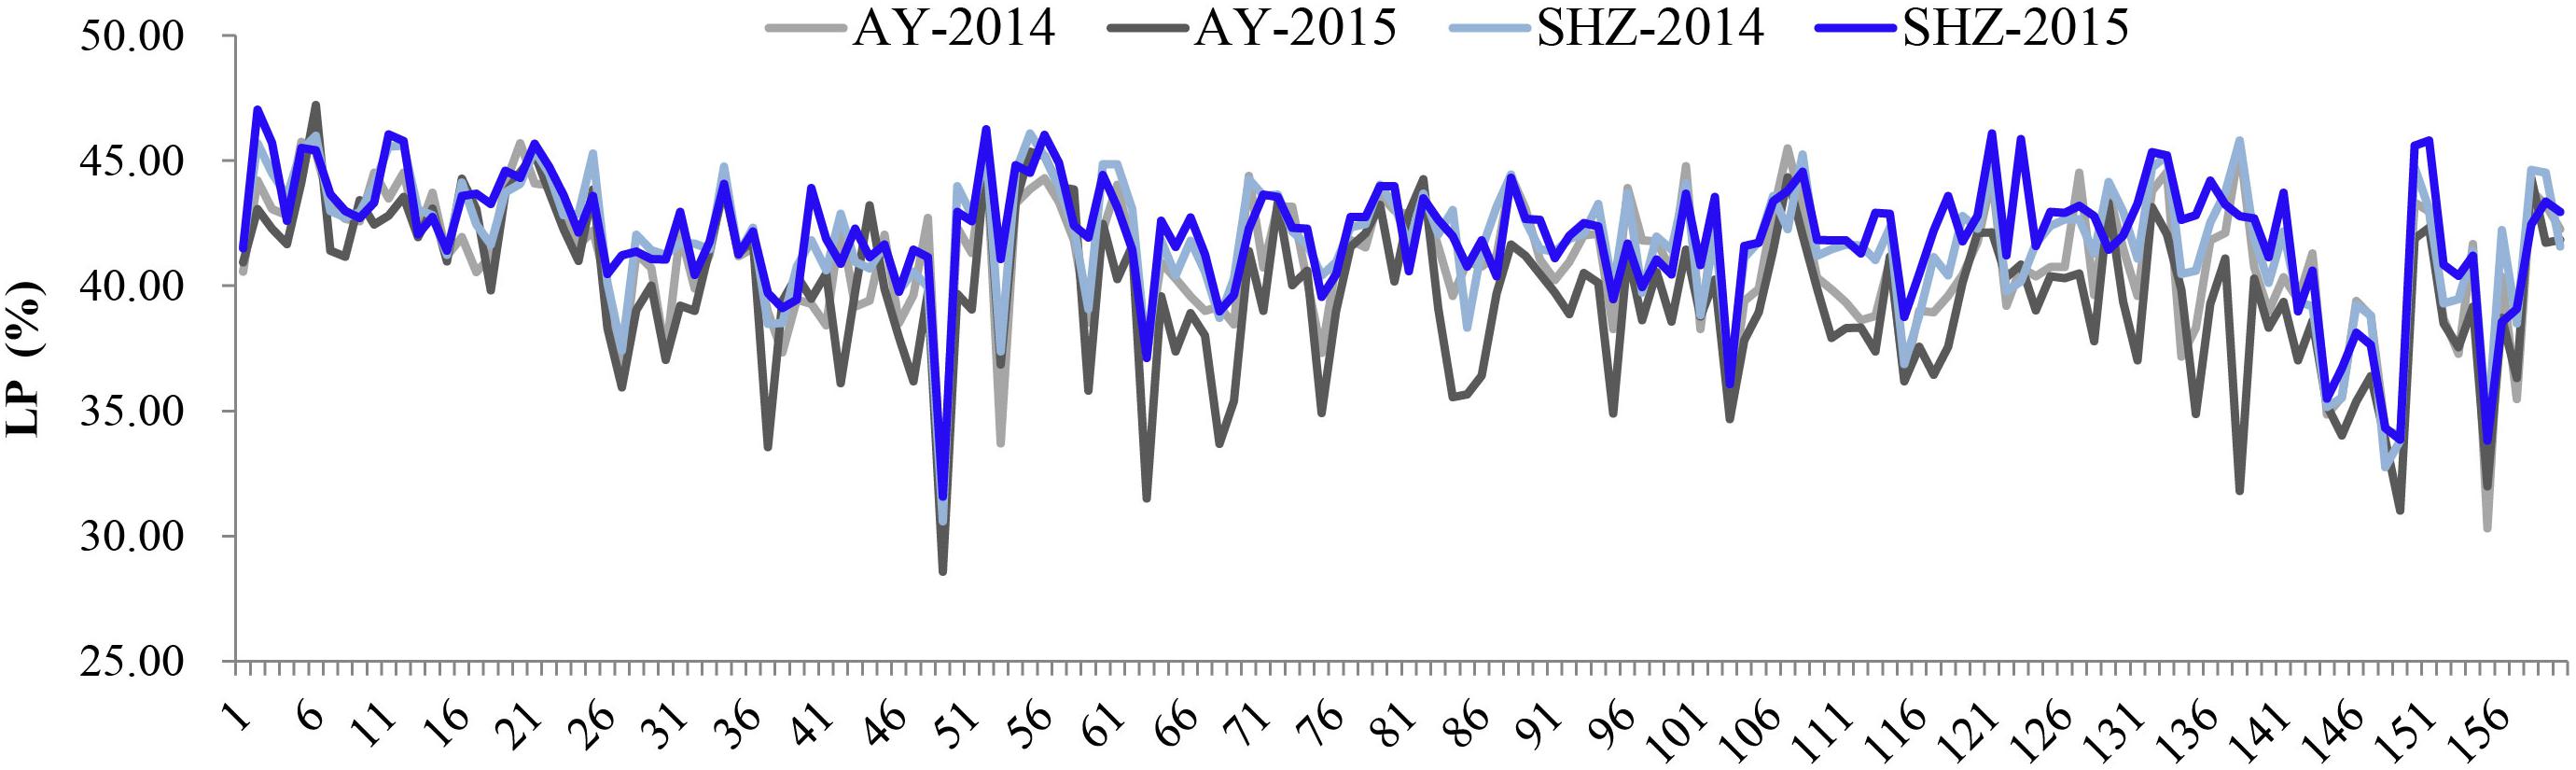
Figure 1. Phenotypic distributions of lint percentage (LP) of 160 early-maturity upland cotton accessions in four growing environments.
In our previous study, on the basis of 72,792 SNPs, the PCs and K values of the association panel were estimated, and the population structure of these 160 upland cotton accessions was separated into three subpopulations by two means of principal component analysis (PCA) and the phylogenetic tree (Su et al., 2018). In the study, in order to detect accurately the genetic variations associated with LP trait in Chinese early-maturity upland cotton, we performed simultaneously SL-GWAS and ML-GWAS.
Applying the MLM of SL-GWAS, four significant QTNs for LP were detected, and two, one, and one of them were located on chromosomes A02, A07, and A12, respectively (Table 2). Among these four QTNs associated with LP, QTN A02_75551547 was presented in three planting environments (AY-2014, SHZ-2014, and SHZ-2015); two QTNs A02_74713290 and A12_7739289 were detected to be associated with LP in SHZ-2014 and SHZ-2015; QTN A07_16082894 was associated with LP in SHZ-2014 (Table 2). Importantly, three QTNs (A02_75551547, A02_74713290, and A12_7739289) were simultaneously identified in two or more environments, and had a high -lgP value (4.30–5.16) and a large explanation of the total phenotypic variance (10.78–15.54%).
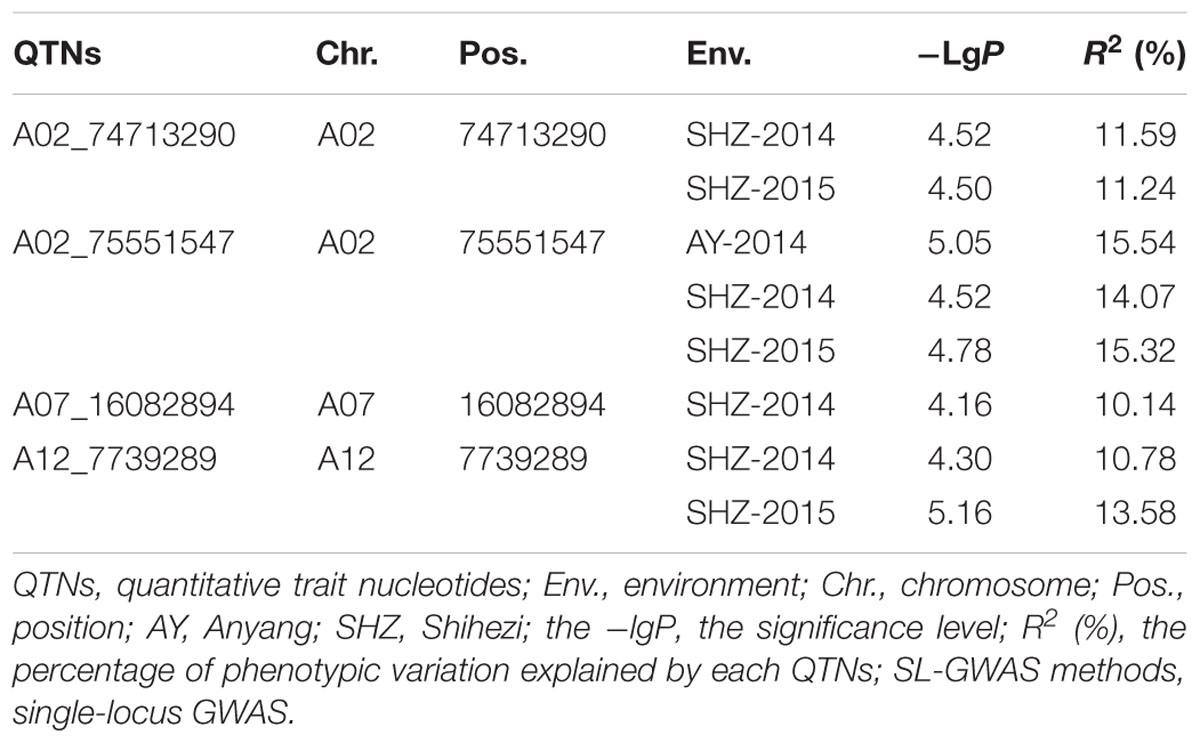
Table 2. The significant QTNs associated with lint percentage (LP) via SL-GWAS methods.
Using six ML-GWAS methods including mrMLM, FASTmrMLM, FASTmrEMMA, pLARmEB, ISIS EM-BLASSO, and pKWmEB, we totally identified 45 QTNs for LP after removing duplicates. Most QTNs (20) were detected by pKWmEB, followed by FASTmrMLM (18), pLARmEB (17), mrMLM (16), ISIS EM-BLASSO (13), and FASTmrEMMAQTNs (5) (Supplementary Table S3). To improve accuracy of the identified QTNs, the significant SNPs, which were simultaneously detected through three or more multi-locus methods, were considered as the steady and reliable QTNs. Finally, 11 steady and reliable QTNs for LP were screened out by three or more multi-locus methods (Table 3). Among these, six and five of them were respectively positioned on At- and Dt- chromosome, and three significant QTNs were simultaneously detected via five multi-locus methods. For example, the QTN A02_74713290 was probed using five multi-locus methods (mrMLM, FASTmrMLM, ISIS EM-BLASSO, pLARmEB, and pKWmEB) in SHZ-2015; the significant QTN D12_36345100 was detected in AY-2015 by using five ML-GWAS methods including mrMLM, FASTmrMLM, FASTmrEMMA, ISIS EM-BLASSO, and pKWmEB. Additionally, we observed three QTNs (A02_74713290, A02_75551547, and A05_12957926) were contemporaneously found in two planting environments. For instance, the QTN A05_12957926 was simultaneously associated with LP in two growing environments (AY-2014 and SHZ-2014) using three or more ML-GWAS methods, and explained 4.62–9.58% of total phenotypic variance. Most meaningfully, two QTNs were also found to be associated with LP in two of the four planting conditions. In detail, one QTN A02_75551547 was simultaneously presented in AY-2014 and SHZ-2014, with the highest LOD value (8.71) and the largest explanation of the total phenotypic variance (14.35%); and the other QTN A02_74713290 was simultaneously associated with LP in SHZ-2014 and SHZ-2015, and explained 5.52–11.52% of total phenotypic variance.
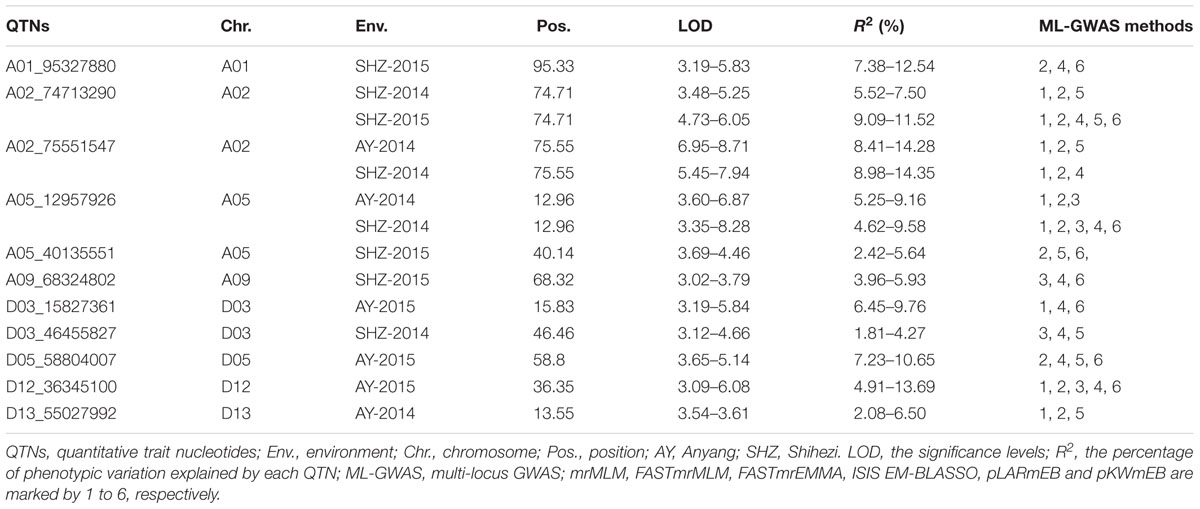
Table 3. The significant LP-QTNs detected simultaneously by using three or more ML-GWAS methods.
In summary, we found that more QTNs were detected by applying multi-locus models than single-locus models. For instance, more than 13 QTNs were identified by whichever ML-GWAS methods with the exception of FASTmrEMMA, whereas only 4 QTNs were obtained via SL-GWAS method in the looser P-value threshold (5/total SNPs used). Interestingly, two QTNs (A02_74713290 and A02_75551547) were simultaneously identified via both SL- and ML-GWAS. Using the MLM of SL-GWAS, both A02_74713290 and A02_75551547 were detected in two or more cultivation environments. Similarly, the above two QTNs were also found to be associated with LP by three or more multi-locus methods in two planting conditions. These results demonstrated that the SNP loci A02_74713290 and A02_75551547 were steady and reliable main-effect QTNs for LP in Chinese early-maturity upland cotton.
To investigate further allelic variations for LP, we focused four QTNs (A02_74713290, A02_75551547, A05_12957926, and D12_36345100) that were associated significantly with LP in two planting conditions, or detected by using five ML-GWAS methods. The peak QTN A02_74713290 presented three allelic variations (AA, AG, and GG), and the LP values of 142 accessions with the allelic variation AA were significantly higher than those of nine accessions with the allele AG (P ≤ 0.05), and were significantly higher than those of nine accessions with the allele GG (P ≤ 0.01) in the four growing environments (Figure 2A). Analogously, the other striking QTN A02_75551547 had three types of allelic variation CC, CT, and TT, respectively, where the LPs of germplasms with the allele CC were significantly higher than those with the allele TT (P ≤ 0.01) in all the planting environments (Figure 2B). The QTN A05_12957926 had three allelic variations (CC, CT, and TT), and the average LP of 92 cotton accessions with CC type were 41.55, 40.25, 42.45, and 42.51% in AY-2014, AY-2015, SHZ-2014, and SHZ-2015, respectively, significantly higher than those of 40 accessions with TT type (P ≤ 0.01) (Figure 2C). For the QTN D12_36345100, although the mean LP values of114 accessions with AA type were higher than those of 26 accessions with GG type, they did not reach the significant level (P ≤ 0.05) on statistics in two growing environments of SHZ (Figure 2D). Considering the breeding objective of cotton production, four allelic variations A02_74713290-AA, A02_75551547-CC, A05_12957926-CC, and D12_36345100-AA should be favorable allelic variations, whereas A02_74713290-GG, A02_75551547-TT, A05_12957926-TT, and D12_36345100-GG were the unfavorable allelic variations.
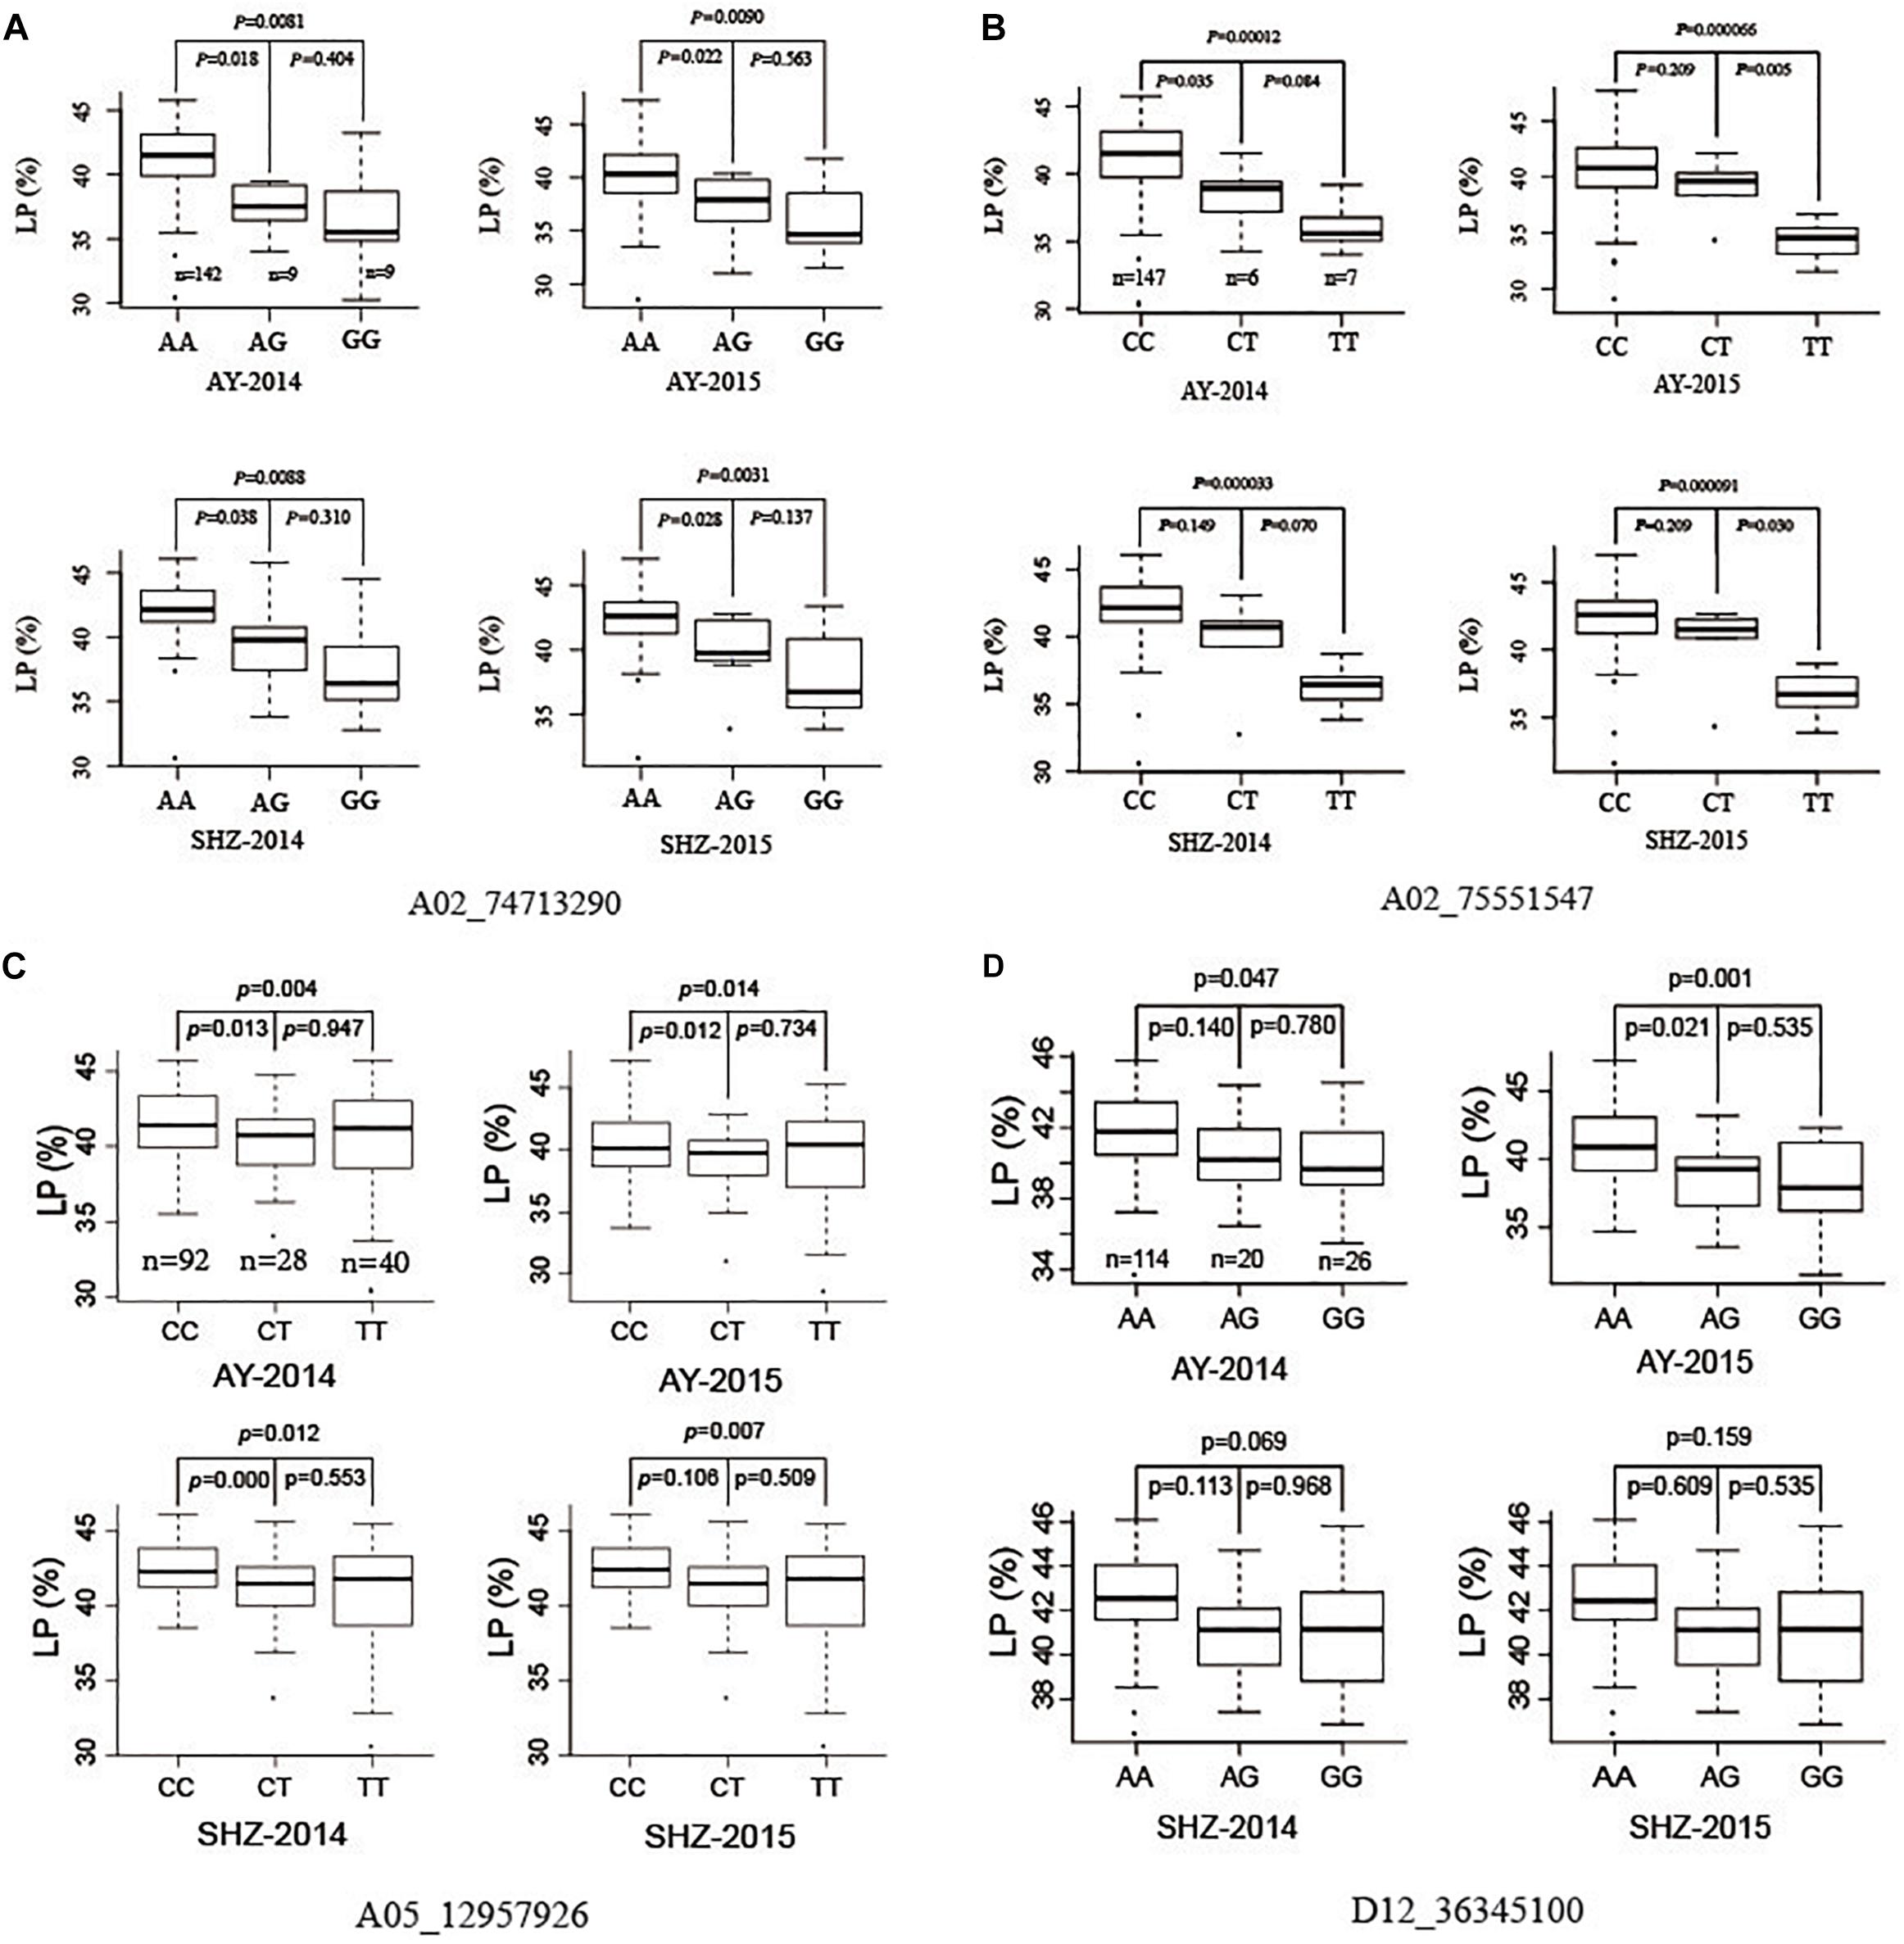
Figure 2. Box plots of lint percentage (LP) of three genetic variations for four peak QTNs A02_74713290 (A), A02_75551547 (B), A05_12957926 (C), and D12_36345100 (D).
Additionally, to gain insight into the geographic distribution of favorable allelic variations, two peak QTNs (A02_74713290 and A02_75551547) of them were selected, and the proportions of three allelic variations were compared among YRR, NIR, and NSEMR. We found that the accessions from YRR accounted for a larger proportion of two favorable allelic variations than those from NIR and NSEMR, and the unfavorable allelic variations accounted for the largest ratio in the accessions from NSEMR (Figure 3A). Consistently, the accessions from YRR showed significantly higher LP than those from NIR and NSEMR in all the planting environments (P ≤ 0.01, Figure 3B). These data indicated that there was a close relationship between the proportion of favorable allelic variations and LP phenotype of cotton accessions from the different growing areas.
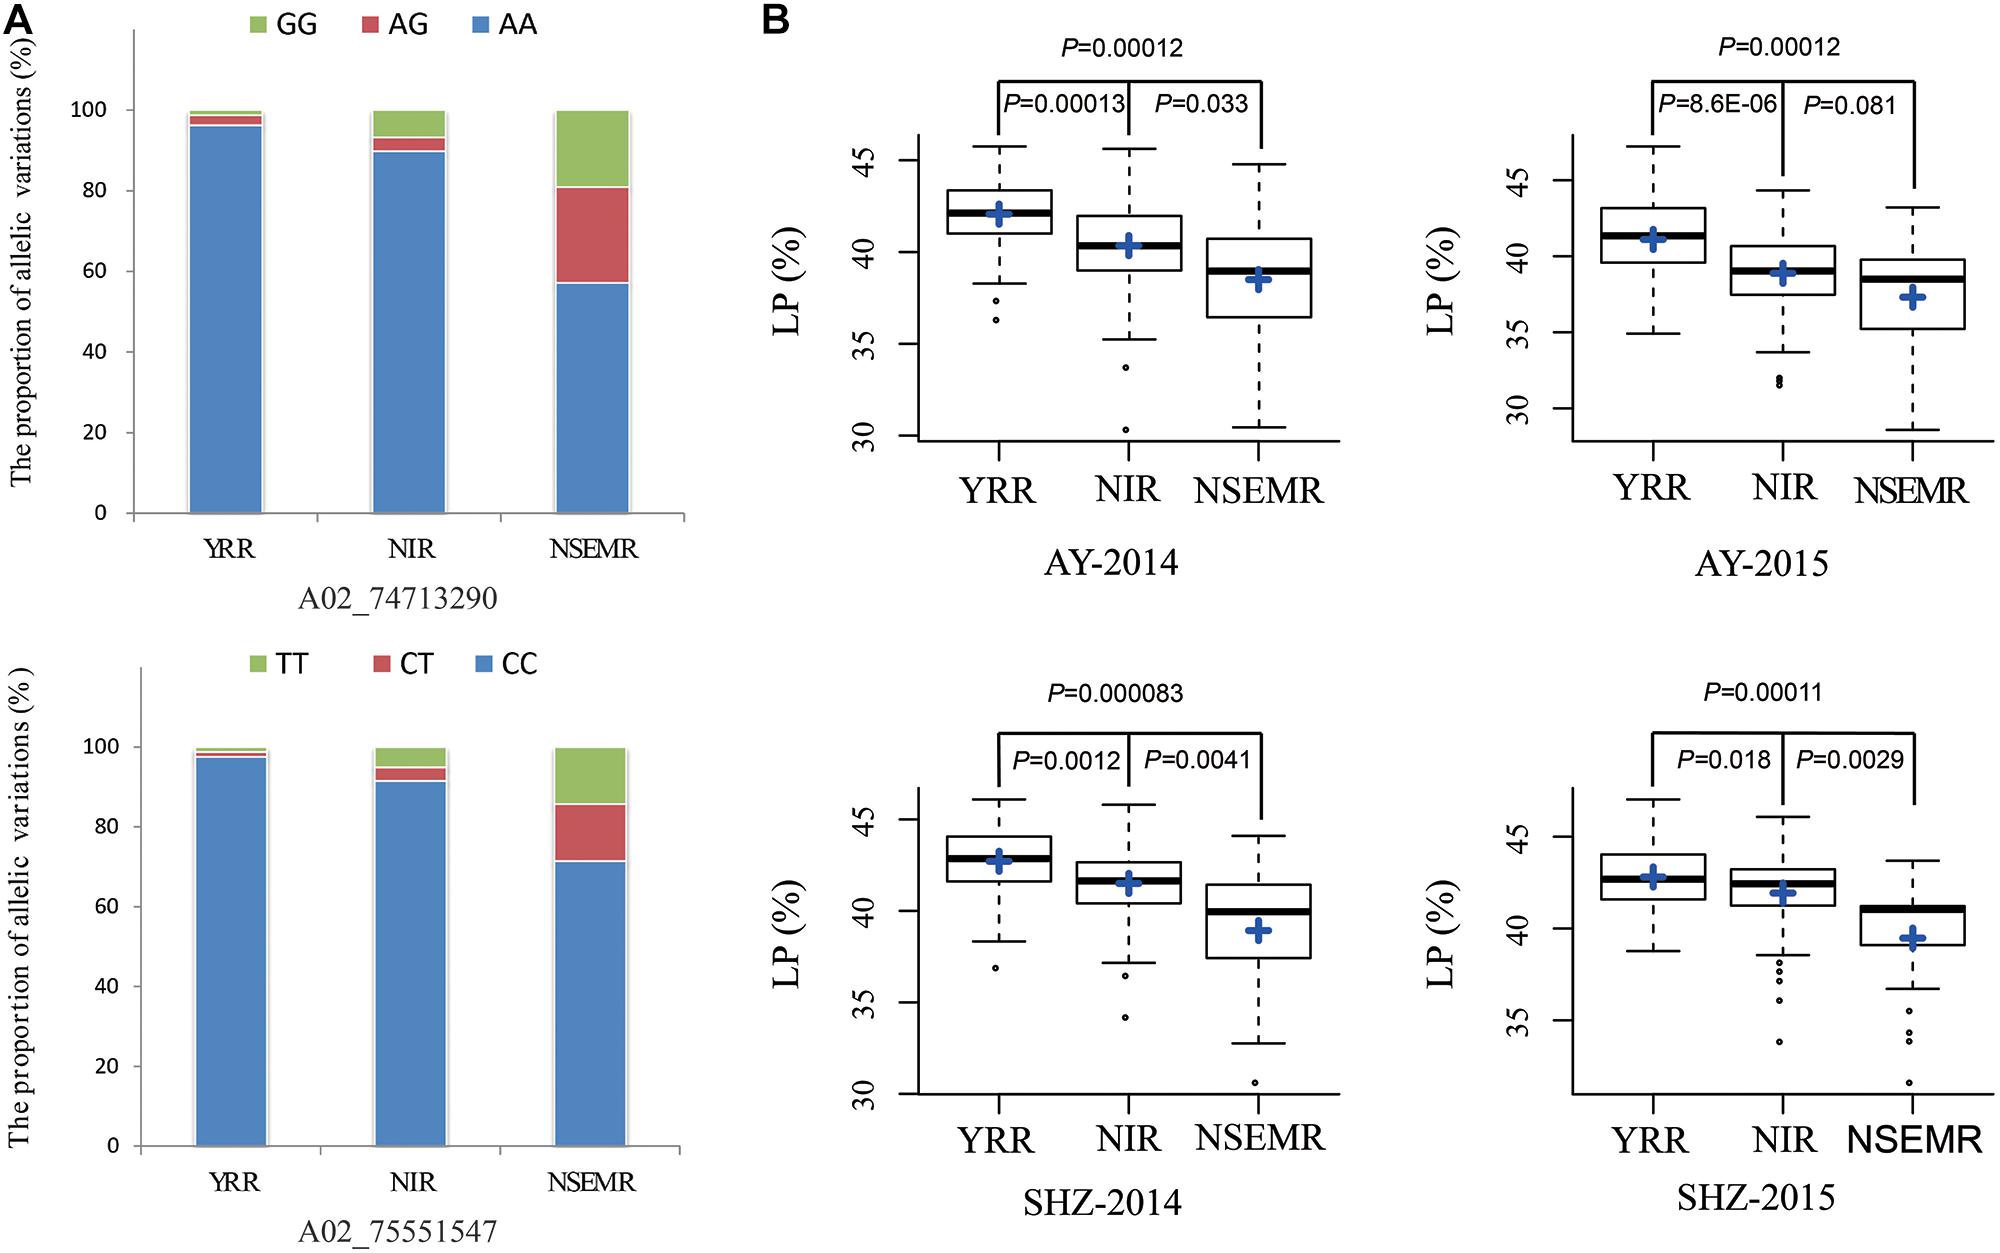
Figure 3. Identification of the favorable allelic variations for two peak QTNs. (A) The distribution frequencies of the favorable allelic variations in three geographic areas (YRR, NIR, and NSEMR). (B) Box plots of lint percentage (LP) of the different allelic variations for two peak QTNs in three geographic areas.
Due to the panel LD decay rate of 400 kb and the mean marker density with one SNP per 28.10 kb, there were enough dense SNPs to detect the significantly associated QTNs (Su et al., 2018). In the present study, the genomic region within ± 400 kb of these two peak QTNs (A02_74713290 and A02_75551547) on chromosome A02 might be a steady major-effect QTL controlling LP in early-maturity upland cotton. Therefore, it was applied to the authentication of candidate genes. The physical distance between A02_74713290 and A02_75551547 was a small region of approximately 800 kb; thus, only one target region ranging from 74.31 to 75.95 Mbp on chromosome A02 was used for identifying candidate genes (Figure 4A). There were totally 42 genes in the genomic region A02: 74.31–75.95 Mbp (Supplementary Table S4). The RNA-seq data showed that 32 of them were expressed genes among 17 upland cotton tissues, according to the normalized FPKM values of the genes (Figure 4B). The GO enrichment analysis showed that these expressed genes mainly participated in glutathione metabolic process and gamma-glutamyl transferase activity (Supplementary Figure S1). Among the expressed genes, three genes (Gh_A02G1269, Gh_A02G1280, and Gh_A02G1295) had the highest expression in ovules at 20 and 25 DPA, which decreased LP by increasing seed weight during ovule development from 20 to 25 DPA. For instance, the expression of Gh_A02G1295 in the late ovule-development stages was more than fivefold higher than that in fibers (Figure 4C). Moreover, Gh_A02G1278 showed to be preferentially expressed in the fibers rather than other organs, which improved LP by increasing fiber output during fiber development from 10 to 20 DPA (Figure 4D). These results imply that the four genes (Gh_A02G1269, Gh_A02G1278, Gh_A02G1280, and Gh_A02G1295) might be related to LP of early-maturity upland cotton.
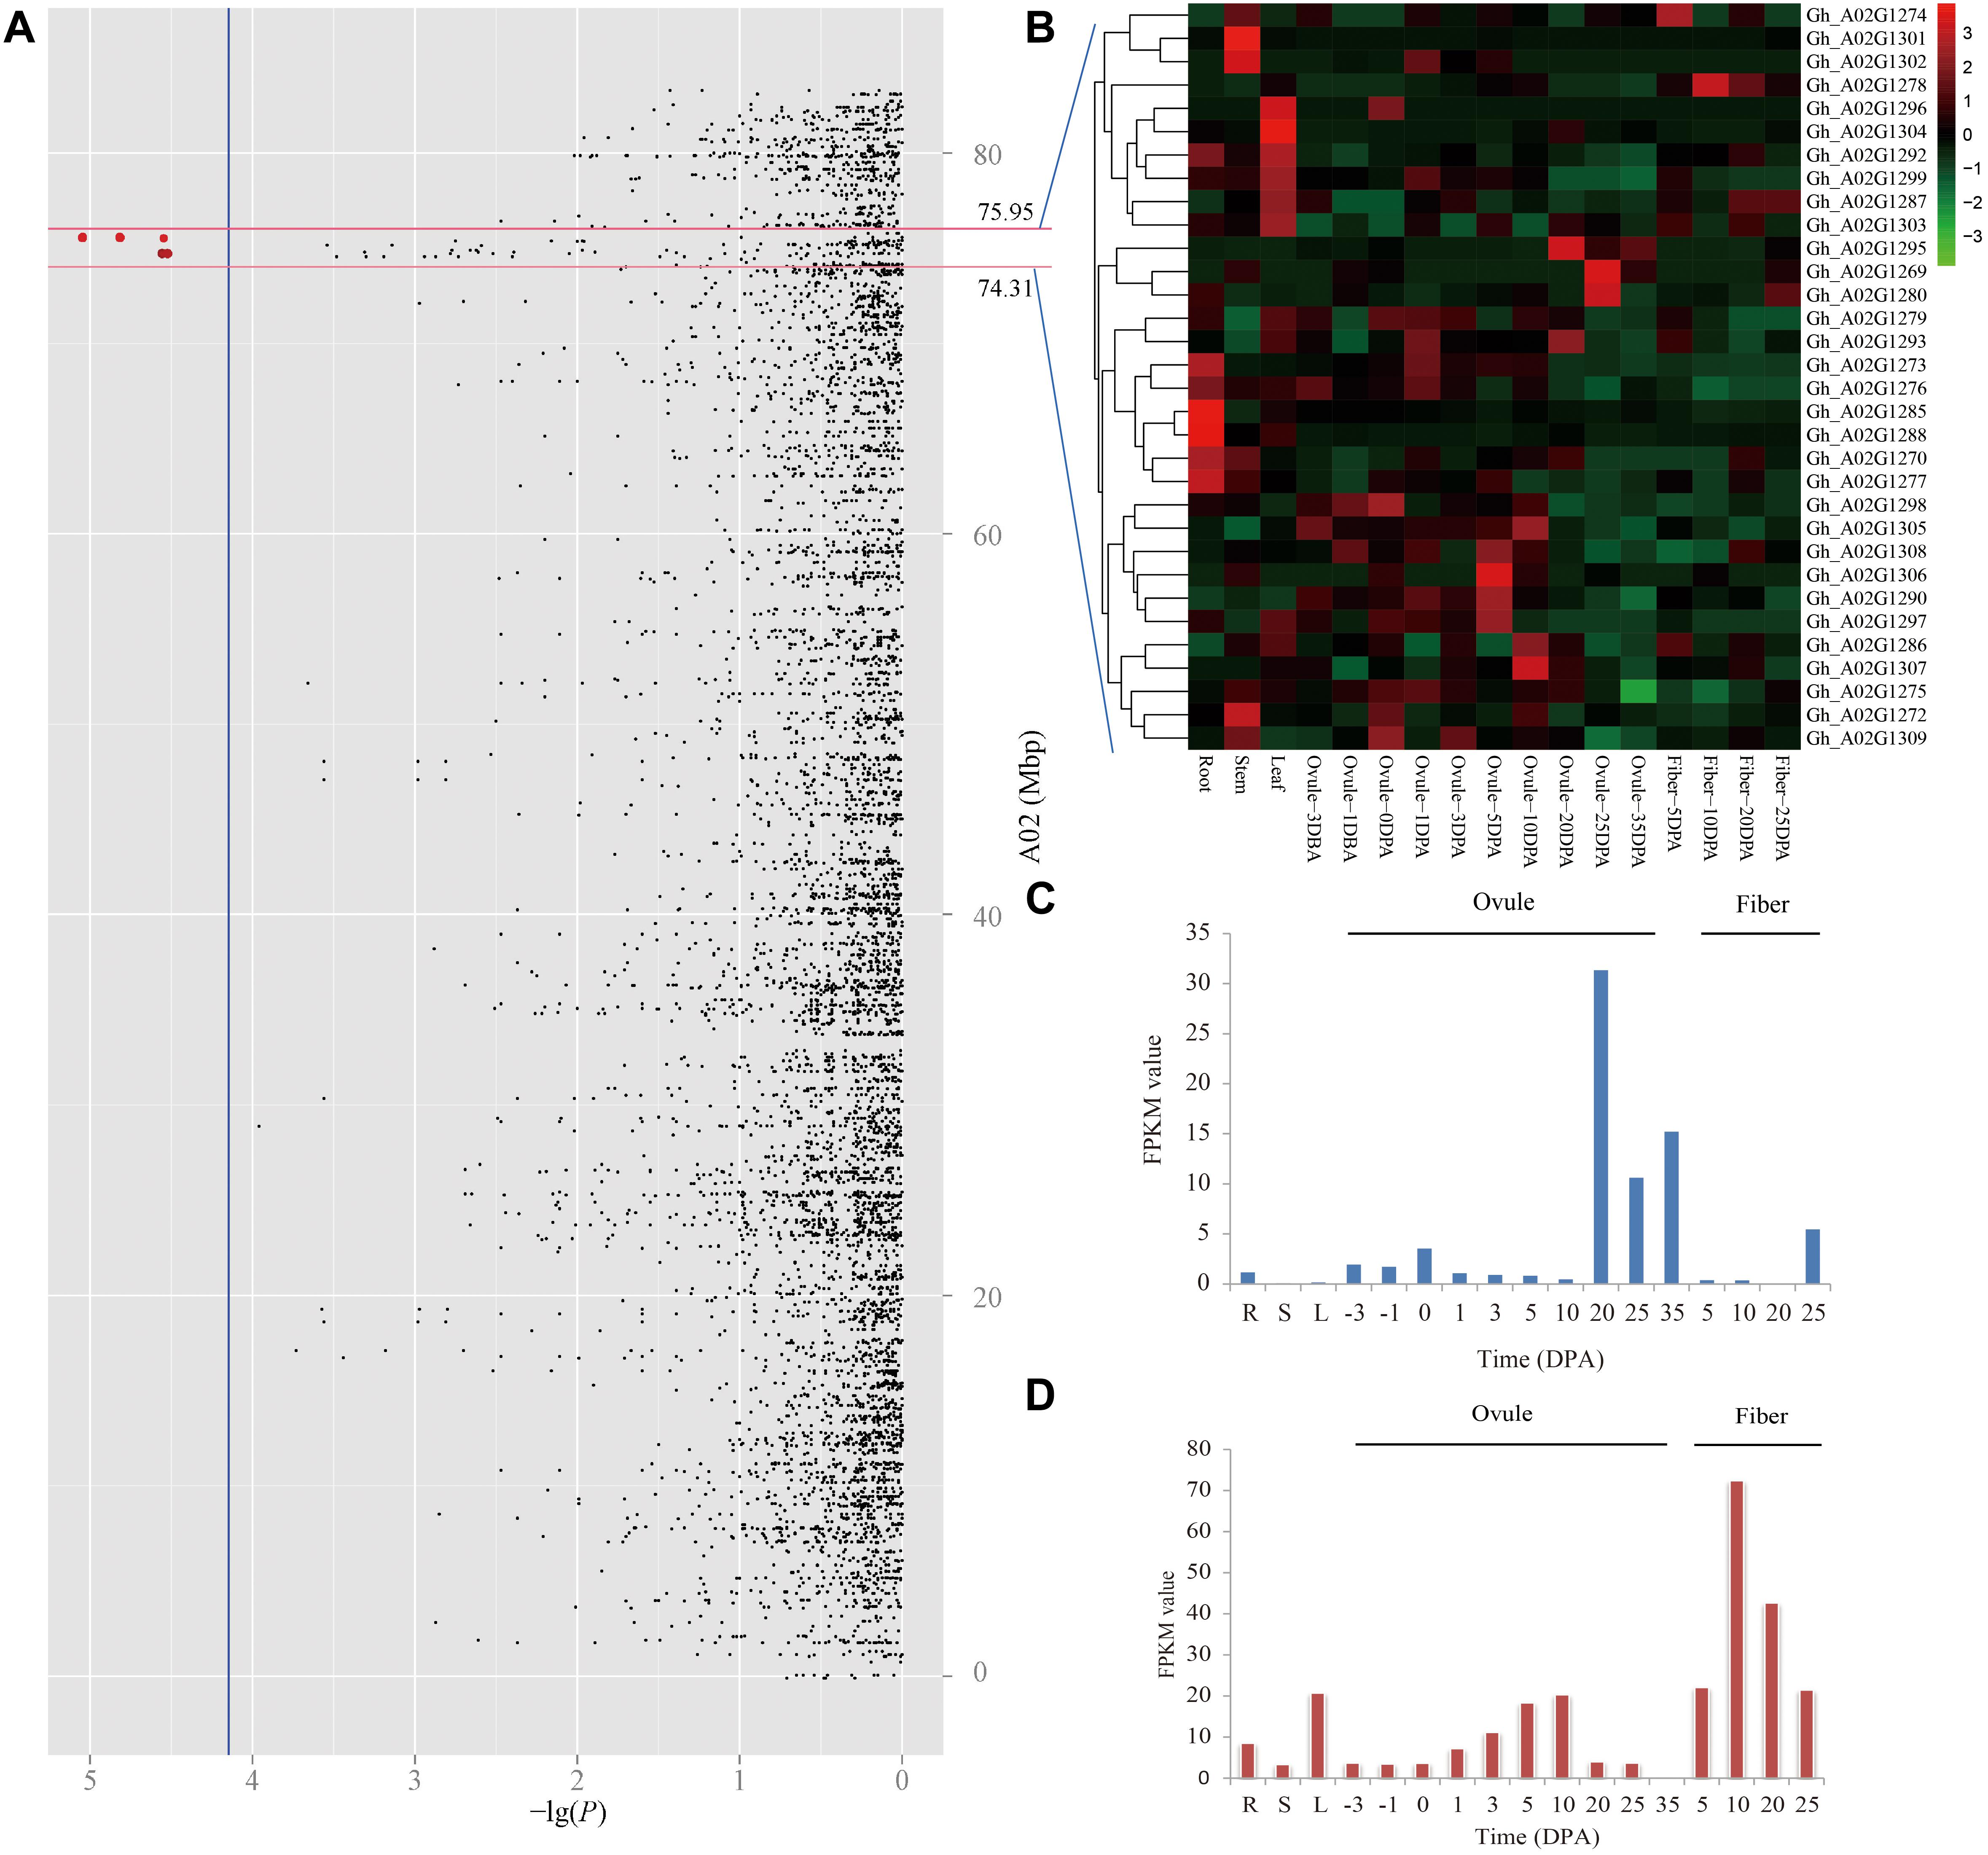
Figure 4. Prediction of candidate genes for of lint percentage (LP). (A) Manhattan plots for LP on chromosome A02, the red dots indicates two peak QTNs (A02_74713290 and A02_75551547) which were detected by using SL-GWAS methods in the different planting environments. (B) Heatmap of expression level of 32 genes among 17 upland cotton tissues, the red represents high expression, and the green shows low expression. Expression levels of Gh_A02G1295 (C) and Gh_A02G1278 (D) in different tissues, including the root (R), stem (S), and leaf (L), in ovule- and fiber-development stages based on the FPKM value.
For the above four potential candidate genes for LP, their biological functions were annotated through bioinformatics analyses and GO items (Table 4). Three of them had explicit annotation about their biological functions in Arabidopsis. Gh_A02G1269 is homologous to Arabidopsis AT4G13830, which encodes chaperone protein dnaJ 20, a key regulator of isopentenyl diphosphate biosynthetic process (Banerjee et al., 2013). Gh_A02G1278 is the homologous to Arabidopsis AT1G15100, which encodes E3 ubiquitin-protein ligase RHA2A, involved in the positive regulation of abscisic acid (ABA) signaling and responses to salt and osmotic stresses during seed germination and early seedling development (Bu et al., 2009). Gh_A02G1295 is homologous to Arabidopsis AT5G09970 which is annotated as a cytochrome P450 gene involved in multicellular organism development, oxidation-reduction process, regulation of growth, and regulation of meristem growth. In Arabidopsis, its ortholog CYP78A5 plays a role in regulating relative growth of the shoot apical meristem and plant organs via a non-cell-autonomous signal (Wang et al., 2008). The possible biological functions of the genes provided some useful information for confirming their effects for cotton LP.
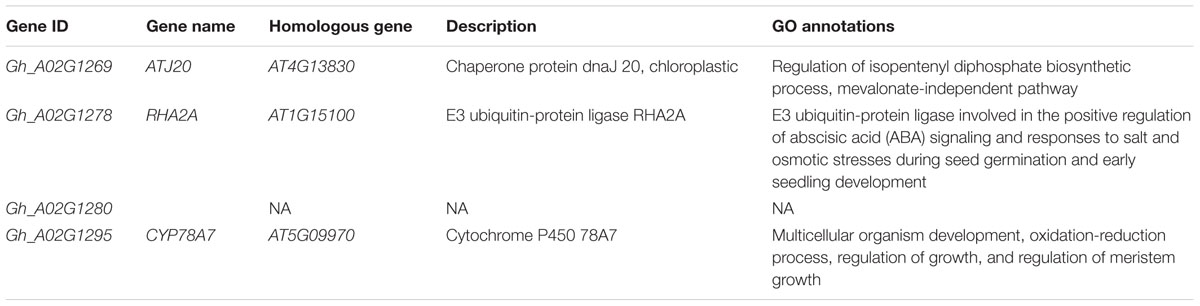
Table 4. The biological function annotations of four potential candidate genes for LP.
With the rapid development of high-throughput sequencing and molecular quantitative genetics, many GWAS methods have appeared for the genetic decryption of complex quantitative traits in plants (Feng et al., 2016). However, the SL-GWAS analysis approaches, which based on a fixed-SNP-effect MLM were mainly applied in the previous studies. Due to the stringent P threshold of SL-GWAS (P = 0.05/n, n is the total number of SNPs), some crucial QTNs might be lost in MLM, particularly small-effect QTNs (Wang et al., 2016). Although usage of high and stringent thresholds can reduce false positive rates, it results in missing some associated QTNs. In the recent 10 years, some multi-locus models, such as Bayesian LASSO (Yi and Xu, 2008), penalized Logistic regression (Hoggart et al., 2008), and EBAYES LASSO (Wen et al., 2015), had emerged for improving the efficiency of QTN detection. An obvious merit of these multi-locus models is that Bonferroni correction is not required and more QTNs can be detected than single-locus models. In particular, six recently developed ML-GWAS models including mrMLM (Wang et al., 2016), ISIS EM-BLASSO (Tamba et al., 2017), FASTmrEMMA (Wen et al., 2018), pLARmEB (Zhang et al., 2017), FASTmrMLM (Tamba and Zhang, 2018), and pKWmEB (Ren et al., 2018), have been proved to have more advantages for QTL detection than the single-locus methods. Some of these ML-GWAS models had been applied in rice (Cui et al., 2018), maize (Xu et al., 2018), wheat (Peng et al., 2018), cotton (Li et al., 2018; Su et al., 2018), soybean (Zhang et al., 2018), and barley (Hu et al., 2018). As the heredity of quantitative traits is complex and the number of SNPs is huge, it is better to simultaneously use multiple methods for GWAS. Therefore, to detect the stable and dependable QTNs, it is a requirement for combination of the SL- and ML-GWAS methods. Several examples can be found in recent studies. A total of 342 QTNs controlling fiber quality traits were detected via three SL-GWAS and three ML-GWAS models in upland cotton (Li et al., 2018). In addition, one single-locus method (GEMMA) and three multi-locus methods (FASTmrEMMA, FarmCPU, and LASSO) were used and 60 QTNs for starch pasting properties were identified by GWAS in maize (Xu et al., 2018). In the study, four significant QTNs were identified by single-locus model in the looser P threshold of SL-GWAS (P = 5/the total number of SNPs); meanwhile, applying six multi-locus models (mrMLM, FASTmrEMMA, pLARmEB, ISIS EM-BLASSO, pKWmEB, and FASTmrMLM), a total of 11 significant QTNs were simultaneously found to be associated with LP by at least three ML-GWAS methods. This study showed that more QTNs were detected using multi-locus models than using single-locus models, and these two major LP-QTNs with the highest -lgP value and a large explanation of the total phenotypic variance were simultaneously identified in both single- and multi-locus models. Our findings also demonstrated that employing integrated SL- and ML-GWAS models, led to improving power and accuracy levels for QTN detections.
In China, early-maturity upland cotton is more suitable for the high-profit production based on mechanical harvesting and double cropping. Thus, it becomes increasingly necessary for cotton producers (Su et al., 2018). But the trouble is that lint yield per plant of early-maturity varieties is strikingly lower than that of middle- and late-maturity ones. Although lint yield of early-maturity cotton can be improved by increasing the boll number per unit area at high-density planting, excellent varieties are beneficial to improving lint yield. In three main components of lint yield, LP has a high heritability and stability (Su et al., 2016a). Hence, it is extraordinarily vital for high-yield breeding programs to dissect the genetic basis controlling cotton LP by GWAS. In the previous studies, some GWAS of upland cotton accessions, based on the next-generation genome sequencing and SNP arrays, had been performed (Fang et al., 2017; Huang et al., 2017; Ma et al., 2018, 2019). The LP-QTNs, such as A02:79153947 and D08:3040023 (Fang et al., 2017), D08: 63485399 and D08: 63648326 (Huang et al., 2017), D02:131937, D02:132520, and D02:133540 (Ma et al., 2018), and D02:2254167 (Ma et al., 2019), were detected via GWAS (Table 5). In these investigations, the different QTNs have been identified to be associated with LP by using the varying association panels, and these SNP loci are primarily distributed on chromosomes A02, D02, and D08. In our study, two main-effect LP-QTNs A02_74713290 and A02_75551547 were identified in the panel consisting of 160 early-maturity upland cotton accessions via SL- and ML- GWAS, and these two QTNs also were positioned on chromosome A02. It was believed that A02_74713290 and A02_75551547 were reliable and stable QTNs for LP because they could be simultaneously presented in two or more planting environments and by multiple GWAS methods. Compared with those of previous GWAS results, we thought two significant QTNs (A02_74713290 and A02_75551547), which were detected in early-maturity upland cotton, may be two novel QTNs for LP.
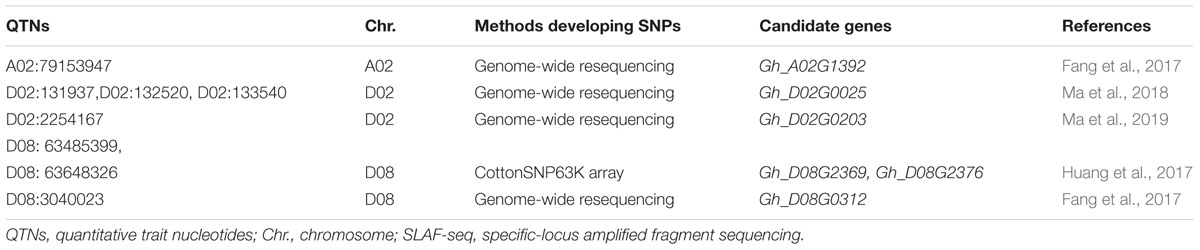
Table 5. Results of the LP-QTNs identified via GWAS in previous studies.
Similarly, some potential candidate genes for LP had been forecasted in the adjacent region of the peak SNPs in this study. The four potential candidate genes were predicted in the adjacent region of the two major QTNs (A02_74713290 and A02_75551547) and they were specially and highly expressed in ovules or fibers. We suggested that these genes might be closely related to cotton LP by regulating the proportion of seed weight and fiber yield. Of these four candidate genes, Gh_A02G1295 is annotated as cytochrome P450 or CYP78A7. Its homologous genes caused a shortening of the plastochron in Arabidopsis (ALTERED MERISTEM PROGRAM1, AMP1) (Conway and Poethig, 1997), rice (PLASTOCHRON1, PLA1) (Itoh et al., 1998), and maize (TERMINAL EAR1, TE1) (Veit et al., 1998). Other studies demonstrated that AMP1 orthologs CYP78A5 and CYP78A7 affect plastochron length and cell division rate and meristem size (Wang et al., 2008). Hence, we speculated that the candidate gene Gh_A02G1295 might decrease LP of early-maturity upland cotton by increasing cell division rate and meristem size of ovule during seed development from 20 to 25 DPA. Even so, the biological function confirmation of these candidate genes is required in future studies.
In the study, SL- and ML-GWAS methods were used to identify QTNs associated with LP in early-maturity upland cotton. We identified 4 and 45 QTNs associated significantly with LP via one single-locus method and six multi-locus methods. Two of these QTNs (A02_74713290 and A02_75551547) were simultaneously found via both one SL-GWAS and there or more ML-GWAS methods. Four potential candidate genes (Gh_A02G1269, Gh_A02G1278, Gh_A02G1280, and Gh_A02G1295) were predicted by RNA-seq in the flanking region of these two peak QTNs. The findings demonstrated that the detected QTNs and candidate genes might be closely related to LP of early-maturity cotton, and that a comprehensive application of SL- and ML-GWAS methods could help improve the detection power and accuracy. The QTNs and candidate genes for LP identified in this study have laid a foundation for cultivating novel cotton varieties with earliness and high lint yield in the future.
The SLAF-seq datasets for the early-maturity upland cotton lines are available in the Sequence Read Archive (http://www. ncbi.nlm.nih.gov/bioproject/PRJNA314284/) (SRP071133 under the accession number: PRJNA314284).
JS and XN designed the research program. JS, CW, and JW analyzed the data and conducted the GWAS. JS, JL, and XN performed the field trial to identify the traits. JS and FH wrote the manuscript. All authors read and approved the manuscript.
This work was funded by the National Key Research and Development Program of China (2017YFD0101603) and the Science and Technology Innovation Funds of Gansu Agricultural University [scientific research start-up funds for openly-recuited doctors (GAU-KYQD-2018-01) and special funds for discipline construction (GAU-XKJS-2019)].
The authors declare that the research was conducted in the absence of any commercial or financial relationships that could be construed as a potential conflict of interest.
The Supplementary Material for this article can be found online at: https://www.frontiersin.org/articles/10.3389/fpls.2019.00964/full#supplementary-material
ANOVA, analysis of variance; AY, Anyang; BW, boll weight; CV, coefficients of variance; DPA, days post anthesis; FPKM, fragments per kilobase of transcript per million fragments mapped reads; GO, gene ontology; GWAS, genome-wide association study; LD, linkage disequilibrium; LP, lint percentage; LW, lint weight; MAF, minor allele frequency; ML-GWAS, multi-locus GWAS; MLM, mixed linear model; NSEMR, Northern Specific Early-Maturity Region; NIR, Northwest Inland Region; QTL, quantitative trait loci; QTNs, quantitative trait nucleotides; SHZ, Shihezi; SLAF-seq, specific-locus amplified fragment sequencing; SNP, single nucleotide polymorphism; SL-GWAS, single-locus GWAS; YRR, Yellow River Region.
Abdurakhmonov, I. Y., Buriev, Z. T., Saha, S., Pepper, A. E., Musaev, J. A., Almatov, A., et al. (2007). Microsatellite markers associated with lint percentage trait in cotton, Gossypium hirsutum. Euphytica 156, 141–156. doi: 10.1007/s10681-007-9361-2
Banerjee, A., Wu, Y., Banerjee, R., Li, Y., Yan, H. G., and Sharkey, T. D. (2013). Feedback inhibition of deoxy-D-xylulose-5-phosphate synthase regulates the methylerythritol 4-phosphate pathway. J. Biol. Chem. 288, 16926–16936. doi: 10.1074/jbc.m113.464636
Bradbury, P. J., Zhang, Z. W., Kroon, D. E., Casstevens, T. M., Ramdoss, Y., and Buckler, E. S. (2007). TASSEL: software for association mapping of complex traits in diverse samples. Bioinformatics 23, 2633–2635. doi: 10.1093/bioinformatics/btm308
Bu, Q. Y., Li, H. M., Zha, Q. Z., Jiang, H. L., Zhai, Q. Z., Zhang, J., et al. (2009). The Arabidopsis RING finger E3 ligase RHA2a is a novel positive regulator of abscisic acid signaling during seed germination and early seedling development. Plant Physiol. 150, 463–481. doi: 10.1104/pp.109.135269
Conway, L. J., and Poethig, R. S. (1997). Mutations of Arabidopsis thaliana that transform leaves into cotyledons. Proc. Natl. Acad. Sci. U.S.A. 94, 10209–10214. doi: 10.2307/43185
Cui, Y. R., Zhang, F., and Zhou, Y. L. (2018). The application of multi-Locus GWAS for the detection of salt-tolerance loci in rice. Front. Plant Sci. 9:1464. doi: 10.3389/fpls.2018.01464
Dai, J. L., and Dong, H. Z. (2014). Intensive cotton farming technologies in China: achievements, challenges and countermeasures. Field Crop. Res. 155, 99–110. doi: 10.1016/j.fcr.2013.09.017
Fan, S. L., Yu, S. X., Song, M. Z., and Yuan, R. H. (2006). Construction of molecular linkage map and QTL mapping for earliness in short-season cotton. Cotton Sci. 18, 135–139. doi: 10.3969/j.issn.1002-7807.2006.03.002
Fang, L., Wang, Q., Hu, Y., Jia, Y. H., Chen, J. D., Liu, B. L., et al. (2017). Genomic analyses in cotton identify signatures of selection and loci associated with fiber quality and yield traits. Nat. Genet. 49, 1089–1098. doi: 10.1038/ng.3887
Feng, J. Y., Wen, Y. J., Zhang, J., and Zhang, Y. M. (2016). Advances on methodologies for genome-wide association studies in plants. Acta Agron. Sin. 42:945. doi: 10.3724/SP.J.1006.2016.00945
Feng, L., Dai, J. L., Tian, L. W., Zhang, H. J., Li, W. J., and Dong, H. Z. (2017). Review of the technology for high-yielding and efficient cotton cultivation in the northwest inland cotton-growing region of China. Field Crop. Res. 208, 18–26. doi: 10.1016/j.fcr.2017.03.008
Gwathmey, C. O., Bange, M. P., and Brodrick, R. (2016). Cotton crop maturity: a compendium of measures and predictors. Field Crop. Res. 191, 41–53. doi: 10.1016/j.fcr.2016.01.002
Hoggart, C. J., Whittaker, J. C., Iorio, M. D., and Balding, D. J. (2008). Simultaneous analysis of all SNPs in genome-wide and re-sequencing association studies. Plos Genetics. 4:e1000130. doi: 10.1371/journal.pgen.1000130
Hou, S., Zhu, G. Z., Li, Y., Li, W. X., Fu, J., Niu, E. L., et al. (2018). Genome-wide association studies reveal genetic variation and candidate genes of drought stress related traits in cotton (Gossypium hirsutum L). Front. Plant Sci. 9:1276. doi: 10.3389/fpls.2018.01276
Hu, X., Zuo, J. F., Wang, J. B., Liu, L. P., Sun, G. L., Li, C. D., et al. (2018). Multi-locus genome-wide association studies for 14 main agronomic traits in barley. Front. Plant Sci. 9:1683. doi: 10.3389/fpls.2018.01683
Huang, C., Nie, X. H., Shen, C., You, C. Y., Li, W., Zhao, W. X., et al. (2017). Population structure and genetic basis of the agronomic traits of upland cotton in China revealed by a genome-wide association study using high-density SNPs. Plant Biotechnol. J. 15, 1374–1386. doi: 10.1111/pbi.12722
Itoh, J. I., Hasegawa, A., Kitano, H., and Nagato, Y. (1998). A recessive heterochronic mutation, plastochron1, shortens the plastochron and elongates the vegetative phase in rice. Plant Cell 10, 1511–1522. doi: 10.2307/3870615
Li, C. Q., Fu, Y. Z., Sun, R. R., Wang, Y. Y., and Wang, Q. L. (2018). Single-locus and multi-mocus genome-wide association studies in the genetic dissection of fiber quality traits in Upland cotton (Gossypium hirsutum L). Front. Plant Sci. 9:1083. doi: 10.3389/fpls.2018.01083
Liu, R. Z., Wang, B. H., Guo, W. Z., Qin, Y. S., Wang, L. G., Zhang, Y. M., et al. (2012). Quantitative trait loci mapping for yield and its components by using two immortalized populations of a heterotic hybrid in Gossypium hirsutum L. Mol. Breeding. 29, 297–311. doi: 10.1007/s11032-011-9547-0
Ma, X., Wang, Z., Li, W., Zhang, Y., Zhou, X., Liu, Y., et al. (2019). Resequencing core accessions of a pedigree identifies derivation of genomic segments and key agronomic trait loci during cotton improvement. Plant Biotechnol. J. 17, 762–775. doi: 10.1111/pbi.13013
Ma, Z., He, S., Wang, X., Sun, J., Zhang, Y., Zhang, G., et al. (2018). Resequencing a core collection of upland cotton identifies genomic variation and loci influencing fiber quality and yield. Nat. Genet. 50, 803–813. doi: 10.1038/s41588-018-0119-7
Peng, Y. C., Liu, H. B., Chen, J., Shi, T. T., Zhang, C., Sun, D. F., et al. (2018). Genome-wide association studies of free amino acid levels by six multi-locus models in bread wheat. Front. Plant Sci. 9:1196. doi: 10.3389/fpls.2018.01196
Ren, W. L., Wen, Y. J., Dunwell, J. M., and Zhang, Y. M. (2018). pKWmEB: integration of Kruskal-Wallis test with empirical Bayes under polygenic background control for multi-locus genome-wide association study. Heredity 120, 208–218. doi: 10.1038/s41437-017-0007-4
Shen, X. L., Guo, W. Z., Lu, Q. X., Zhu, X. F., Yuan, Y. L., and Zhang, T. Z. (2007). Genetic mapping of quantitative trait loci for fiber quality and yield trait by RIL approach in Upland cotton. Euphytica 155, 371–380. doi: 10.1007/s10681-006-9338-6
Song, M. Z., Fan, S. L., Pang, C. Y., Wei, H. L., Liu, J., and Yu, S. X. (2015). Genetic analysis of fiber quality traits in short season cotton (Gossypium hirsutum L). Euphytica 202, 97–108. doi: 10.1007/s10681-014-1226-x
Song, M. Z., Yu, S. X., Fan, S. L., Ruan, R. H., and Huang, Z. M. (2005). Genetic analysis of main agronomic traits in short season Upland cotton (G.hirsutum L). Acta Gossypii Sinica 17, 94–98.
Su, J. J., Fan, S. L., Li, L. B., Wei, H. L., Wang, C. X., Wang, H. T., et al. (2016a). Detection of favorable QTL alleles and candidate genes for lint percentage by GWAS in Chinese Upland cotton. Front. Plant Sci. 7:1576. doi: 10.3389/fpls.2016.01576
Su, J. J., Pang, C. Y., Wei, H. L., Li, L. B., Liang, B., Wang, C. X., et al. (2016b). Identification of favorable SNP alleles and candidate genes for traits related to early maturity via GWAS in Upland cotton. BMC Genom. 17:687. doi: 10.1186/s12864-016-2875-z
Su, J. J., Ma, Q., Li, M., Hao, F. S., and Wang, C. X. (2018). Multi-locus genome-wide association studies of fiber-quality related traits in Chinese early-maturity Upland cotton. Front. Plant Sci. 9:1169. doi: 10.3389/fpls.2018.01169
Tamba, C. L., Ni, Y. L., and Zhang, Y. M. (2017). Iterative sure independence screening EM-Bayesian LASSO algorithm for multi-locus genome-wide association studies. PloS Comput. Biol. 13:e1005357. doi: 10.1371/journal.pcbi.1005357
Tamba, C. L., and Zhang, Y. M. (2018). A fast mrMLM algorithm for multi-locus genome-wide association studies. bioRxiv
Veit, B., Briggs, S. P., Schmidt, R. J., Yanofsky, M. F., and Hake, S. (1998). Regulation of leaf initiation by the terminal ear1 gene of maize. Nature 393, 166–168. doi: 10.1038/30239
Wang, J. W., Schwab, R., Czech, B., Mica, E., and Weigel, D. (2008). Dual effects of miR156-Targeted SPL genes and CYP78A5/KLUH on plastochron length and organ size in Arabidopsis thaliana. Plant Cell 20, 1231–1243. doi: 10.1105/tpc.108.058180
Wang, M., Li, C. Q., and Wang, Q. L. (2014). Quantitative trait loci mapping and genetic dissection for lint percentage in Upland cotton (Gossypium hirsutum). J. Genet. 93, 371–378. doi: 10.1007/s12041-014-0385-9
Wang, S. B., Feng, J. Y., Ren, W. L., Huang, B., Zhou, L., Wen, Y. J., et al. (2016). Improving power and accuracy of genome-wide association studies via a multi-locus mixed linear model methodology. Sci. Rep. 166:19444. doi: 10.1038/srep19444
Wen, J., Zhao, X. W., Wu, G. R., Xiang, D., Liu, Q., Bu, S. H., et al. (2015). Genetic dissection of heterosis using epistatic association mapping in a partial NCII mating design. Sci. Rep. 5:18376. doi: 10.1038/srep18376
Wen, Y. J., Zhang, H., Ni, Y. L., Huang, B., Zhang, J., Feng, J. Y., et al. (2018). Methodological implementation of mixed linear models in multi-locus genome-wide association studies. Brief. Bioinform. 19, 700–712. doi: 10.1093/bib/bbw145
Xu, Y., Yang, T. T., Zhou, Y., Yin, S. Y., Li, P. C., Liu, J., et al. (2018). Genome-wide association mapping of starch pasting properties in maize using single-locus and multi-locus models. Front. Plant Sci. 9:1311. doi: 10.3389/fpls.2018.01311
Yi, N. J., and Xu, S. Z. (2008). Bayesian LASSO for quantitative trait loci mapping. Genetics 179, 1045–1055. doi: 10.1534/genetics.107.085589
Yu, J. W., Zhang, K., Li, S. Y., Yu, S. X., Zhai, H. H., Wu, M., et al. (2013). Mapping quantitative trait loci for lint yield and fiber quality across environments in a Gossypium hirsutum × Gossypium barbadense backcross inbred line population. Theor. Appl. Genet. 126, 275–287. doi: 10.1007/s00122-012-1980-x
Yu, S. X., Song, M. Z., Fan, S. L., Wang, W., and Yuan, R. H. (2005). Biochemical genetics of short-season cotton cultivars that express early maturity without senescence. J. Integr. Plant Biol. 47, 334–342. doi: 10.1111/j.1744-7909.2005.00029.x
Zhang, J., Feng, J. Y., Ni, Y. L., Wen, Y. J., Niu, Y., Tamba, C. L., et al. (2017). pLARmEB: integration of least angle regression with empirical Bayes for multilocus genome-wide association studies. Heredity 118, 517–524. doi: 10.1038/hdy.2017.8
Zhang, K. X., Liu, S. L., Li, W., Liu, S. P., Li, X. Y., Fang, Y. L., et al. (2018). Identification of QTNs controlling seed protein content in soybean using multi-locus genome-wide association studies. Front. Plant Sci. 9:1690. doi: 10.3389/fpls.2018.01690
Zhang, T. Z., Hu, Y., Jiang, W. K., Fang, L., Guan, X. Y., Chen, J. D., et al. (2015). Sequencing of allotetraploid cotton (Gossypium hirsutum L. acc. TM-1) provides a resource for fiber improvement. Nat. Biotechnol. 33, 531–537. doi: 10.1038/nbt.3207
Keywords: upland cotton, lint percentage, early maturity, genome-wide association studies, quantitative trait nucleotides, candidate genes
Citation: Su J, Wang C, Hao F, Ma Q, Wang J, Li J and Ning X (2019) Genetic Detection of Lint Percentage Applying Single-Locus and Multi-Locus Genome-Wide Association Studies in Chinese Early-Maturity Upland Cotton. Front. Plant Sci. 10:964. doi: 10.3389/fpls.2019.00964
Received: 04 April 2019; Accepted: 10 July 2019;
Published: 02 August 2019.
Edited by:
Yuan-Ming Zhang, Huazhong Agricultural University, ChinaReviewed by:
Chengqi Li, Henan Institute of Science and Technology, ChinaCopyright © 2019 Su, Wang, Hao, Ma, Wang, Li and Ning. This is an open-access article distributed under the terms of the Creative Commons Attribution License (CC BY). The use, distribution or reproduction in other forums is permitted, provided the original author(s) and the copyright owner(s) are credited and that the original publication in this journal is cited, in accordance with accepted academic practice. No use, distribution or reproduction is permitted which does not comply with these terms.
*Correspondence: Junji Su, eGpua3lzdWpqMTk4MEAxNjMuY29t; Jilian Li, bGlqaWxpYW5Ac29odS5jb20=; Xinzhu Ning, bmluZ3h6QHNvaHUuY29t
Disclaimer: All claims expressed in this article are solely those of the authors and do not necessarily represent those of their affiliated organizations, or those of the publisher, the editors and the reviewers. Any product that may be evaluated in this article or claim that may be made by its manufacturer is not guaranteed or endorsed by the publisher.
Research integrity at Frontiers
Learn more about the work of our research integrity team to safeguard the quality of each article we publish.