 Atena Oladzad1*
 Kimberly Zitnick-Anderson2
 Shalu Jain2
 Kristin Simons1,2
 Juan M. Osorno1
 Phillip E. McClean1
 Julie S. Pasche2*
- 1Department of Plant Sciences, North Dakota State University, Fargo, ND, United States
- 2Department of Plant Pathology, North Dakota State University, Fargo, ND, United States
Rhizoctonia solani Kühn (teleomorph Thanatephorus cucumeris) is an important root rot pathogen of common bean (Phaseolus vulgaris L.). To uncover genetic factors associated with resistance to the pathogen, the Andean (ADP; n = 273) and Middle American (MDP; n = 279) diversity panels, which represent much of the genetic diversity known in cultivated common bean, were screened in the greenhouse using R. solani anastomosis group 2-2. Repeatability of the assay was confirmed by the response of five control genotypes. The phenotypic data for both panels were normally distributed. The resistance responses of ∼10% of the ADP (n = 28) and ∼6% of the MDP (n = 18) genotypes were similar or higher than that of the resistant control line VAX 3. A genome-wide association study (GWAS) was performed using ∼200k single nucleotide polymorphisms to discover genomic regions associated with resistance in each panel, For GWAS, the raw phenotypic score, and polynomial and binary transformation of the scores, were individually used as the input data. A major QTL peak was observed on Pv02 in the ADP, while a major QTL was observed on Pv01 with the MDP. These regions were associated with clusters of TIR-NB_ARC-LRR (TNL) gene models encoding proteins similar to known disease resistance genes. Other QTL, unique to each panel, were mapped within or adjacent to a gene model or cluster of related genes associated with disease resistance. This is a first case study that provides evidence for major as well as minor genes involved in resistance to R. solani in common bean. This information will be useful to integrate more durable root rot resistance in common bean breeding programs and to study the genetic mechanisms associated with root diseases in this important societal legume.
Introduction
Common bean (Phaseolus vulgaris L.) is one of the most important cultivated grain legumes for human consumption in the world (United States Dry Bean Council, 2017). Cultivated common bean evolved from two major wild genepools, Middle American and Andean, which were established in Mexico ∼110 kyr ago (Mamidi et al., 2011; Bitocchi et al., 2013; Schmutz et al., 2014). Differences between the two genepools include plant and seed morphology, mineral content, responses to diseases, and DNA polymorphisms (Gepts et al., 1986; Blair et al., 2006, 2009). The cultivated genotypes of the two genepools are further divided into races based on morphological, agronomical, and molecular differences (Singh et al., 1991). The Middle American genepool consists of four races: Durango, Jalisco, Mesoamerican, and Guatemala (Singh et al., 1991; Beebe et al., 2001; Blair et al., 2009). The Andean genepool is divided into three races including Nueva Granada, Peru, and Chile (Singh et al., 1991). Middle American beans are primarily grown from North America, through Central America, and into northern South America. These include the pinto, navy, great northern, black, and small red beans market classes. Kidney beans, from race Nueva Granada of the Andean gene pool, are also prevalent in the US (United States Dry Bean Council, 2017) and Africa. Collections of 396 and 280 P. vulgaris accessions, referred as the Andean Diversity Panel (ADP; Cichy et al., 2015) and Middle American Diversity Panel (MDP; Moghaddam et al., 2016), were created to reflect the genetic diversity in the two major gene pools and facilitate gene pool specific genetic analyses.
The genetic diversity present in both gene pools can be useful to identify potential sources of resistance against the basidiomycete pathogen Rhizoctonia solani. R. solani is a global soil-borne pathogen that has a broad host range including rice, ginger, corn, sugar beet, cauliflower, pine, common bean, soybean, alfalfa, tomato, potato, onion, snap bean, cotton, and peas (Anderson, 1982; Sneh et al., 1991; Pannecoucque and Hofte, 2009; Bolton et al., 2010). R. solani is not a true species but rather a species complex comprised of 15 anastomosis groups (AGs) (Carling et al., 2002; Stodart et al., 2007; Bolton et al., 2010). The 15 AGs are defined by morphology, pathogenicity, virulence, DNA polymorphisms, and their ability to anastomose (Carling et al., 2002; Stodart et al., 2007; Bolton et al., 2010). Hyphal anastomosis, a genetically controlled event between compatible genotypes, involves fusion of hyphal tips from distinct individuals and subsequent successful hyphal growth. The two most frequently isolated AGs from crops grown in the Northern Great Plains region of the US are AG 2-2 and AG 4. AG 2-2 is the most aggressive on common bean (Engelkes and Windels, 1996; Mathew et al., 2012).
Rhizoctonia solani severely impacts seed yield of common bean, resulting in upwards to 100% seed yield loss (Hagedorn, 1994; Singh and Schwartz, 2010). Root symptoms caused by R. solani include sunken, water-soaked, reddish-brown lesions with a range of sizes resulting in pre-emergence damping off of seedlings (Reddy et al., 1993; Hagedorn, 1994). When the disease is severe, stunting and premature plant death can occur. Although R. solani spreads via airborne basidiospores when the teleomorph (sexual) stage is present, this is uncommon in the field (Godoy-Lutz et al., 2003). Vegetative mycelia and sclerotia of the asexual stage colonize the soil environment and can overwinter in the soil for several years (Godoy-Lutz et al., 2003). Soil-borne R. solani spreads from plant to plant through the formation of mycelial bridges between plant roots and infested soil debris.
Genetic resistance is considered the most cost effective and sustainable management of root rots in common bean (Tu, 1992; Park and Rupert, 2000; Abawi et al., 2006). However, genetic analysis of resistance to R. solani in common bean has been limited (Muyolo et al., 1993; Peña et al., 2013; Conner et al., 2014; Adesemoye et al., 2018). Field studies are challenging because of the presence of more than one soil-borne root pathogen (Conner et al., 2014). Greenhouse studies were carried out to discover resistant genotypes (Muyolo et al., 1993; Peña et al., 2013; Adesemoye et al., 2018) but were not followed up by genetic analysis. While these studies provided valuable information, wide-scale resistance screening across the full range of cultivated genotypes, such as those comprising the ADP and MDP, have not been completed.
Genetic resistance to R. solani is quantitative in nature (Zhao et al., 2005). While environmental factors can greatly affect phenotypic responses, it is notoriously difficult to screen for resistance to soil-borne pathogens due to the struggle of maintaining constant moisture and temperatures within a soil environment. Therefore, to obtain consistent and reproducible phenotypic data for a set of test genotypes, the screening protocol for root rot pathogens must generate predictable reactions to the pathogen from a set of control lines expressing variable levels of resistance.
The development of reference genome sequences and single nucleotide polymorphism (SNP) marker technology has rapidly improved our understanding of the genetics and molecular mechanisms associated with resistance to plant pathogens. One approach is to compare the frequency of the genetic variants across the genome in a large number of resistance and susceptible genotypes and identify the alleles correlated with each haplotype (Koboldt et al., 2013). Genome-wide association studies (GWASs) utilize linkage disequilibrium (LD) along with knowledge of the structure of a given population to discover important genetic factors. Large and highly diverse association panels have unique recombination histories enabling the detection of large and small genetic effects associated with response of the host to a pathogen. GWAS analyses are emerging as a method to discover disease resistance loci in common bean (Shi et al., 2011; Hart and Griffiths, 2015; Perseguini et al., 2016; Zuiderveen et al., 2016; Tock et al., 2017). To date, the GWAS studies aimed at discovering loci associated with resistance to root pathogens in common bean has been limited to F. solani in the ADP and to a lesser extent Pythium spp. (Vasquez-Guzman, 2016; Soltani et al., 2018). The focus here is to dissect the genetic architecture of resistance to R. solani in common bean independently in the two major gene pools of common bean using a GWAS approach.
From an analytical perspective, the root rot phenotype is scored quantitatively (Park and Rupert, 2000; Román-Avilés and Kelly, 2005; Conner et al., 2014; Hagerty et al., 2015). However, in breeding programs, after evaluations of the phenotypic scores of the pre-breeding lines, breeders usually classify lines categorically as resistant, moderately resistant, or susceptible. This approach effectively transforms the quantitative phenotype data into a qualitative phenotype. One feature of this study is to determine if quantitative and qualitative phenotypic data detect the same or different genomic regions associated with the disease. Here, we address this question by applying GEMMA (Zhou and Stephens, 2012, 2014) algorithms on the raw phenotypic score, and transformations of the scores into polynomial and binary scores. The advantage of using the GEMMA package is that it performs GWAS for any phenotypic distributions by performing a generalized linear model instead of general linear model. In the generalized linear model, the associated p-value for each marker is based on the likelihood changes when a single marker is added to the model and therefore, it is suitable for response variables following different distributions. Since GEMMA considers multiple linked functions to transform the response variable to the appropriate distribution, different relationships between the linear model and the response variable can be tested. Here, we tested different approaches with different data sets to conduct GWAS. The first approach is the standard mixed-model approach based on the raw mean disease scores. The raw data was also transformed into three class polynomial data (resistant, moderately resistant, and susceptible) and two-class binary data (resistant or susceptible) based on the response of the check genotypes in the analysis. The transformation may allow the discovery of major genetic effects. Markers associated with those effects may be mobilized as useful breeding tools.
The objectives of this research were to: (1) demonstrate reproducibility of a greenhouse evaluation system for Rhizoctonia root rot in common bean; (2) characterize resistance to R. solani within the ADP and MDP; (3) discover genomic regions associated with resistance based on raw and transformed phenotypic data using GWAS; and (4) identify candidate genes underlying resistance to Rhizoctonia root rot in common beans.
Materials and Methods
Inoculum Preparation
One R. solani AG 2-2 isolate collected from common bean grown in the Red River Valley region of North Dakota was utilized for screening common bean germplasm under greenhouse conditions. The isolate was purified via micro-excision of a single hyphal tip and previously confirmed as R. solani AG 2-2 via amplification of the rDNA ITS region using ITS1, 5.8S, and ITS2 with primers ITS4 (TCCTCCGCTTATTGATATGC) and ITS5 (GGAAGTAAAAGTCGTAACAAGG) (White et al., 1990; Mathew et al., 2012). The isolate was grown at 20 ± 2°C for 14 days on 0.5× potato dextrose agar (PDA: 19.5 g of potato dextrose agar, 7.5 g of agar, 1 L of distilled H2O) amended with streptomycin and neomycin, both at a concentration of 50 mg/L. Large metal trays (30.48 cm × 5.80 cm × 6.35 cm) were filled with 1.5 kg of wheat kernels. Tap water was added to the trays to a depth of approximately 8 cm to completely cover the wheat kernels. The wheat kernels were soaked for approximately 15 h at 22 ± 2°C, water was drained from the trays, trays were covered with aluminum foil and autoclaved at 121°C for 2 h, cooled for 24 h at room temperature, and autoclaved again for 2 h. After the wheat kernels were cooled overnight, they were aseptically inoculated with one cm square sections of 0.5× PDA containing mycelia of R. solani from eight (100 mm diameter) Petri plates. Trays were covered with aluminum foil, and the wheat was colonized over a period of 2 weeks at 22 ± 2°C. The grain was aseptically mixed twice a week to ensure uniform colonization. The trays were emptied onto butcher’s paper and spread out to dry on greenhouse benches. The dry, colonized wheat was collected, sieved, and stored in the freezer until use.
Greenhouse Evaluations
A total of 279 MDP and 273 ADP common bean genotypes were evaluated for resistance to R. solani under greenhouse conditions using an augmented randomized complete block design. Each genotype was replicated three times (1 replicate = 1 pot). Each pot contained three seeds of a single genotype. To control for differences in root architecture and color across accessions when evaluating for root rot, one pot containing three seeds and no inoculum was included as a negative control. Four-inch plastic pots with drainage holes were filled to the top rim with Pro-mix LP15 potting soil (Premier Tech Horticulture, Quakertown, PA, United States). One R. solani colonized wheat kernel was placed 2 cm below the bean seed, which was planted at a depth of approximately 2 cm. The seeds were covered with soil, and the soil was watered. Plants were watered daily and maintained over a 14 days period in a greenhouse under 16 h of light at 22 to 25°C. To ensure consistent environmental conditions, the ADP was screened in six sub-groups consisting of 45 or 46 lines. The MDP was divided into four sub-groups consisting of 72 or 73 lines. The control lines Montcalm (susceptible), Cabernet (susceptible), Dynasty (moderately susceptible), GTS104 (moderately resistant), and VAX3 (resistant) were chosen based on preliminary trials and previously published data (Vasquez-Guzman, 2016). All five-control lines were screened along with genotypes from each sub-group of the ADP and MDP. Therefore, each control line was screened a total of 10 times whereas each genotype was screened twice.
Disease Evaluations
Plants were harvested 2 weeks after planting by carefully lifting the roots from the potting medium, and the roots were washed with warm tap water. Roots were evaluated for disease using a previously developed disease rating scale; 1 = no visible disease symptoms, 9 = approximately 75% or more of the hypocotyl/root tissue is affected with advanced stages of rotting along with significant reduction in root system (Van Schoonhoven and Pastor-Corrales, 1987). To confirm that disease was the result of the soil infestation with R. solani, roots from the five control lines were surface sterilized in a 0.8% NaOCl solution for 30 s and placed onto 0.5× PDA amended with streptomycin and neomycin, both at a concentration of 50 mg/L. After 24 h, hyphal tips were placed into 0.5× PDA to obtain clean cultures. Sub-cultures were grown for 1 week, and each isolate was morphologically identified (Sneh et al., 1991). Morphological identification was verified by amplifying DNA extracted from cultures, using the internal transcribed spacer region protocol described above (White et al., 1990).
Phenotyping Data Analyses
Assay reproducibility was evaluated utilizing the data for the control lines across six ADP and four MDP sub-group evaluations. The mean and standard error (SE) were calculated based on the root rot ratings for each control line. The coefficients of variability (SE of the mean/mean) were calculated, and a one-way ANOVA (α = 0.05) was performed within each control line across all six ADP and four MDP sub-group evaluations (Wong and Wilcox, 2000).
Control lines data from the sub-group evaluations within each of the two panels were utilized to determine if the control lines were appropriate to classify the genotypes as resistant, moderately resistant, or susceptible to R. solani. Significant differences among control lines were determined by generating estimated relative effects, confidence intervals, and p-values using data from only the control lines. Relative treatment effects and the corresponding 95% confidence intervals were calculated using the LD_CI macro in SAS (Domhof and Langer, 2002; Shah and Madden, 2004). Relative treatment effects was determined using the mean ranks according to the following equation:
where () is the mean rank for each bean line among all the observations within the experiment (N). Relative effects range from 0 to 1 (Shah and Madden, 2004). Probability values (α = 0.05) were generated using the confidence intervals and the relative effects to statistically separate the five control lines (Altman and Bland, 2011). The MDP and ADP genotypes were classified as resistant, moderately resistant, or susceptible relative to VAX3, GTS104 and Montcalm using p-values generated from relative effects and associated confidence intervals.
Single Nucleotide Polymorphism Data Sets
Individual Middle American (MA) and Andean genepool HapMaps (Oladzad et al., 2019) were used for GWAS mapping. These HapMaps were generated from genotype-by-sequencing (GBS) reads of 469 MA and 325 Andean genotypes. Initially, the libraries for each gene pool were prepared using the two-enzyme (MseI and Taqα1), low- pass sequencing SNP set protocol described by Schröder et al. (2016). The libraries were then sequenced at HudsonAlpha Institute for Biotechnology1 using Illumine HiSeq sequencer. The details of SNP calling procedure along with variant filtering was published in Oladzad et al. (2019).
The MA HapMap contained 205,293 SNPs, and the Andean HapMap consisted of 260,670 SNPs. The relative number of SNPs, based on chromosome size, are uniformly distributed across all chromosomes throughout the genome in both gene pools.
Genome-Wide Association Studies
Single nucleotide polymorphisms with a minor allele frequency (MAF) ≥ 5% within each panel (∼128k SNPs for MDP; ∼200k SNPs for ADP) were used for GWAS analysis. The analyses were first performed with the raw phenotypic data. The raw genotype scores, based on the 1 to 9 scale, were averaged over all sub-group evaluations and used as the input data for mixed-model analysis The raw data was also transformed in a three-class polynomial data where genotypes with mean scores < 2.5 were classified as resistant, genotypes with mean scores between 2.5 and 3.5 were classified as moderately resistant, and genotypes scored > 3.5 were considered susceptible. In addition, raw data was transformed into a binary classification where genotypes with mean phenotypic scores ≤ 3.0 were considered resistant, and genotype with mean scores > 3.0 were considered susceptible.
Association analysis was performed with GEMMA (Zhou and Stephens, 2012, 2014) using data from three different phenotypic data sets. For each analysis, fixed, random and mixed models were tested. Population structure was estimated by principal component analysis (PCA) using the R Prcomp function (Price et al., 2006), and the number of PCAs that accounted for 25–50% of the variation was included in the model as a fixed effect. Population relatedness was performed using the centered relatedness algorithm within GEMMA. This matrix was considered a random effect in the models. A Wald test was performed to determine if the SNP effect size was significantly different from zero, and the corresponding p-values were determined. The empirical distribution of p-values was bootstrapped 10,000 times, and from the resulting distribution, SNPs within the lower 0.01 and 0.1% tails were considered significant. The results were followed by a likelihood-ratio-based R2 (R2LR) analysis (Sun et al., 2010), using the genABEL package in R to calculate the amount of variation explained by the significant SNPs in the model.
Candidate Gene Identification
The physical region within a ±100 kb window centered on the peak SNPs were chosen to select candidate genes. The potential effects of the SNPs on gene functions within this window were obtained from snpEff database previously developed for all SNPs in each gene pool using version 2.0 P. vulgaris reference genome annotation data2.
Results
Assay Reproducibility
Genome-wide association study analysis depends on reliable phenotypic data; therefore, the control data was tested for consistency across sub-group evaluations. The phenotypic observations across sub-group evaluations for each control genotype, within diversity panels, were not significantly different (Table 1). In all 10 subgroup evaluations, VAX3 was significantly more resistant to R. solani than the other control lines (Figures 1A,B). Montcalm was more susceptible to R. solani than the other control lines, except for four comparisons. GTS104 displayed significantly lower root rot severity than Dynasty in six of 10 sub-group evaluations. Dynasty was only significantly different from Cabernet in four of 10 evaluations and was statistically similar to Montcalm in one evaluation.
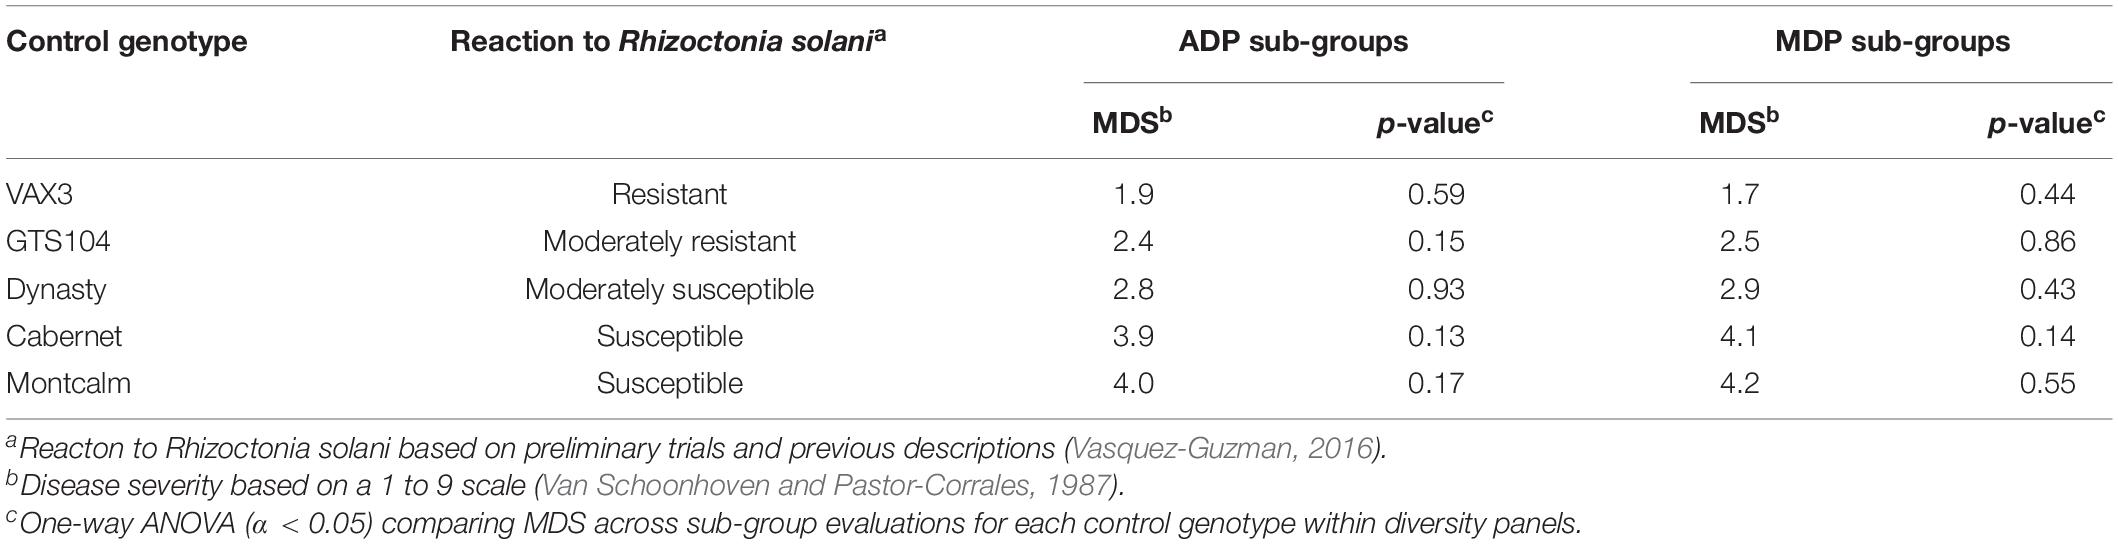
Table 1. Mean disease severity (MDS) of five control genotypes evaluated for root rot reaction to Rhizoctonia solani AG2- 2 across six sub-group evaluations of the Andean Diversity Panel (ADP) and four sub-group evaluations of the Middle American Diversity Panel (MDP).
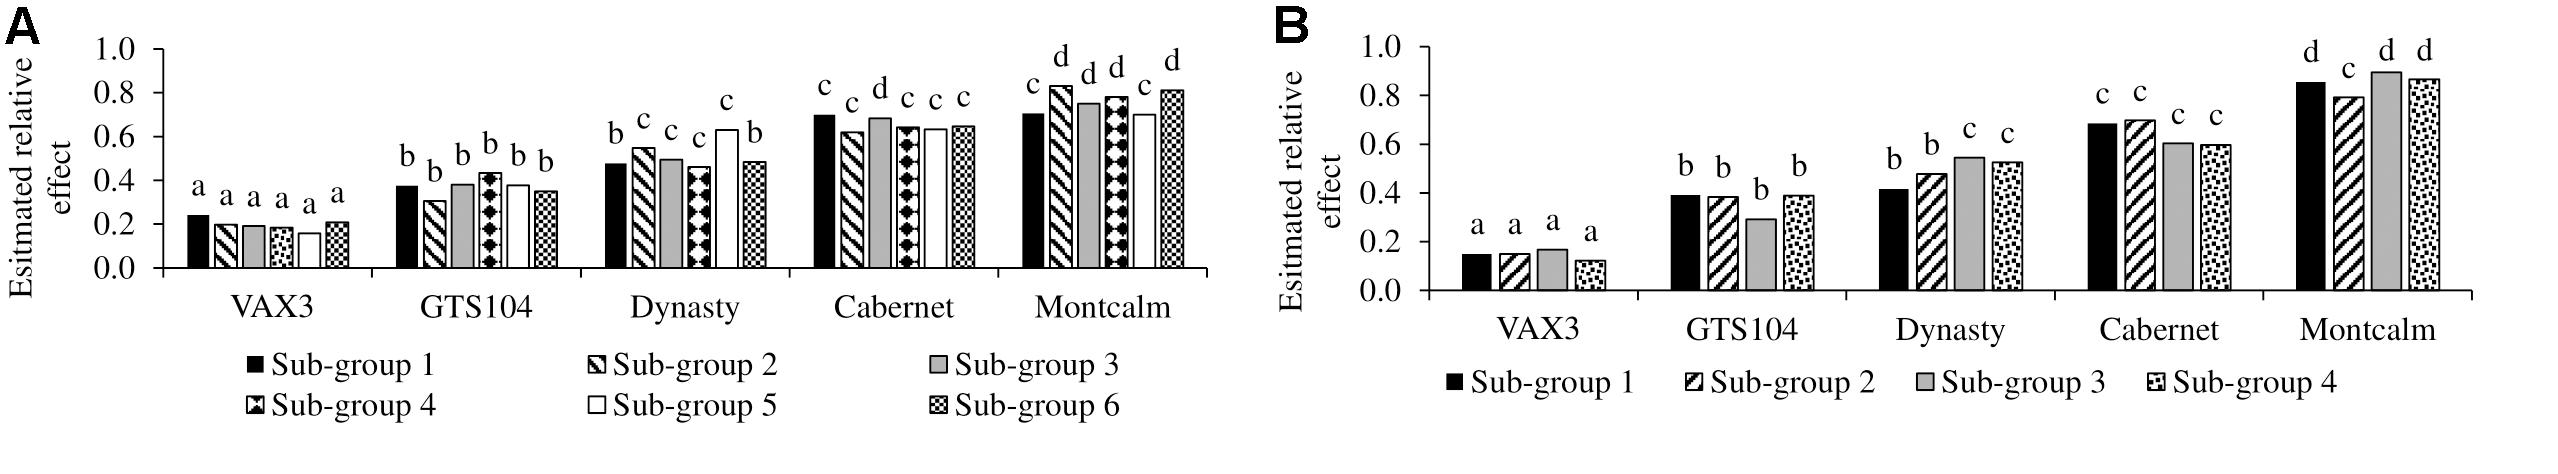
Figure 1. Evaluation of the five control lines against root rot caused by Rhizoctonia solani AG 2-2 with sub-group evaluations of Phaseolus vulgaris (A) Andean Diversity Panel and (B) Mesoamerican Diversity Panel. Bars with same letters are not significantly different based on Fischer’s protected least significant difference (α ¡ 0.05).
Identification of Rhizoctonia Root Rot Resistant Accessions
Rhizoctonia root rot severity data for the ADP were normally distributed and ranged from 2.0 to 5.3 with an overall mean of 3.2 (Figure 2A). Similarly, the average disease severity ranged from 1.9 to 6.2 for the MDP (Figure 2B) and were normally distributed with a mean of 3.1. Corresponding estimated relative effect values, on a scale of 0 to 1 were also normally distributed (Figures 2C,D). Relative effect values ranged from 0.15 to 0.89 and 0.16 to 0.9 for the ADP and MDP, respectively. The estimated relative effects and corresponding confidence intervals of 18 MDP and 28 ADP lines evaluated were not significantly different from the resistant control VAX3, and these lines were categorized as resistant to R. solani (Tables 2, 3). Resistant MDP lines belonged to the pinto (n = 4) black (n = 6), navy (n = 4), great northern (n = 3), and pink (n = 1) market classes. The majority of the resistant ADP lines were purple speckled (n = 7) and red mottled (n = 4), while the remainder were from various seed coat color/pattern types (Tables 2, 3). Phenotypic values of some lines in the two panels were statistically similar to VAX3 and the moderately resistant control GTS104 (Supplementary Tables S1, S2). All lines statistically similar to the susceptible control Montcalm were significantly different from VAX3. Phenotypic data from two lines were similar to both GTS104 and Montcalm.
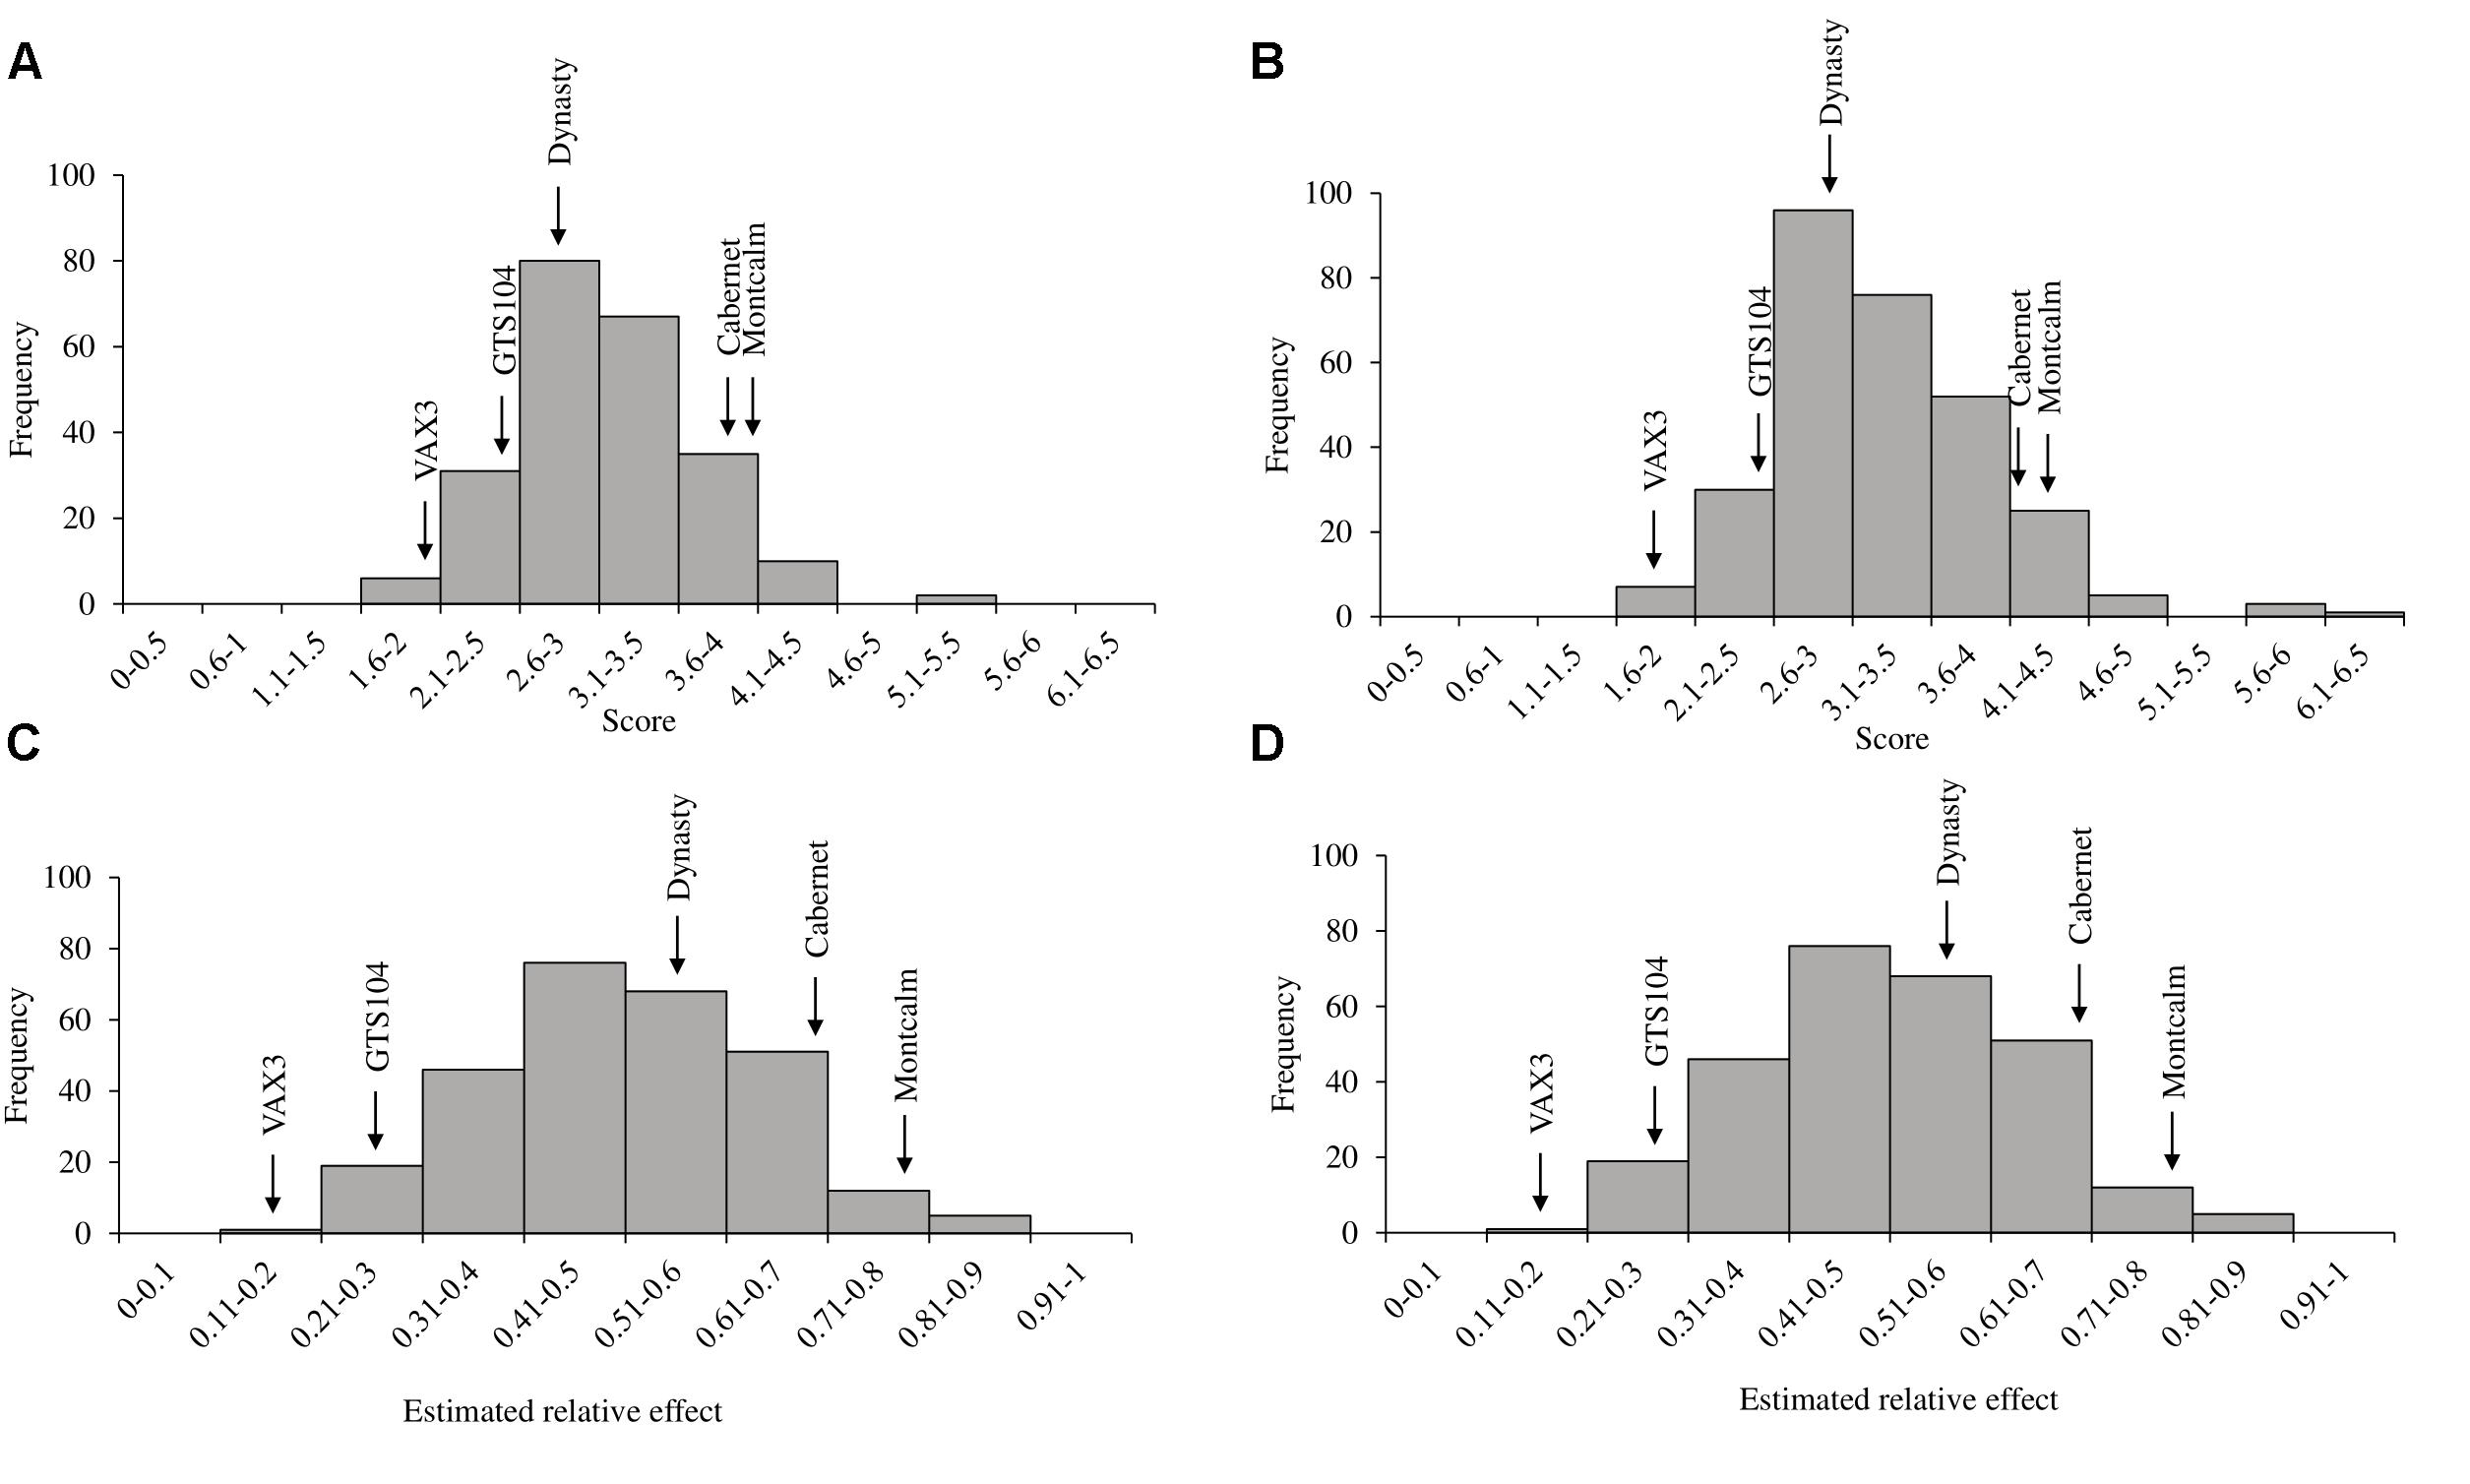
Figure 2. Histograms of phenotypic evaluations of two Phaseolus vulgaris diversity panels. Distribution of (A) average disease score and (C) the estimated relative effects of root rot caused by R. solani AG 2-2 in the Andean Diversity Panel (ADP). Distribution of (B) average disease score and (D) the estimated relative effects of R. solani in the Middle American Diversity Panel (MDP). Arrows indicate the average disease score and relative effects of the five control lines used in the study.
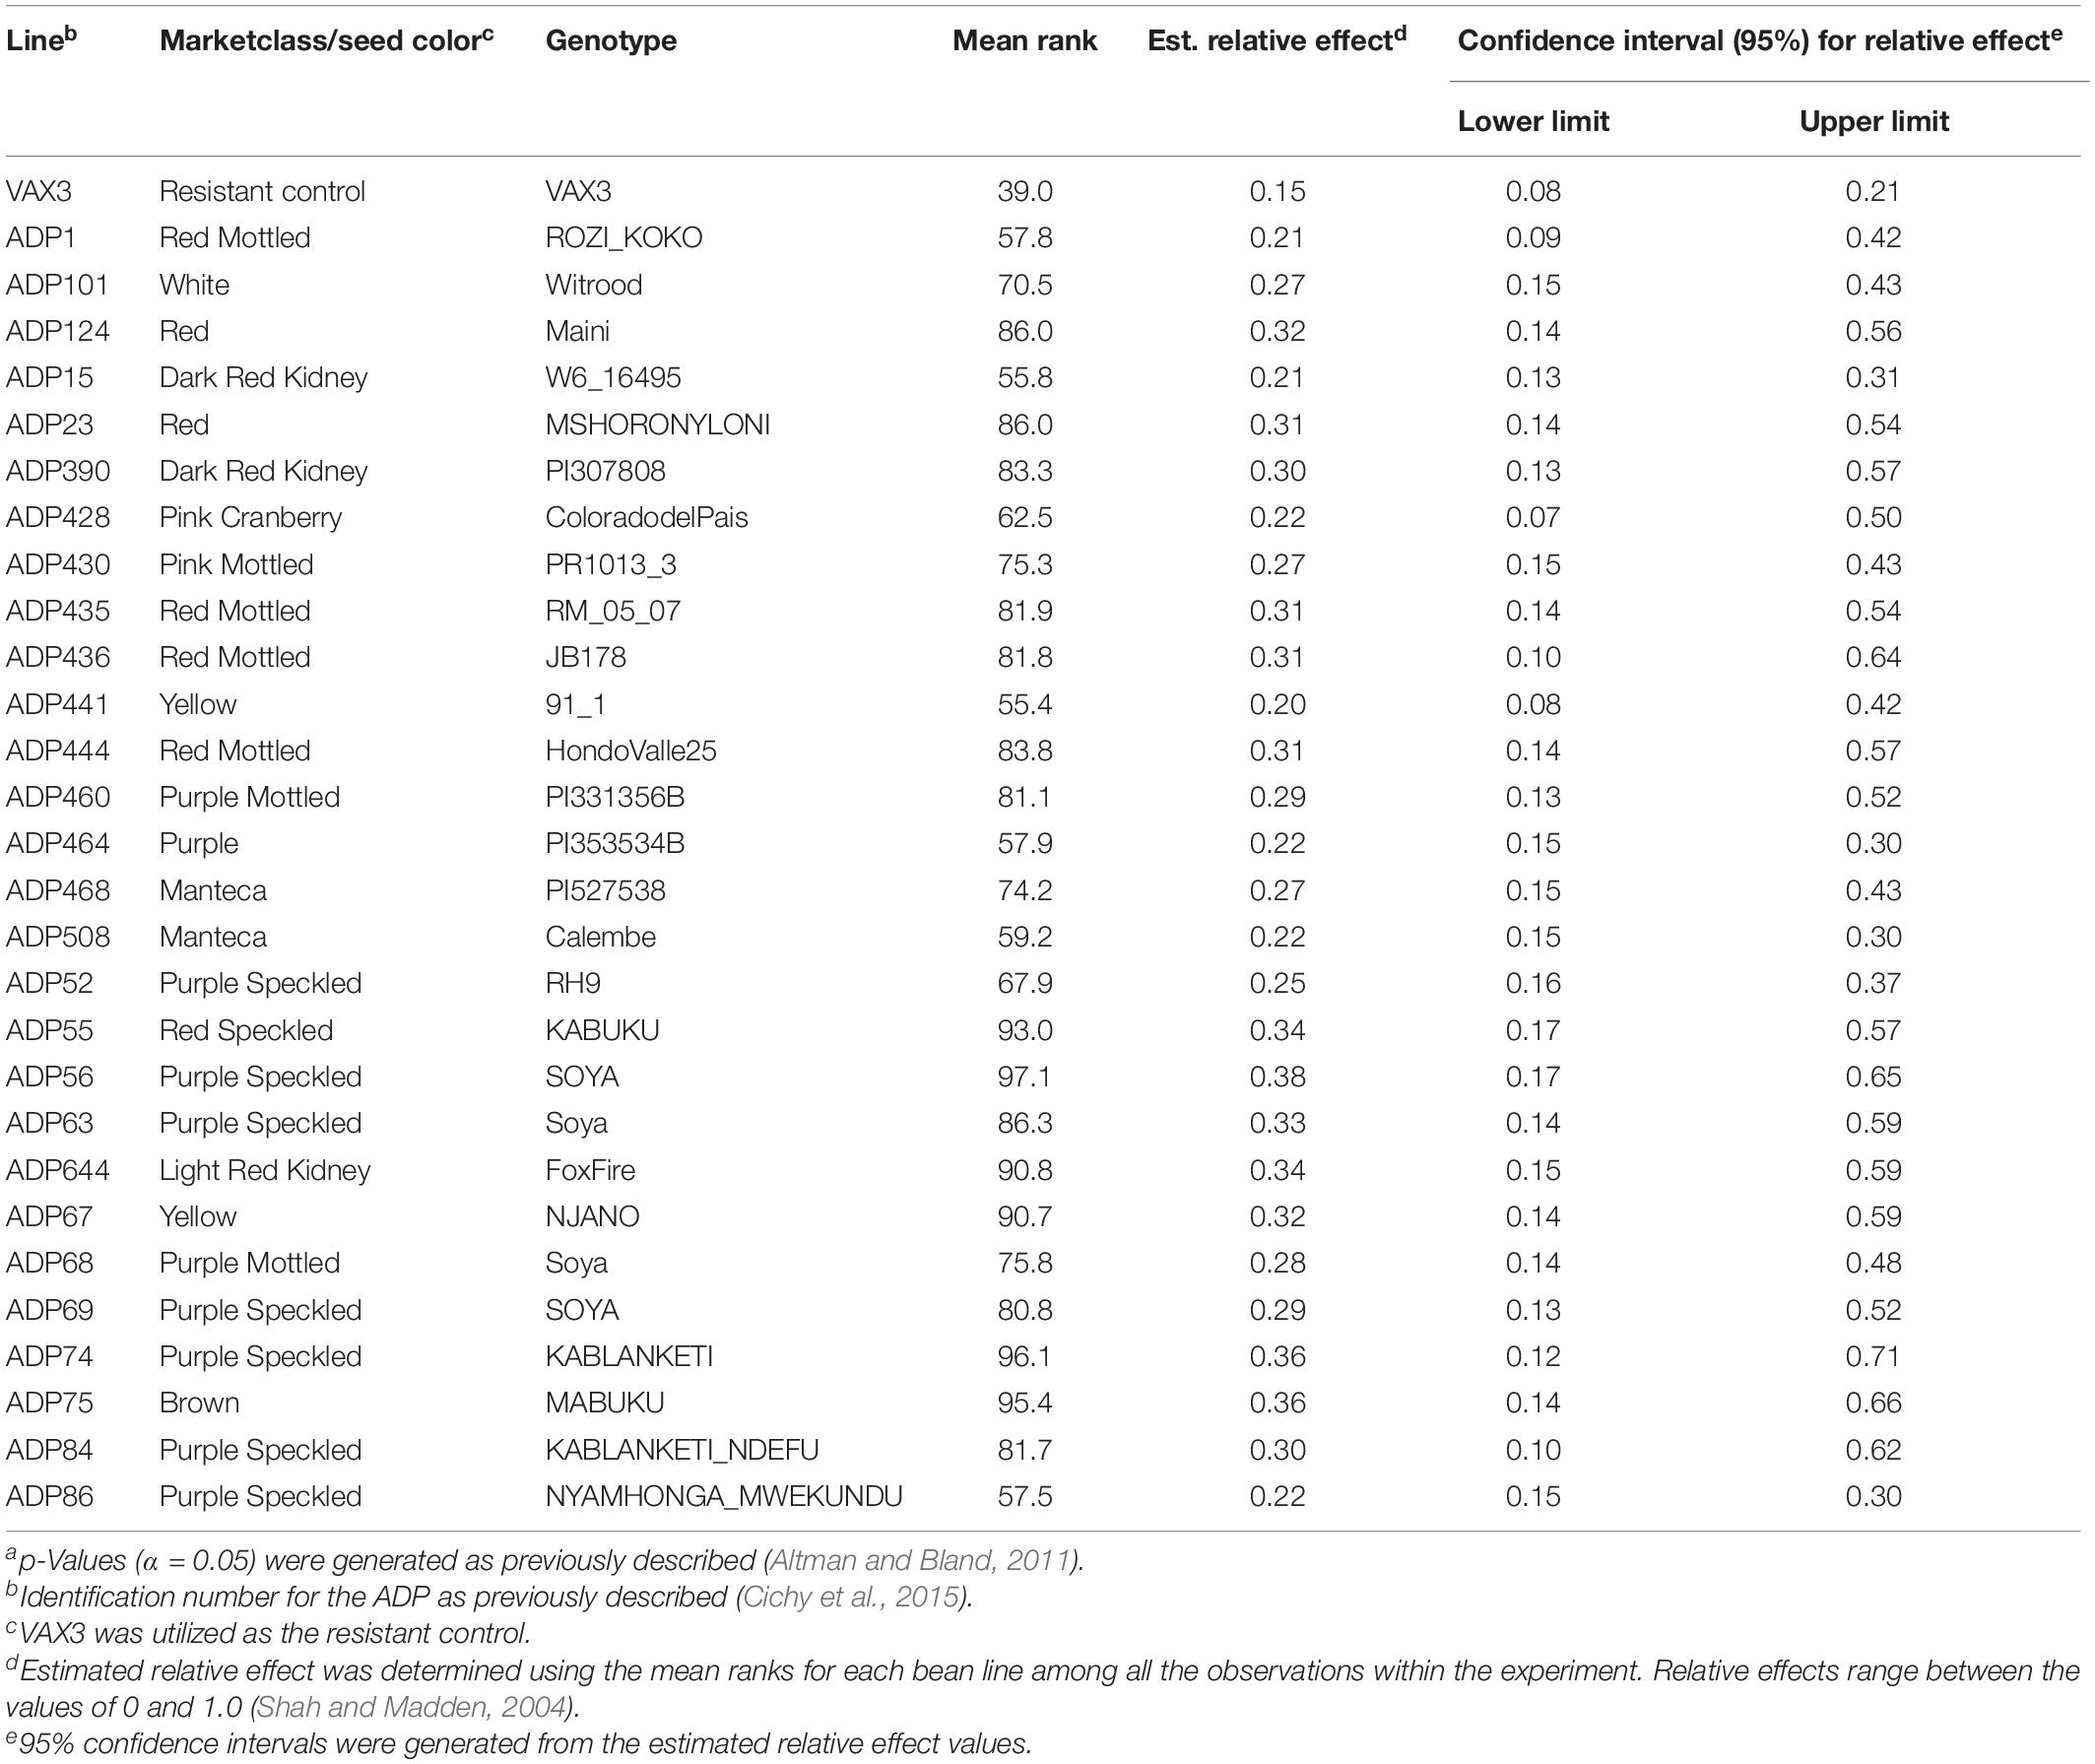
Table 2. Summary of phenotypic data for common bean genotypes within the Andean Diversity Panel (ADP) statistically similar to the resistant control VAX3. Overlapping confidence intervals and p-values (α < 0.05)a were used to determine statistical similarity between bean lines and the resistant control (VAX3).
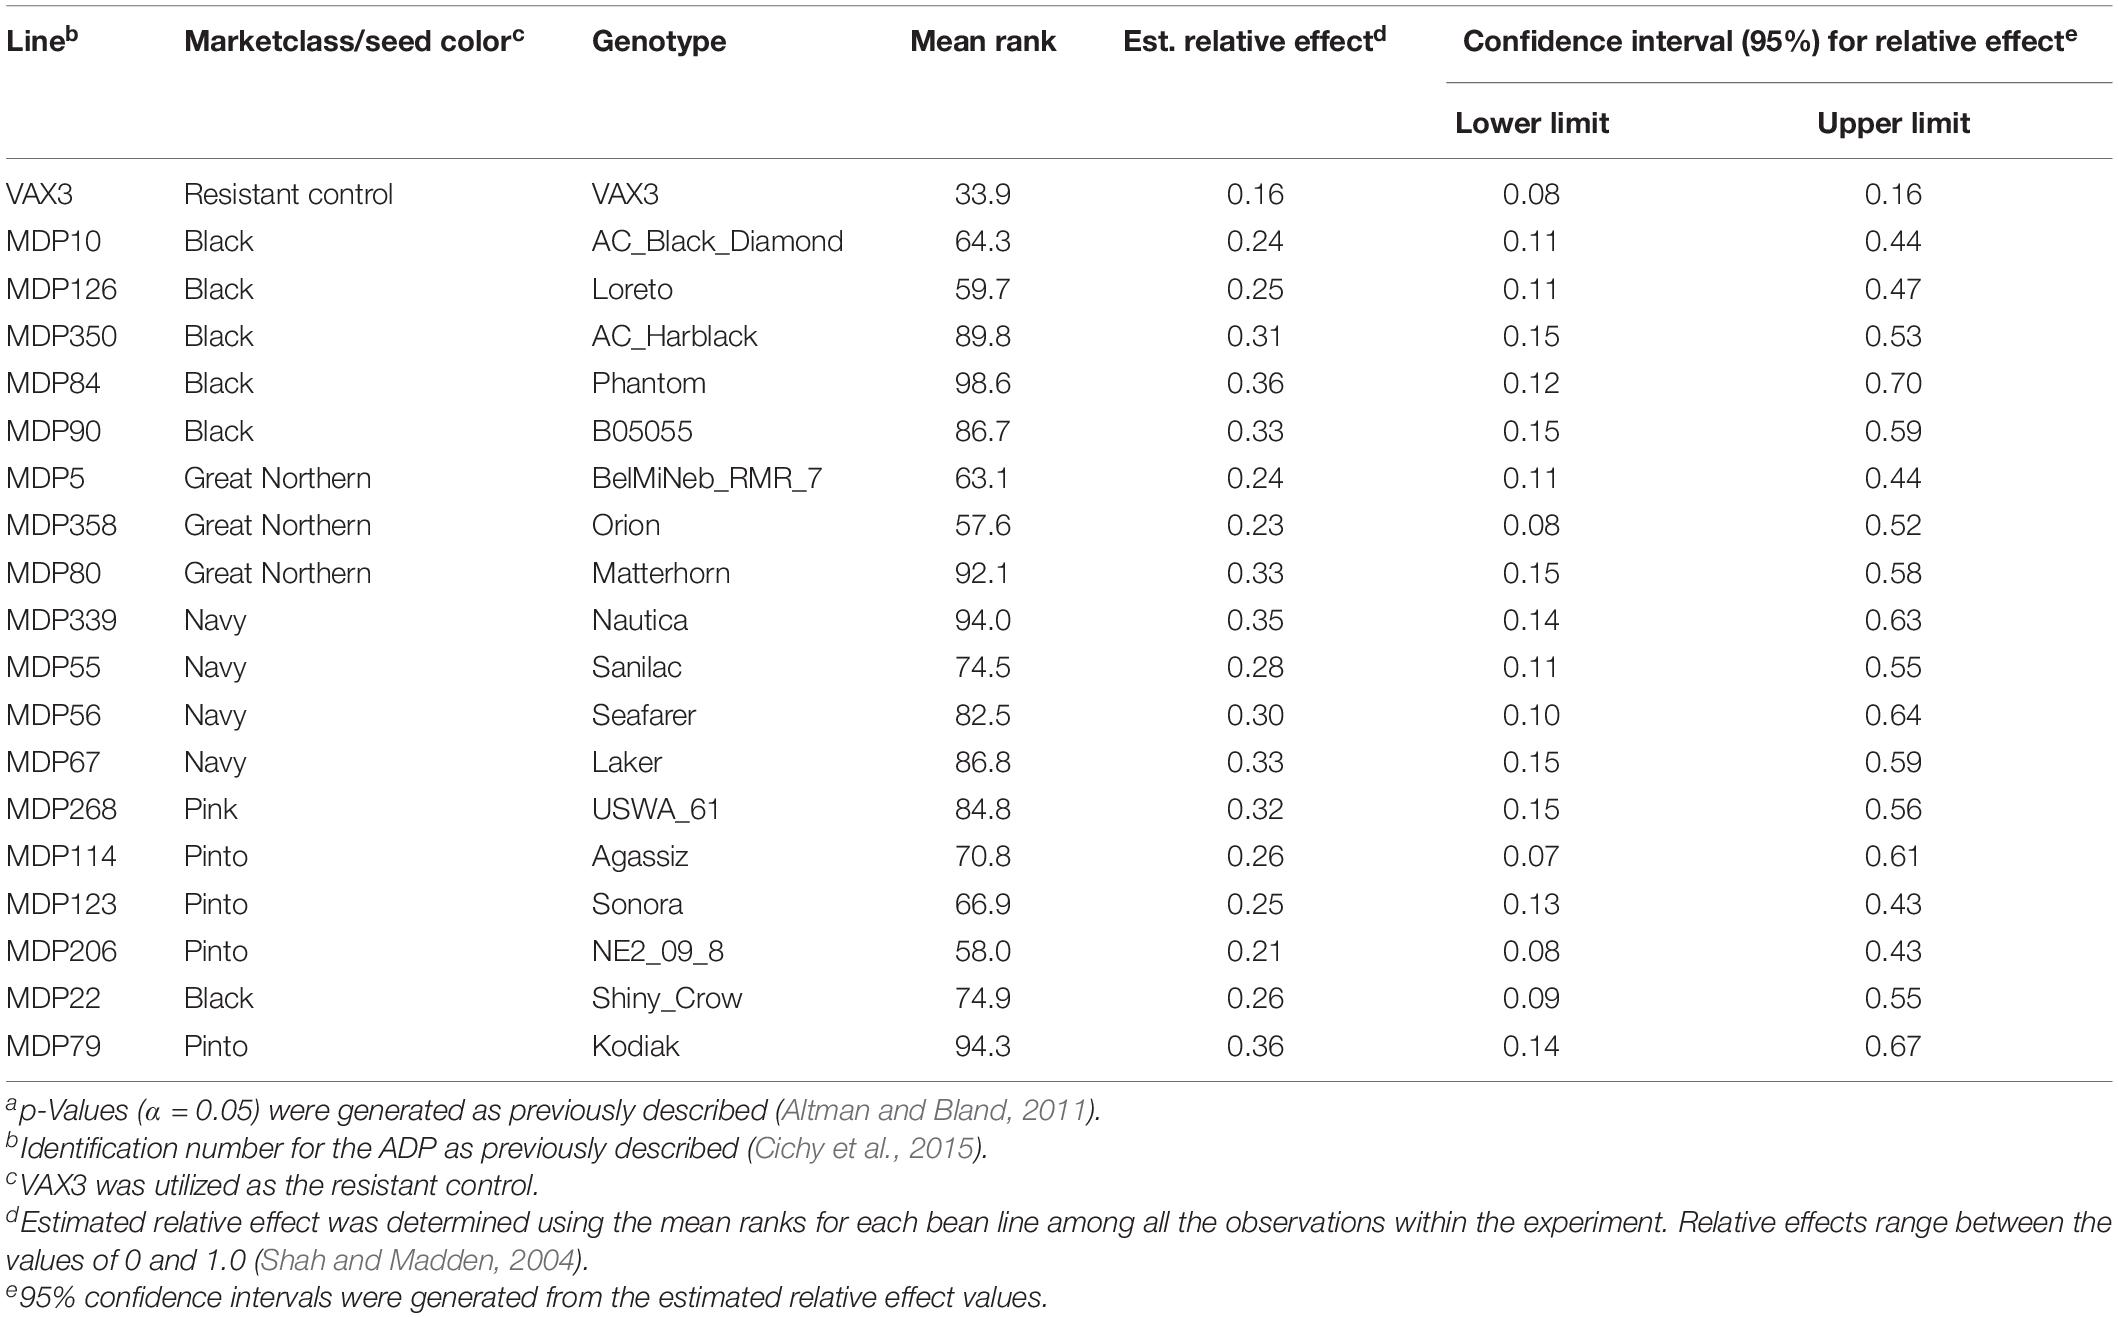
Table 3. Summary of phenotypic data for bean lines within the Middle American Diversity Panel (MDP) statistically similar to the resistant control VAX3. Overlapping confidence intervals and p-values (α < 0.05)a were used to determine statistical similarity between bean lines and the resistant control (VAX3).
Association Mapping in Andean Diversity Panel
Genome-wide association study analyses were performed with the raw ADP phenotypic data. Across the raw, polynomial (three classes), and binary data set analyses, eight significant intervals (−log10(p) ≥ 4.41) containing 128 SNPs were detected (Figure 3 and Table 4). The cumulative variation explained by the three analyses was 22.05, 21.01, and 12.53%, respectively. Fourteen significant SNPs were shared among the three analyses (Table 6). However, several significant SNPs or regions were only detected in one of the analyses (Figure 3). Pv02:48.8–49.41 Mbp was identified as a significant region for all three scoring system analyses. This region contains three gene models, Phvul.002G323704, Phvul.002G323708 and Phvul.002G323712, annotated as TIR-NB_ARC-LRR (TNL) resistance genes (Supplementary Table S3).
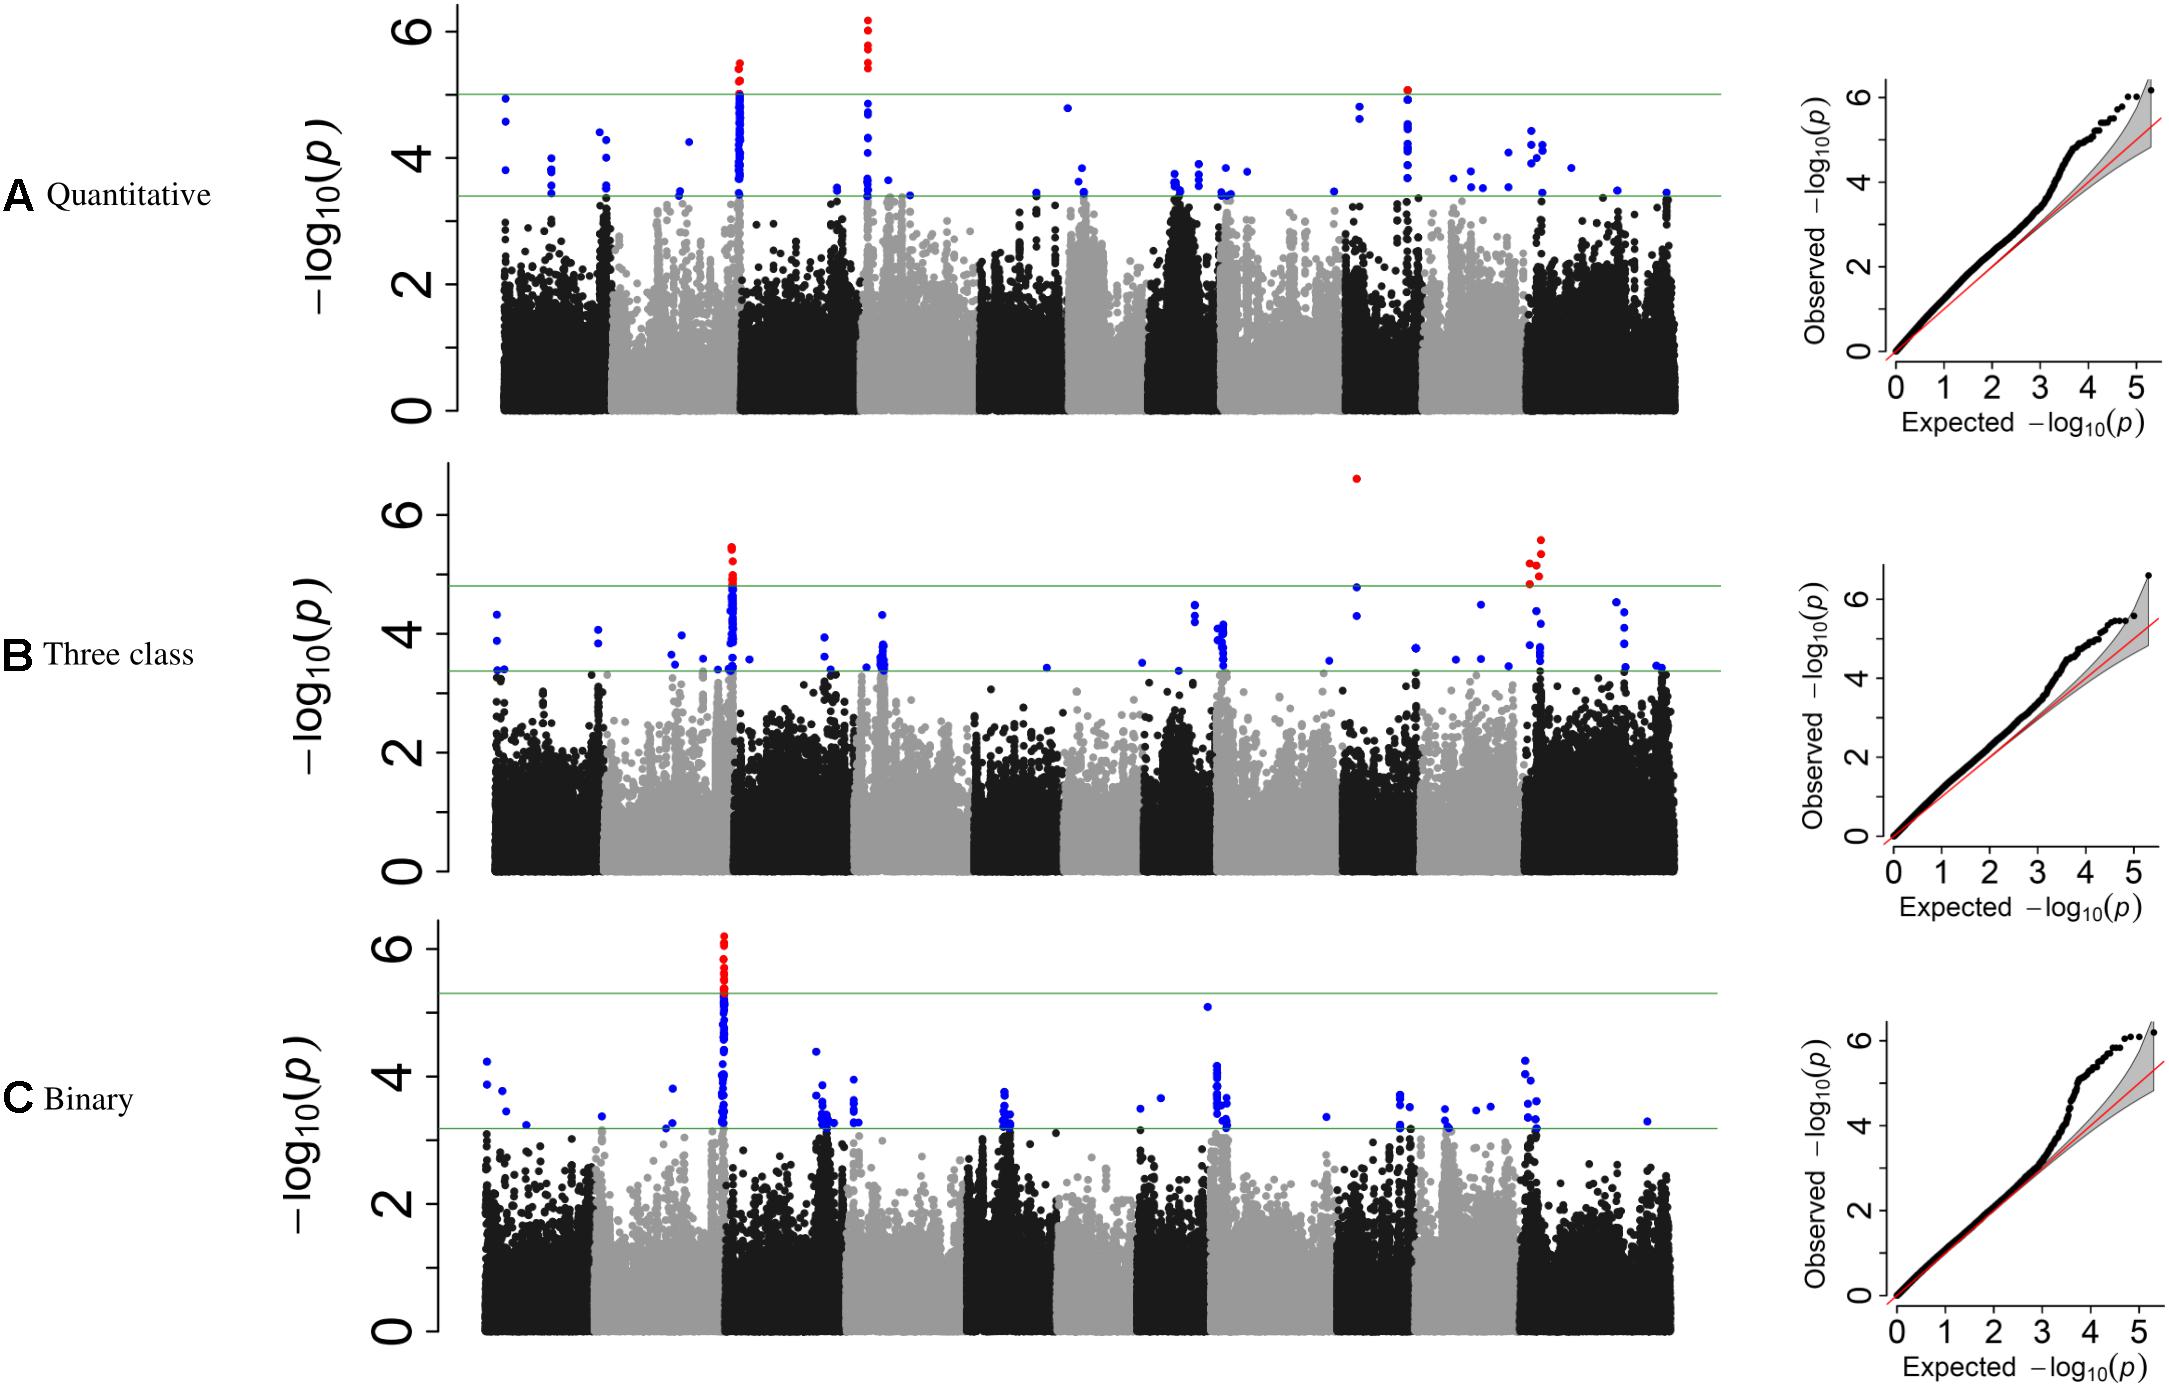
Figure 3. Manhattan plots and corresponding QQ-plots from GWAS analysis of (A) quantitative, (B) three-class, and (C) binary scoring systems in the ADP.
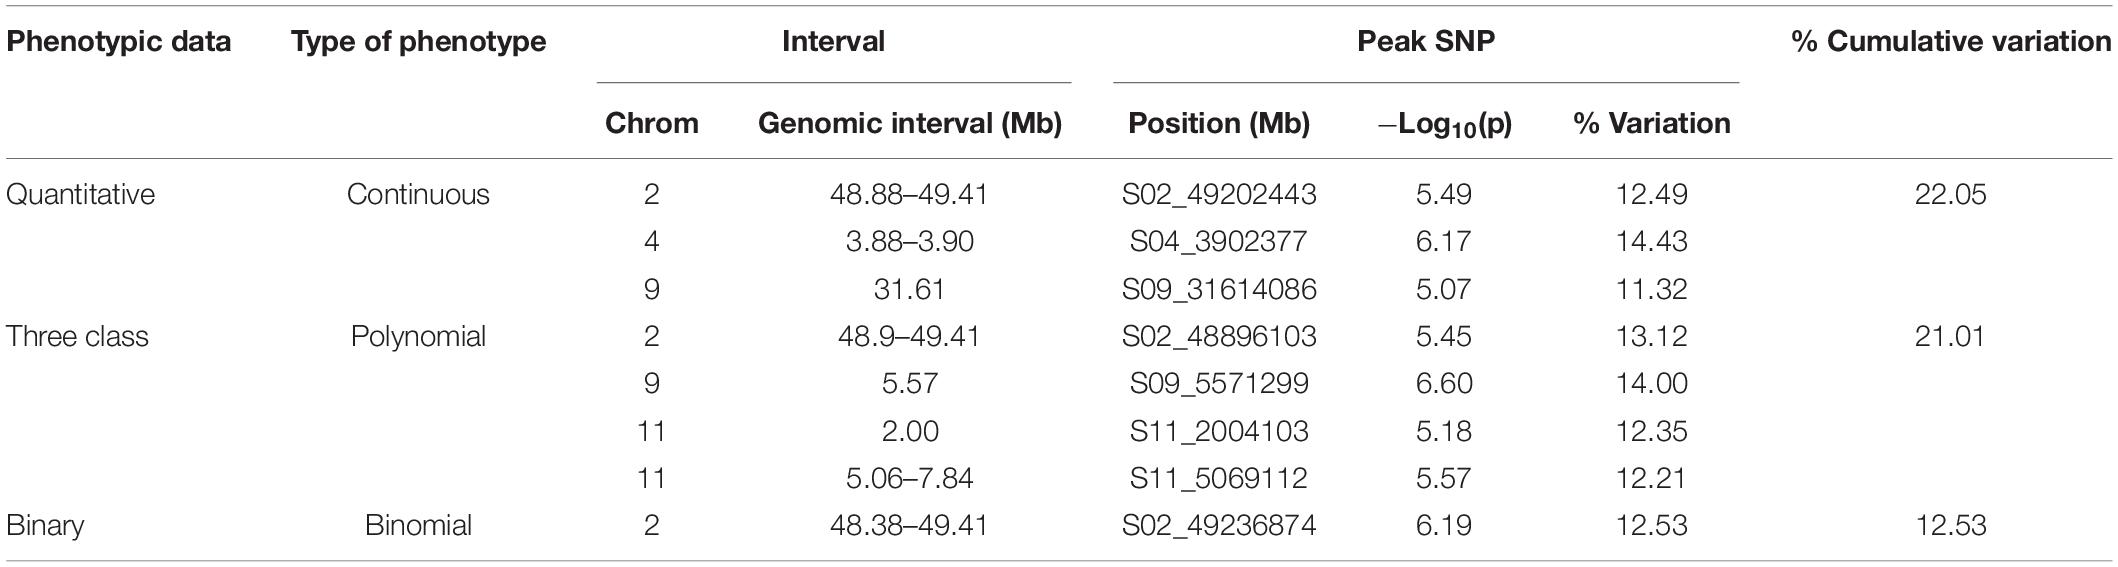
Table 4. GEMMA GWAS results of ADP genotypes for the three phenotypic scoring systems.
Additional SNPs, specific to each phenotypic data set analysis, were also investigated. For the three-class polynomial data GWAS analysis, a gene cluster of disease resistance-responsive, dirigent-like proteins were identified within the interval Pv11:5.06–7.84 Mbp interval. SNP peak at Pv11:6,439,304 bp (−log10(p) = 4.96) was located 35 kb upstream of this gene cluster. In addition, an ortholog of a putative pathogenesis-related thaumatin protein was detected in this interval at position 5.85 Mbp (Supplementary Table S3).
Genome-wide association study analysis of ADP lines using the raw scoring data detected significant peaks on chromosomes Pv02, Pv04, and Pv09. In this analysis, a novel peak on Pv04 was observed and one SNP (Pv04: 3,902,377 bp) was located within gene model Phvul.004G032900 which is an ortholog of the chorismate mutase gene (ATCM1, CM1) of Arabidopsis. This peak SNP alone accounted for 14.43% of the phenotypic variation. Another significant SNP at Pv09:31,614,086 bp explained 11.32% of the phenotypic variation mapped 17 kb downstream of a receptor-like kinase gene.
Association Mapping in Middle American Diversity Panel
For the MDP, 21 significant intervals (−log 10 (p) ≥ 4.12) containing 38 SNPs were detected for the three data types (Table 5). Several significant regions or single SNP were only detected in one or the other data types (Figure 4). Genomic regions identified using the raw, three-class and binary data sets explained 39.4, 31.7, and 24.6% of the phenotypic variation, respectively (Table 5). Three SNP peaks were shared among different data sets (Table 6).
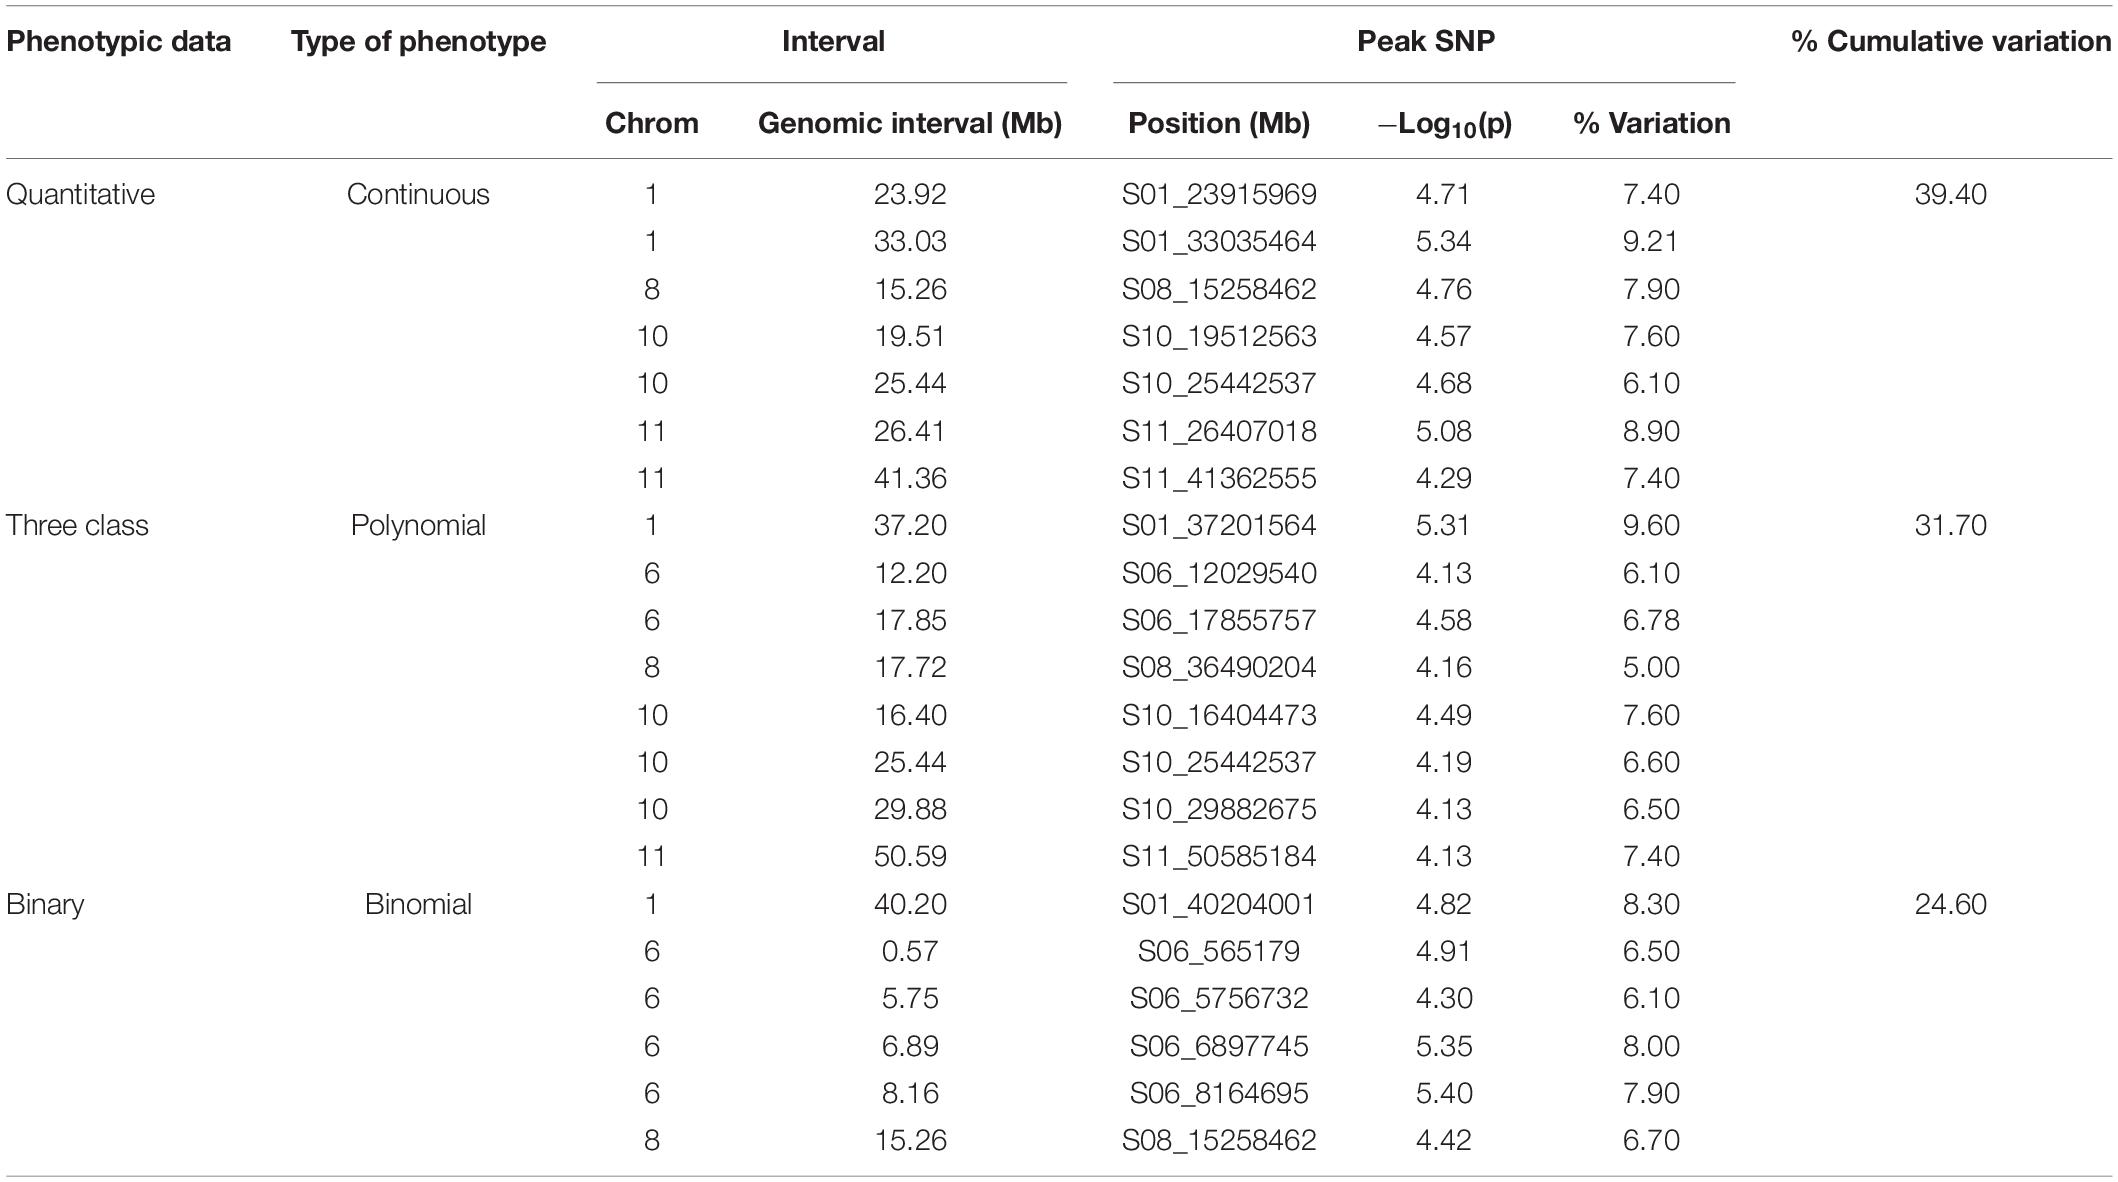
Table 5. GEMMA GWAS results of MDP genotypes for the three phenotypic scoring systems.
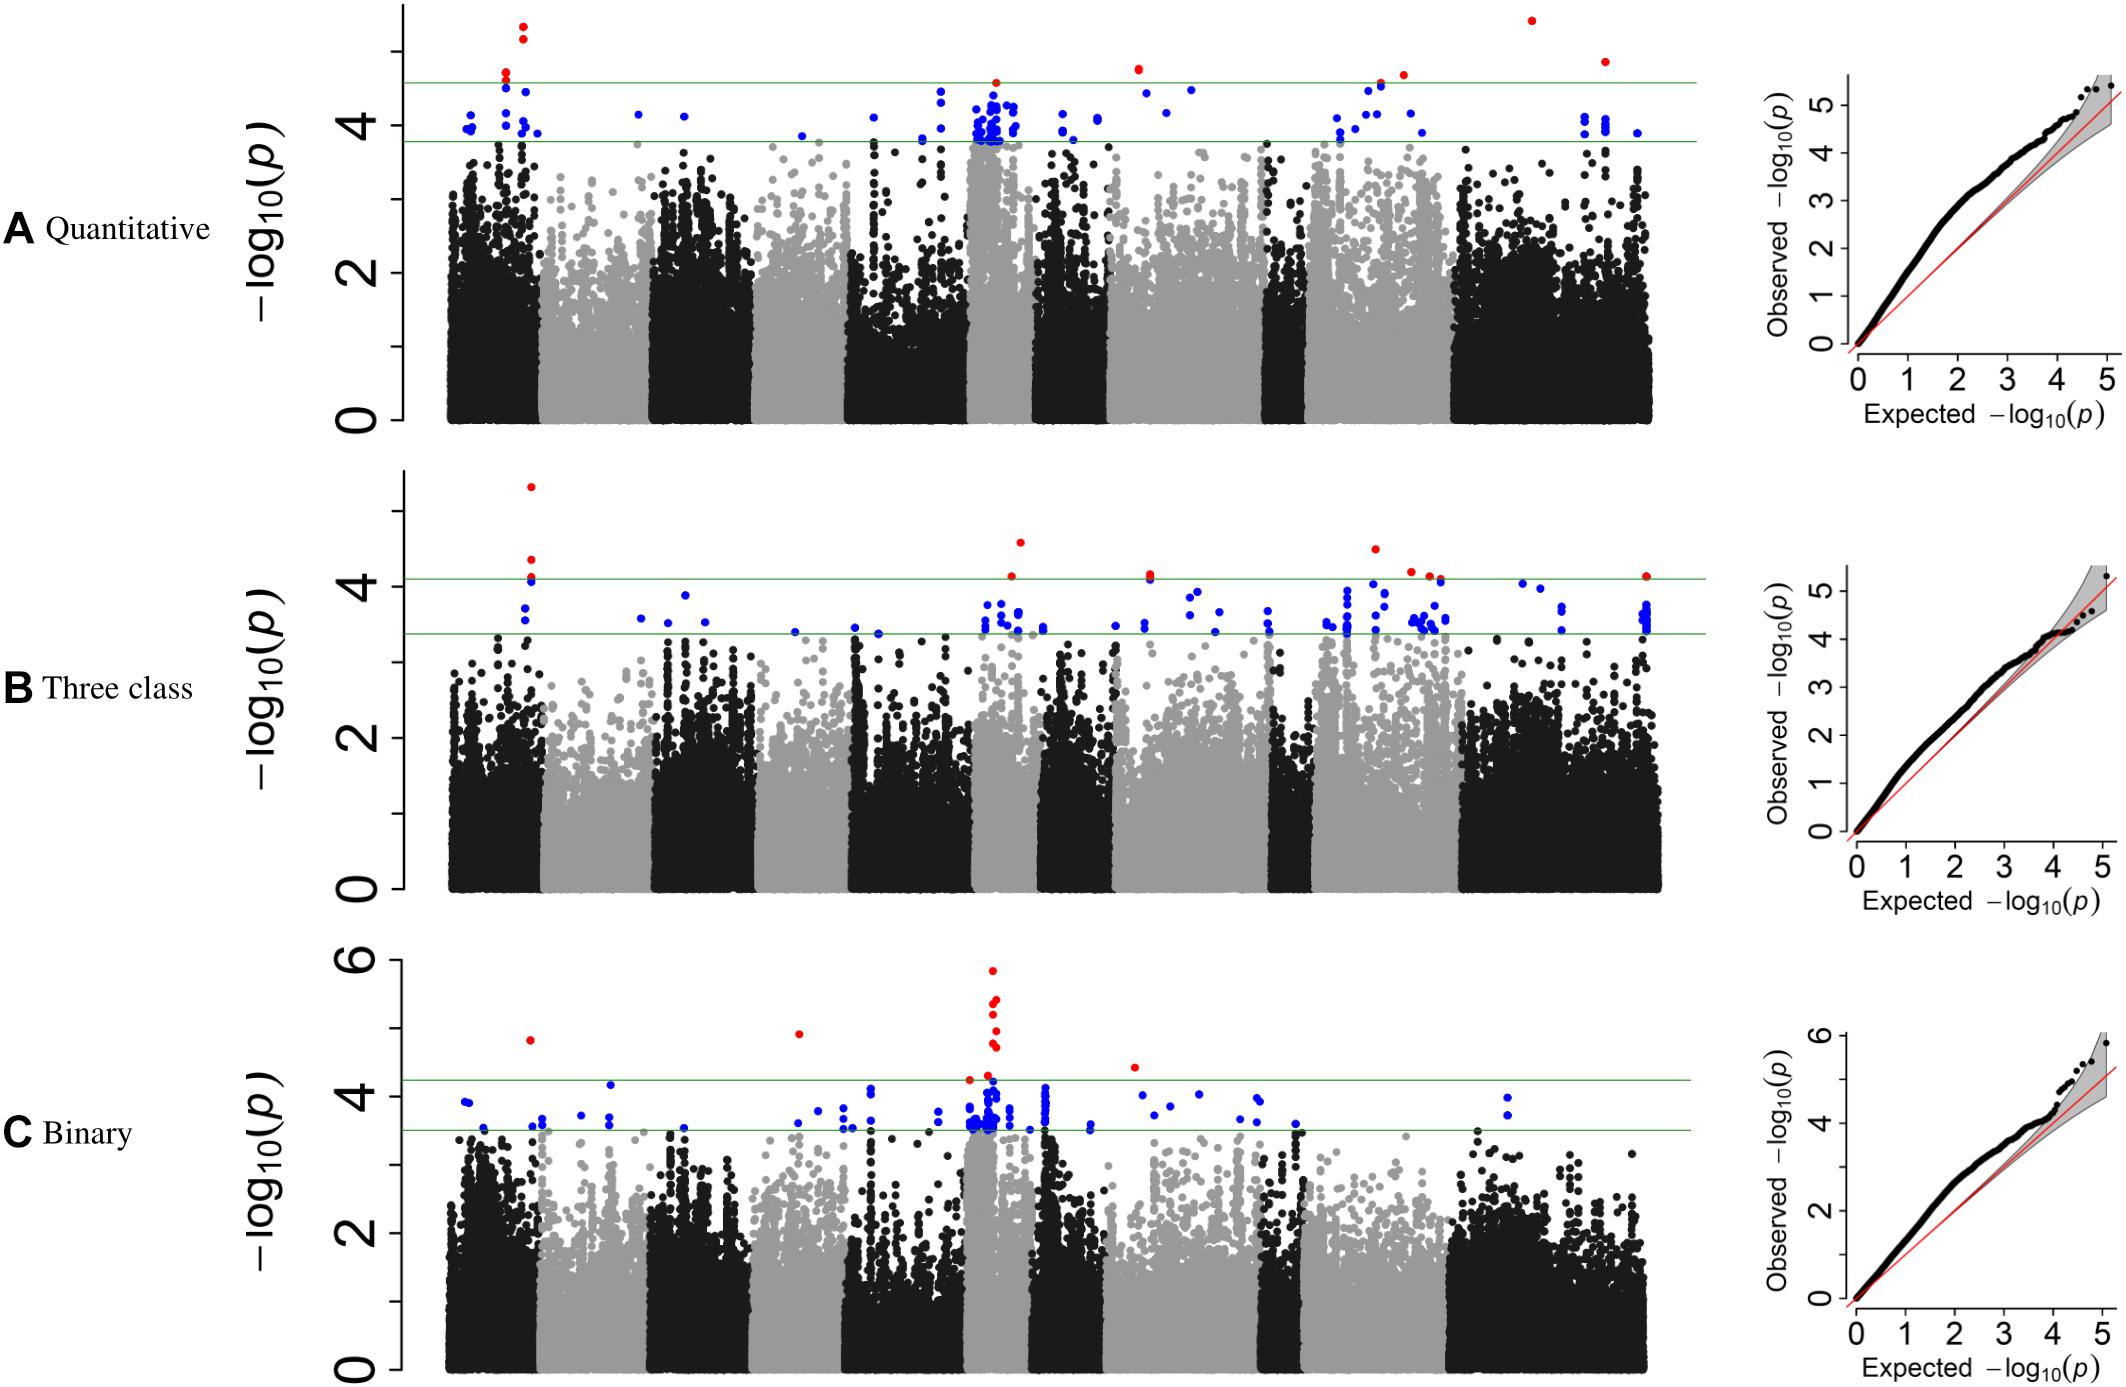
Figure 4. Manhattan plots and corresponding QQ-plots from GWAS analysis of (A) quantitative, (B) three-class, and (C) binary scoring systems in MDP.
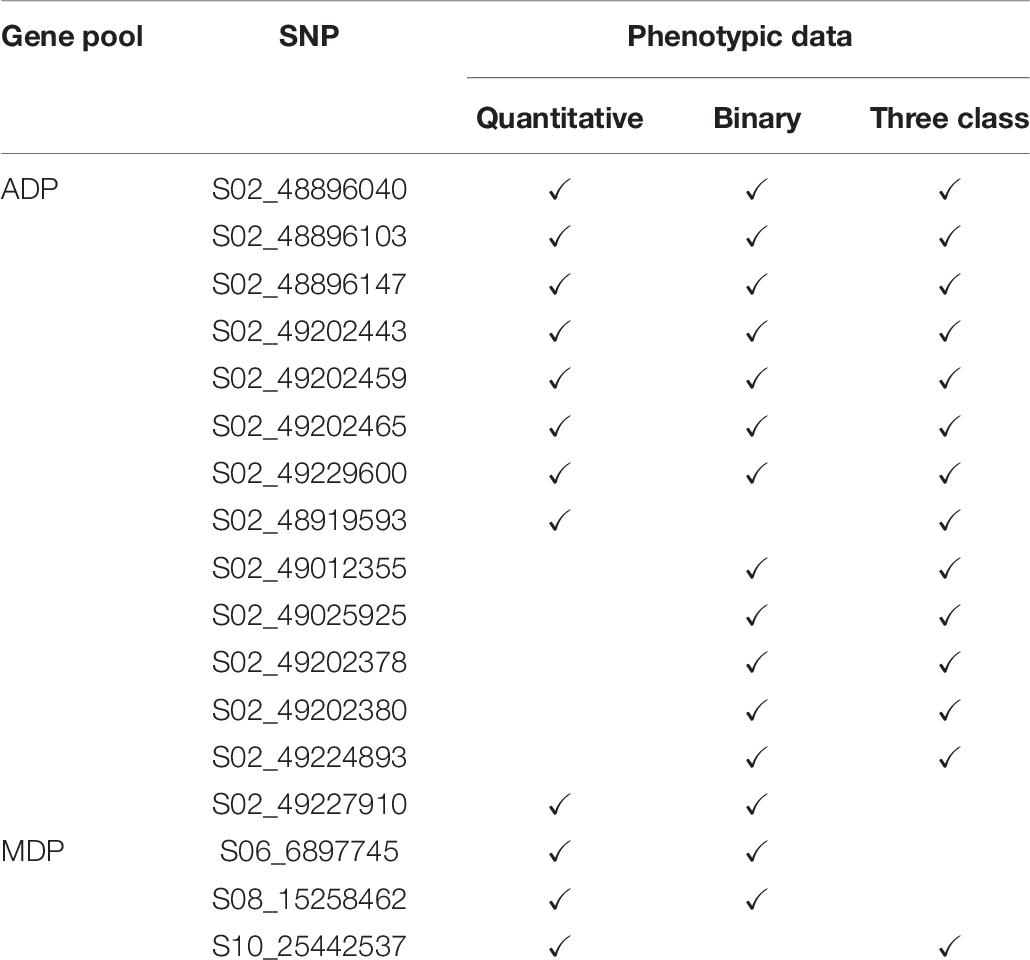
Table 6. Shared significant SNPs from GWAS results for three scoring system in MDP and ADP gene pool.
For the GWAS analyses using raw data, the SNP detected at Pv01: 33,035,464 was adjacent to gene model Phvul.001G109780, an ortholog of 2-isopropylmalate synthase 1 gene. The most significant SNP at position Pv01: 33,035,427 bp explained 9.21% of the phenotypic variation. The SNP peak at Pv08: 15,258,462 shared between the raw and binary data sets is ∼100 kb downstream of a cluster of putative defensin-like (DEFL) family proteins (Supplementary Table S4).
For the three-class polynomial data set, one major gene cluster was detected in close association with significant SNPs at Pv01. A SNP block at Pv01:37.1–37.30 Mbp contained three gene models associated with TNL disease resistance proteins, and a fourth gene model that encodes a leucine-rich repeat protein kinase. The peak SNP identified in this region, is located between two gene models that code for putative disease resistance proteins. Another peak SNP at Pv11: 50,585,184 bp was also in association with a large cluster of at least 11 major NB-ARC domain-containing disease resistance proteins (Supplementary Table S4).
Discussion
Effective screening for quantitatively inherited traits is challenging, and these challenges are pronounced with root disease traits. Soil-borne pathogens are affected by the environment, and controlling the soil environment in the field during screening of genotypes can be complicated. In addition to soil moisture and temperature, competition from other soil-borne organisms plays an important role in the development of root-rotting pathogens, and these factors are not well-understood. As a result, root-rot incidence and severity are often variable. To our knowledge this is the first case where a statistical confirmation of the control line data ensured that the phenotypic response data for a large collection of genotypes to R. solani infection was reliable. While mean maximum disease severity was moderate, statistical validation across control lines provides confidence in both the precision and accuracy of the results presented here. The use of a single, standardized set of control genotypes provides a measure of reproducibility within a single study, but can also allow comparisons among studies across research groups or time.
Prior screenings for resistance to root rot pathogens were performed in the field or greenhouse where the soil was infested with a mixture of fungal mycelium (Román-Avilés and Kelly, 2005; Nicoli et al., 2012; Peña et al., 2013; Conner et al., 2014; Hagerty et al., 2015; Nakedde et al., 2016; Vasquez-Guzman, 2016). In these cases, obtaining a uniform pathogen distribution in the soils was difficult and resulted in variable results. Using a single infested wheat kernel in close proximity to each seed helps to ensure that the roots will interact with the pathogen. The combination of the single infested kernel inoculation method, and a standardized set of control lines, yielded consistent results in screening for genotypes resistant to R. solani.
Data generated in these studies supports the use of at least two, and ideally three, control genotypes. Here, VAX3 is statistically validated as the resistant control and is recommended for use in all R. solani (AG2-2) root rot evaluations. Recently, a study that screened the ADP under field conditions for root rot resistance also concluded that VAX3 was appropriate as a resistant control line (Vasquez-Guzman, 2016). VAX3 also has been rated as resistant to Fusarium root rot among 11 bean lines evaluated (Bilgi et al., 2008). The selection of an effective resistant control line is particularly important because evaluations for disease reaction are frequently focused on identifying or verifying resistance in a genotype. The response of the other four control lines were relatively consistent, but not as clear as VAX3. For eight of the 10 sub-group evaluations performed here, Montcalm was statistically the most susceptible genotype to R. solani. On that basis, it serves as the most effective susceptible control evaluated. GTS104 was always statistically more susceptible to R. solani than VAX3 and nearly always more resistant than both Cabernet and Dynasty.
Rhizoctonia root rot has the potential to cause severe economic losses in common bean production regions worldwide. Thus, identifying resistant lines, in several market classes and seed types, and genomic regions conferring resistance to R. solani is important to effectively deploy durable genetic resistance. Only a limited number of common bean genotypes have been screened for their response to R. solani isolates (Burke and Kraft, 1974; Muyolo et al., 1993; Peña et al., 2013; Conner et al., 2014; Adesemoye et al., 2018). Sources of partial resistance to R. solani were identified in 275 dry bean lines consisting of commonly grown cultivars, breeding lines, germplasm accessions, and tepary beans in a greenhouse study (Peña et al., 2013). One navy, two black and two cranberry cultivars were partially resistant among 37 common bean cultivars evaluated against root rot pathogens, including R. solani, under field conditions (Conner et al., 2014). No resistance to R. solani was observed among seven commonly grown common bean cultivars from six market classes screened in a greenhouse study (Adesemoye et al., 2018). The current study is by far the most comprehensive evaluation (n = 552 genotypes) of R. solani resistance in common bean to date. This is a first report of greenhouse screening of the ADP and MDP panels for resistance to R. solani. Twenty-eight ADP and 18 MDP genotypes were identified as resistant and will be useful parents for resistance breeding and genetic analysis of the response to the pathogen. Detection of more resistant genotypes in ADP than MDP was surprising as large seeded Andean genotypes generally are considered more susceptible to root rot pathogens (Román-Avilés and Kelly, 2005; Nicoli et al., 2012; Cichy et al., 2015). However, R. solani has been shown to cause severe damage to navy and pinto beans (Engelkes and Windels, 1996). The new sources of resistance identified in this study provide an avenue to accelerate the introgression of resistance into commercial cultivars. This is particularly true when transferring resistance to R. solani between commercial cultivars within the same market class. Commercial cultivars from light red kidney (Foxfire), navy (Nautica, Sanilac, Seafarer, Laker), black (AC Black Diamond, Loreto, AC Harblack, Phantom, Shiny Crow) and pinto (Agassiz, Sonora, Kodiak) market classes exhibited a resistance response similar to VAX3.
Genetic factors associated with the response of common bean to R. solani were discovered in two association panels representing the Middle American and the Andean gene pools. The experiment considered the two panels independently because recent reports are demonstrating that different genetic factors or alleles associated with the same phenotype in each gene pool (Schmutz et al., 2014; Soltani et al., 2017, 2018; McClean et al., 2018). The use of panels with a large number of genotypes each analyzed with > 120k SNPs provided the opportunity to discover significant genotype–phenotype association that account for much of the phenotypic variation.
The development of root rot symptoms is controlled quantitatively and is typically scored based on a disease scale (Park and Rupert, 2000; Román-Avilés and Kelly, 2005; Conner et al., 2014; Hagerty et al., 2015). Zhao et al. (2005) also reported that reaction specifically to R. solani is controlled by both major and minor genes with additive effects. However, breeders want to discriminate lines as resistant, moderately resistant, or susceptible to the disease. In the current study, we considered this perspective by comparing three different phenotyping data types based on data collected on a 1 to 9 scale. Each data type had a different distribution: continuous, binomial, or polynomial. From the perspective of GWAS analysis, GEMMA algorithms implement an efficient generalized mixed linear model analysis that performs a quantile transformation of any phenotypic distribution by dividing the frequency distribution into equal groups. This protects against model misspecification (Zhou and Stephens, 2012, 2014). GEMMA also offers an improved p-value computation (Wald test) that not only reduces the GWAS computational time, but also provides greater power to detect significant SNP associations. Basically, the Wald test is a likelihood estimator of the variances that consequently avoids too many repeated operations for each SNP (Zhou and Stephens, 2014).
In general, several significant associations were observed for both diversity panels. Compared to the MDP, the ADP exhibited fewer significant intervals, with lower p-values. The ADP also contained more resistant genotypes. These observations suggest the genetic effects are larger among ADP genotypes than MDP genotypes.
Implementing three different phenotypic scoring systems for the GWAS analysis provided complementary results. The polynomial, three class system detected the most significant SNPs, but the SNPs detected from raw data from the 1 to 9 scale accounted for more phenotypic variation (ADP = 22.05%; MDP = 39.4%). The polynomial system provided a better biological context regarding the candidate genes associated with the resistance. Therefore, the genes discovered with this scoring system may point to major genes associated with the biology of resistance to R. solani. The binary data analysis may suffer from missing potentially important genes associated with moderate resistance or missing genes of smaller effect that might be revealed using the full 1 to 9 scoring data.
The GWAS analyses for the three phenotypic approaches identified SNPs within or adjacent to four disease resistance gene clusters (1) TNL disease resistance proteins on the distal end of chromosome Pv02 (ADP) and distal of chromosome Pv01 (MDP); (2) disease resistance-responsive (dirigent-like protein) family on the proximal end of chromosome Pv11 (ADP); (3) putative defensin-like (DEFL) family proteins at position 15.26 of chromosome Pv11 (MDP); and (4) NB-ARC domain-containing disease resistance protein on distal of chromosome Pv11 (MDP).
For the ADP analysis, a common peak on Pv02 was observed for all three data sets. This peak maps near a cluster of gene models that encode TNL disease resistance proteins. In general, TNL proteins directly or indirectly detect pathogen molecules (DeYoung and Innes, 2006). Once the pathogen effector interacts with NLR complex, the LRR domains undergo a conformational change that helps to release ATP from the NB-ARC domain. When ATP is released, TIR domains activate a downstream signal by an unknown mechanism that to the pathogen (DeYoung and Innes, 2006; McHale et al., 2006; Marone et al., 2013). A major peak on chromosome Pv01 (Pv01: 37.1–37.30 Mbp) was observed for the MDP using three-class polynomial data. The peak SNP (37,201,564) for this region was located between two gene models that also putatively encode TNL disease resistance proteins. Another GWAS study in common bean discovered that gene model Phv0l.001G134500 in the same Pv01 cluster was associated with increased resistance to the anthracnose pathogen (Wu et al., 2017). NLR encoding genes are frequently clustered throughout common bean and other plant genomes, a possible result of segmental or tandem duplications (Meyers et al., 2003; Leister, 2004; Monosi et al., 2004). Interestingly, Rhizoctonia resistance peaks on Pv01 and Pv02 in both gene pools map within 50 kb of TNL gene model clusters. Kang et al. (2012) discovered that 63% of soybean disease resistance QTL mapped in the regions flanked by NLR encoding genes. Most NLR genes in that study clustered on chromosome Gm06 where four genes were associated with fungal disease resistance. Moreover, a comparative genomic study found that this Gm06 NLR gene cluster was associated with several diseases in soybean and the orthologous common bean cluster on Pv04 was associated with bacterial blight resistance (Ashfield et al., 2012). These studies support our findings that indicate that the TNL gene models in the NLR clusters on Pv02 (for ADP) and Pv01 (for MDP) are reasonable candidates for resistance to Rhizoctonia root rot causing pathogens.
A second putative ADP gene cluster located within a significant peak for R. solani resistance mapped within a proximal interval on Pv11 using the polynomial data. This cluster is annotated as disease resistance-responsive (dirigent-like protein) family. Zhu et al. (2007) showed that dirigent-like genes in cotton have signaling sequences that encode a class of cell-surface proteins, and these proteins activate receptor-mediated plant defense/immunity mechanism against Verticillium wilt infection. In this interval on Pv11, an ortholog of the putative pathogenesis-related thaumatin superfamily protein was detected. These proteins play a critical role in the plant defense/immunity system. Guerrero-González et al. (2011), discovered that pathogenesis-related genes were differentially expressed in common bean against R. solani. Jiang et al. (2015) isolated a pathogenesis-related thaumatin gene from a soybean genotype highly resistant to fungal pathogen Phytophthora sojae. Several studies reported that overexpression of thaumatin genes had a positive effect on pathogen tolerance in plants (Liu et al., 1994; Jung et al., 2005; Chassot et al., 2007). Interestingly, the overexpression of this gene enhanced R. solani resistance in rice (Datta et al., 1999). The mechanism still is not clear, but it was suggested that this gene might mediate a nuclear transfactor 2 (NTF2) against plant disease (Jiang et al., 2015).
Members of the defensin-like (DEFL) protein family protein were another disease resistance gene cluster found to be associated resistance to R. solani in this study. This cluster on chromosome Pv08 was identified in GWAS analysis of MDP using both raw and binary data. DEFL are antimicrobial\cysteine-rich proteins (Giacomelli et al., 2012), and their role in the plant defense response and disease resistance has been reported in several studies (Terras et al., 1995; Gao et al., 2000; Zimmerli et al., 2004). Like NLR genes, DEFL proteins are also located as tandem or segmental duplications (Takeuchi and Higashiyama, 2012). Although the exact mechanism of DEFL is unknown, it has been reported that they are involved in plant innate immunity and pollen tube attractant (Takeuchi and Higashiyama, 2012). Therefore, variation within and among DEFL proteins may affect selection pressure on both reproduction and disease resistance in plants (Swanson and Vacquier, 2002).
The GWAS analysis of the MDP polynomial data also revealed a peak that maps in the NLR encoding gene Phvul.011G192400. The NB-ARC domain contains a functional ATPase region that regulates the activity of the protein-mediated plant resistance. The ARC domain contains a carboxy terminus that can stabilize the domain complex. The ARC domain interacts with the nucleotide-binding domain in order to exchange the nucleotides that are associated with activating ATPase. This may destabilize the complex in a way that it goes under conformational change which in turn reshapes a NB-ARC ATPase and alters resistance specificity (Van Ooijen et al., 2008). Therefore, SNP marker Pv11: 50,585,184 bp, which is inside this gene model might be involved in the nucleotide exchange phase and affect the NB-ARC domain function as a molecular switch.
Conclusion
Developing resistant varieties is always a primary goal for plant breeders and multiple genotypes were identified with high levels of resistance to R. solani in both common bean gene pools. The relevance of these results are validated by the development of assay that demonstrates high reproducibility among control lines. In addition, this is the first GWAS study to uncover the genomic regions associated with R. solani resistance in common bean using quantitative and qualitative phenotypic data. The qualitative three class polynomial data yielded the most significant SNPs, however, the raw quantitative data explained more phenotypic variation for both genepools. This study reports strong candidate genes in close proximity to significant SNPs to uncover genetic mechanism of resistance. The significant SNPs within each gene pool can be converted to breeder-friendly markers as efficient and low cost selection tools to identify genotypes resistant to R. solani, the causal agent for Rhizoctonia root rot.
Data Availability
All datasets generated for this study are included in the manuscript and/or the Supplementary Files.
Author Contributions
JP, JO, and KZ-A designed and conceived the experiments. KZ-A and KS performed the experiments in the greenhouse. AO, KZ-A, and SJ performed the data analysis and drafted the manuscript. PM and JP supervised the data analysis. JP, KZ-A, SJ, and AO discussed the results and interpretation of the final data. PM, JP, and JO provided suggestions to improve it. All authors read and approved the final manuscript.
Funding
This work was supported by the United States Department of Agriculture (USDA) Agricultural Marketing Service through the grant 15SCBGPND0026. The contents of the manuscript are solely the responsibility of the authors and do not necessarily represent the official views of the USDA. Northarvest Bean Growers Association also generously provided funding for this project.
Conflict of Interest Statement
The authors declare that the research was conducted in the absence of any commercial or financial relationships that could be construed as a potential conflict of interest.
Acknowledgments
The authors thank Olivia Vaadeland, Robin Lamppa, Jennifer Odom, Amanda Beck, and Chryseis Modderman for assisting in greenhouse disease evaluations.
Supplementary Material
The Supplementary Material for this article can be found online at: https://www.frontiersin.org/articles/10.3389/fpls.2019.00956/full#supplementary-material
Footnotes
- ^ https://hudsonalpha.org/gsc/
- ^ https://phytozome.jgi.doe.gov/pz/portal.html#!info?alias=Org_Pvulgaris
References
Abawi, G. S., Ludwig, J. W., and Gugino, B. K. (2006). Bean root rot evaluation protocols currently used in New York. Ann. Rep. Bean Improv. Coop. 49, 83–84.
Adesemoye, A. O., Orrell, T., and Kodati, S. (2018). Effect of virulence of root rot pathogens and cultivar resistance on disease occurrence in dry beans. Plant Health Prog. 19, 237–241. doi: 10.1094/php-06-18-0034-rs
Altman, D. G., and Bland, J. M. (2011). How to obtain the P value from a confidence interval. BMJ 343:d2304. doi: 10.1136/bmj.d2304
Anderson, N. A. (1982). The genetics and pathology of Rhizoctonia solani. Annu. Rev. Phytopathol. 20, 329–347. doi: 10.1146/annurev.py.20.090182.001553
Ashfield, T., Egan, A., Pfeil, B., Chen, N., Podicheti, R., Ratnaparkhe, M., et al. (2012). Evolution of a complex disease resistance gene cluster in diploid Phaseolus and tetraploid glycine. Plant Physiol. 159, 336–354. doi: 10.1104/pp.112.195040
Beebe, S., Rengifo, J., Gaitan, E., Duque, M. C., and Tohme, J. (2001). Plant genetic resources. Crop Sci. 41, 854–862.
Bilgi, V. N., Bradley, C. A., Khot, S. D., Grafton, K. F., and Rasmussen, J. B. (2008). Response of dry bean genotypes to Fusarium root rot, caused by Fusarium solani f. sp. phaseoli, under field and controlled conditions. Plant Dis. 92, 1197–1200. doi: 10.1094/PDIS-92-8-1197
Bitocchi, E., Bellucci, E., Giardini, A., Rau, D., Rodriguez, M., Biagetti, E., et al. (2013). Molecular analysis of the parallel domestication of the common bean (Phaseolus vulgaris) in Mesoamerica and the Andes. New Phytol. 197, 300–313. doi: 10.1111/j.1469-8137.2012.04377.x
Blair, M. W., Diaz, L. M., Buendia, H. F., and Duque, M. C. (2009). Genetic diversity, seed size associations and populations structure of a core collection of common beans (Phaseolus vulgaris L). Theor. Appl. Genet. 119, 955–972. doi: 10.1007/s00122-009-1064-8
Blair, M. W., Giraldo, M. C., Buendia, H. F., Rovar, E., Duque, M. C., and Beebe, S. E. (2006). Microsatellite marker diversity in common bean. Theor. Appl. Genet. 113, 100–109. doi: 10.1007/s00122-006-0276-4
Bolton, M. D., Panella, L., Campbell, L., and Khan, M. F. (2010). Temperature, moisture, and fungicide effects in managing Rhizoctonia root and crown rot of sugar beet. Phytopathology 100, 689–697. doi: 10.1094/PHYTO-100-7-0689
Burke, D. W., and Kraft, J. M. (1974). Response of beans and peas to root pathogens accumulates during monoculture of each crop species. Phytopathology 64, 546–549.
Carling, D. E., Baird, E. R., Gitaitis, R. D., Brainard, K. A., and Kuninaga, S. (2002). Characterization of AG-13 a newly reported anastomosis group of Rhizoctonia solani. Phytopahtology 92, 893–899. doi: 10.1094/PHYTO.2002.92.8.893
Chassot, C., Nawrath, C., and Métraux, J. P. (2007). Cuticular defects lead to full immunity to a major plant pathogen. Plant J. 49, 972–980. doi: 10.1111/j.1365-313x.2006.03017.x
Cichy, K. A., Porche, T., Beaver, J. S., Cregan, P. B., Fourie, D., Glahn, R., et al. (2015). A Phaseolus vulgaris diversity panel for Andean bean improvement. Crop Sci. 55, 2149–2160.
Conner, R. L., Hou, A., Balasubramanian, P., McLaren, D. L., Henriquez, M. A., Chang, K. F., et al. (2014). Reaction of dry bean cultivars grown in western Canada to root rot inoculation. Can. J. Plant Sci. 94, 1219–1230. doi: 10.4141/cjps2013-416
Datta, K., Velazhahan, R., Oliva, N., Ona, I., Mew, T., Khush, G. S., et al. (1999). Over-expression of the cloned rice thaumatin-like protein (PR-5) gene in transgenic rice plants enhances environmental friendly resistance to Rhizoctonia solani causing sheath blight disease. Theor. Appl. Genet. 98, 1138–1145. doi: 10.1007/s001220051178
DeYoung, B. J., and Innes, R. W. (2006). Plant NBS-LRR proteins in pathogen sensing and host defense. Nat. Immunol. 7, 1243–1249. doi: 10.1038/ni1410
Domhof, S., and Langer, F. (2002). Nonparametric Analysis of Longitudinal Data in Factorial Experiments, Vol. 406. Hoboken, NJ: Wiley-Interscience.
Engelkes, C. A., and Windels, C. E. (1996). Susceptibility of sugar beet and beans to Rhizoctonia solani AG-2-2 IIIB and AG-2-2 IV. Plant Dis. 80, 1413–1417. doi: 10.1094/PHYTO-100-7-0689
Gao, A. G., Hakimi, S. M., Mittanck, C. A., Wu, Y., Woerner, B. M., Stark, D. M., et al. (2000). Fungal pathogen protection in potato by expression of a plant defensin peptide. Nat. Biotechnol. 18, 1307–1310. doi: 10.1038/82436
Gepts, P., Osborn, T. C., Rashka, K., and Bliss, F. A. (1986). Phaseolin-protein variability in wild forms and landraces of the common bean (Phaseolus vulgaris): evidence for multiple center of domestication. Econ. Bot. 40, 451–468. doi: 10.1007/bf02859659
Giacomelli, L., Nanni, V., Lenzi, L., Zhuang, J., Serra, M. D., Banfield, M. J., et al. (2012). Identification and characterization of the defensin-like gene family of grapevine. Mol. Plant Microbe Interact. 25, 1118–1131. doi: 10.1094/MPMI-12-11-0323
Godoy-Lutz, G., Steadman, J. R., Higgins, B., and Powers, K. (2003). Genetic variation among isolates of the web blight pathogen of common bean based on PRC-RFLP of the ITS-rDNA region. Plant Dis. 87, 766–771. doi: 10.1094/PDIS.2003.87.7.766
Guerrero-González, M. L., Rodríguez-Kessler, M., Rodríguez-Guerra, R., González-Chavira, M., Simpson, J., Sanchez, F., et al. (2011). Differential expression of Phaseolus vulgaris genes induced during the interaction with Rhizoctonia solani. Plant Cell Rep. 30, 1465–1473. doi: 10.1007/s00299-011-1055-5
Hagedorn, D. J. (1994). “Rhizoctonia root rot,” in Compendium of Bean Disease, ed. R. Hall (St Paul, MN: American Phytopathological Society Press), 9–13.
Hagerty, C. H., Cuesta-Marcos, A., Cregan, P. B., Song, Q., McClean, P., Noffsinger, S., et al. (2015). Mapping Fusarium solani and Aphanomyces euteiches root rot resistance and root architecture quantitative trait loci in common bean. Crop Sci. 55, 1969–1977.
Hart, J. P., and Griffiths, P. D. (2015). Genotyping-by-sequencing enabled mapping and marker development for the by-2 potyvirus resistance allele in common bean. Plant Genome 8, 1–14. doi: 10.3835/plantgenome2014.09.0058
Jiang, L., Wu, J., Fan, S., Li, W., Dong, L., Cheng, Q., et al. (2015). Isolation and characterization of a novel pathogenesis-related protein gene (GmPRP) with induced expression in soybean (Glycine max) during infection with Phytophthora sojae. PLoS One 10:e0129932. doi: 10.1371/journal.pone.0129932
Jung, H. W., Kim, K. D., and Hwang, B. K. (2005). Identification of pathogen-responsive regions in the promoter of a pepper lipid transfer protein gene (CALTPI) and the enhanced resistance of the CALTPI transgenic Arabidopsis against pathogen and environmental stresses. Planta 221, 361–373. doi: 10.1007/s00425-004-1461-9
Kang, Y. J., Kim, K. H., Shim, S., Yoon, M. Y., Sun, S., Kim, M. Y., et al. (2012). Genome-wide mapping of NBS-LRR genes and their association with disease resistance in soybean. BMC Plant Biol. 12:139. doi: 10.1186/1471-2229-12-139
Koboldt, D. C., Steinberg, K. M., Larson, D. E., Wilson, R. K., and Mardis, E. R. (2013). The next-generation sequencing revolution and its impact on genomics. Cell 155, 27–38. doi: 10.1016/j.cell.2013.09.006
Leister, D. (2004). Tandem and segmental gene duplication and recombination in the evolution of plant disease resistance gene. Trends Genet. 20, 116–122. doi: 10.1016/j.tig.2004.01.007
Liu, D., Raghothama, K. G., Hasegawa, P. M., and Bressan, R. A. (1994). Osmotin overexpression in potato delays development of disease symptoms. Proc. Natl. Acad. Sci. U.S.A. 91, 1888–1992.
Mamidi, S., Rossi, M., Annam, D., Moghaddam, S., Lee, R., Papa, R., et al. (2011). Investigation of the domestication of common bean (Phaseolus vulgaris) using multilocus sequence data. Funct. Plant Biol. 38, 953–967.
Marone, D., Russo, M. A., Laidò, G., De Leonardis, A. M., and Mastrangelo, A. M. (2013). Plant nucleotide binding site–leucine-rich repeat (NBS-LRR) genes: active guardians in host defense responses. Int. J. Mol. Sci. 14, 7302–7326. doi: 10.3390/ijms14047302
Mathew, F. M., Lamppa, R. D., Chittem, K., Chang, Y. W., Botschner, M., Kinzer, K., et al. (2012). Characterization and pathogenicity of Rhizoctonia solani isolates affecting Pisum sativum in North Dakota. Plant Dis. 96, 666–672. doi: 10.1094/PDIS-02-11-0087
McClean, P. E., Bett, K., Stonehouse, R., Lee, R., Pflieger, S., Moghaddam, S. M., et al. (2018). White seed color in common bean (Phaseolus vulgaris) results from convergent evolution in the P (pigment) gene. New Phytol. 219, 1112–1123. doi: 10.1111/nph.15259
McHale, L., Tan, X., Koehl, P., and Michelmore, R. W. (2006). Plant NBS-LRR proteins: adaptable guards. Genome Biol. 7:212. doi: 10.1186/gb-2006-7-4-212
Meyers, B. C., Kozik, A., Griego, A., Kuang, H., and Michelmore, R. W. (2003). Genome-wide analysis of NBS-LRR-encoding genes in Arabidopsis. Plant Cell 15, 809–834. doi: 10.1105/tpc.009308
Moghaddam, S. M., Mamidi, S., Osorno, J. M., Lee, R., Brick, M., Kelly, J., et al. (2016). Genome-wide association study identifies candidate loci underlying agronomic traits in a Middle American diversity panel of common bean. Plant Genome 9, 1–21. doi: 10.3835/plantgenome2016.02.0012
Monosi, B., Wisser, R. J., Pennill, L., and Hulbert, S. H. (2004). Full-genome analysis of resistance gene homologues in rice. Theor. Appl. Genet. 109, 1434–1447. doi: 10.1007/s00122-004-1758-x
Muyolo, N. G., Lipps, P. E., and Schmitthenner, A. F. (1993). Reaction of dry bean, lima bean, and soybean cultivars to Rhizoctonia root and hypocotyl rot and web blight. Plant Dis. 77, 234–238.
Nakedde, T., Ibarra-Perez, F. J., Mukankusi, C., Waines, J. G., and Kelly, J. D. (2016). Mapping of QTL associated with Fusarium root rot resistance and root architecture traits in black beans. Euphytica 212, 51–63. doi: 10.1007/s10681-016-1755-6
Nicoli, A., Zambolim, L., Paula Júnior, T. J., Vieira, R. F., Teixeira, H., and Carneiro, J. E. S. (2012). Resistance of advanced common bean lines to Fusarium root rot. Trop. Plant Pathol. 37, 393–398. doi: 10.1590/s1982-56762012000600003
Oladzad, A., Porch, T., Rosas, J. C., Mafi Moghaddam, S., Beaver, J., Beebe, S., et al. (2019). Single and multi-trait GWAS identify genetic factors associated with production traits in common bean under abiotic stress environments. G3 9, 1881–1892. doi: 10.1534/g3.119.400072
Pannecoucque, J., and Hofte, M. (2009). Interactions between cauliflower and Rhizoctonia anastomosis groups with different levels of aggressiveness. BMC Plant Biol. 9:95. doi: 10.1186/1471-2229-9-95
Park, D. J., and Rupert, T. (2000). Breeding for root rot resistance in common bean (Phaseolus vulgaris L.). Ann. Rep. Bean Improv. Coop. 43, 41–42. doi: 10.3389/fpls.2018.00767
Peña, P. A., Steadman, J. R., Eskridge, K. M., and Urrea, C. A. (2013). Identification of sources of resistance to damping-off and early root/hypocotyl damage from Rhizoctonia solani in common bean (Phaseolus vulgaris L.). Crop Prot. 54, 92–99. doi: 10.1016/j.cropro.2013.04.014
Perseguini, J. M., Oblessuc, P. R., Rosa, J. R., Gomes, K. A., Chiorato, A. F., Carbonell, S. A., et al. (2016). Genome-wide association studies of anthracnose and angular leaf spot resistance in common bean (Phaseolus vulgaris L.). PLoS One 11:e0150506. doi: 10.1371/journal.pone.0150506
Price, A. L., Patterson, N. J., Plenge, R. M., Weinblatt, M. E., Shadick, N. A., and Reich, D. (2006). Principal components analysis corrects for stratification in genome-wide association studies. Nat. Genet. 38, 904–909. doi: 10.1038/ng1847
Reddy, M. S., Hynes, R. K., and Lazarovits, G. (1993). Relationship between in vitro growth inhibition of pathogens and suppression of preemergence damping-off and postemergence root rot of white bean seedlings in the greenhouse by bacteria. Can. J. Microbiol. 40, 113–119. doi: 10.1139/m94-018
Román-Avilés, B., and Kelly, J. D. (2005). Identification of quantitative trait loci conditioning resistance to Fusarium root rot in common bean. Crop Sci. 45, 1881–1890.
Schmutz, J., McClean, P. E., Mamidi, S., Wu, G. A., Cannon, S. B., Grimwood, J., et al. (2014). A reference genome for common bean and genome-wide analysis of dual domestications. Nat. Gen. 46:707. doi: 10.1038/ng.3008
Schröder, S., Mamidi, S., Lee, R., McKain, M. R., McClean, P. E., and Osorno, J. M. (2016). Optimization of genotyping by sequencing (GBS) data in common bean (Phaseolus vulgaris L.). Mol. Breed. 6, 1–9. doi: 10.1007/s11032-015-0431-1
Shah, D. A., and Madden, L. V. (2004). Nonparametric analysis of ordinal data in designed factorial experiments. Phytopathology 94, 33–43. doi: 10.1094/PHYTO.2004.94.1.33
Shi, C., Navabi, A., and Yu, K. (2011). Association mapping of common bacterial blight resistance QTL in Ontario bean breeding populations. BMC Plant Biol. 11:52. doi: 10.1186/1471-2229-11-52
Singh, S. P., Gutrierrez, J. A., Molina, A., Urrea, C., and Gepts, P. (1991). Genetic diversity in cultivated common bean: II Marker-based analysis of morphological and agronomic traits. Crop Sci. 31, 23–29.
Singh, S. P., and Schwartz, H. F. (2010). Breeding common bean for resistance to diseases: a review. Crop Sci. 50, 2199–2223.
Sneh, B., Burpee, L., and Ogoshi, A. (1991). Identification of Rhizoctonia species. St. Paul, MN: American Phytopathological Society Press, 1–133.
Soltani, A., MafiMoghaddam, S., Oladzad-Abbasabadi, A., Walter, K., Kearns, P. J., Vasquez-Guzman, J., et al. (2018). Genetic analysis of flooding Tolerance in an Andean diversity panel of dry bean (Phaseolus vulgaris L.). Front. Plant Sci. 9:767. doi: 10.3389/fpls.2018.00767
Soltani, A., MafiMoghaddam, S., Walter, K., Restrepo-Montoya, D., Mamidi, S., Schroder, S., et al. (2017). Genetic architecture of flooding tolerance in the dry bean middle-american diversity panel. Front. Plant Sci. 8:1183. doi: 10.3389/fpls.2017.01183
Stodart, B. J., Harvey, P. R., Neate, S. M., Melanson, D. L., and Scott, E. S. (2007). Genetic variation and pathogenicity of anastomosis group 2 isolates of Rhizoctonia solani in Australia. Mycol. Res. 111, 891–900. doi: 10.1016/j.mycres.2007.05.008
Sun, G., Zhu, C., Kramer, M. H., Yang, S. S., Song, W., Piepho, H. P., et al. (2010). Variation explained in mixed-model association mapping. Heredity 105, 333–340. doi: 10.1038/hdy.2010.11
Swanson, W. J., and Vacquier, V. D. (2002). The rapid evolution of reproductive proteins. Nat. Rev. Genet. 3, 137–144. doi: 10.1038/nrg733
Takeuchi, H., and Higashiyama, T. (2012). A species-specific cluster of defensin-like genes encodes diffusible pollen tube attractants in Arabidopsis. PLoS Biol. 10:e1001449. doi: 10.1371/journal.pbio.1001449
Terras, F. R., Eggermont, K., Kovaleva, V., Raikhel, N. V., Osborn, R. W., Kester, A., et al. (1995). Small cysteine-rich antifungal proteins from radish: their role in host defense. Plant Cell 7, 573–588. doi: 10.1105/tpc.7.5.573
Tock, A. J., Fourie, D., Walley, P. G., Holub, E. B., Soler, A., Cichy, K. A., et al. (2017). Genome-wide linkage and association mapping of halo blight resistance in common bean to race 6 of the globally important bacterial pathogen. Front. Plant Sci. 8:1170. doi: 10.3389/fpls.2017.01170
Tu, J. C. (1992). Management of root rot diseases of peas, beans, and tomatoes. Can. J. Plant Pathol. 14, 92–99. doi: 10.1080/07060669209500910
United States Dry Bean Council (2017). Available at: https://www.usdrybeans.com/industry/production-facts/ (accessed December, 2017).
Van Ooijen, G., Mayr, G., Kasiem, M. M., Albrecht, M., Cornelissen, B. J., and Takken, F. L. (2008). Structure–function analysis of the NB-ARC domain of plant disease resistance proteins. J. Exp. Bot. 59, 1383–1397. doi: 10.1093/jxb/ern045
Van Schoonhoven, A., and Pastor-Corrales, M. (1987). Standard System for the Evaluation of Bean Germplasm. Cali: Centro Internacional de Agricultura Tropical, 36–38.
Vasquez-Guzman, J. (2016). Identifying Dry Bean Genotypes and Genomic Regions Associated with Root Rot Resistance with Emphasis on Fusarium solani F. sp. phaseoli. Ph D thesis. North Dakota State University: Fargo, ND.
White, T. J., Bruns, T., Lee, S., and Taylor, J. W. (1990). “Amplification and direct sequencing of fungal ribosomal RNA genes for phylogenetics”,” in PCR Protocols: A Guide to Methods and Applications, eds M. A. Innis, D. H. Gelfand, J. J. Sninsky, and T. J. White (New York, NY: Academic Press), 315–322. doi: 10.1016/b978-0-12-372180-8.50042-1
Wong, F. P., and Wilcox, W. F. (2000). Distribution of baseline sensitivities to azoxystrobin among isolates of Plasmopara viticola. Plant Dis. 84, 275–281. doi: 10.1094/PDIS.2000.84.3.275
Wu, J., Zhu, J., Wang, L., and Wang, S. (2017). Genome-wide association study identifies NBS-LRR-Encoding genes related with anthracnose and common bacterial blight in the common bean. Front. Plant Sci. 8: 1398. doi: 10.3389/fpls.2017.01398
Zhao, G., Ablett, G. R., Anderson, T. R., Rajcan, I., and Schaafsma, A. W. (2005). Inheritance and genetic mapping of resistance to rhizoctonia root and hypocotyl rot in soybean. Crop Sci. 45, 1441–1447.
Zhou, X., and Stephens, M. (2012). Genome-wide efficient mixed-model analysis for association studies. Nat. Genet. 44, 821–824. doi: 10.1038/ng.2310
Zhou, X., and Stephens, M. (2014). Efficient multivariate linear mixed model algorithms for genome-wide association studies. Nat. Methods 11, 407–409. doi: 10.1038/nmeth.2848
Zhu, L., Zhang, X., Tu, L., Zeng, F., Nie, Y., and Guo, X. (2007). Isolation and characterization of two novel dirigent-like genes highly induced in cotton (Gossypium barbadense and G. hirsutum) after infection by Verticillium dahliae. J. Plant Path. 89, 41–45.
Zimmerli, L., Stein, M., Lipka, V., Schulze-Lefert, P., and Somerville, S. (2004). Host and non-host pathogens elicit different jasmonate/ethylene responses in Arabidopsis. Plant J. 40, 633–646. doi: 10.1111/j.1365-313x.2004.02236.x
Keywords: Phaseolus vulgaris, GWAS, quantitative resistance, rhizoctonia, root rot
Citation: Oladzad A, Zitnick-Anderson K, Jain S, Simons K, Osorno JM, McClean PE and Pasche JS (2019) Genotypes and Genomic Regions Associated With Rhizoctonia solani Resistance in Common Bean. Front. Plant Sci. 10:956. doi: 10.3389/fpls.2019.00956
Received: 09 May 2019; Accepted: 09 July 2019;
Published: 24 July 2019.
Edited by:
Roberto Papa, Marche Polytechnic University, ItalyReviewed by:
Ana Campa, Servicio Regional de Investigación y Desarrollo Agroalimentario (SERIDA), SpainJames Kelly, Michigan State University, United States
Copyright © 2019 Oladzad, Zitnick-Anderson, Jain, Simons, Osorno, McClean and Pasche. This is an open-access article distributed under the terms of the Creative Commons Attribution License (CC BY). The use, distribution or reproduction in other forums is permitted, provided the original author(s) and the copyright owner(s) are credited and that the original publication in this journal is cited, in accordance with accepted academic practice. No use, distribution or reproduction is permitted which does not comply with these terms.
*Correspondence: Atena Oladzad, YXRlbmEub2xhZHphZEBORFNVLmVkdQ==; Julie S. Pasche, anVsaWUucGFzY2hlQE5EU1UuZWR1