 Cong Li1
 Hurong Yu1
 Cheng Li1
 Tianlun Zhao1
 Yating Dong1
 Xiaolei Deng1
 Jiahui Hu1
 Yi Zhang1
 Fan Zhang1
 M. K. Daud1,2
 Jinhong Chen1
 Shuijin Zhu1*
- 1Department of Agronomy, Zhejiang University, Hangzhou, China
- 2Department of Biotechnology and Genetic Engineering, Kohat University of Science and Technology, Kohat, Pakistan
An “immortalized F2” (IF2) population and two reciprocal backcross (HSBCF1 and MARBCF1) populations were constructed to investigate the genetic bases of fiber quality traits in upland cotton across four different environments. A relatively high level of heterosis for micronaire (MIC) in IF2 population as well as fiber length (FL) and MIC in MARBCF1 population was observed. A total of 167 quantitative trait loci (QTLs) were detected in the three related experimental populations and their corresponding midparental heterosis (MPH) datasets using the composite interval mapping (CIM) approach. An analysis of genetic effects of QTLs detected in different populations and their MPH datasets showed 16 (24.24%) QTLs of partial dominance, and 46 (69.70%) QTLs of overdominance were identified in an IF2 population; 89 (62.68%) additive QTLs, three (2.11%) partial dominant QTLs, and 49 (34.51%) over-dominant QTLs were detected in two BCF1 populations. Multi-environment analysis showed 48 and 56 main-QTLs (m-QTLs) and 132 and 182 epistasis-QTLs (e-QTLs), by inclusive composite interval mapping (ICIM) in IF2 and two BCF1 populations, respectively. Phenotypic variance explained by e-QTLs, except for MARBCF1 population, was higher than that by m-QTLs. Thus, the overdominant, partial dominant, and epistasis effects were the main causes of heterosis in the IF2 population, whereas the additive, overdominant, and epistasis effects were the primary genetic basis of heterosis in the two BCF1 populations. Altogether, additive effect, partial dominance, overdominance, and epistasis contributed to fiber quality heterosis in upland cotton, but overdominance and epistasis were the most important factors.
Introduction
Cotton (Gossypium sp.) is the most widely cultivated natural fiber source worldwide. There are two cultivated tetraploid cotton species, Gossypium hirsutum L. and G. barbadense L. The most important cotton species, upland cotton (G. hirsutum L.), accounts for ~95% of the overall cotton production (Sun et al., 2012). Fiber quality is the most important factor in the textile industry. Poor fiber quality is the greatest concern for the major cotton producing countries, including China, and its improvement has been a priority for cotton breeders. Fiber quality traits are quantitative in nature and possess complex genetic mechanisms. They show different genetic characteristics in different populations and are easily influenced by varied environments (Shen et al., 2005; Sun et al., 2012; Zhang et al., 2012; Tan et al., 2014). Furthermore, significant heterosis exists in fiber quality traits of upland cotton (Meredith and Bridge, 1972; Tang et al., 1993). Marker-assisted selection (MAS) is one of the most effective methods to improve such complex traits and has been greatly exploited by cotton breeders over the past three decades. To date, more than 1,000 quantitative trait loci (QTLs) related to fiber quality traits have been published (Shen et al., 2005; Wu et al., 2008; Sun et al., 2012; Zhang et al., 2012; Said et al., 2013, 2015; Tan et al., 2014; Wang et al., 2016). Most of these QTLs have been detected based on interspecific segregating populations between G. hirsutum L. and G. barbadense L. However, the use of these fiber quality QTLs in upland cotton breeding has some limitations. For example, some significant QTLs (alleles) from G. barbadense L. often cannot be found in G. hirsutum L., and markers with polymorphisms between the two species are likely to be monomorphic in G. hirsutum L. (Lacape et al., 2005; Yu et al., 2013). On the other hand, owing to the low level of intraspecific polymorphism among the upland cotton cultivars, genetic maps that use simple sequence repeat (SSR) markers in upland cotton intraspecific populations present low density (Zhang et al., 2012; Tan et al., 2014). Recently, based on intraspecific populations, QTL detection using single nucleotide polymorphism (SNP) markers, with their abundant genetic variation, has been developed as a superior strategy (Li et al., 2016; Zhang et al., 2016).
Hybrids show more vigor and adaptivity than their parents, a common phenomenon known as heterosis (Shull, 1914). Heterosis contributes greatly to the production of hybrid cultivars; however, there is limited understanding about its genetic basis. Early explanations focused on the fact that two parents frequently donate different alleles at any given locus in the hybrid. It has been proposed that dominance and/or overdominance provides the heterozygote an advantage by operating between these alleles (Richey, 1942; Stuber et al., 1992; Li et al., 2001; Birchler et al., 2010), while a competing hypothesis states that epistasis is the main contributor of heterosiss (Hull, 1945; Crow, 1948; Williams, 1959; Minvielle, 1987; Yu et al., 1997; Li et al., 2001). There have been numerous studies on the genetic analyses of different crops, favoring one or the other of these hypotheses (Richey, 1942; Hull, 1945; Crow, 1948; Williams, 1959; Minvielle, 1987; Stuber et al., 1992; Li et al., 2001; Birchler et al., 2010).
Genetic analysis of hybrid cultivars based on genetic maps is an effective strategy. It is necessary to have a suitable experimental design to examine the molecular basis of heterosis. In 1952, Comstock and Robinson devised the North Carolina design III (Design III) mating scheme, which was the original use of backcross designs to analyze heterosis. Stuber et al. (1992) studied maize heterosis based on a modified Design III produced from F3 families and concluded that overdominance was the main cause of grain yield heterosis. Other maize researchers also reached a similar conclusion (Lu et al., 2003; Lariepe et al., 2012). Xiao et al. (1995) explored heterosis in two rice BC1F7 populations and observed that dominance was the major cause. By reanalyzing the observed phenotype values of maize (Stuber et al., 1992) and rice (Xiao et al., 1995) using the method of multiple-interval mapping (MIM), Garcia et al. (2008) indicated that the dominant effect was the main contributor to the heterosis of maize, whereas in rice, additive × additive epistatic interactions could be the major cause. Luo et al. (2009) explored the basis of heterosis in rice based on recombinant inbred lines (RILs) and two BCF1 populations and found that additive and overdominant effects of epistatic loci were the main cause. Jiang et al. (2014) developed a double haploid (DH) population and two BCF1 populations to detect QTLs for the chlorophyll content of rice leaves. Their results showed that overdominance could adequately explain the genetic basis of heterosis in rice.
An “immortalized F2” (IF2) population derived from pair crosses of RILs was constructed; some researchers used it to detect heterotic loci (HL), instead of traditional QTLs, to explain the genetic basis of complete or partial dominance, overdominance, and epistasis (Hua et al., 2002, 2003; Tang et al., 2010; Zhou et al., 2012; Guo et al., 2014). Hua et al. (2002, 2003) first introduced the rice IF2 population and discovered that heterotic effects at the single-locus level, in combination with dominance by dominance epistatic effects, were the main cause of the genetic basis of yield heterosis. In maize, based on an IF2 population, Tang et al. (2010) demonstrated that dominance effects of HL, at the single-locus level as well as additive × additive interactions, was important for heterosis of grain yield and its components. With the same experimental design and materials, Guo et al. (2014) reanalyzed the genetic basis of yield heterosis based on a reconstructed high-density linkage map. The results showed that dominance contributed more to heterosis than to other genetic effects among all traits. In addition, overdominance and epistasis contributed to yield heterosis as well.
Both IF2 and BCF1 populations are good materials for studying heterosis, owing to the advantages of stable genotype and repeatable experiments, which can detect additive and dominant effects simultaneously. Usually, stably expressed QTLs in multiple environments are highly favored in MAS. Thus, constructing different segregating populations from the same parental combination, identifying QTLs, and evaluating their expression levels and genetic basis of heterosis under multiple environments will allow us to map stable QTLs and accelerate the breeding process of better fiber quality species. Recently, a few studies on QTL mapping across multiple populations have been reported (Shen et al., 2005; Sun et al., 2012; Yu et al., 2013; Zhang et al., 2015), but the study of heterosis with related segregating populations has not been reported in upland cotton.
Most of the previous studies have focused on the heterosis of yield traits in upland cotton (Meredith, 1990; Guo et al., 2013; Shang et al., 2016), but little attention has been paid to the heterosis of fiber traits (Meredith and Bridge, 1972; Meredith, 1990; Tang et al., 1993). In the present study, based on the high-density SNP intraspecific genetic map, the IF2 population, two BCF1 populations, and their midparental heterosis (MPH) datasets were used simultaneously to analyze the genetic effects of heterosis for fiber quality traits. The main objectives were to characterize the genetic components in cotton, including additive effect, partial dominance/dominance, overdominance, and epistasis as well as their relative contributions to fiber quality heterosis. This study may have meaningful implications in exploring the genetic basis of fiber quality heterosis in upland cotton.
Materials and Methods
Plant Materials and Construction of Population
A population of 188 F8 RILs, derived by a modified single-seed procedure (Wu et al., 2008) from a cross between two elite upland cotton germplasms, HS46 and MARCABUCAG8US-1-88, was used to produce three new genetic populations based on the experimental design. To produce the IF2 population, 188 RILs were planted randomly and 188 crosses were made as follows: the 1st line was used as the female crossed with the 2nd line to produce the 1st cross, and the 2nd line was used as the female at the same time crossed with the 3rd line to produce the 2nd cross. Thus, each RIL was used as a female parent in one cross and a male parent in another cross. This procedure was repeated twice and a total of 376 crosses were developed to form the IF2 population, including 376 hybrids. The second and third populations were two backcross populations derived from a modified Design III based on RILs (Comstock and Robinson, 1952; Frascaroli et al., 2007), in which two parents were used as the male parents backcrossed with the RILs. Each of the two backcross populations contained 188 lines named as HSBCF1 and MARBCF1, referring to 188 RILs backcrossed with HS46 (HS) and MARCABUCAG8US-1-88 (MAR), respectively.
Field Planting and Phenotypic Measurement
Parent, IF2, and the two BCF1 populations were planted in two different regions, Yacheng (inland climate) and Baogang (coastal climate) of Sanya, Hainan Province, China, during two winter seasons of 2014 and 2015. Each location and the populations of IF2, HSBCF1, and MARBCF1 were arranged independently in the same field; each population was evaluated in a completely randomized block design with two replications. Each plot included one row of 5.6 m2. Management of the fields followed normal agricultural practices.
In each line, 20 normally open bolls were hand-harvested to measure fiber quality traits with HVI 1000 (USTER®HVISPECTRUM, SPINLAB, United States) in the Cotton Quality Supervision, Inspection and Testing Center, Ministry of Agriculture, Anyang, Henan province, China. Fiber quality traits were fiber length (FL, mm), fiber length uniformity (FU, %), micronaire (MIC), fiber elongation (FE, %), and fiber strength (FS, cN.tex−1).
Genotype Analysis and Linkage Maps
The molecular marker data for the RIL population were as previously described (Li et al., 2016). A total of 3,120 SNP markers were selected to genotype the RILs, and a high-density linkage map was constructed, including 2,618 loci with a total length of 1784.28 cM. The genotypes for each cross in the IF2, HSBCF1, and MARBCF1 populations were deduced from the RILs and the original parents that were used as the parents for the crosses.
Data Analysis and QTL Mapping
Each year-location was analyzed as an independent environment. A one-way ANOVA was performed to calculate the significance of difference for each trait between the two parent lines, and descriptive statistics, including mean value, maximal value, and minimal value, was performed to analyze the univariate phenotypic data of the IF2, HSBCF1, and MARBCF1 populations using SPSS 20.0. Broad-sense heritability (H2) was estimated as H2 = VG/(VG+ VGE /e+ Vε/re), where VG is genetic variance, VGE is genotype × environment interaction variance, Vε is error variance, and e and r are the numbers of environments and replicates, respectively. The minimum norm quadratic unbiased estimation (MINQUE) approach was used to estimate the VG, VGE, and Vε (Zhu, 1989) using QGA Station 2.0 (http://ibi.zju.edu.cn/software/index.html).
The MPH of each F1 in the IF2, HSBCF1, and MARBCF1 populations was estimated as MPH = F1 − MP (Hua et al., 2003), and the MPH percent was calculated as MPH (%) = 100 × (F1 − MP)/MP, where F1 represented the observations of each line in the IF2, HSBCF1, and MARBCF1 populations, and MP represented the average trait value between the corresponding parents. The direct measured trait values and MPH of the IF2, HSBCF1, and MARBCF1 populations were used separately as input data in each environment (Mei et al., 2005).
The analysis of QTL was conducted independently for the IF2, HSBCF1, and MARBCF1 experiments. Single-locus QTL detection was performed with the composite interval mapping (CIM) approach using the WinQTL Cartographer 2.5 (Wang et al., 2012). The logarithm of odds (LOD) threshold of significant QTLs was performed by 1,000 permutation tests (P < 0.05). The MPH datasets only identified the dominance effect under the genetic model of CIM, where the QTLs showed significant difference in heterosis between F1 hybrids and the mean values of their two parents (Hua et al., 2003). The QTLs were named as “q + trait abbreviation + chromosome number + QTL number.” A diagrammatic representation of the genetic map and QTLs was made using Map Chart 2.2 (Voorrips, 2002).
The definition of gene actions in the IF2 and BCF1 populations were as follows: a = (P1P1 − P2P2)/2, d = (P1P2 − (P1P1 + P2P2)/2), BCF1 = (a + d). Here, P1 and P2 indicate the parents, P1P1 and P2P2 stand for the effects of homozygous genotype observed in the IF2 or BCF1 populations, and P1P2 indicates the effects of the heterozygous genotype in hybrids. The mode of action was estimated for each QTL based on the absolute value of the ratio of dominance and additive effects (|d/a|) (Luo et al., 2009; Liu et al., 2011; Guo et al., 2013; Shang et al., 2016). The assessment of the degree of dominance showed that difference existed between the IF2 and BCF1 populations. For the IF2 population, if |d/a| > 1 or if it was only identified in MPH data, the QTL was considered as an overdominant locus. Otherwise, the QTLs were considered to be a complete or partial dominant locus. |d/a| was estimated in two ways, both a and d were estimated from the QTL detected in the IF2 dataset when a QTL was only found in the IF2 dataset; a was from the RILs and d was from the MPH dataset for a QTL detected simultaneously in the RILs and the IF2MPH datasets and not for the IF2 dataset. When a QTL was present in all three datasets, the value of |d/a| in the IF2 dataset is the criterion. For the BCF1 populations, the overdominant locus was expected for a QTL meeting the following conditions: (1) only detectable for MPH dataset; (2) 2 × d in the MPH dataset was higher than an estimate in the BCF1 performance (a + d), that is, 2|d| (MPHs) > |a + d| (BCF1s) (equal to |d/a| > 1); (3) a was from the RILs and d was from the MPH dataset with |d/a| >1 for a QTL detected simultaneously in the RILs and the MPH dataset. Otherwise, the QTL was referred to as a complete or partial dominant locus. The QTLs detected only in the BCF1 dataset were referred to as additive. When a QTL was present in all three datasets, the calculated value based on the BCF1 dataset and MPH dataset is the criterion. The RILs data were from our previous report (Li et al., 2016).
Based on the direct measurements of the traits and MPH datasets of the IF2, HSBCF1, and MARBCF1 populations, a combined multiple-environment model analysis that tests the main-effect QTLs (m-QTLs), epistatic QTLs (e-QTLs), and their environmental interactions (QTL × environment, QE), was performed with the inclusive composite interval mapping (ICIM) method using IciMapping 4.1 (Li et al., 2007). The analyses of additive effect and epistasis were performed with pre-adjusted IciMapping parameters, Scan = 1 cM/PIN = 0.0001 and Scan = 5 cM/PIN = 0.0001, respectively. The threshold LOD score for declaring m-QTLs and e-QTLs was implemented by a 1,000-permutation test (P < 0.05). The naming of the detected m-QTLs used the form “dataset abbreviation + maq (multi-environment additive QTL) + trait abbreviation – chromosome number – QTL number.” The e-QTLs identified were named using the dataset abbreviation, followed by “meq” (multi-environment epistatic QTL) and then with the abbreviation of trait and, finally, the QTL pair number. The details of dataset abbreviations were as follows: the IF2, HSBCF1, and MARBCF1 populations were abbreviated to “I,” “B1,” and “B2,” respectively, and their corresponding MPH datasets were denoted by adding “M” after the population abbreviation, that is, “IM,” “B1M,” “B2M.”
Results
Performance of Fiber Quality Traits
The measurements of fiber quality traits for the IF2, HSBCF1, and MARBCF1 populations as well as for the two parents are shown in Table 1. Except for FE, the other fiber quality traits of parent HS46 were significantly better than that of another parent, MARCABUCAG8US-1-88. In the IF2, HSBCF1, and MARBCF1 populations, a wide range of variation was found in fiber quality traits (Table 1). Furthermore, in all four environments, obvious transgressive segregation was observed.
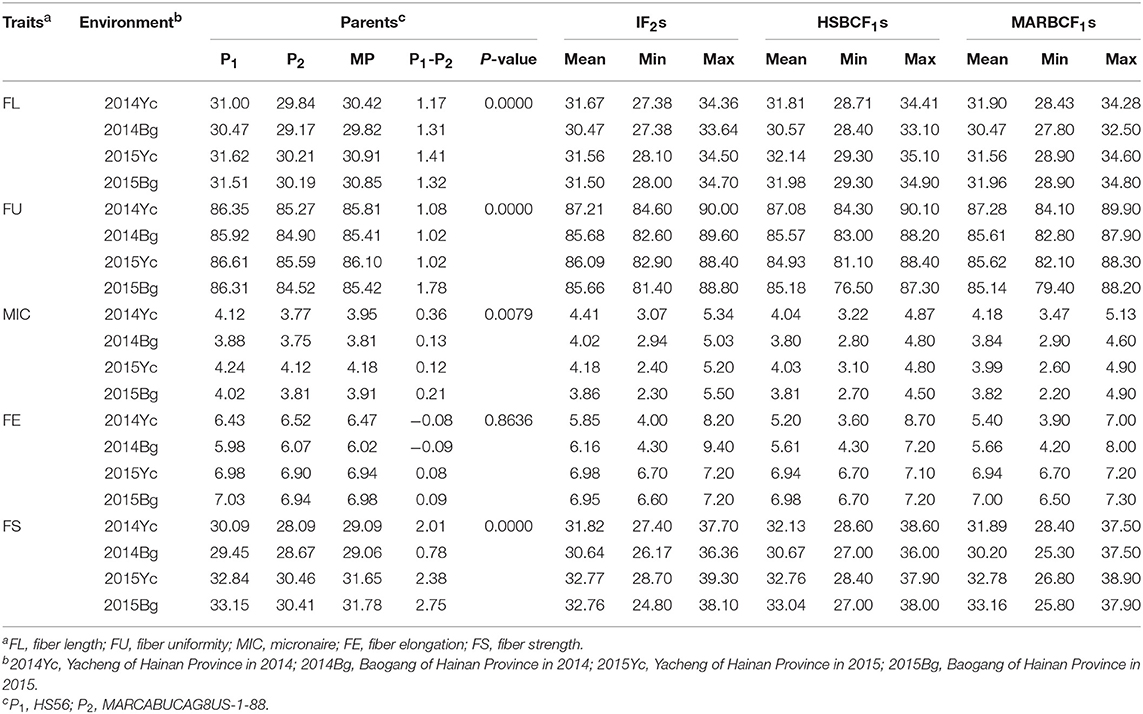
Table 1. Phenotypic variation of fiber quality traits for the upland cotton IF2, HSBCF1, and MARBCF1 populations and their parents.
In the IF2, HSBCF1, and MARBCF1 populations, the heterosis value varied widely in all fiber quality traits, that is, from negative to highly positive (Table 2 and Supplementary Table S1). Higher levels and positive heterosis for FL, MIC, FS, and FU were observed in the IF2 and two BCF1 populations, whereas FE showed lower levels or negative heterosis in these three populations.
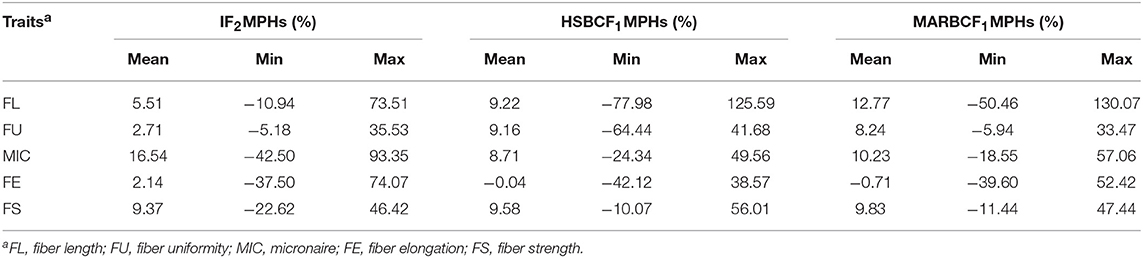
Table 2. MPH percent of fiber quality traits in IF2, HSBCF1, and MARBCF1 populations across four environments.
Some differences in heterosis for the same trait were found in different populations across the four environments. For FL, the order of the mean values of heterosis was MARBCF1 (12.77%) > HSBCF1 (9.22%) > IF2 (5.51%). The mean values of heterosis of FS showed the same trend as FL in different populations, which were 9.83, 9.58, and 9.37% in the IF2, HSBCF1, and MARBCF1 populations, respectively. For FU, the HSBCF1 (9.16%) and MARBCF1 (8.24%) populations showed higher heterosis, whereas the IF2 population exhibited lower heterosis (2.71%). For MIC, high levels of heterosis were observed in all three populations, and the order of the mean values of heterosis was IF2 (16.54%) > MARBCF1 (10.23%) > HSBCF1 (8.71%). In contrast, FE exhibited low levels of heterosis in the IF2 populations and negative heterosis in the two BCF1 populations.
Several inconsistencies were found between the different environments (Supplementary Table S1). In all three populations, lower MPH (%) was observed for MIC and FS in 2015Yc and 2015Bg than in 2014Yc and 2014Bg. In the 2014Yc environment, the heterosis values were 0.53 (18.98%), 0.45 (14.18%), and 0.68 (15.14%) for MIC in the IF2, HSBCF1, and MARBCF1 populations, respectively, and they were 0.49 (19.64%), 0.41 (12.54%), and 0.39 (12.66%), respectively, in the 2014Bg environment; whereas in the 2015Yc and 2015Bg environments, the heterosis values of MIC in all three populations were lower. The same trend was found for FS, probably attributed to high temperatures and rainy conditions in 2015 in Sanya, which affected the cotton fiber development. Low levels or negative heterosis was exhibited by FE in all environments, probably due to the lack of significant difference between the two original parents.
Within each of the populations, MPH values of hybrids varied considerably (Supplementary Table S2). Most of the trait values of extreme lines exceeded those of the MP value of their parents and showed high MPH in all environments. For example, the mean heterosis of the top 10 high-heterosis hybrids of MIC were more than 30% in the four environments of all three populations, except in the 2014Yc experiment of the HSBCF1 population.
The broad-sense heritability was also analyzed using measurement data of the four environments (Table 3). In the IF2, HSBCF1, and MARBCF1 populations, data related to fiber quality exhibited a similar range of heritability from 30.02 to 79.60%, 24.58 to 80.96%, and 26.87 to 80.05%, respectively, which showed significant genetic and environmental effects. Fiber length had almost the highest heritability in all three populations, which was generally consistent with the literature (Qin et al., 2008; Wang et al., 2015; Li et al., 2016). Interestingly, the heritability of all traits in the two BCF1 populations was highly consistent, which might be related to their closer genetic basis.
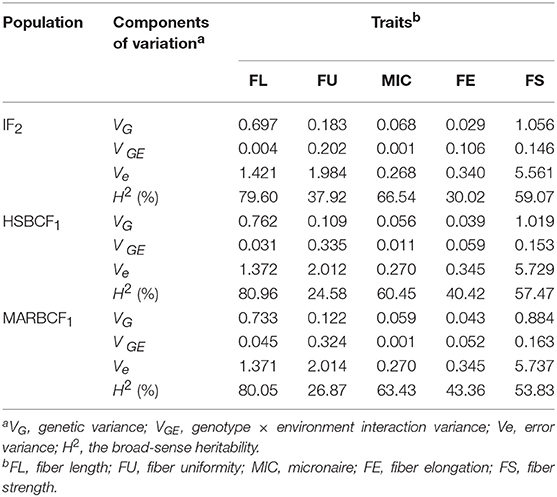
Table 3. Analysis of variance (ANOVA) for fiber quality traits in three populations across four environments.
QTL Analysis of Fiber Quality in IF2 Population, Two BCF1 Populations, and Their MPH Datasets
A genetic map was constructed in our previous study (Li et al., 2016). A total of 167 QTLs related to fiber quality were detected by CIM analysis in the IF2, HSBCF1, MARBCF1 datasets and their MPH datasets, explaining 3.00–24.73% of the total phenotypic variation (PV) (Figure 1 and Supplementary Table S3). Among the 167 QTLs, 68 QTLs were detected in more than two datasets or environments, 31 of which were detected in both years (Table 4).
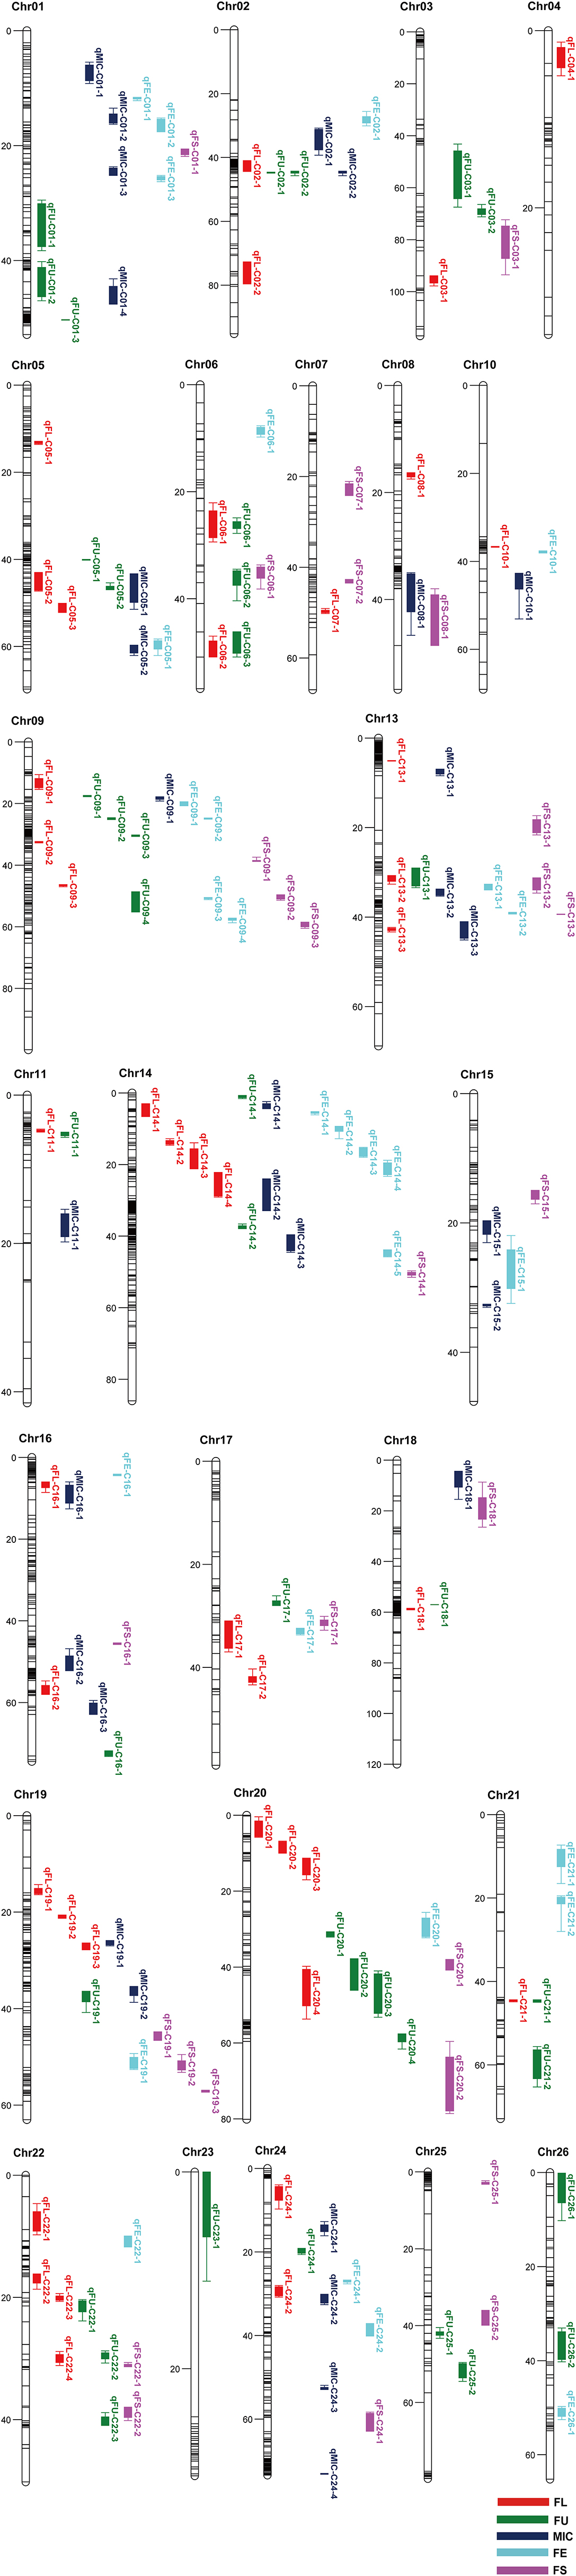
Figure 1. Chromosomal location of QTLs for fiber quality traits in IF2, HSBCF1, MARBCF1, IF2MPH, HSBCF1MPH, and MARBCF1MPH datasets across four environments. Map distances were given in centimorgans (cM). Solid bars with different colors represent different traits, and the legend is given at the end of figure. FL, fiber length; FU, fiber uniformity; MIC, micronaire; FE, fiber elongation; FS, fiber strength.
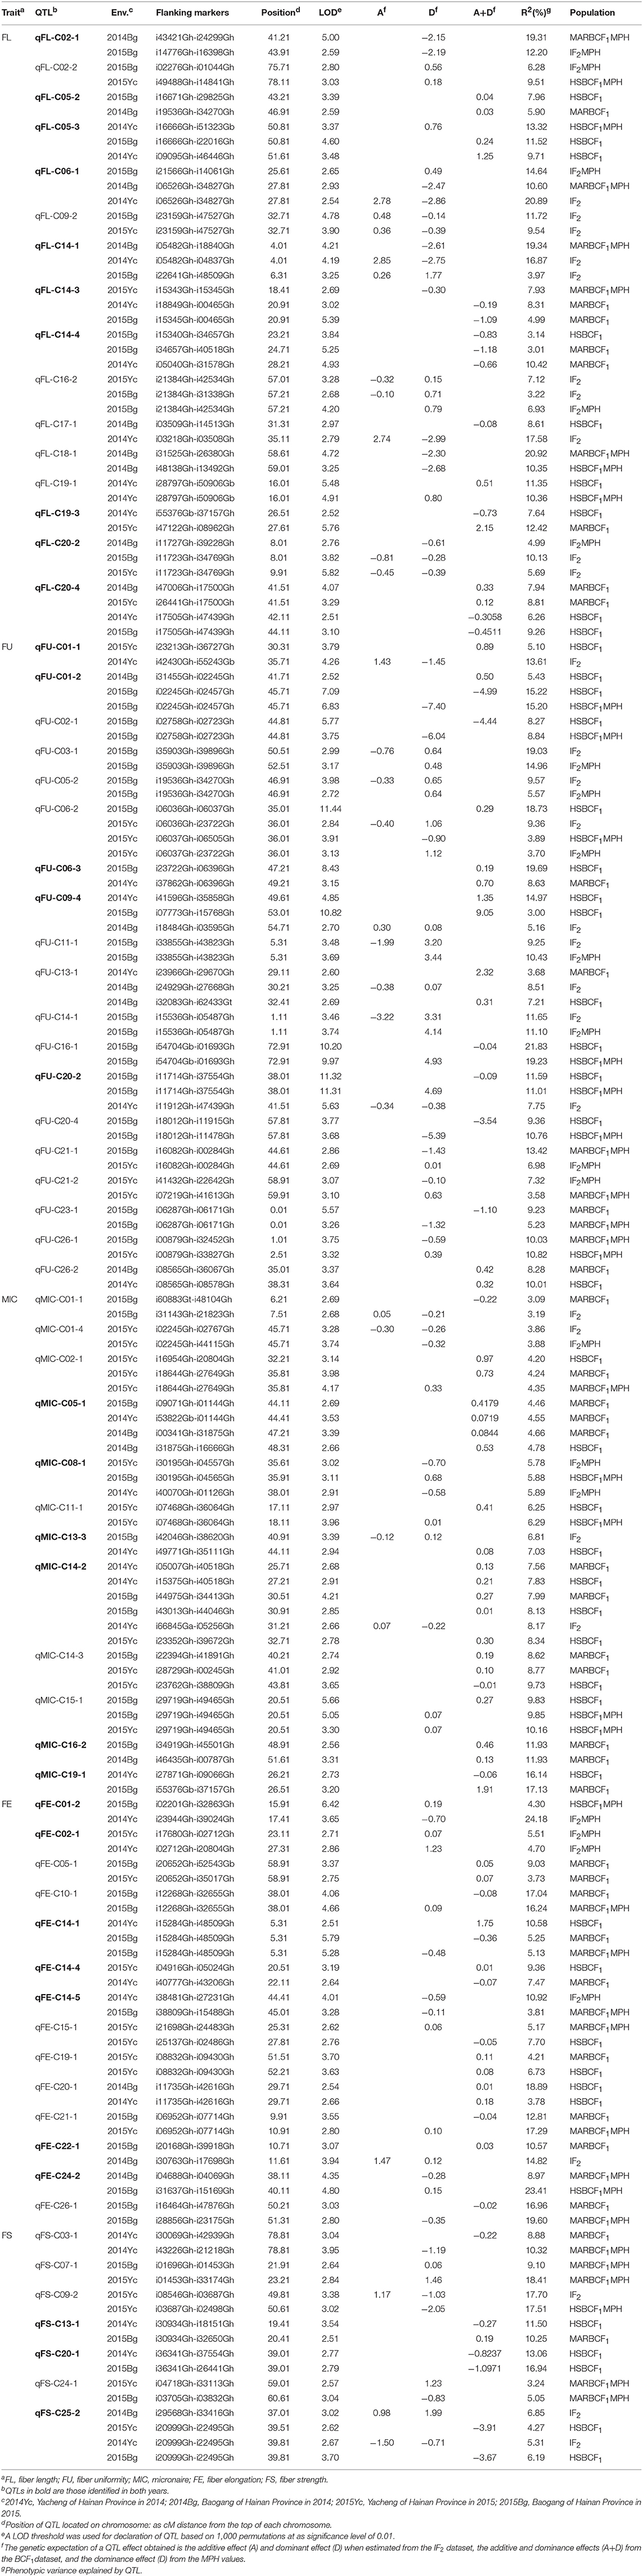
Table 4. The detailed information of stable QTLs identified by CIM method.
Fiber Length
A total of 42 QTLs were detected in 6 datasets, explaining 3.00–20.92% of the total PV. Among those, 16 QTLs were identified in at least two datasets or environments (Table 4). Sixteen, twelve, ten, seven, five, and eight QTLs were identified in the IF2, HSBCF1, MARBCF1, IF2MPH, HSBCF1MPH, and MARBCF1MPH datasets, respectively. In the IF2 population, five QTLs showed a partial dominant effect and twelve were observed to have an over-dominant effect (Table 5 and Supplementary Table S4). Three QTLs were simultaneously detected in both IF2 and IF2MPH datasets. The dominant effects of three QTLs (qFL-C09-2, qFL-C14-1, and qFL-C16-2) were uncertain because of their inconsistent mode of action in different environments. In the HSBCF1 datasets, 10 QTLs with additive effect and 5 with over-dominant effect were detected, but no QTL with partial or complete dominant effect was detected (Table 5 and Supplementary Table S5). qFL-C05-3 and qFL-C19-1 with apparent over-dominant effect were identified in both the HSBCF1 and HSBCF1MPH datasets. In the MARBCF1 population, 10 QTLs with additive effect and seven with over-dominant effect were observed (Table 5 and Supplementary Table S6). qFL-C14-3 was detected in 2015Yc of the MARBCF1MPH dataset and in 2014Yc and 2015Bg of the MARBCF1 dataset, with a different mode of action in the two environments of the MARBCF1 dataset.
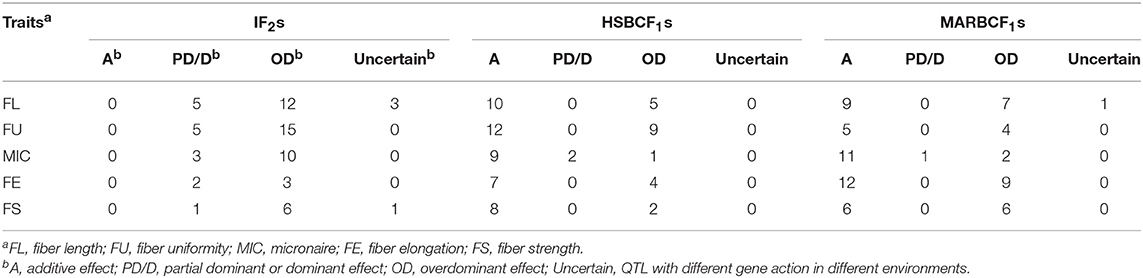
Table 5. Gene action of QTL identified for fiber quality traits by CIM across four environments.
Fiber Uniformity
Thirty-nine QTLs associated with FU were detected in six datasets, explaining 3.00–21.83% of the total PV, among which 19 stable QTLs were identified in more than two datasets or environments (Table 4). Furthermore, five of these stable QTLs were detected in both years. Seventeen, eighteen, six, eight, nine, and four QTLs were identified in the IF2, HSBCF1, MARBCF1, IF2MPH, HSBCF1MPH, and MARBCF1MPH datasets, respectively. In the IF2 population, 5 and 15 QTLs were found to have partial dominant effect and over-dominant effect, respectively (Table 5 and Supplementary Table S4). Among them, five QTLs were identified simultaneously in the IF2 and IF2MPH datasets. In the HSBCF1 population, there were 13 and 9 QTLs with additive effect and over-dominant effect, respectively (Table 5 and Supplementary Table S5). Six QTLs were identified simultaneously in the HSBCF1 and HSBCF1MPH datasets. qFU-C01-2 with apparent over-dominant effect was identified in both 2014Bg and 2015Bg in the HSBCF1 dataset, which showed a negative effect originating from MARCABUCAG8US-1-88 in 2014Bg, but a positive effect contributed by HS46 was identified in 2015Bg. In the MARBCF1 population, five QTLs with additive effect and four with over-dominant effect were observed (Table 5 and Supplementary Table S6). qFU-C23-1 with over-dominant effect was detected in both the MARBCF1 and MARBCF1MPH datasets.
Micronaire
A total of 30 QTLs were identified, explaining 3.09–22.92% of the total PV. Among those, 12 QTLs were identified in more than two datasets or environments (Table 4). Nine, eleven, twelve, five, three, and three QTLs were identified in the IF2, HSBCF1, MARBCF1, IF2MPH, HSBCF1MPH, and MARBCF1MPH datasets, respectively. In the IF2 population, three QTLs exhibited partial dominant effect, while 10 QTLs with |d/a| > 1 showed apparent over-dominant effect (Table 5 and Supplementary Table S4). qMIC-C01-4 was identified in both the IF2 and IF2MPH datasets. In the HSBCF1 population, nine, two, and one QTLs with additive effect, partial dominant effect, and over-dominant effect were detected, respectively (Table 5 and Supplementary Table S5). qMIC-C11-1 and qMIC-C15-1 were detected in both the HSBCF1 and HSBCF1MPH datasets. In the MARBCF1 population, 11 QTLs with additive effect, one with partial dominant effect, and two with over-dominant effect were observed (Table 5 and Supplementary Table S6). qMIC-C02-1 with partial dominant effect was identified simultaneously in the MARBCF1 and MARBCF1MPH datasets.
Fiber Elongation
Twenty-nine QTLs were identified on 17 chromosomes in the six datasets, explaining 3.38–23.41% of the total PV. Fourteen QTLs were identified in more than two datasets or environments (Table 4). Five QTLs were detected in the IF2 dataset and its MPH dataset, among which two QTLs exhibited partial dominant effect and three QTLs showed apparent over-dominant effect (Table 5 and Supplementary Table S4). In the HSBCF1 dataset and its MPH dataset, seven QTLs with additive effect and four with over-dominant effect were detected (Table 5 and Supplementary Table S5). In the MARBCF1 population, twelve QTLs with additive effect and nine with over-dominant effect were observed (Table 5 and Supplementary Table S6). Four QTLs were identified simultaneously in the MARBCF1 and MARBCF1MPH datasets.
Fiber Strength
Twenty-seven QTLs, explaining 3.23–24.73% of the total PV, were detected using the six datasets (Table 4). In the IF2 population, seven QTLs were detected. In a combined analysis of the IF2 dataset and its MPH dataset, one with partial dominant effect and six with over-dominant effect were observed (Table 5 and Supplementary Table S4). qFS-C25-2 was detected partial dominant effect in 2014Yc and over-dominant effect in 2014Bg. In the HSBCF1 population, eight and two QTLs exhibited additive effect and over-dominant effect, respectively (Table 5 and Supplementary Table S5). In the MARBCF1 population, six QTLs with additive effect and over-dominant effect were observed, respectively (Table 5 and Supplementary Table S6). qFS-C03-1 with over-dominant effect was identified in both the MARBCF1 and MARBCF1MPH datasets. qFS-C24-1 with over-dominant effect was identified in the MARBCF1MPH dataset in both 2015Yc and 2015Bg, which showed favorable alleles that were conferred by different parents in these two environments.
Multi-Environment Analysis of Main-Effect QTL and QE Interactions
In total, 104 m-QTLs and QEs for fiber quality were identified in the IF2, HSBCF1, MARBCF1 datasets, and their MPH datasets (Figure 2 and Supplementary Tables S7, S8).
For the IF2 population, 36 and 12 m-QTLs were identified in the IF2 and IF2MPH datasets, respectively. There were, on average, 7.2 m-QTLs [PV (A) = 8.41%, PV (AE) = 10.04%] for each trait identified in the IF2 dataset, whereas there were 2.4 m-QTLs [PV (A) = 2.31%, PV (AE) = 3.73%] in the IF2MPH dataset. A locus, ImaqFE-C13-1, showed significant effect with 6.81% of the total PV [PV (A) and PV (AE)] explained.
In the HSBCF1 population, a total of 16 and 6 m-QTLs were detected in the HSBCF1 and HSBCF1MPH datasets, respectively. In the HSBCF1 dataset, an average of 3.2 m-QTLs and 6.41% of the PV (A) and 2.17% PV (AE) were found. Furthermore, in the HSBCF1MPH dataset, the number of m-QTLs ranged from zero to four for fiber quality traits, with an average of 4.09% of the PV (A) and 1.47% PV (AE). No m-QTL was detected for FU and FE. Two m-QTLs, B1MmaqFL-C10-1 and B1MmaqMIC-C09-1, were found to have significant effects with more than 5% of the total PV explained.
In the MARBCF1 population, 27 and 7 m-QTLs were detected in the MARBCF1 and MARBCF1MPH datasets, respectively. On average, 5.4 m-QTLs [PV (A) = 12.86%, PV (AE) = 9.72%] were detected in the MARBCF1 dataset, whereas there were 1.4 m-QTLs [PV (A) = 1.81%, PV (AE) = 4.74%] in the MARBCF1MPH dataset. In the MARBCF1 dataset, two major m-QTLs, B2maqFE-C04-1 and B2maqFE-C14-1, were identified to be located within the marker intervals of i46763Gh-i10499Gh and i21369Gh-i04874Gh, with 19.16 and 16.53% of the observed PV explained, respectively. Five m-QTLs, B2maqFU-C14-1, B2maqFU-C24-1, B2maqFE-C06-1, B2maqFE-C07-1, and B2maqFE-C18-1, were identified to have significant effects, with more than 5% of the total PV explained. In the MARBCF1MPH dataset, B2MmaqFU-C09-1 was identified between markers i25759Gh and i03659Gh, with 10.14% of the total PV explained. Two m-QTLs, B2MmaqFE-C18-1 and B2MmaqFS-C24-1, exhibited significant effects, with more than 5% of the total PV explained.
Epistatic QTLs Detected in IF2 Population, Two BCF1 Populations, and Their MPH Datasets
The e-QTLs and QEs identified in the IF2, HSBCF1, MARBCF1 datasets and their corresponding MPH datasets have been shown in Figure 2, Table 6, and Supplementary Tables S9, S10. In total, 70, 82, 31, 62, 38, and 31 e-QTLs pairs were identified in the IF2, HSBCF1, MARBCF1, IF2MPH, HSBCF1MPH, and MARBCF1MPH datasets, respectively. These e-QTLs explained more than 30% PV for FL, FU, and FS in the IF2 dataset; all fiber traits in the HSBCF1 dataset; FL in the MARBCF1 dataset; FL, FU, and FE in the IF2MPH dataset; FU in the HSBCF1MPH dataset; and FL and MIC in the MARBCF1MPH dataset. In addition, environmental interactions have a certain impact on the PV of these e-QTLs. On average, the QEs of e-QTLs for each trait explained 24.01, 12.41, 3.25, 20.01, 11.58, and 6.18% of the total PV in the IF2, HSBCF1, MARBCF1, IF2MPH, HSBCF1MPH, and MARBCF1MPH datasets, respectively.
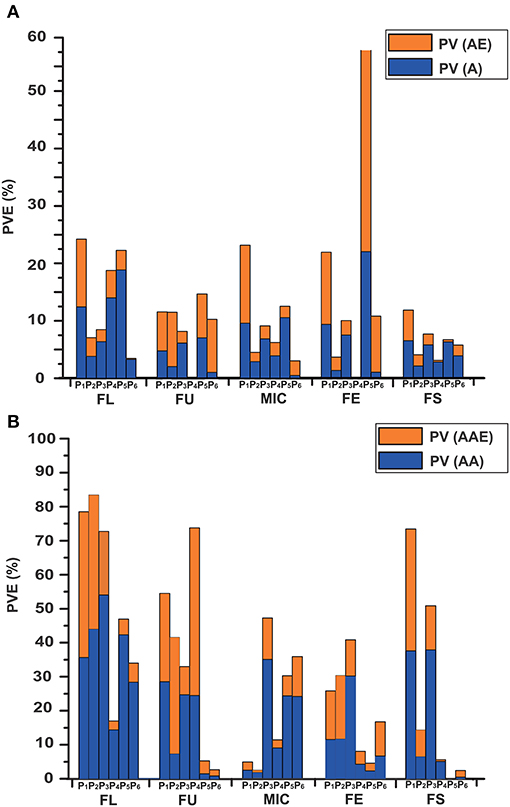
Figure 2. Phenotypic variance explained by the m-QTLs and e-QTLs in the IF2, HSBCF1, MARBCF1, IF2MPH, HSBCF1MPH, and MARBCF1MPH datasets for fiber quality traits. (A) Phenotypic variance explained by m-QTLs. PV, the phenotypic variance that the total effects explained; PV (A), the phenotypic variation that the main effects explained; PV (AE), the phenotypic variation that the environmental interaction effects explained. (B) Phenotypic variance explained by the e-QTLs. PV, the phenotypic variation that the total epistasis effects explained; PV (AA), the phenotypic variation that the main epistasis effects explained; PV (AAE), the phenotypic variation that the environmental interaction effects explained. P1, IF2; P2, HSBCF1; P3, MARBCF1; P4, IF2MPH; P5, HSBCF1MPH; P6, MARBCF1MPH.
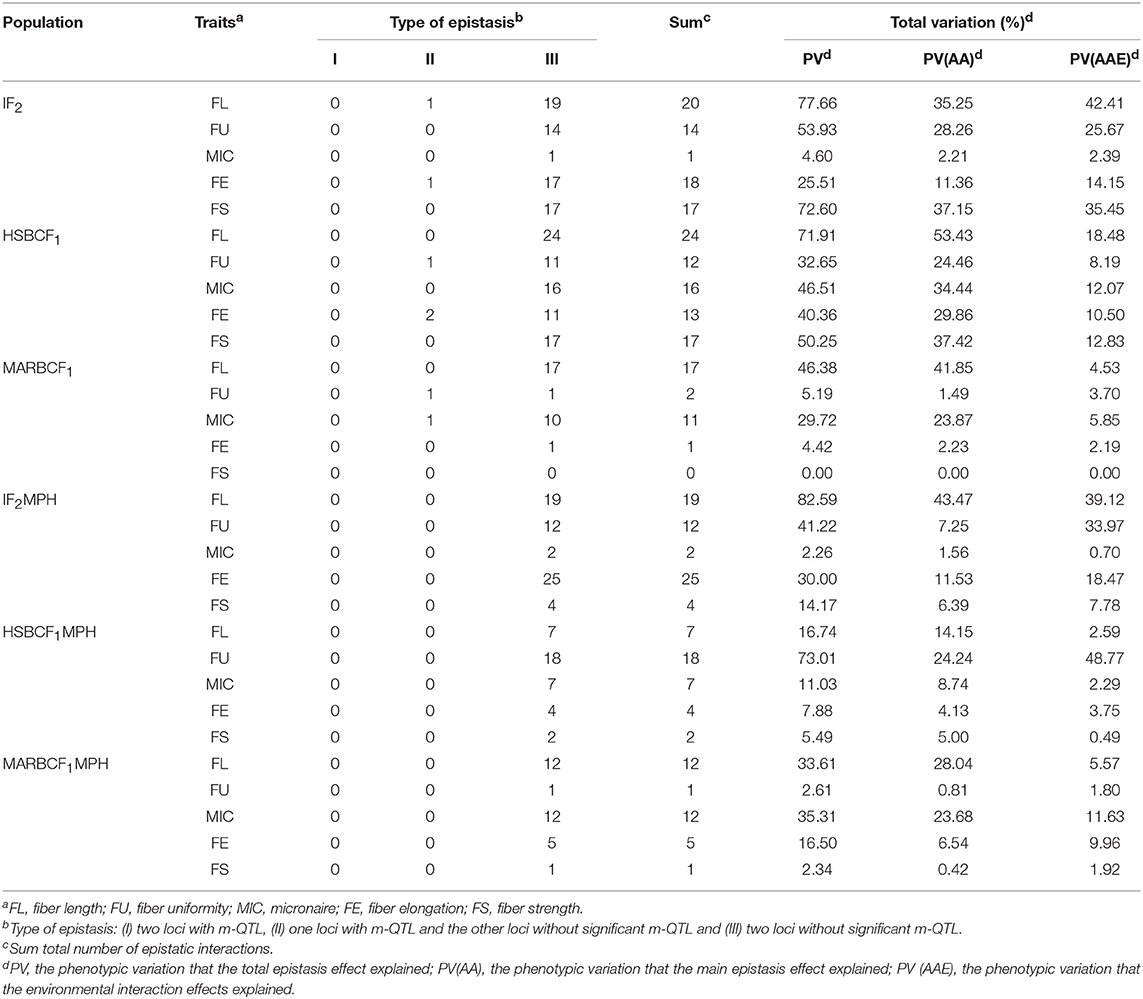
Table 6. Type of epistatic interactions and the total phenotypic variation explained by e-QTLs detected in the IF2, HSBCF1, and MARBCF1 datasets and their MPH datasets.
The e-QTLs were divided into three types: (I) both the loci were m-QTLs, (II) one locus was an m-QTL and the other was not, and (III) both the loci were not m-QTLs (Li et al., 2001). Of the e-QTLs detected in the IF2 dataset, two pairs of epistatic interactions were type II and the remaining interactions were type III. All the e-QTL interactions detected in the IF2MPH dataset were type III (Table 6). Of the e-QTLs in the HSBCF1 population, three pairs of e-QTL interactions were type II and all the remaining interactions were type III. Of the e-QTLs detected in the MARBCF1 population, two pairs of e-QTL interactions were type II, and all the remaining interactions occurred between two complementary loci (type III).
Congruence Analysis of the Single-Locus QTLs and Main-Effect QTLs
Comparing the additive QTLs that were identified, a total of 25 QTLs identified by the CIM method had the overlapping confidence intervals with 28 m-QTLs identified by the ICIM method, of which some single-locus QTLs harbored two m-QTLs identified in different datasets (Figure 1 and Supplementary Tables S3, S7, S8).
For FL, three stable single-locus QTLs qFL-C09-2, qFL-C14-3, and qFL-C19-3 had the same or overlapping confidence intervals with three m-QTLs B1maqFL-C09-1, B2maqFL-C14-1, and B2maqFL-C19-1, respectively. The confidence interval of the stable single-locus QTL qFL-C20-4 harbored two m-QTLs ImaqFL-C20-3 and B2maqFL-C20-1. The m-QTLs ImaqFL-C05-1, B1maqFL-C08-1, ImaqFL-C13-1, B2maqFL-C17-1, and ImaqFL-C20-1, also had overlapping confidence intervals with the QTLs qFL-C05-1, qFL-C08-1, qFL-C13-2, qFL-C17-2, and qFL-C20-3, respectively, which could only be detected in one environment.
For FU, the confidence interval of the single-locus QTLs qFU-C03-2 and qFU-C25-1 harbored two m-QTLs ImaqFU-C03-1 and IMmaqFU-C03-1 and ImaqFU-C25-1 and IMmaqFU-C25-1, respectively. The m-QTLs B2MmaqFU-C09-1, B2maqFU-C14-1, and ImaqFU-C20-1, also had overlapping confidence intervals with the QTLs qFU-C09-2, qFU-C14-2, and qFU-C20-1, respectively. All conformant single-locus QTLs could only be detected in one environment.
For MIC, two stable single-locus QTLs qMIC-C05-1 and qMIC-C14-2 had overlapping confidence intervals with two m-QTLs ImaqMIC-C05-1 and B2maqMIC-C14-2, respectively. The confidence interval of the stable QTL qMIC-C01-1 harbored two m-QTLs ImaqMIC-C01-2 and IMmaqMIC-C01-1. The m-QTLs ImaqMIC-C01-3, ImaqMIC-C13-1, ImaqMIC-C16-1, and ImaqMIC-C18-1 also had overlapping confidence intervals with the QTLs qMIC-C01-3, qMIC-C13-2, qMIC-C16-1, and qMIC-C18-1, respectively, which could only be detected in one environment.
For FE, the three single-locus QTLs qFE-C06-1, qFE-C13-1, and qFE-C14-3 that were detected in only one environment had overlapping confidence intervals with the m-QTLs B2maqFE-C06-1, ImaqFE-C13-1, and B2maqFE-C14-1, respectively.
For FS, only one single-locus QTL qFS-C19-1 detected in 2014Bg of the MARBCF1 dataset had overlapping confidence intervals with the m-QTL B2maqFS-C19-1.
Discussion
Usefulness of IF2 and BCF1 Populations
Permanent populations possessing heterozygotes are a good choice for studying the genetic basis of heterosis (Hua et al., 2003; Tang et al., 2010; Guo et al., 2013, 2014; Shang et al., 2016). The two BCF1 populations and the IF2 population used in this experiment were specifically designed to achieve comprehensive dissection of heterosis. Such a design possesses several advantages. First, the genotypes of the IF2 and two BCF1 populations can be clearly deduced from the parental RILs and original parents. Second, these three populations can be repeated in exactly the same manner. Third, it provides an opportunity for analyzing heterosis by mapping HL, rather than single analyses of direct trait performance. Fourth, both IF2 and BCF1 populations have a high degree of heterozygosity. Overall, the combination of these three populations can cover more heterozygous loci and detect more QTLs than a single population.
Another characteristic is that, in the present study, CIM and ICIM were simultaneously used to detect additive QTLs. CIM not only preserves the feature of interval mapping but also controls the residual genetic variation in the rest of the genome for interval testing. However, multiple environments were regarded as multiple traits when CIM was used to identify QTLs; therefore, CIM cannot detect QTLs across multiple environments. ICIM is a modified algorithm that has all the advantages of CIM. It avoids the complicated background marker selection process and the possible increase of sampling variance in CIM. Especially for phenotypic data measured across multiple locations and/or years, the ICIM method can achieve multi-environment QTL detection with multi-environment trials (MET) function. Generally, the two QTL mapping models emphasize different considerations. The QTLs identified by CIM are those in a single environment. However, a stable QTL is considered to be detected across multiple environments, and ICIM integrates the phenotype data of various environments to detect QTLs. Therefore, some QTLs were solely detected by one of the two methods in the previous mapping results. Further studies should investigate for those stable QTLs, such as qFL-C09-2, qFL-C14-3, qFL-C19-3, qFL-C20-4, qMIC-C05-1, qMIC-C14-2, and qMIC-C01-1, detected by the CIM method, which were once again identified by the ICIM method. However, there were still some limitations. Because of the different algorithms of these two methods, fewer common QTLs were detected. The stable QTLs of FU, FE, and FS detected by CIM were not identified in ICIM. The density of the genetic map used in the present study was one of the reasons, as QTL positioning is greatly dependent on the map density. Genome-wide association study (GWAS) should be considered for positioning in future research.
Congruence and Reliability Analysis of Additive QTLs
In our previous studies, 47 QTLs related to fiber quality traits were identified in the RIL population developed with the same parents by CIM analysis (Li et al., 2016). In this study, 167 QTLs were detected by CIM analysis in the IF2, HSBCF1, MARBCF1 datasets and their MPH datasets. Among these, 19 QTLs identified previously were once again identified in the present study (Supplementary Table S3), most of which overlapped with QTLs detected in the IF2, HSBCF1, and MARBCF1 datasets but not in their MPH datasets. The reason for this may be that the RILs are homozygous, and only QTLs with additive effect can be identified.
Fiber quality has been identified in a number of QTL studies (Shen et al., 2005; Said et al., 2013; Tan et al., 2014; Wang et al., 2015, 2016; Li et al., 2016), most of which has been uploaded into the CottonQTLdb database (http://www.cottonqtldb.org.) developed by Said et al. (2015). Comparing the QTLs detected in the present study with those QTLs included in the database based on genetic position and physical position, of the 68 stable QTLs identified by the CIM method and the 104 additive QTLs identified by the ICIM method, 25 QTLs identified by CIM and 30 QTLs identified by ICIM were new loci for fiber quality QTLs. Among which, there were three for FL, eight for FU, six for MIC, six for FE, and two for FS in the CIM experiment; seven for FL, four for FU, nine for MIC, eight for FE, and two for FS in the ICIM experiment. All the remaining QTLs had been reported in previous studies. In addition, qFL-C17-2, qFU-C03-2, qFU-C20-1, qMIC-C13-2, and qMIC-C18-1 could be important QTLs detected in this study, as they were not only identified and confirmed by CIM and ICIM simultaneously but also by previous studies (Zhang et al., 2012; Said et al., 2015; Jamshed et al., 2016; Wang et al., 2016).
Heterotic Loci in the IF2 and Two BCF1 Populations
A heterotic locus is defined as a locus showing significantly different effect between the hybrid and the mean values of its parents (Hua et al., 2003); HL can be implemented using MPH dataset of the IF2 and two BCF1 populations. In this research, 24, 23, and 30 HLs for fiber quality traits were detected using the MPH datasets of IF2, HSBCF1, and MARBCF1 datasets with the CIM method, respectively (Supplementary Table S11), and 25 were detected with the ICIM method in these three MPH datasets (Supplementary Table S8). Some researchers have indicated that HLs are independent of the QTLs that control directly measured trait performance (Hua et al., 2003; Guo et al., 2013). However, in the present study, we found that HLs were not independent and that they overlapped with a subset of QTLs that control the per se performance of the hybrid. In the CIM experiment, in the IF2MPH dataset, nine HLs overlapped with the QTLs detected in the IF2 dataset, including three of FL, five of FU, and one of MIC. In the HSBCF1MPH dataset, 10 HLs were found to overlap with the QTLs detected in the HSBCF1 dataset, and eight HLs of the MARBCF1MPH dataset overlapped with the QTLs detected in the MARBCF1 dataset. In the ICIM experiment, five m-QTLs (HLs) of these three MPH datasets overlapped with those detected in the per se performance datasets. These results provide evidence for the above conclusion, that is, an identical genetic mode of action exists in directly measured trait performance and MPH in the upland cotton hybrid. In fact, it is difficult to demonstrate the genetic mechanism underlying fiber quality traits without referring to hybrid vigor and vice versa.
The HLs were not randomly distributed across chromosomes and chromosomal regions. Some HLs were identified as “clusters” and “hotspots,” where clusters and hotspots were defined as containing multiple HLs within ~20 cM regions for different and same traits, respectively (Guo et al., 2007; Said et al., 2013; Li et al., 2016). In the present study, seven HL clusters and two HL hotspots were found in the CIM experiment (Supplementary Table S12). Only one HL cluster was found in the ICIM experiment, owing to the fact that fewer HLs were detected in MPH datasets by ICIM method. Among the clusters, Chr21-cluster-1 must be important; it contains three HLs covering three fiber traits, and two of the three HLs were stable HLs. Chr09-cluster-1 detected by the ICIM method also include three HLs for different traits, more importantly, the stable HL qFU-C09-1, detected by CIM, is located in this cluster. Therefore, Chr09 may be a chromosome with abundant heterosis genes for fiber traits. This needs to be studied further.
Heterotic loci are sensitive to the environment (Shang et al., 2016). In the CIM experiment, only two, one, and two HLs that were detected in both years were found in the IF2MPH, HSBCF1MPH, and MARBCF1MPH datasets, respectively (Supplementary Table S11). Among them, qMIC-C08-1 was identified in 2 years in the IF2MPH dataset and 1 year in the HSBCF1MPH dataset, making a stable contribution to the change of MIC in these three environments. qMIC-C15-1 was detected in 2015Bg of the HSBCF1 dataset and 2015Yc and 2015Bg of the HSBCF1MPH dataset with ~10% PV of MIC. qFS-C07-1 could also be an important QTL/HL identified in the current study, which was previously reported by several researchers as a major QTL that controls FS (Zhang et al., 2009, 2012; Sun et al., 2012; Said et al., 2015; Jamshed et al., 2016), explaining 9.10 and 18.41% of the observed PVs for MPH in 2015Yc and 2015Bg of the MARBCF1MPH dataset, respectively. The remaining two stable HLs qFE-C02-1 and qFS-C24-1 showed inconsistent parental source of favorable alleles in different environments. This illustrated that the stability of HLs was affected by genotype and environmental interaction, which should be taken into account for hybrid breeding of upland cotton.
Cumulative Effect of the Genetic Basis of Heterosis of Fiber Quality in Upland Cotton
In the present study, high heterosis for some traits was found. For instance, there was an average of 16.54% MPH for MIC and 9.37% for FS in the IF2 population, 9.58% for FS in the HSBCF1 population, and 12.77% for FL, 10.23% for MIC, and 9.83% for FS in the MARBCF1 population (Table 2). However, some traits have a low average MPH, because there are many individuals with an obviously higher or lower phenotypic value than their parents, which can be seen from the broad range of MPH (Table 2 and Supplementary Table S1). Therefore, it can be concluded that, even for heterotic hybrids, heterozygosity was not always necessarily beneficial for the phenotype of the trait; this was also proven by previous research (Li et al., 2008). Intriguingly, the traits with a low average MPH showed high heterosis in their extreme lines. This can be illustrated by an example of FE, which showed a low average MPH, but its top 10 high-heterosis hybrids had a high level of heterosis (Supplementary Table S2). Therefore, as concluded by previous research (Luo et al., 2009; Liang et al., 2015; Shang et al., 2016), a high level of heterosis arose from heterozygosity of certain loci instead of whole genome heterozygosity.
In the current analysis of MPH datasets, we could only detect the dominant effect based on the single-locus QTL mapping of the CIM method. If a QTL was detected only in the MPH dataset, but not detected in the RILs, IF2, and BCF1 datasets, we considered that the additive effect of the QTL was very small, that is, |d/a| > 1; the QTL was considered to be an over-dominant QTL, consistent with the results of previous studies (Luo et al., 2009; Shang et al., 2016). In our present research, in the IF2 population, 24.24% partial dominant QTLs and 69.70% over-dominant QTLs were identified. In the HSBCF1 population, 66.67% additive QTLs, 2.90% partial dominant QTLs, and 30.43% over-dominant QTLs were detected. In the MARBCF1 population, 58.90% additive QTLs, 1.37% partial dominant QTLs, and 38.36% over-dominant QTLs were detected (Table 5). These results revealed that the genetic basis of heterosis slightly varied in different populations. At the single-locus level, overdominance and partial dominance were the main contributors in the IF2 population, whereas additive effect and overdominance were the primary causes in the two BCF1 populations. This contrasts with the conclusions where dominance mainly contributed to maize heterosis in IF2 population (Tang et al., 2010), and partial dominance and overdominance mainly contributed to cotton heterosis in the BCF1 populations (Shang et al., 2016). It is not surprising that the performance of hybrids in the BCF1 populations was largely affected by the additive effect. In most classical quantitative studies based on backcross populations, trait performance was improved to a certain extent when subjected to selection (additive effect). Thus, in those hybrids of BCF1, the selection might eliminate most combined genes or hybrid breakdown genes observed in our base RILs. This could be explained by the phenomenon that was observed in our previous study that the phenotypes of some RILs exceeded those of the two parents (Li et al., 2016). Furthermore, Luo et al. (2009) investigated QTLs for yield components in two BCF1 populations and revealed that additive effect and overdominance were identified as the major components of heterosis in rice, which was consistent with the conclusion that additive gene action was an important cause for heterosis in the BCF1 population. A recently study showed that both dominance and overdominance made the key contribution to heterosis of an elite maize hybrid using an IF2 population (Guo et al., 2014). By mapping HLs in chromosome segment introgression lines of cotton, Guo et al. (2013) suggested that the overdominance mainly contributed to the heterosis of yield and agronomic traits. All the above results adequately proved the importance of additive, partial dominant, and overdominant effects in heterosis but with differences among the species and populations. However, the cause of overdominance is a controversial issue. The QTLs that show overdominant effects may be pseudo-overdominant (Zhou et al., 2012). The authenticity of the overdominance effect cannot be distinguished using the current genetic population design and genetic mapping method, and this is still a limitation for understanding heterosis.
By comparing the genetic effects identified in the IF2, HSBCF1, and MARBCF1 datasets and their MPH datasets, we were able to explore the effect of environmental interaction and the relative importance of m-QTLs and e-QTLs (Figure 2 and Table 6). The average PV of m-QTLs and e-QTLs in the IF2 and IF2MPH datasets, e-QTLs in the HSBCF1MPH dataset, and m-QTLs in the MARBCF1MPH dataset were smaller than their corresponding PV explained by QEs, which revealed that the environment was a critical factor in the expression of these m-QTLs and e-QTLs. Previous heterosis and gene action studies pointed out that there was little non-additive gene action for fiber quality traits involved in upland cotton crosses (Meredith and Bridge, 1972; Meredith, 1990). In contrast, in the present study, except for the MARBCF1 dataset, the total PV of e-QTLs was much larger than that of the m-QTLs for fiber quality. Notably, the total PV that the e-QTLs explain was several times the PV explained by m-QTLs in all of the MPH datasets (35.73 vs. 6.57% in the IF2MPH dataset, 24.97 vs. 7.97% in the HSBCF1MPH dataset, and 19.96 vs. 9.01% in the MARBCF1MPH dataset). These results indicate that epistasis plays a vital role in controlling the phenotype and heterosis of fiber quality in upland cotton. Recently, some research focusing on quantitative traits using the QTL mapping method, have strongly proved the common feature of epistasis in genetic populations (Li et al., 2001; Luo et al., 2001; Melchinger et al., 2007; Shang et al., 2016; Wang et al., 2016). By analyzing the interaction of rice yield-related traits, Li et al. (2001) and Luo et al. (2009) detected a great quantity of e-QTLs with a larger PV (42.5–59.0%) and few m-QTLs with PV only 9.6–30.4% in the RIL and BCF1 populations, respectively. In addition, Wang et al. (2016) identified 238 e-QTLs for fiber quality and yield traits and concluded that epistasis is very important in heterosis of the BCF1 populations. Furthermore, there may be three types of epistasis that influence quantitative traits (Li et al., 1998). However, in the present study, almost all of the detected interaction pairs happened between complementary loci (Table 6). This was consistent with Li et al. (2001) and Shang et al. (2016), whose studies showed that the interactions of e-QTL were more likely to occur between digenic complementary loci. The predominance of epistasis between complementary loci indicates that fiber quality trait-related e-QTLs occur more in multilocus genotypes than in specific alleles at individual loci.
Altogether, our results on heterosis indicate that, although the molecular mechanism of the genetic basis of heterosis remains unclear, it certainly refers to multiple QTLs that differ among populations with regard to estimates of the relative contributions of additive, partial dominance, overdominance, and epistasis effects. The integration of results from the single-locus and multi-environment QTL analysis indicated that overdominance and epistasis were the most important factors for fiber quality heterosis in upland cotton. The heterosis genes can be further exploited by detection of significant HLs. Further studies are required to analyze the complex molecular genetic basis that contributes to cotton fiber heterosis.
Author Contributions
CL and SZ designed the experiments and wrote the manuscript. CL and HY analyzed the data. ChL, TZ, and XD participated in field trials. TZ, YD, JH, YZ, and FZ assisted in editing the article. MD contributed to the manuscript preparation. SZ and JC conducted and supervised the experiments.
Conflict of Interest Statement
The authors declare that the research was conducted in the absence of any commercial or financial relationships that could be construed as a potential conflict of interest.
Acknowledgments
We are grateful to Dr. XU (Zhejiang University, China) for technical assistance. The research work was funded by The National Key Technology R&D program of China (2016YFD0101404), The National Natural Science Fund (31501342), China Agriculture Research System (CARS-18-25), and Jiangsu Collaborative Innovation Center for Modern Crop Production.
Supplementary Material
The Supplementary Material for this article can be found online at: https://www.frontiersin.org/articles/10.3389/fpls.2018.01364/full#supplementary-material
References
Birchler, J. A., Yao, H., Chudalayandi, S., Vaiman, D., and Veitia, R. A. (2010). Heterosis. Plant Cell 22, 2105–2112. doi: 10.1105/tpc.110.076133
Comstock, R. E., and Robinson, H. F. (1952). “Estimation of average dominance of genes,” in Heterosis, ed J. W. Gowen (Ames, IA: Iowa State College Press), 495–516.
Frascaroli, E., Cane, M. A., Landi, P., Pea, G., Gianfranceschi, L., Villa, M., et al. (2007). Classical genetic and quantitative trait loci analyses of heterosis in a maize hybrid between two elite inbred lines. Genetics 176, 625–644. doi: 10.1534/genetics.106.064493
Garcia, A. A. F., Wang, S., Melchinger, A. E., and Zeng, Z.-B. (2008). Quantitative trait loci mapping and the genetic basis of heterosis in maize and rice. Genetics 180, 1707–1724. doi: 10.1534/genetics.107.082867
Guo, T., Yang, N., Tong, H., Pan, Q., Yang, X., Tang, J., et al. (2014). Genetic basis of grain yield heterosis in an “immortalized F(2)” maize population. Theor. Appl. Genet. 127, 2149–2158. doi: 10.1007/s00122-014-2368-x
Guo, W., Cai, C., Wang, C., Han, Z., Song, X., Wang, K., et al. (2007). A microsatellite-based, gene-rich linkage map reveals genome structure, function and evolution in Gossypium. Genetics 176, 527–541. doi: 10.1534/genetics.107.070375
Guo, X., Guo, Y., Ma, J., Wang, F., Sun, M., Gui, L., et al. (2013). Mapping heterotic loci for yield and agronomic traits using chromosome segment introgression lines in cotton. J. Integr. Plant. Biol. 55, 759–774. doi: 10.1111/jipb.12054
Hua, J., Xing, Y., Wu, W., Xu, C., Sun, X., Yu, S., et al. (2003). Single-locus heterotic effects and dominance by dominance interactions can adequately explain the genetic basis of heterosis in an elite rice hybrid. Proc. Natl. Acad. Sci. U.S.A. 100, 2574–2579. doi: 10.1073/pnas.0437907100
Hua, J., Xing, Y., Xu, C., Sun, X., Yu, S., and Zhang, Q. (2002). Genetic dissection of an elite rice hybrid revealed that heterozygotes are not always advantageous for performance. Genetics 162, 1885–1895.
Hull, F. H. (1945). Recurrent selection for specific combining ability in corn. J. Am. Soc. Agron. 37, 134–145. doi: 10.2134/agronj1945.00021962003700020006x
Jamshed, M., Jia, F., Gong, J., Palanga, K. K., Shi, Y., Li, J., et al. (2016). Identification of stable quantitative trait loci (QTLs) for fiber quality traits across multiple environments in Gossypium hirsutum recombinant inbred line population. BMC Genomics 17:197. doi: 10.1186/s12864-016-2560-2
Jiang, G., Zeng, J., and He, Y. (2014). Analysis of quantitative trait loci affecting chlorophyll content of rice leaves in a double haploid population and two backcross populations. Gene 536, 287–295. doi: 10.1016/j.gene.2013.12.010
Lacape, J.-M., Nguyen, T.-B., Courtois, B., Belot, J.-L., Giband, M., Gourlot, J.-P., et al. (2005). QTL analysis of cotton fiber quality using multiple × backcross generations. Crop Sci. 45, 123–140. doi: 10.2135/cropsci2005.0123a
Lariepe, A., Mangin, B., Jasson, S., Combes, V., Dumas, F., Jamin, P., et al. (2012). The genetic basis of heterosis: multiparental quantitative trait loci mapping reveals contrasted levels of apparent overdominance among traits of agronomical interest in maize (Zea mays L.). Genetics 190, 795–811. doi: 10.1534/genetics.111.133447
Li, C., Dong, Y., Zhao, T., Li, L., Li, C., Yu, E., et al. (2016). Genome-wide SNP linkage mapping and QTL analysis for fiber quality and yield traits in the upland cotton recombinant inbred lines population. Front. Plant Sci. 7:1356. doi: 10.3389/fpls.2016.01356
Li, H. H., Ye, G. Y., and Wang, J. K. (2007). A modified algorithm for the improvement of composite interval mapping. Genetics 175, 361–374. doi: 10.1534/genetics.106.066811
Li, L., Lu, K., Chen, Z., Mu, T., Hu, Z., and Li, X. (2008). Dominance, overdominance and epistasis condition the heterosis in two heterotic rice hybrids. Genetics 180, 1725–1742. doi: 10.1534/genetics.108.091942
Li, Z., Pinson, S. R., Stansel, J. W., and Paterson, A. H. (1998). Genetic dissection of the source-sink relationship affecting fecundity and yield in rice (shape Oryza sativa L.). Mol. Breed. 4, 419–426. doi: 10.1023/A:1009608128785
Li, Z. K., Luo, L. J., Mei, H. W., Wang, D. L., Shu, Q. Y., Tabien, R., et al. (2001). Overdominant epistatic loci are the primary genetic basis of inbreeding depression and heterosis in rice. I. Biomass and grain yield. Genetics 158, 1737–1753. doi: 10.3410/f.1002133.8203
Liang, Q., Shang, L., Wang, Y., and Hua, J. (2015). Partial dominance, overdominance and epistasis as the genetic basis of heterosis in upland cotton (Gossypium hirsutum L.). PLoS ONE 10:e0143548. doi: 10.1371/journal.pone.0143548
Liu, R., Wang, B., Guo, W., Wang, L., and Zhang, T. (2011). Differential gene expression and associated QTL mapping for cotton yield based on a cDNA-AFLP transcriptome map in an immortalized F2. Theor. Appl. Genet. 123, 439–454. doi: 10.1007/s00122-011-1597-5
Lu, H., Romero-Severson, J., and Bernardo, R. (2003). Genetic basis of heterosis explored by simple sequence repeat markers in a random-mated maize population. Theor. Appl. Genet. 107, 494–502. doi: 10.1007/s00122-003-1271-7
Luo, L., Li, Z.-K., Mei, H., Shu, Q., Tabien, R., Zhong, D., et al. (2001). Overdominant epistatic loci are the primary genetic basis of inbreeding depression and heterosis in rice. II. Grain yield components. Genetics 158, 1755–1771.
Luo, X., Fu, Y., Zhang, P., Wu, S., Tian, F., Liu, J., et al. (2009). Additive and over-dominant effects resulting from epistatic loci are the primary genetic basis of heterosis in rice. J. Integr. Plant. Biol. 51, 393–408. doi: 10.1111/j.1744-7909.2008.00807.x
Mei, H. W., Li, Z. K., Shu, Q. Y., Guo, L. B., Wang, Y. P., Yu, X. Q., et al. (2005). Gene actions of QTLs affecting several agronomic traits resolved in a recombinant inbred rice population and two backcross populations. Theor. Appl. Genet. 110, 649–659. doi: 10.1007/s00122-004-1890-7
Melchinger, A. E., Piepho, H. P., Utz, H. F., Muminovic, J., Wegenast, T., Torjek, O., et al. (2007). Genetic basis of heterosis for growth-related traits in Arabidopsis investigated by testcross progenies of near-isogenic lines reveals a significant role of epistasis. Genetics 177, 1827–1837. doi: 10.1534/genetics.107.080564
Meredith, W. R. (1990). Yield and fiber-quality potential for second-generation cotton hybrids. Crop Sci. 30, 1045–1048. doi: 10.2135/cropsci1990.0011183X003000050018x
Meredith, W. R., and Bridge, R. (1972). Heterosis and gene action in cotton, Gossypium hirsutum L. Crop Sci. 12, 304–310. doi: 10.2135/cropsci1972.0011183X001200030015x
Minvielle, F. (1987). Dominance is not necessary for heterosis: a two-locus model. Genet. Res. 49, 245–247. doi: 10.1017/S0016672300027142
Qin, H., Guo, W., Zhang, Y. M., and Zhang, T. (2008). QTL mapping of yield and fiber traits based on a four-way cross population in Gossypium hirsutum L. Theor. Appl. Genet. 117, 883–894. doi: 10.1007/s00122-008-0828-x
Richey, F. D. (1942). Mock-dominance and hybrid vigor. Science 96, 280–281. doi: 10.1126/science.96.2490.280
Said, J. I., Lin, Z., Zhang, X., Song, M., and Zhang, J. (2013). A comprehensive meta QTL analysis for fiber quality, yield, yield related and morphological traits, drought tolerance, and disease resistance in tetraploid cotton. BMC Genomics 14:776. doi: 10.1186/1471-2164-14-776
Said, J. I., Song, M., Wang, H., Lin, Z., Zhang, X., Fang, D. D., et al. (2015). A comparative meta-analysis of QTL between intraspecific Gossypium hirsutum and interspecific G. hirsutum x G. barbadense populations. Mol. Genet. Genomics 290, 1003–1025. doi: 10.1007/s00438-014-0963-9
Shang, L., Liang, Q., Wang, Y., Zhao, Y., Wang, K., and Hua, J. (2016). Epistasis together with partial dominance, over-dominance and QTL by environment interactions contribute to yield heterosis in upland cotton. Theor. Appl. Genet. 129, 1429–1446. doi: 10.1007/s00122-016-2714-2
Shen, X., Guo, W., Zhu, X., Yuan, Y., Yu, J. Z., Kohel, R. J., et al. (2005). Molecular mapping of QTLs for fiber qualities in three diverse lines in Upland cotton using SSR markers. Mol. Breed. 15, 169–181. doi: 10.1007/s11032-004-4731-0
Shull, G. H. (1914). Duplicate genes for capsule-form in Bursa bursa-pastoris. Mol. Gen. Genet. 12:97–149. doi: 10.1007/BF01837282
Stuber, C. W., Lincoln, S. E., Wolff, D., Helentjaris, T., and Lander, E. (1992). Identification of genetic factors contributing to heterosis in a hybrid from two elite maize inbred lines using molecular markers. Genetics 132, 823–839.
Sun, F.-D., Zhang, J.-H., Wang, S.-F., Gong, W.-K., Shi, Y.-Z., Liu, A.-Y., et al. (2012). QTL mapping for fiber quality traits across multiple generations and environments in upland cotton. Mol. Breed. 30, 569–582. doi: 10.1007/s11032-011-9645-z
Tan, Z., Fang, X., Tang, S., Zhang, J., Liu, D., Teng, Z., et al. (2014). Genetic map and QTL controlling fiber quality traits in upland cotton (Gossypium hirsutum L.). Euphytica 203, 615–628. doi: 10.1007/s10681-014-1288-9
Tang, B., Jenkins, J. N., McCarty, J., and Watson, C. (1993). F2 hybrids of host plant germplasm and cotton cultivars: II. Heterosis and combining ability for fiber properties. Crop Sci. 33, 706–710. doi: 10.2135/cropsci1993.0011183X003300040013x
Tang, J., Yan, J., Ma, X., Teng, W., Wu, W., Dai, J., et al. (2010). Dissection of the genetic basis of heterosis in an elite maize hybrid by QTL mapping in an immortalized F2 population. Theor. Appl. Genet. 120, 333–340. doi: 10.1007/s00122-009-1213-0
Voorrips, R. (2002). MapChart: software for the graphical presentation of linkage maps and QTLs. J. Hered. 93, 77–78. doi: 10.1093/jhered/93.1.77
Wang, H., Huang, C., Guo, H., Li, X., Zhao, W., Dai, B., et al. (2015). QTL mapping for fiber and yield traits in upland cotton under multiple environments. PLoS ONE 10:e0130742. doi: 10.1371/journal.pone.0130742
Wang, H., Huang, C., Zhao, W., Dai, B., Shen, C., Zhang, B., et al. (2016). Identification of QTL for fiber quality and yield traits using two immortalized backcross populations in upland cotton. PLoS ONE 11:e0166970. doi: 10.1371/journal.pone.0166970
Wang, S., Basten, C., and Zeng, Z. (2012). Windows QTL Cartographer 2.5. Department of Statistics, North Carolina State University, Raleigh, NC.
Williams, W. (1959). Heterosis and the genetics of complex characters. Nature 184, 527–530. doi: 10.1038/184527a0
Wu, J., Gutierrez, O. A., Jenkins, J. N., McCarty, J. C., and Zhu, J. (2008). Quantitative analysis and QTL mapping for agronomic and fiber traits in an RI population of upland cotton. Euphytica 165, 231–245. doi: 10.1007/s10681-008-9748-8
Xiao, J. H., Li, J. M., Yuan, L. P., and Tanksley, S. D. (1995). Dominance is the major genetic-basis of heterosis in rice as revealed by Qtl analysis using molecular markers. Genetics 140, 745–754.
Yu, J., Yu, S., Gore, M., Wu, M., Zhai, H., Li, X., et al. (2013). Identification of quantitative trait loci across interspecific F2, F2:3 and testcross populations for agronomic and fiber traits in tetraploid cotton. Euphytica 191, 375–389. doi: 10.1007/s10681-013-0875-5
Yu, S., Li, J., Xu, C., Tan, Y., Gao, Y., Li, X., et al. (1997). Importance of epistasis as the genetic basis of heterosis in an elite rice hybrid. Proc. Natl. Acad. Sci. U.S.A. 94, 9226–9231. doi: 10.1073/pnas.94.17.9226
Zhang, K., Zhang, J., Ma, J., Tang, S., Liu, D., Teng, Z., et al. (2012). Genetic mapping and quantitative trait locus analysis of fiber quality traits using a three-parent composite population in upland cotton (Gossypium hirsutum L.). Mol. Breed. 29, 335–348. doi: 10.1007/s11032-011-9549-y
Zhang, S., Wang, T., Liu, Q., Gao, X., Zhu, X., Zhang, T., et al. (2015). Quantitative trait locus analysis of boll-related traits in an intraspecific population of Gossypium hirsutum. Euphytica 203, 121–144. doi: 10.1007/s10681-014-1281-3
Zhang, Z., Hu, M., Zhang, J., Liu, D., Zheng, J., Zhang, K., et al. (2009). Construction of a comprehensive PCR based marker linkage map and QTL mapping for fiber quality traits in upland cotton (Gossypium hirsutum L.). Mol. Breed. 24, 49–61. doi: 10.1007/s11032-009-9271-1
Zhang, Z., Shang, H., Shi, Y., Huang, L., Li, J., Ge, Q., et al. (2016). Construction of a high-density genetic map by specific locus amplified fragment sequencing (SLAF-seq) and its application to Quantitative Trait Loci (QTL) analysis for boll weight in upland cotton (Gossypium hirsutum). BMC Plant Biol. 16:79. doi: 10.1186/s12870-016-0741-4
Keywords: upland cotton (Gossypium hirsutum L.), heterosis, fiber quality, multiple genetic populations, quantitative trait loci mapping
Citation: Li C, Yu H, Li C, Zhao T, Dong Y, Deng X, Hu J, Zhang Y, Zhang F, Daud MK, Chen J and Zhu S (2018) QTL Mapping and Heterosis Analysis for Fiber Quality Traits Across Multiple Genetic Populations and Environments in Upland Cotton. Front. Plant Sci. 9:1364. doi: 10.3389/fpls.2018.01364
Received: 10 February 2018; Accepted: 28 August 2018;
Published: 15 October 2018.
Edited by:
Agata Gadaleta, Università degli Studi di Bari, ItalyReviewed by:
Ralf Uptmoor, University of Rostock, GermanyChunhua Fu, Huazhong University of Science and Technology, China
Copyright © 2018 Li, Yu, Li, Zhao, Dong, Deng, Hu, Zhang, Zhang, Daud, Chen and Zhu. This is an open-access article distributed under the terms of the Creative Commons Attribution License (CC BY). The use, distribution or reproduction in other forums is permitted, provided the original author(s) and the copyright owner(s) are credited and that the original publication in this journal is cited, in accordance with accepted academic practice. No use, distribution or reproduction is permitted which does not comply with these terms.
*Correspondence: Shuijin Zhu, c2hqemh1QHpqdS5lZHUuY24=