 Caili Sun
 Guobin Liu
 Sha Xue
- 1State Key Laboratory of Soil Erosion and Dryland Farming on the Loess Plateau, Northwest A&F University, Yangling, China
- 2College of Eco-Environmental Engineering, Guizhou Minzu University, Guiyang, China
- 3Institute of Soil and Water Conservation, Chinese Academy of Sciences and Ministry of Water Resources, Yangling, China
Interactions between plant and soil communities have important implication for plant competition, development and succession. In order to explore the internal mechanism behind natural succession of abandoned farmland, we test the effect of plant–soil interaction on plant growth and competitive ability through performing a pot experiment, which included three grasses in different successional stages on the Loess Plateau of China (Setaria viridis, Stipa bungeana, and Bothriochloa ischaemum) in monoculture and all possible two- and three-way combinations, along with a plant-free control pot. The plants were harvested after about 4 months, and the rhizospheric soil was collected. The bacterial communities of the soils were analyzed by high-throughput sequencing of the 16S rRNA gene. Plant competition affected richness of bacterial communities. Proteobacteria and Bacteroidetes were generally higher and Actinobacteria and Acidobacteria were lower in relative abundance in the mixed treatments associated with B. ischaemum. Photosynthetic bacterium, Genus Rhodobacter family Rhodospirillaceae, affected the growth condition and increased the competitive ability of B. ischaemum. Differences in the amounts of soil organic carbon, water-soluble organic carbon and nitrate nitrogen and available phosphorus drove the differences in bacterial communities. Our study has an important significance for understanding the trend of natural succession on the abandoned farmland on the Loess Plateau of China.
Introduction
Plants supply litter, decomposing roots and exudates that provide distinct combinations of substrates to unique soil microbial and macro-invertebrate communities, and the soil community in turn influence nutrient cycling, plant nutrient availability, disease protection, plant health, and plant growth (Andrews et al., 2010; Aguilera et al., 2011; McHugh and Schwartz, 2015). The interactions between plant and soil communities have an effect on plant abundance and competitive ability (Kuramae et al., 2011). Further, plant competition has been reported to be fundamental for determining plant community composition and successional dynamics (Goldberg and Barton, 1992; Aguilera et al., 2017). Kardol et al. (2006) observed negative, neutral, and positive plant–soil feedbacks for early-, mid-, and late-successional plant species, respectively, and suggested that negative feedbacks among early successional species accelerate succession while positive feedbacks among late-successional species stabilize communities. The abiotic and biotic factors within plant–soil system driving vegetation succession has been widely studied (Reynolds et al., 2003; Kulmatiski et al., 2008; Kuramae et al., 2011), however, it has remained unknown whether changes in soil communities enhance or retard vegetation changes, and whether microbial factors contribute to plant growth and competition in a shorter term.
The most pronounced effects of plant on soil microbial community was observed in the zone directly adjacent to active plant roots, i.e., the rhizosphere (Berg and Smalla, 2009). The rhizosphere is a critical interface supporting the exchange of resources between plants and their associated soil environments and is home to an overwhelming number of microorganisms and invertebrates (Peiffer et al., 2013; Philippot et al., 2013). Microbial communities in the rhizosphere perform fundamental processes that greatly affect nutrient cycling, plant growth and root health (Marschner et al., 2004; Philippot et al., 2013) and potentially represent a mechanistic link between plant diversity and ecosystemic function (Zak et al., 2003; Singh et al., 2004). Understanding the relationships between plant species and rhizospheric bacterial communities is thus important for predicting the response of plant growth and competition to rhizospheric microbial community.
Plant succession is often associated with plant competition, changes of plant species, plant diversity, and plant community composition, and have been shown to influence rhizospheric microbial communities (Felske et al., 2000; Kardol et al., 2006; Kuramae et al., 2011). van de Voorde et al. (2011) indicated that plant–soil interactions may enhance the rate of succession through priority effects, and intra- and interspecific plant–soil interactions can prioritize transitions of plant species in plant communities. On the Loess Plateau of China, Zhang et al. (2016) suggested that both below- and aboveground underwent secondary succession after farmland was abandoned, but below- and aboveground communities had incongruous process during the succession. However, study of Zhang et al. (2016) just found the incongruous successional process of below- and aboveground communities, reasons and internal mechanism driving this phenomenon has not been clearly and deeply illustrated.
Given all of this, we simulated changes in species community across different successional stages using three grass species through pot experiment and hypothesized that plant competition and rhizospheric bacterial community influenced each other during succession. Three grass species, Setaria viridis, Stipa bungeana, and Bothriochloa ischaemum, were selected, which are typical native herbaceous species widely distributed on the Loess Plateau of China (Ning et al., 2008; Liu and Wang, 2009). S. viridis is dominant at the early successional stage but is replaced by S. bungeana and B. ischaemum in the middle and later stages (Zhang, 2005; Wang, 2006; Wang et al., 2009). With the help of high-throughput sequencing method, we aimed to (1) analyze the effect of dominant species and plant competition on soil community; (2) explore the role of bacterial communities played in the plant growth, competition and succession. Our study will have important significance for understanding the internal mechanism behind vegetation succession of abandoned farmland on the Loess Plateau of China.
Materials and Methods
Pot Experiment
Experimental Site
An outdoor controlled experiment was conducted at the Institute of Soil and Water Conservation, Chinese Academy of Sciences, in Yangling, Shaanxi Province, China (34°12′N, 108°07′E, 530 m a.s.l.). This area has a warm continental monsoon climate with hot and wet summers and cold and dry winters. The mean annual temperature is 13.0°C, with maximum and minimum mean monthly temperatures of 26.7°C in July and -1 to -2°C in January. The mean annual precipitation is about 632 mm, which occurs mainly from July to September (Xu et al., 2011).
Plant Material
Three gramineous plants, S. viridis, S. bungeana, and B. ischaemum, were selected for this study. All are typical native herbaceous grasses widely distributed on the Loess Plateau of China (Ning et al., 2008; Wang et al., 2009; Wang et al., 2011). S. viridis is an annual grass, and S. bungeana and B. ischaemum are perennial grasses. S. viridis and S. bungeana are C3 plants, and B. ischaemum is a C4 plant. Seeds were collected in autumn 2014 from a field experimental station (Ansai Research Station) of the Institute of Soil and Water Conservation on the plateau.
Experimental Design
We used loessial soil (Calcic Cambisol) collected from farmland at the Ansai Research Station. The field capacity of the loess, determined as gravimetric soil-moisture content, was about 20%. The soil at the beginning of the experiment had a pH of 8.68 and contained 1.71g kg-1 soil organic carbon (SOC), 0.22 g kg-1 total nitrogen (TN), 0.55g kg-1 total phosphorous (TP) and 3.04 mg kg-1 available phosphorous (AP). The soil was added to cylindrical polyvinyl chloride (PVC) pots (height: 20 cm; diameter: 15 cm). The bottom of each pot was covered with about 1 kg of stones (diameter: 1 cm). A plastic tube (diameter: 1 cm; length 25 cm) used for irrigation was placed vertically immediately above the stones. Filter paper was then placed over the stones and around the plastic tube. The pot was then filled with about 3.8 kg of sieved (5 mm) and air-dried loess.
We tested eight treatments: S. viridis, S. bungeana, and B. ischaemum as monocultures (G, C, and B, respectively), all pair-wise combinations of these three species (GC, CB, and GB), all species mixed (GCB) and pots without plants as a control (CK). Each treatment had five replicates, for a total of 40 pots. The planted pots were sown with multiple seeds on 22 April 2015, in order to simulate the field condition, the plants were thinned to six S. bungeana and B. ischaemum and twelve S. viridis in the monocultures; three S. bungeana, three B. ischaemum or six S. viridis in the pair-wise combinations and two S. bungeana and B. ischaemum and four S. viridis in GCB to simulate natural proportions. The pot size and planting pattern were shown in Figure 1. We watered all pots with distilled water to maintain near 80% field capacity by weighting method until the end of the experiment, in order to minimize the effect of moisture on plant and microbial community. The plants grew normally in outdoor conditions under a rain shelter (height 3 m) to prevent the addition of rainwater. Pot positions were changed once a week to reduce any micro-environmental effects.
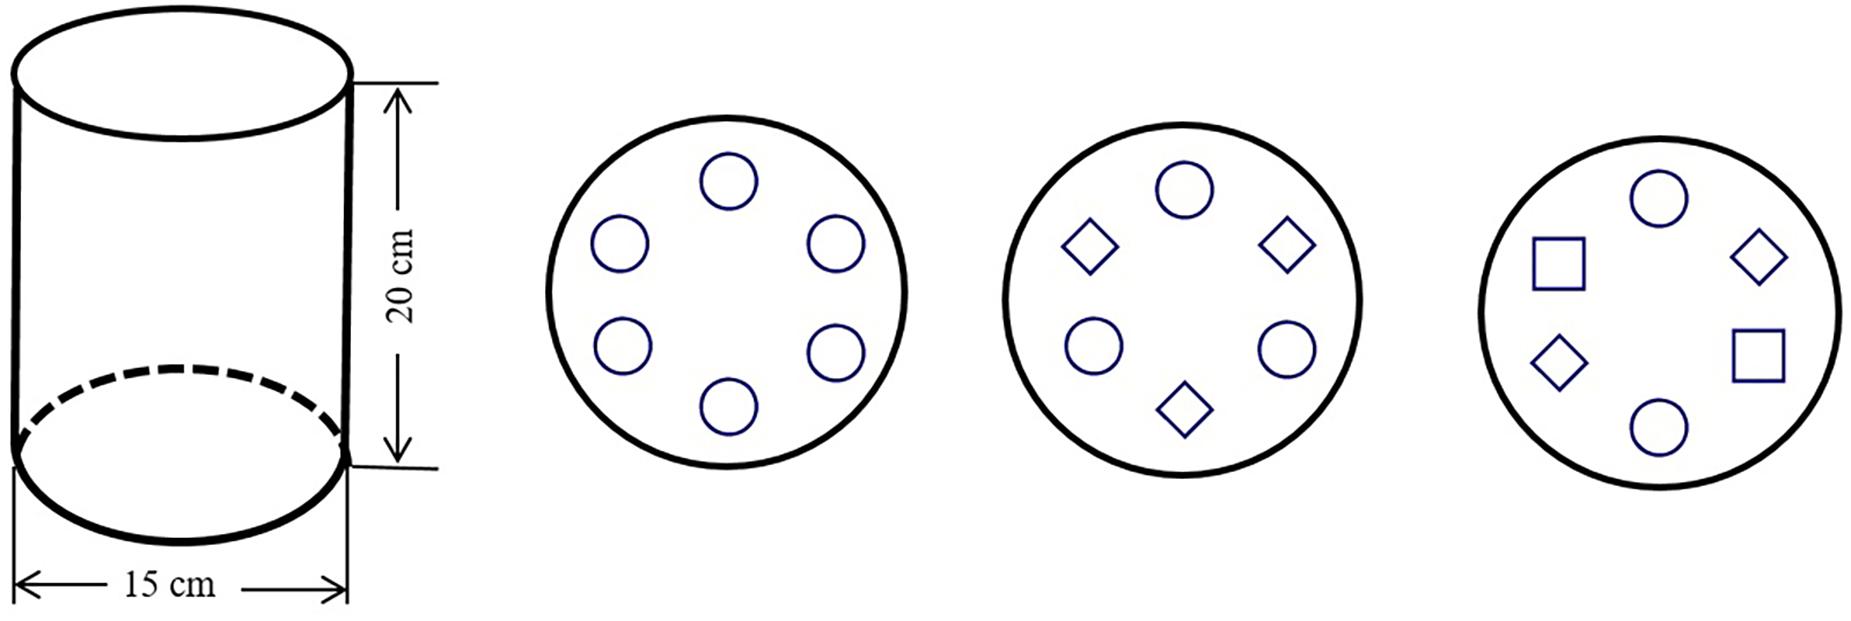
FIGURE 1. Size of experimental pot and schematic diagram of the experimental design. Symbols ○, ♢, and □ represent two Setaria viridis, one Stipa bungeana, and one Bothriochloa ischaemum, respectively.
Sample Collection and Analysis
Sample Collection
Three of the five replicates were randomly selected for sampling 117 days after sowing. Above- and belowground tissues were harvested separately. The roots of the competing plant species tended to become entangled, so we collected all roots together. Loosely adhering soil was removed by shaking and was discarded, and the remaining soil strongly adhering to the roots was considered the rhizosphere and was brushed from the entire root system for collection. The above- and belowground tissues were carefully washed with distilled water and were then oven-dried at 80°C for 48 h for determining their biomass dry weights. Visible plant roots and debris were removed from each soil sample, which was then divided into three parts. One part was immediately stored at -80°C for DNA analysis, the second part was immediately sieved through a 2-mm mesh and stored at 4°C for the analysis of water-soluble organic carbon (WSOC) and the third part was air-dried for physicochemical analysis.
Soil Chemical Parameters
Soil organic carbon content was determined by the Walkley–Black method (Nelson and Sommers, 1982). WSOC content was determined following the method described by Sims and Haby (1971). Briefly, 120 ml of distilled water were added to 40 g of fresh soil, the aqueous solution (1:3 soil:water) was mechanically shaken for 1 h, followed by centrifugation at 5,000 rpm for 15 min and filtration through a 0.45-μm membrane. The WSOC content was then determined using a Liqui TOCII analyzer (Elementar, Germany). TN content was determined using the Kjeldahl method (Bremner and Mulvaney, 1982). Ammonium nitrogen (NH4+-N) and nitrate nitrogen (NO3--N) were extracted from 2.5 g of soil incubated in 25 ml 1 M KCl for 1 h and analyzed calorimetrically on an Alpkem Autoanalyzer (OI Analytical, College Station, TX, United States). TP content was determined by melt-molybdenum, antimony and scandium colorimetry (Murphy and Riley, 1962), and AP content was determined by the Olsen method (Olsen and Sommers, 1982). Soil pH was determined by an automatic titrator (Metrahm 702, Switzerland) in 1:2.5 soil:water suspensions.
DNA Extraction and Sequencing
DNA extraction and illumina HiSeq high-throughput sequencing
DNA was extracted from 0.25 g of soil using a TIANamp Soil DNA Kit [Tiangen Biotech (Beijing) Co., Ltd, Beijing, China]. The DNA extracts were diluted 10-fold and spectrophotometrically assessed for quality and quantity (NanoDrop ND-1000, NanoDrop Technologies, Wilmington, DE, United States). The integrity of the DNA extracts was confirmed by 1% agarose gel electrophoresis. DNA was amplified by PCR in triplicate using primers for the 16S rRNA gene. The 341F (5′ - CCTAYGGGRBGCASCAG - 3′) and 806R (5′ - GGACTACNNGGGTATCTAAT - 3′) primers were designed to amplify the hypervariable V3+V4 region of bacterial 16S rRNA genes. The primers were tagged with unique barcodes for each sample. PCR reactions were performed in a volume of 30 μl containing 2 μl of sterile ultrapure water, 15 μl of Phusion Master Mix (2X), 3 μl of 6 μM primers and 10 μl of template DNA (5–10 ng). The PCR program was: 98°C for 60 s; 30 cycles of 98°C for 10 s, 50°C for 30 s and 72°C for 30 s; 72°C for 5 min and hold at 4°C. Sterile ultrapure water was used as negative controls for detecting primer or DNA contamination. Successful PCR amplification was verified by 2% agarose gel electrophoresis. The triplicate PCR products were mixed in equidensity ratios and were then purified using a Qiagen Gel Extraction Kit (Qiagen, Germany). Sequencing libraries were generated using a TruSeq® DNA PCR-Free Sample Preparation Kit (Illumina, United States) following the manufacturer’s recommendations, and index codes were added. The quality of the libraries was assessed using a Qubit@ 2.0 Fluorometer (Thermo Scientific) and an Agilent Bioanalyzer 2100 system. The libraries were then sequenced on an Illumina HiSeq 2500 platform, generating 250-bp paired-end reads.
Processing of sequencing data
The sequences were quality-filtered and chimera checked using the Quantitative Insights Into Microbial Ecology (QIIME) workflow (Caporaso et al., 2010). In brief, quality filtering of the raw tags was performed under specific conditions to obtain high-quality clean tags (Bokulich et al., 2013) following QIIME quality control (Caporaso et al., 2010). Sequences with the same barcode were sorted into the same sample (Edgar et al., 2011). The tags were compared with a reference database (Gold database1 using the UCHIME algorithm (Caporaso et al., 2010) to detect chimeric sequences, which were then removed to obtain the effective tags. The remaining sequences were clustered by Uparse (Edgar, 2013) and assigned to operational taxonomic units (OTUs) at similarities of 97%. The Chao1 estimator and the abundance-based coverage estimator (ACE) were calculated as indices of community diversity, and rarefaction curves were obtained using QIIME (Version 1.7.0) and displayed with R (R Development Core Team, 2004). Taxonomic information for each representative sequence was obtained from the GreenGene Database (DeSantis et al., 2006) using the RDP classifier (Wang et al., 2007) algorithm.
Data Analysis
Indices of Plant Competition
The relative yield total (RYT) was defined and developed by De Wit (1960) and Snaydon (1991), and was used almost universally to measure the extent to which components of a mixture compete for common limiting resources. RYT values are calculated by the following expression:
where Yii and Yjj are the aboveground biomass of components i and j when grown in monoculture, and Yij and Yji, are the aboveground biomass of the components when grown in mixtures with each other. RYT = 1 indicates species compete for the same resources and show no resource complementarity; RYT > 1 indicates species compete partially and show partial resource complementarity; RYT < 1 indicates there is mutual antagonism.
The competitive ratio (CR) was propose by Willey and Rao (1980), and used to evaluate the exact degree of competition, which was calculated as:
where, means of Yii, Yjj, Yij, and Yji are the same as formula (1). Pi and Pj are the proportion of i and j was sown, respectively. CRij> 1 means the competitive ability of i is greater than that of j; CRij < 1 means i is less competitive than j.
Statistical Analysis
Differences in the soil chemical properties and microbial diversities among treatments were assessed by a one-way analysis of variance and multifractal comparison, and the means were compared by Duncan’s tests at P < 0.05. The Shannon and Simpson indices were calculated to assess microbial diversity, and Chao1 and ACE were calculated to estimate species richness. Principal coordinates analysis (PCoA) was used to evaluate the overall differences in the structures of the microbial communities based on Unweighted Unifrac distances. A canonical correspondence analysis (CCA) with forward selection and 999 Monte Carlo simulations was used to identify soil chemical properties that significantly explained the variance of the microbial groups (P < 0.05). Structural equation modeling (SEM) was used to gain a mechanistic understanding of the effect of the plant and soil properties on rhizospheric bacterial composition and richness. The structures of the bacterial communities were assessed by the first principal components of the PCoA. We chose to use root biomass as the original causal factor, because the effects of roots on a rhizosphere, such as exudates and root death, are likely the most important influences on the rhizospheric chemical properties and microbial communities (Lamb et al., 2010; Philippot et al., 2013). The data in the SEM analysis were fitted to the models using the generalized least squares method. Adequate model fits were indicated by the χ2 test (df > 5; P > 0.05) and a low root mean squared error of approximation (Grace, 2006). Statistical tests were performed using the vegan and sem packages in R v.3.3.0 (R Development Core Team, 2004).
Results
Plant Competitive Characteristic and Its Effect on Plant Biomass and Soil Chemical Properties
The species had different biomasses, and increasing the number of species had only occasional additive effects on biomass. Aboveground and total biomasses were the highest in the B treatment, but belowground biomass followed the order B > CB, GB and GCB > G, C and GC (Table 1). According to formulas (1) and (2), the RYT in mixture treatments Setaria viridis + Stipa bungeana, Stipa bungeana + Bothriochloa ischaemum, and Stipa bungeana + Bothriochloa ischaemum were greater than 1, but the competitive ratios (CRs) in mixture treatments were less than 1 (Table 2).
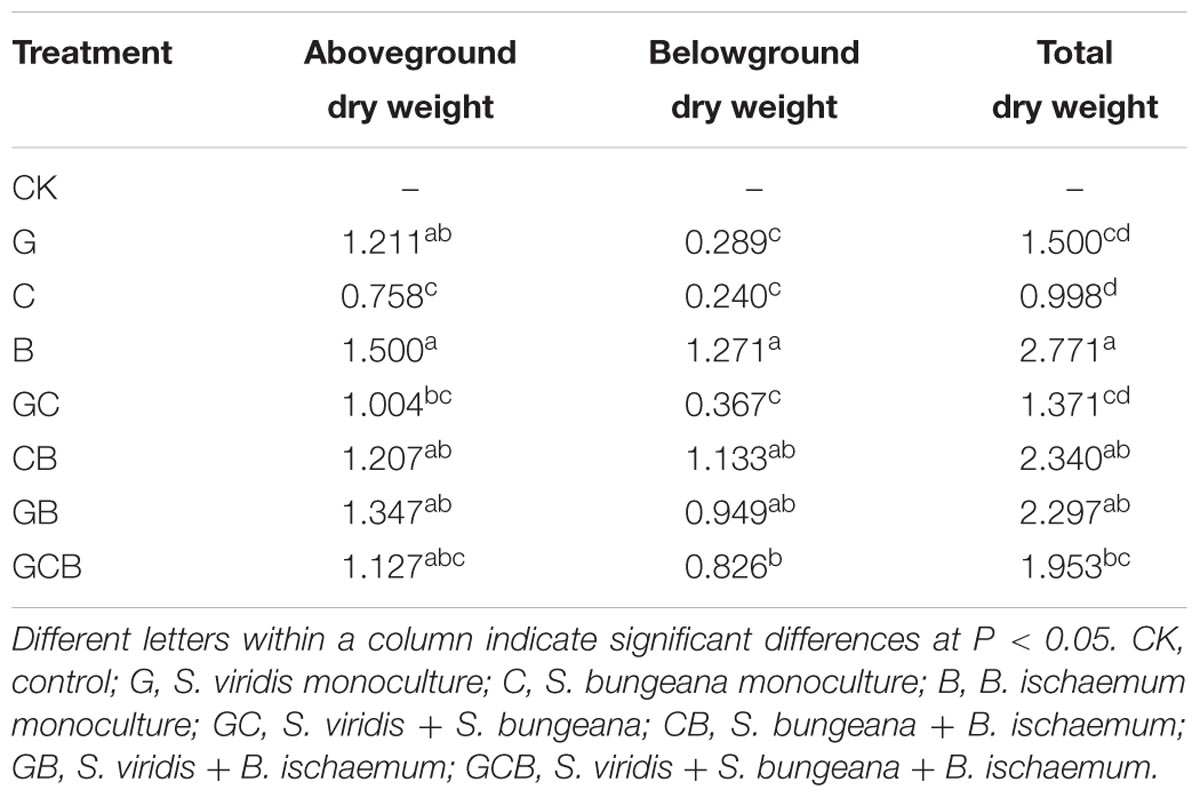
TABLE 1. Mean plant dry weights (g) in the treatments.
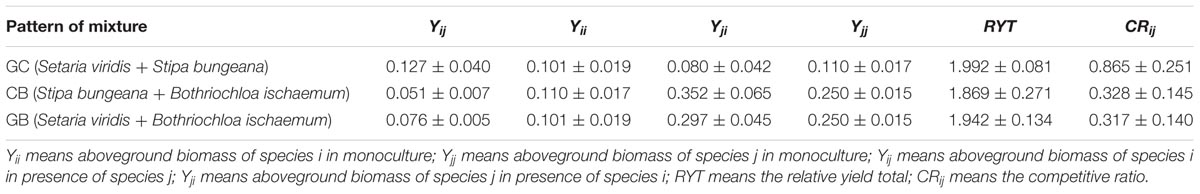
TABLE 2. The competitive intensity of three grass species.
Soil organic carbon and WSOC contents were higher in the planted treatments than CK, but the mixed treatments almost showed non-additive effect compared to the monocultured treatments. Trends were opposite between AP and NO3--N content and SOC and WSOC contents. TN contents and pH were occasionally higher in the planted treatments relative to CK (Table 3).
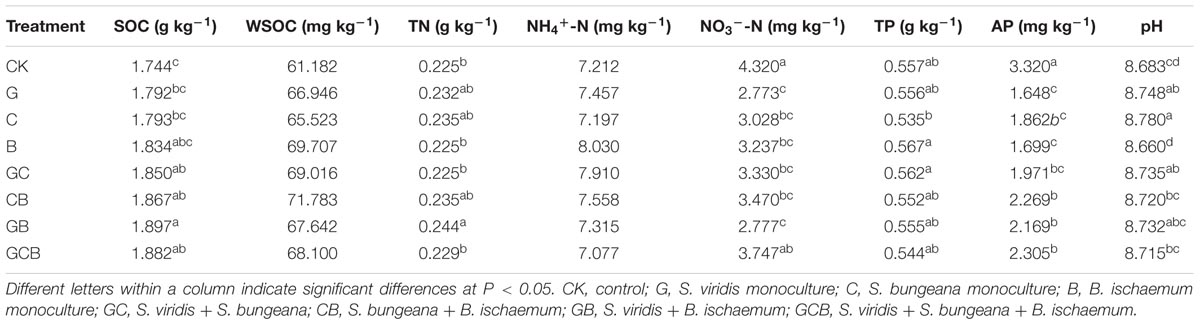
TABLE 3. Mean soil chemical properties in the treatments.
Diversity and Structure of Microbial Communities in the Treatments
Bacterial α-Diversity
High-throughput sequencing produced a total of 1,436,760 high-quality sequences and a total of 64,218 OTUs with 1,934-3,001 OTUs per sample after removing low-quality reads and chimeras and trimming the primers and barcodes. The Good’s coverage values had a range of 0.981–0.986 at 97% similarity cutoff (Table 4). The rarefaction curves for the OTUs, Shannon index and Chao1 reached an asymptote (Figure 2), indicating that current numbers of sequence reads were sufficient to capture the bacterial diversity in these soils.
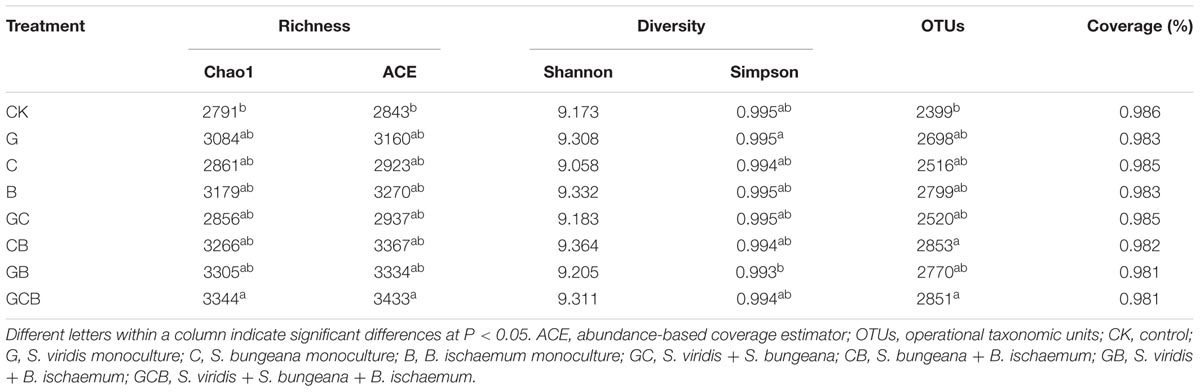
TABLE 4. Mean α-diversities of the microbial communities in the treatments.
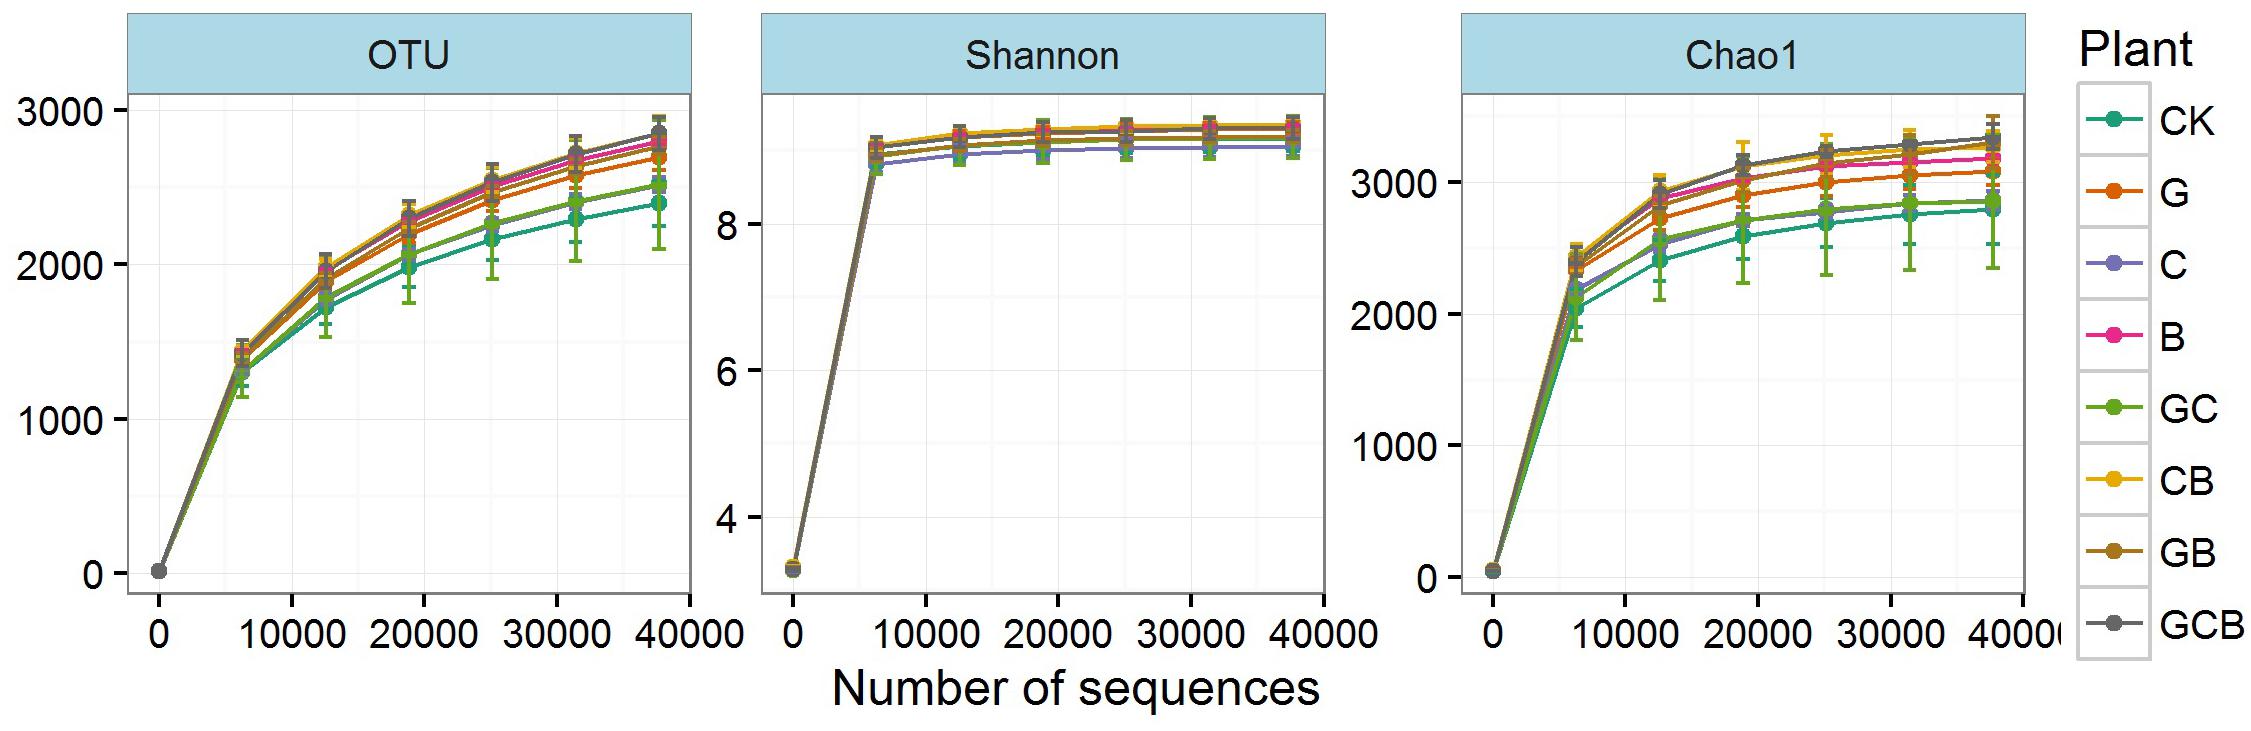
FIGURE 2. Rarefaction curves for operational taxonomic units (OTUs) and the Shannon and Chao1 indices in the treatments. Error bars indicate means ± standard error (n = 3).
Microbial richness (Chao1 and ACE) and number of OTUs were significantly higher only in GCB treatment compared to CK. Neither plant species nor plant competition significantly affected microbial diversity (Shannon and Simpson indices) (Table 5).
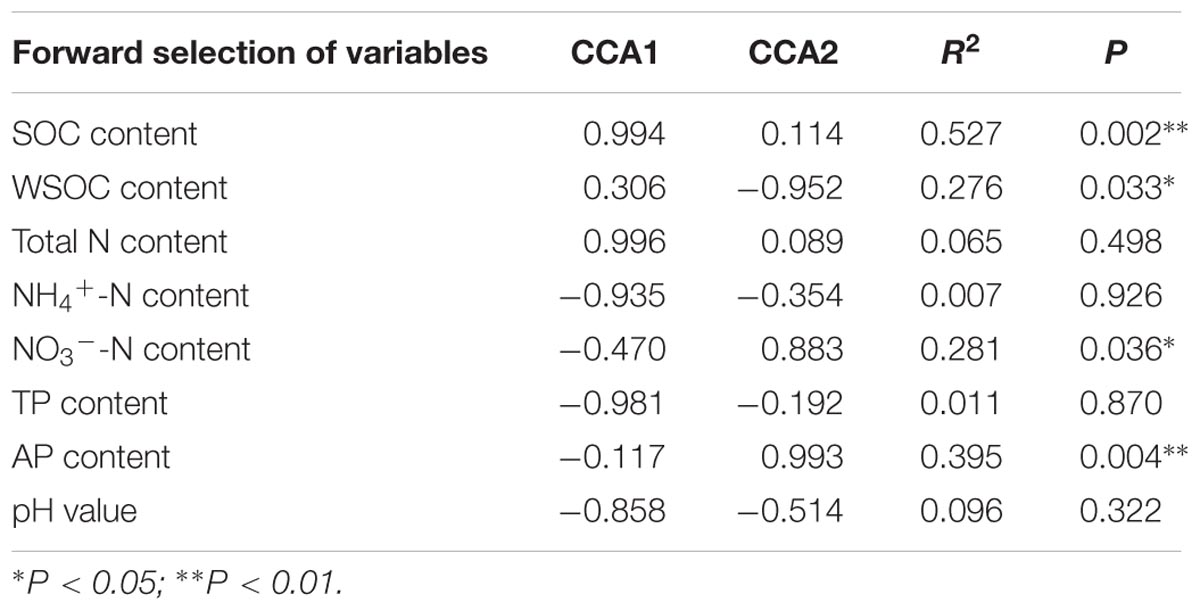
TABLE 5. Results of the canonical correspondence analysis (CCA) variance partitioning of environmental factors to microbial communities.
Bacterial-Community Composition and Structure
The rhizospheric bacterial taxa differed among various competi-tive treatments (Figure 3). The dominant phyla were Proteobacteria (average 50.82%), Actinobacteria (15.36%), Acidobacteria (8.29%), Bacteroidetes (4.91%), Gemmatimona-detes (4.15%), Verrucomicrobia (2.29%), and Chloroflexi (2.78%). Effects of plant competition on bacterial composition was stronger than plant species. The relative abundance of Proteobacteria were significantly higher in CB, GB, and GCB treatments than in G, C, and CK treatments, and relative abundance of Bacteroidetes was much higher in mixed treatments than in monocultured and CK treatments. By contrast, the relative abundance of Actinobacteria in B, CB, and GB was significantly lower than CK treatment, and the relative abundance of Acidobacteria was lower in the mixed than in the monocultured and CK treatments. The abundances of the other phyla just differed occasionally among treatments (Figure 3A).
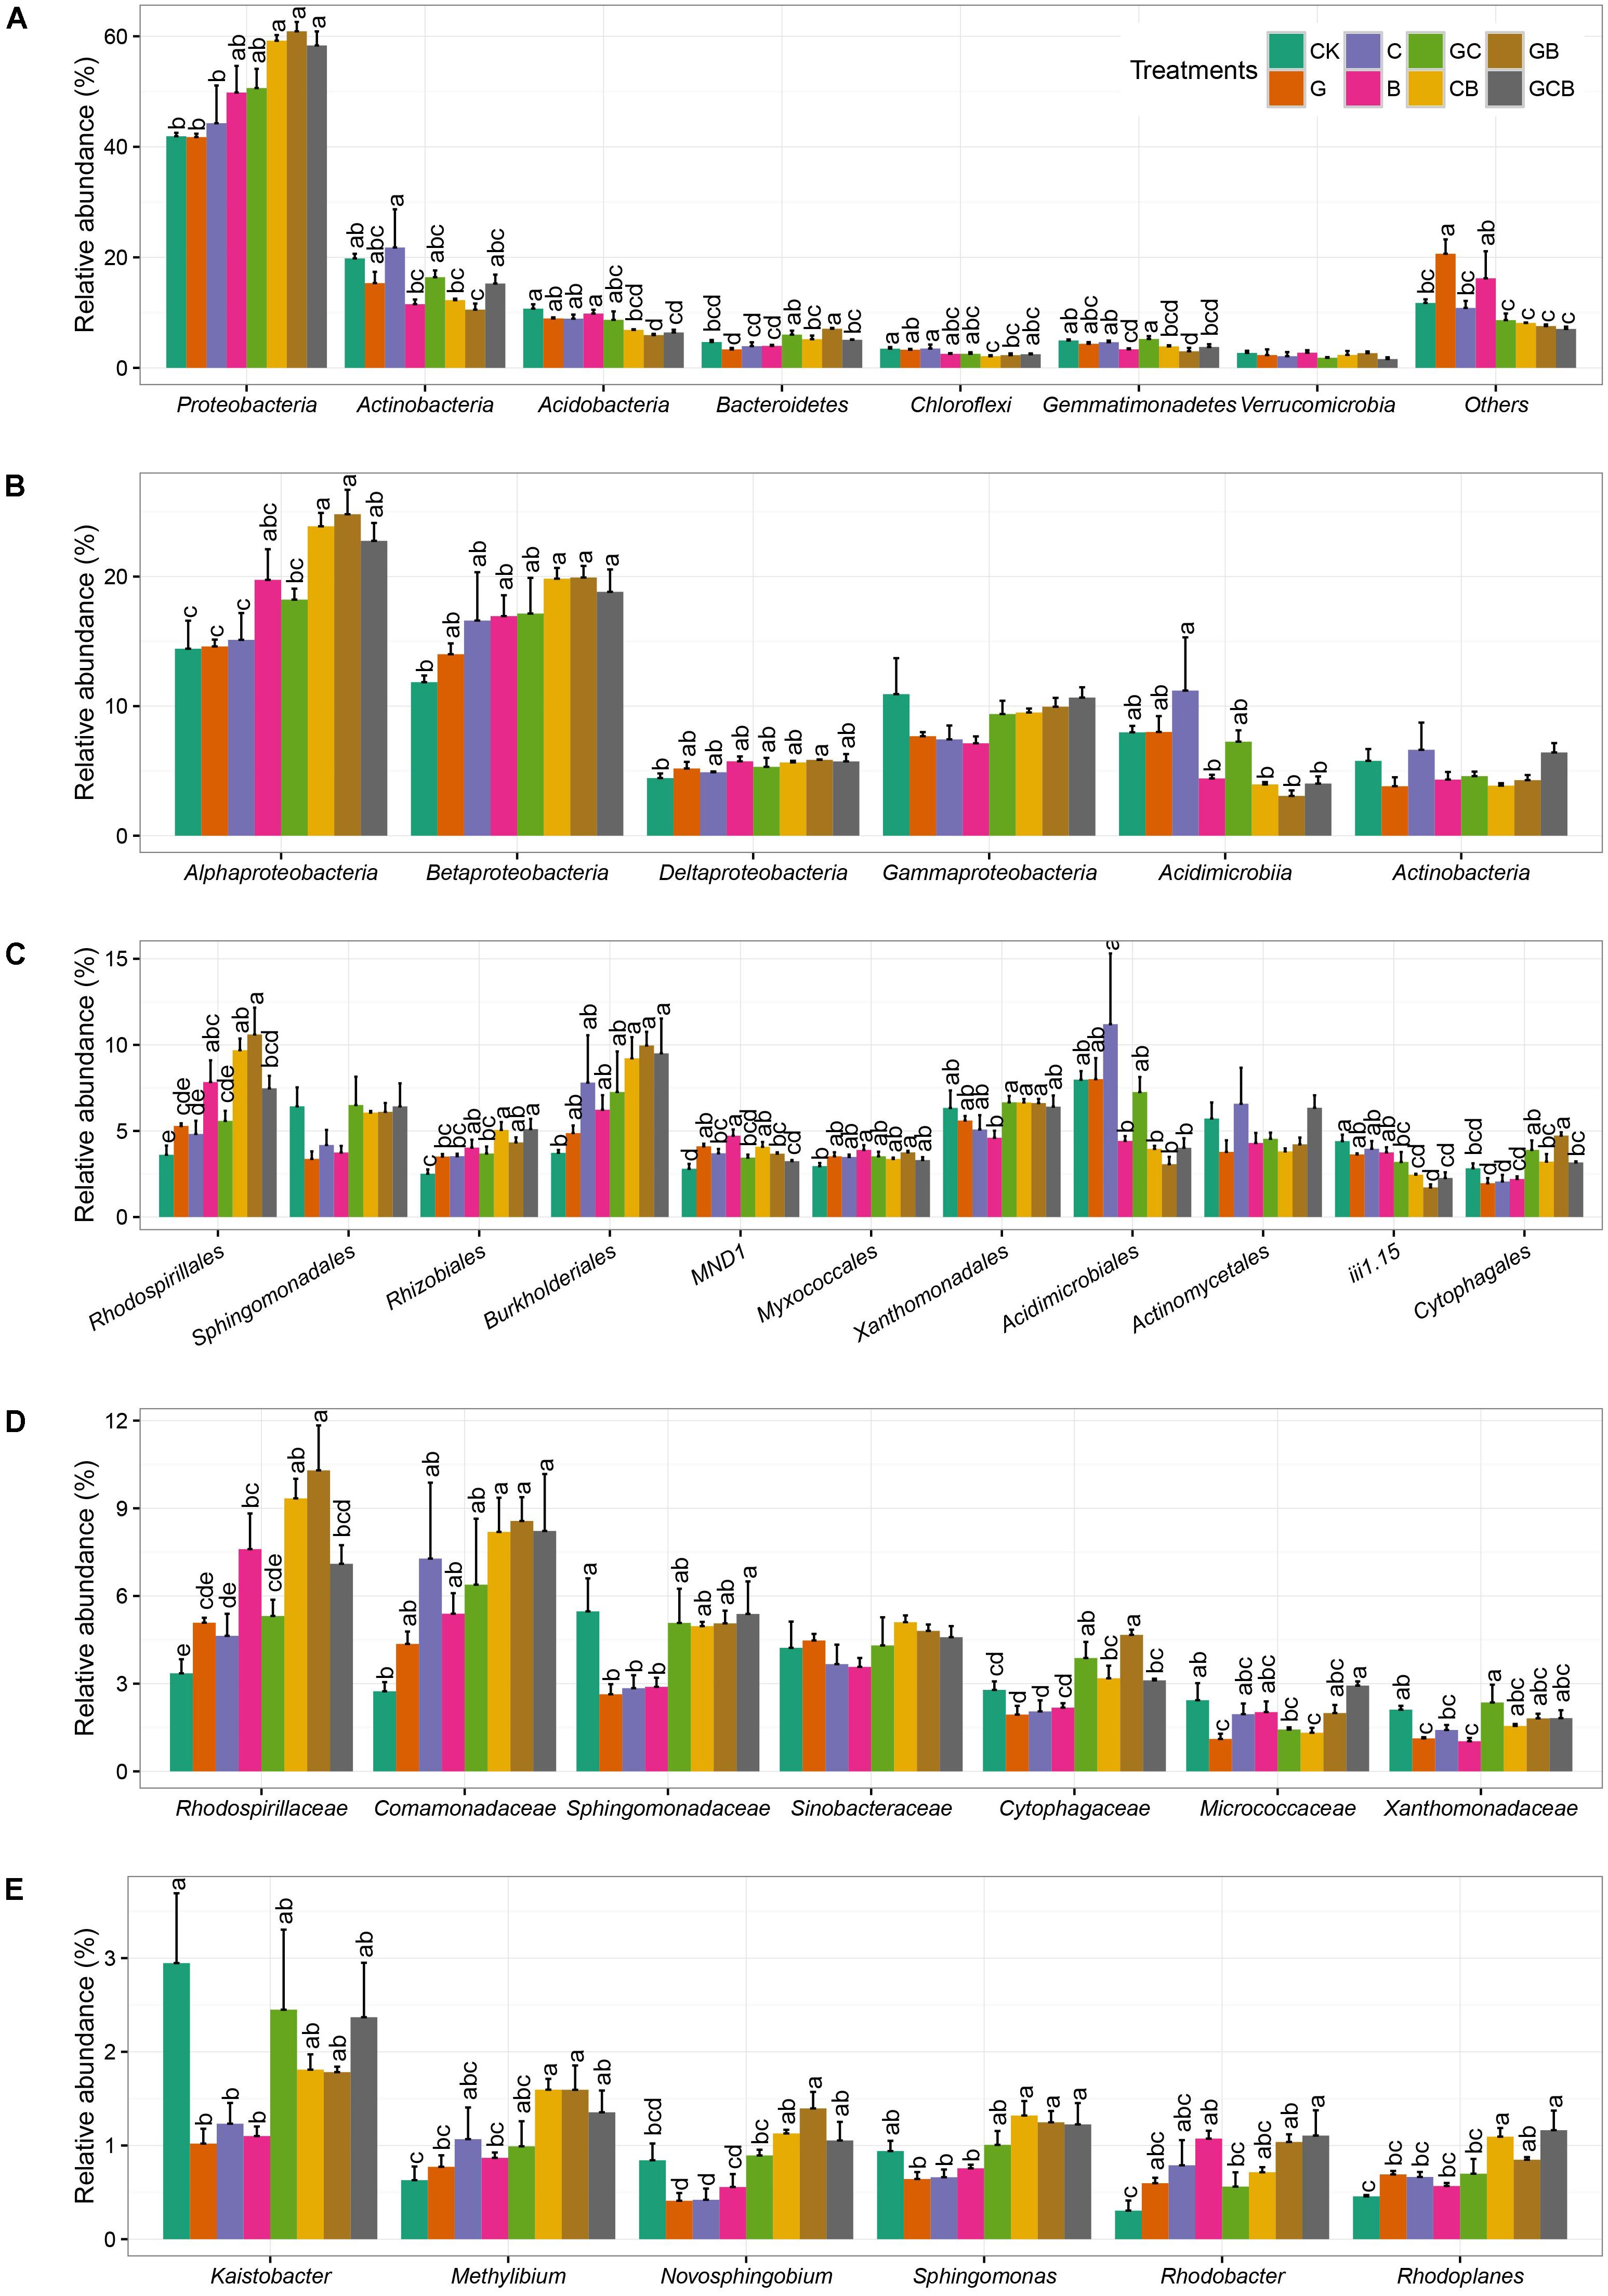
FIGURE 3. Relative abundance of dominant rhizospheric bacterial community at the phylum level (A), class level (B), order level (C), family level (D), and genus level (E) within different treatments. Different letters within a class indicate significant differences at P < 0.05. No letters indicate no significant difference within a phylum. Error bars indicate the standard error of relative abundance between three replicate samples. CK, control; G, S. viridis monoculture; C, S. bungeana monoculture; B, B. ischaemum monoculture; GC, S. viridis + S. bungeana; CB, S. bungeana + B. ischaemum; GB, S. viridis + B. ischaemum; GCB, S. viridis + S. bungeana + B. ischaemum.
The classes Alpha-, Beta-, Delta-, and Gammaproteobacteria, all part of the most dominant phylum Proteobacteria, accounted for an average of 19.2, 16.89, 5.35, and 9.09% of the total populations, respectively, moreover, Acidimicrobiia and Actinobacteria had average relative abundance of 6.24 and 4.97%, respectively. Alpha- and Betaproteobacteria differed markedly in abundance among the treatments, which were higher in CB, GB, and GCB treatments compared to the other treatments. The relative abundance of Acidimicrobiia in B, CB, GB, and GCB treatments were lower compared to the other treatments (Figure 3B).
Dominant orders of Rhodospirillales, Rhizobiales, Burkholderiales, Acidimicrobiales, iii1-15, and Cytophagales showed remarkable difference among treatments. Rhodospirillales, Rhizobiales, Burkholderiales, and Cytophagales generally had higher relative abundances in CB, GB, and GCB treatments than the monocultured treatments and CK, whearas Acidimicrobiales and iii1-15 showed the opposite pattern (Figure 3C). At the family level, Rhodospirillaceae, Comamonadaceae, and Cytophagaceae had generally higher relative abundance in CB, GB, and GCB treatments compared to monocultured and CK treatments, and relative abundance of Sphingomonadaceae was higher in mixed treatments than in monocultured treatments (Figure 3D). All of dominant genuses displayed in Figure 3E showed similar trends, especially Methylibium, Novosphingobium, and Sphingomonas, relative abundance of which were higher in CB, GB, and GCB treatments than in monocultured and CK treatments.
Bacterial β-Diversity Analysis at the OTU-Level
The PCoA clustered the bacterial communities into three distinct groups: the monocultured treatments, the mixed treatments and CK. Bacterial communities from the same planting pattern tended to group together, and showed strong clustering between samples from similar planting patterns (Figure 4).
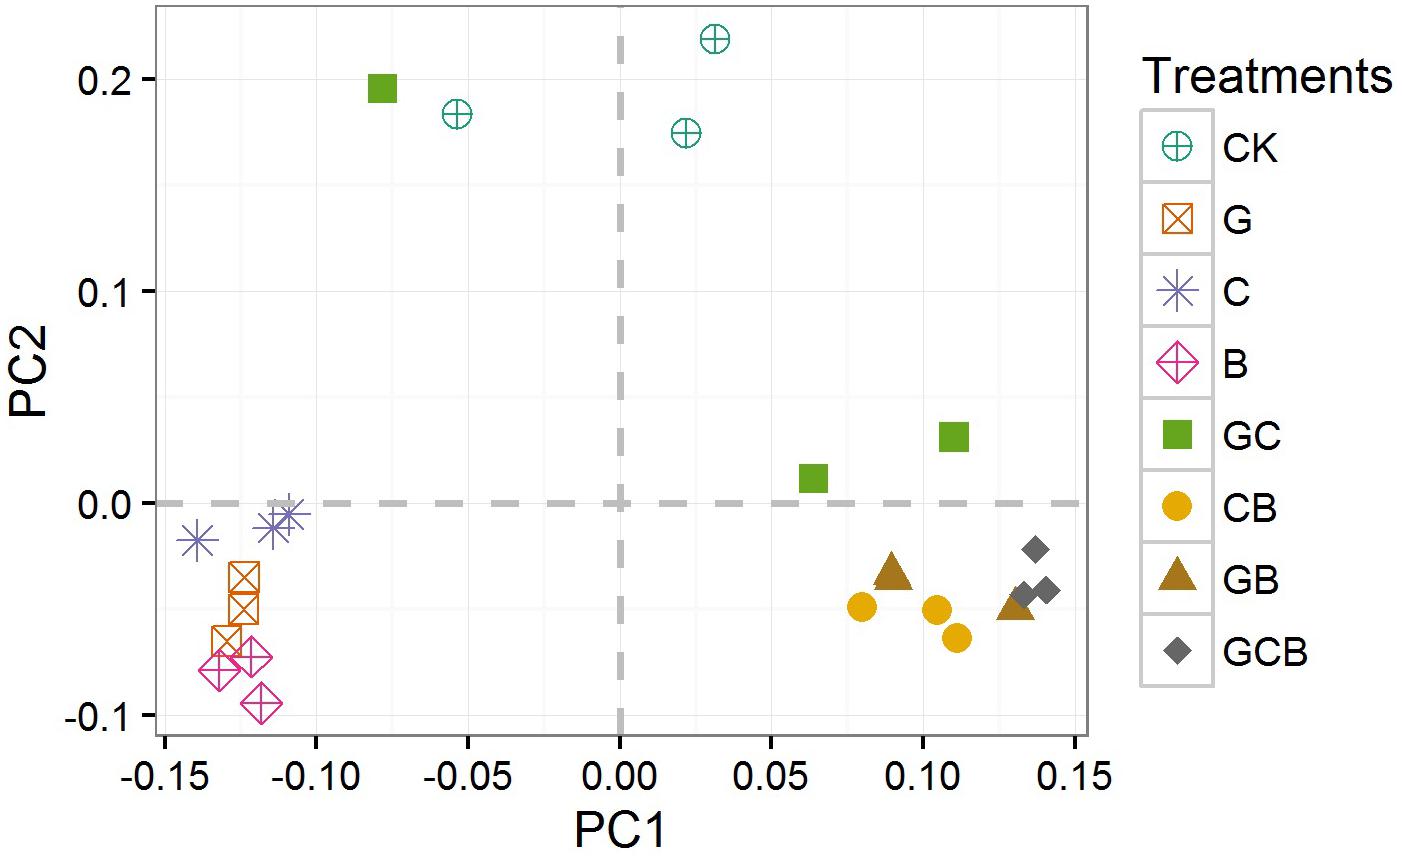
FIGURE 4. Principal coordinates analysis (PCoA) of bacterial community based on Unweighted Unifrac distances. CK, control; G, S. viridis monoculture; C, S. bungeana monoculture; B, B. ischaemum monoculture; GC, S. viridis + S. bungeana; CB, S. bungeana + B. ischaemum; GB, S. viridis + B. ischaemum; GCB, S. viridis + S. bungeana + B. ischaemum.
Relationships Between Soil Properties and Bacterial Communities
The CCA analysis indicated that the first two canonical axes explained a total of 60.49% of the total variance, with the first and second axes explaining 49.09 and 10.59%, respectively (Figure 5). SOC, WSOC, NO3--N and AP contents were the most influential factors driving the differences in community structure (Table 3). The vectors on the CCA ordination plot generally suggested that most subgroups of Proteobacteria were positively correlated with carbon contents, and the dominant subgroups of Actinobacteria and Acidobacteria were opposite. Sphingomonadales, Xanthomonadales, and Cytophagales was positively correlated with NO3--N and AP contents.
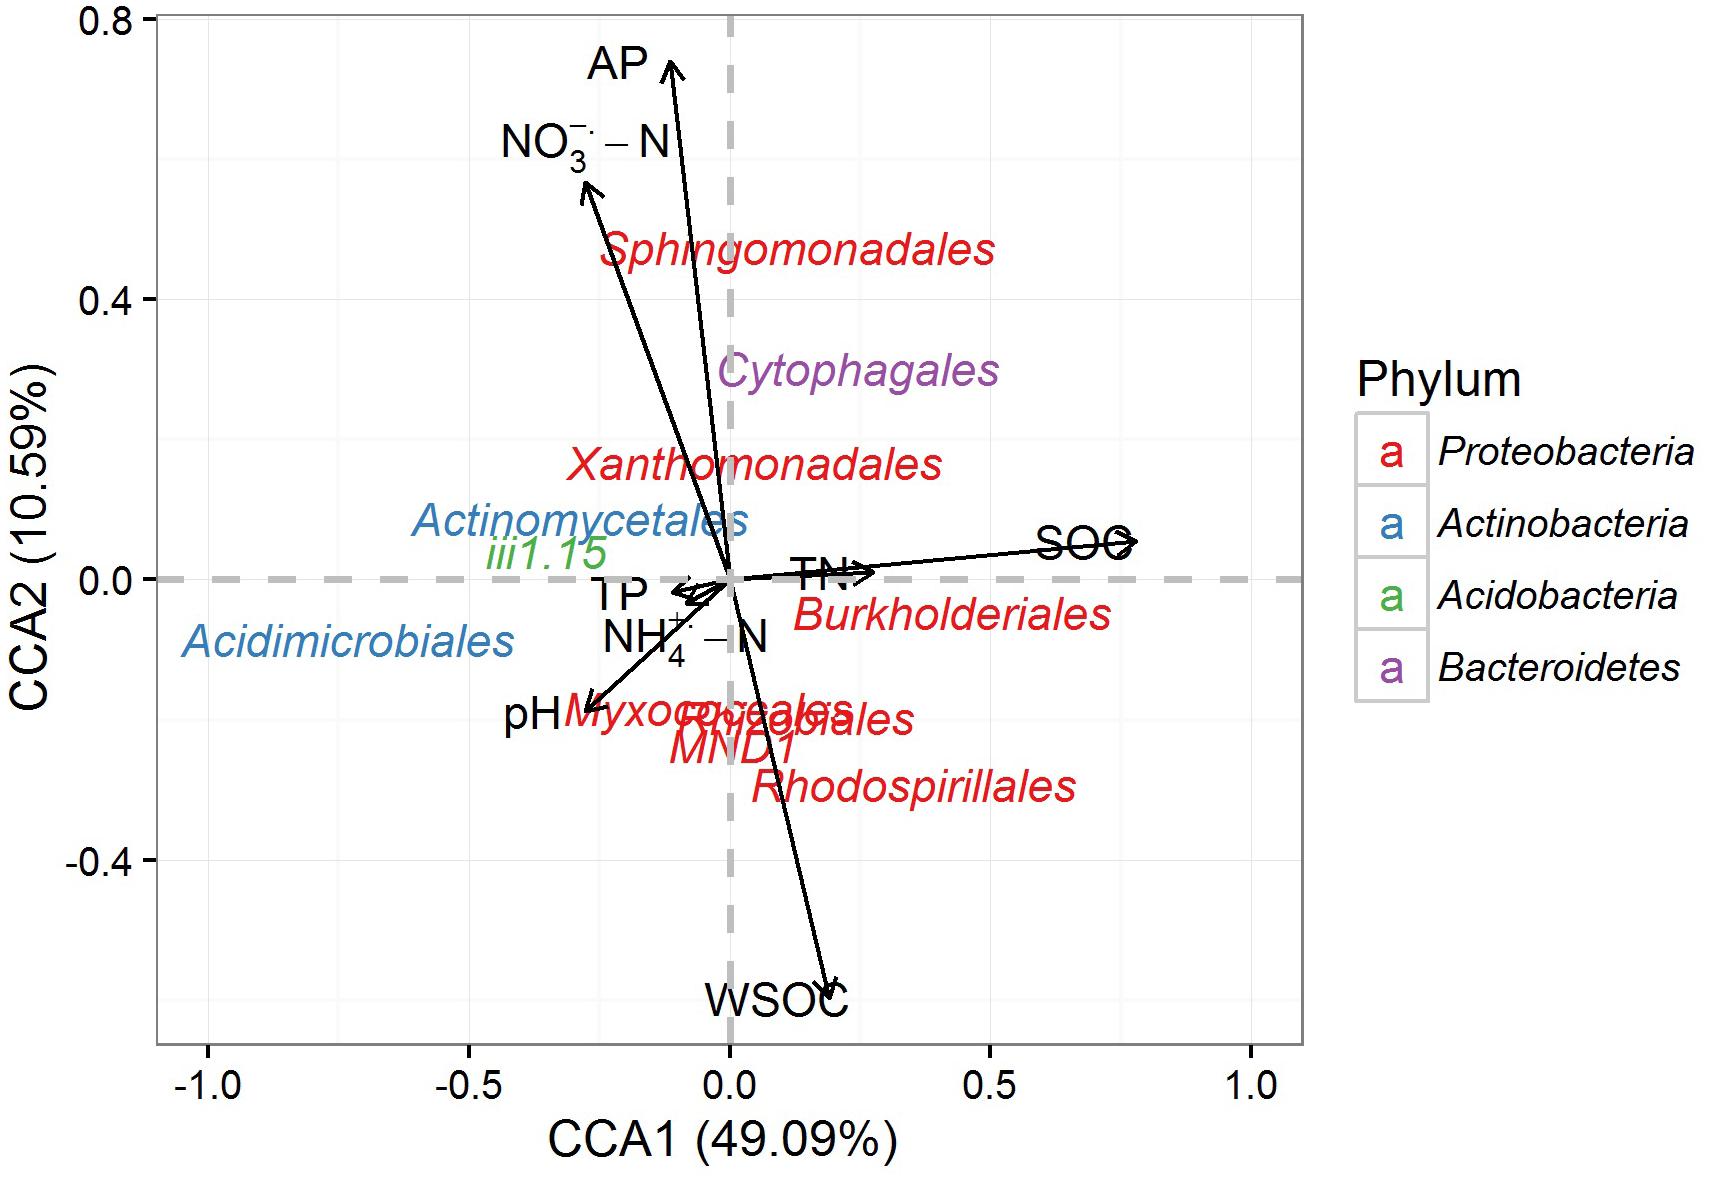
FIGURE 5. Canonical correspondence analysis (CCA) illustrating the relationships of the soil properties and the dominant rhizospheric bacterial orders.
The soil-nutrient indices used in the SEM was selected based on the CCA analysis and identified large influences on the rhizospheric bacterial communities. The SEM model fit the data well (χ2= 4.981; P = 0.760) and accounted for 45, 15, 34, and 15% of the variability in SOC, WSOC, NO3--N and AP contents, respectively (Figure 6). Belowground dry weight showed positive effect on SOC, WSOC, NO3--N contents and negatively affected AP content. Change of bacterial structure were resulted from the direct and positive effects of SOC, WSOC, NO3--N, and AP content, and change of bacterial richness was resulted from the positive effect of SOC, WSOC, and AP contents and negative effect of NO3--N content.
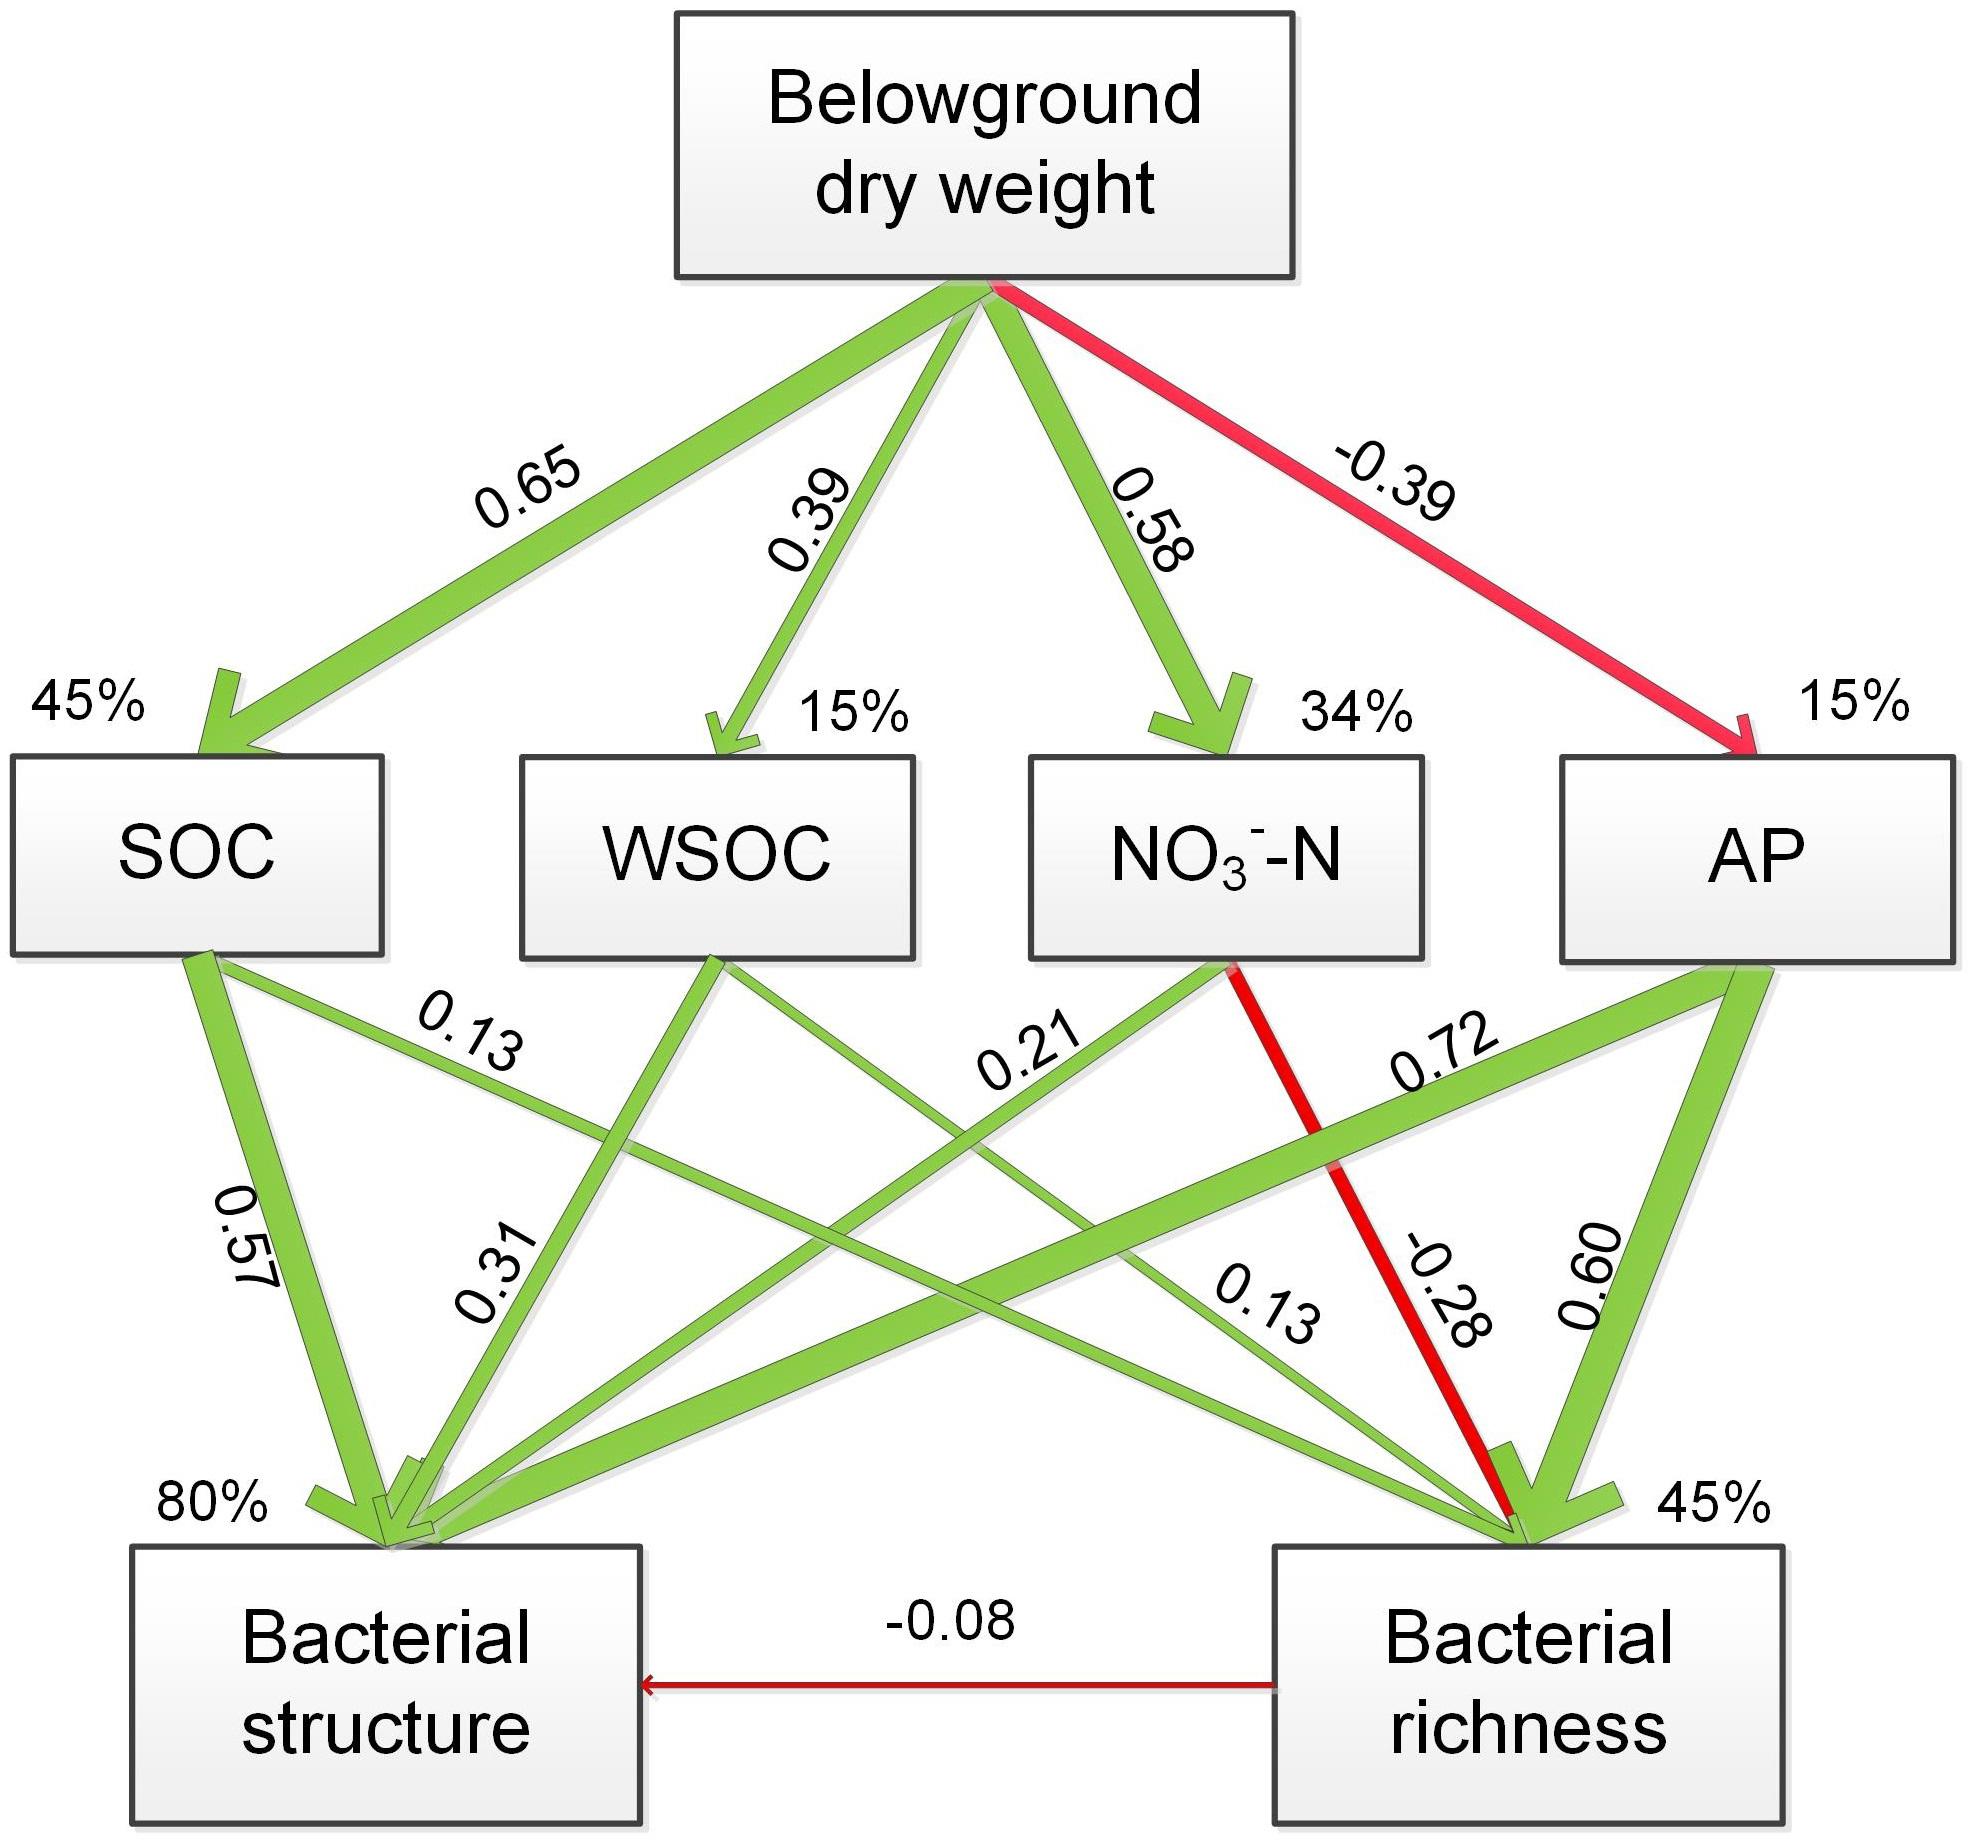
FIGURE 6. Structural equation modeling of the effect of plant composition on the plant/soil-microbe system, indicating the relationships between soil SOC, WSOC, and AP contents with bacterial structure and richness. The final model fit the data well, with χ2= 4.981, df = 8, P = 0.760. The red arrow indicates a significant negative correlation, and green arrows indicate positive correlations. The widths of the arrows are proportional to the path coefficients on the arrows. Percentages with the variables indicate the variance explained by the model (R2).
Discussion
Effect of Plant Competition on Rhizospheric Bacterial Community
We saw no evidence that bacterial diversity was affected by plant species and their competition, but the richness of the bacterial community were increased in treatments of B, CB, GB even though not significant, and were significantly increased in treatment of GCB compared to CK. It has been widely accepted that plant species had an effect on microbial diversity (Ladygina and Hedlund, 2010; Burns et al., 2015). However, it is not surprising that S. viridis, S. bungeana, and B. ischaemum and their competitive treatments showed similar rhizospheric bacterial diversity, because these three grass species belong to Poaceae, and the competitive time of grass was too short to establish and generate rhizospheric bacterial community that was in contact with focal plant root system. Higher bacterial richness indices in treatments of B, CB, GB, and GCB than CK treatment was mainly due to the high inputs of readily assimilable organic substrates from the roots and the development of opportunistic populations (Marschner et al., 2004; Nielsen et al., 2011), and the higher SOC and WSOC contents in these treatments were consistent with this interpretation (Table 3). It is widely acknowledge that plants produce different amounts and compositions of carbon resources (Berg and Smalla, 2009; Ladygina and Hedlund, 2010), with a large proportion of the carbon in the form of water-soluble substances such as sugars, organic acids, and amino acids (Marschner et al., 2004).
As we expected, plant species and competition had an effect on rhizospheric bacterial composition in different levels. Regardless of treatments, Proteobacteria and Actinobacteria were in relatively high abundance (50.82 and 15.36%, respectively), which was in agreement with previous studies (Qiu et al., 2012; Li et al., 2015; Zhang et al., 2016), showing that they are two ubiquitous and common bacterial groups in soil. Of the four sub-groups of Proteobacteria phyla, Alpha- and Betaproteobacteria was more prevalent, which was in keeping with other findings (de Cárcer et al., 2007; Zhang et al., 2016). Within treatments, plant competitive treatments, especially CB, GB and GCB, generally increased the relative abundances of Proteobacteria and Bacteroidetes, and decreased the relative abundances of Actinobacteria and Acidobacteria compared to the monocultured and CK treatments. PCoA analyses confirmed that bacterial communities in the mixed treatments were different from the monocultured and CK treatments (Figure 4). The nutrient content was lower and nutrient availability was poorer in our study compared to soil that has been restored for many years (Zhang et al., 2016). Proteobacteria and Bacteroidetes have copiotrophic characteristics and become abundant when labile substrates are available (Fierer et al., 2007), but Actinobacteria and Acidobacteria are oligotrophic groups and prefer nutrient-poor environments (Fierer et al., 2007; McHugh and Schwartz, 2015). Thus, oligotrophs outcompete copiotrophs in competitive treatments mainly due to the presence of B. ischaemum, which was perennial and C4 grass species having stronger capacity for photosynthesis and releasing root exudates (Kowalchuk et al., 2002), and finally affected soil-nutrient contents in rhizosphere (Marschner et al., 2004; McHugh and Schwartz, 2015). Plant competition generally changed bacterial communities suggesting that plant combination were more effective than single species for driving the transitions of belowground bacterial communities from slow-growing oligotrophic groups to fast-growing copiotrophic groups.
Differences of Proteobacteria and Acidobacteria among treatments was mainly caused by changes of Alpha- and Betaproteobacteria and Acidimicrobiia. In order level, plant competition facilitated the increase of Rhodospirillales, Rhizobiales, Burkholderiales, and Cytophagales, and hindered the increase of Acidimicrobiales and iii1-15. Interestingly, all of dominant families and genuses generally showed relatively higher abundance in competitive treatments like CB, GB, and GCB. These results suggested that plant competition had a sensitive effect on dominant populations affiliated with different taxa levels, which likely play an important role in driving changes in rhizospheric bacterial structure and improving soil-nutrient condition by rapidly decomposing soil organic matter during ecological restoration on the Loess Plateau.
Response of Plant Growth and Competition to Rhizospheric Bacterial Community
Relative yield total is an index to quantify the extent to which components of a mixture compete for common limiting resources (De Wit, 1960; Snaydon, 1991). In our study, RYT value in three mixture treatments were closed to 2 (1.992, 1.869, 1.942), indicating that two components almost did not compete and show full resource complementarity. The competitive ratio (CR) gives the exact degree of competition by indicating the number of times one component is more competitive than the other (Willey and Rao, 1980). CRij value is less than 1 means i is less competitive than j, therefore, the competitive degree of three grasses in this study presented as S. viridis < S. bungeana < B. ischaemum. This result was in concordance with the natural phenomena, as we found, S. viridis was earlier successional species, whereas S. bungeana and B. ischaemum were dominant at the middle and later successional stages, and B. ischaemum were C4 plant having larger photosynthetic capacity and environmental adaptability (Zhang, 2005; Wang, 2006; Wang et al., 2009).
Rhizospheric bacterial community imposed an effect on plant growth and competition. As we see, the biomass of B. ischaemum in monoculture was less than that in mixture treatments (Table 2), and treatments of B, CB, GB, and GCB have apparently higher abundance of family Rhodospirillaceae, and treatments of B, GB, and GCB have obviously higher abundance of genus Rhodobacter (Figure 3). Our results indicated that B. ischaemum tended to grow better when lived together with other species, and the unique bacterial communities associated with B. ischaemum facilitated the improvement of competitive ability. Genus Rhodobacter family Rhodospirillaceae (order Rhodobacterales, class Alphaproteobacteria) are photosynthetic bacterium and have exuberant vitality, which can grow photoheterotrophically under anoxic conditions in the light, chemoheterotrophically in the dark, or heterotrophically under aerobic/microaerobic conditions (Baldani et al., 2014). Due to Rhodobacter can encode proteins involved in numerous energy-generating and energy-utilizing processes, such as photosynthesis, carbon fixation, nitrogen fixation, hydrogen utilization, aerobic and anaerobic respiration, denitrification, electron transport and aerotaxis (Madigan et al., 1984; Elsen et al., 2004), the growth and metabolism of these bacterium play an irreplaceable role in carbon and nitrogen cycle as well as material transformation. Therefore, we believe that B. ischaemum outcompete other grass species and become the dominant species in the late natural succession stage was attributed to not only the strong competitiveness and adaptiveness but also the function of photosynthetic bacterium cultivated by itself.
Response of Bacterial Communities to Soil Properties
The CCA indicated that the abundances of the dominant sub-groups of Proteobacteria, Actinobacteria, Acidobacteria and Bacteroidetes were greatly affected by some soil properties. Results of CCA variance partitioning of environmental factors to the microbial communities indicated that SOC, WSOC, NO3--N and AP contents were important driving factors for the formation and transformation of the rhizospheric communities. The SEM model supported the CCA result and indicated that grass competition accounted for 45, 15, 34, and 15% of the variability in SOC, WSOC, NO3--N and AP contents, respectively. Furthermore, SOC, WSOC, NO3--N, and AP contents together explained 80% of the variability of bacterial structure and 45% of the variability of bacterial richness. Belowground dry weight showed positive effect on SOC, WSOC, NO3--N contents and negatively affected AP content. Change of bacterial structure was thus mainly resulted from the direct and positive effects of SOC, WSOC, NO3--N, and AP content, and change of bacterial richness was resulted from the positive effect of SOC, WSOC, and AP contents and negative effect of NO3--N content.
Most of the Proteobacteria sub-groups were positively correlated with factors associated with carbon, and the dominant subgroups of Actinobacteria and Acidobacteria was opposite, suggesting that most members of this phylum were sensitive to the differences in soil carbon. The presence of grass on bare land will provide organic carbon and nitrogen to decomposer organisms in the form of rhizodeposition and dead biomass, which will subsequently favor copiotrophic groups such as Proteobacteria (Goldfarb et al., 2011; Philippot et al., 2013), and defer oligotrophic groups such as Actinobacteria and Acidobacteria (Fierer et al., 2007, 2012). In addition, Sphingomonadales, Xanthomonadales, and Cytophagales was positively correlated with NO3--N and AP contents. This result suggested that NO3--N and AP contents also plays an important role in the formation of rhizospheric bacterial communities, and Zhang et al. (2016) found a close correlation between AP content and bacterial structure. The bacterial structure in our study, however, was poorly correlated with NH4+-N, TN, and TP contents and pH value. These indices did not differ significantly after the 4-month pot experiment and remained within a narrow range, which may have been responsible for the weak correlations.
Conclusion
Interactions between plant and soil communities existed in a short-term competitive experiment. Mixture treatments associated with B. ischaemum increased the relative abundance of Proteobacteria and Bacteroidetes and decreased the relative abundance of Actinobacteria and Acidobacteria. In turn, photosynthetic bacterium, Genus Rhodobacter family Rhodospirillaceae, affected the growth condition and contributed to increased the competitive ability of B. ischaemum. In addition, plant composition caused the difference of SOC, WSOC, NO3--N and AP contents, which explained most of the differences in the rhizospheric bacterial communities. Therefore, this interaction between plant composition and soil was in part responsible for plant competitive result and may be the key driving factor to impact and change the trend of vegetation succession on the Loess Plateau of China.
Author Contributions
CS, SX, and GL initiated and designed the research, collected the materials, and performed the experiments. SX and GL obtained funding for this study. CS analyzed the data and wrote the manuscript. All authors read and approved the manuscript.
Funding
This study was financially supported by the Natural Science Foundation of China (41771557), National Key Technology R&D Program (2015BAC01B03), and the Foundation for Western Young Scholars, Chinese Academy of Sciences (XAB2015A05).
Conflict of Interest Statement
The authors declare that the research was conducted in the absence of any commercial or financial relationships that could be construed as a potential conflict of interest.
The reviewer GY declared a shared affiliation, with no collaboration, with the authors to the handling Editor at time of review.
Acknowledgments
We would like to express our sincere thanks to the reviewers and issue editor of the journal for their valuable comments, suggestions, and revisions of this manuscript.
Footnotes
References
Aguilera, A. G., Colón-Carmona, A., Kesseli, R., and Dukes, J. S. (2011). No accession-specific effect of rhizosphere soil communities on the growth and competition of arabidopsis thaliana accessions. PLoS One 6:e27585. doi: 10.1371/journal.pone.0027585
Aguilera, A. G., Morey, S., Gammon, M., Jiang, M., Ramos, S., and Kesseli, R. (2017). Effect of plant–soil feedbacks on the growth and competition of Lactuca species. Plant Ecol. 218, 359–372. doi: 10.1007/s11258-016-0697-3
Andrews, M., Hodge, S., and Raven, J. A. (2010). Positive plant microbial interactions. Ann. Appl. Biol. 157, 317–320. doi: 10.1111/j.1744-7348.2010.00440.x
Baldani, J. I., Videira, S. S., dos Santos Teixeira, K. R., Reis, V. M., de Oliveira, A. L. M., Schwab, S., et al. (2014). The Prokaryotes: Alphaproteobacteria and Betaproteobacteria. Berlin: Springer, 533–618.
Berg, G., and Smalla, K. (2009). Plant species and soil type cooperatively shape the structure and function of microbial communities in the rhizosphere. FEMS Microbiol. Ecol. 68, 1–13. doi: 10.1111/j.1574-6941.2009.00654.x
Bokulich, N. A., Subramanian, S., Faith, J. J., Gevers, D., Gordon, J. I., Knight, R., et al. (2013). Quality-filtering vastly improves diversity estimates from Illumina amplicon sequencing. Nat. Methods 10, 57–59. doi: 10.1038/nmeth.2276
Bremner, J. M., and Mulvaney, C. S. (1982). “Nitrogen-total,” in Methods of Soil Analysis: Chemical and Microbial Properties, Part 2, eds A. L. Page, R. H. Miller, and D. R. Keeney (Madison, WI: American Society of Agronomy), 595–624.
Burns, J. H., Anacker, B. L., Strauss, S. Y., and Burke, D. J. (2015). Soil microbial community variation correlates most strongly with plant species identity, followed by soil chemistry, spatial location and plant genus. AoB Plants 7, plv030. doi: 10.1093/aobpla/plv030
Caporaso, J. G., Kuczynski, J., Stombaugh, J., Bittinger, K., Bushman, F. D., Costello, E. K., et al. (2010). QIIME allows analysis of high-throughput community sequencing data. Nat. Methods 7, 335–336. doi: 10.1038/nmeth.f.303
de Cárcer, D. A., Martín, M., Karlson, U., and Rivilla, R. (2007). Changes in bacterial populations and in biphenyl dioxygenase gene diversity in a polychlorinated biphenyl-polluted soil after introduction of willow trees for rhizoremediation. Appl. Environ. Microbiol. 73, 6224–6232. doi: 10.1128/AEM.01254-07
DeSantis, T. Z., Hugenholtz, P., Larsen, N., Rojas, M., Brodie, E. L., Keller, K., et al. (2006). Greengenes, a chimera-checked 16S rRNA gene database and workbench compatible with ARB. Appl. Environ. Microbiol. 72, 5069–5072. doi: 10.1128/AEM.03006-05
Edgar, R. C. (2013). UPARSE: highly accurate OTU sequences from microbial amplicon reads. Nat. Methods 10, 996–998. doi: 10.1038/nmeth.2604
Edgar, R. C., Haas, B. J., Clemente, J. C., Quince, C., and Knight, R. (2011). UCHIME improves sensitivity and speed of chimera detection. Bioinformatics 27, 2194–2200. doi: 10.1093/bioinformatics/btr381
Elsen, S., Swem, L. R., Swem, D. L., and Bauer, C. E. (2004). RegB/RegA, a highly conserved redox-responding global two-component regulatory system. Microbiol. Mol. Biol. Rev. 68, 263–279. doi: 10.1128/MMBR.68.2.263-279.2004
Felske, A., Wolterink, A., Van Lis, R., De Vos, W. M., and Akkermans, A. D. L. (2000). Response of a soil bacterial community to grassland succession as monitored by 16S rRNA levels of the predominant ribotypes. Appl. Environ. Microbiol. 66, 3998–4003. doi: 10.1128/AEM.66.9.3998-4003.2000
Fierer, N., Bradford, M. A., and Jackson, R. B. (2007). Toward an ecological classification of soil bacteria. Ecology 88, 1354–1364. doi: 10.1890/05-1839
Fierer, N., Lauber, C. L., Ramirez, K. S., Zaneveld, J., Bradford, M. A., and Knight, R. (2012). Comparative metagenomic, phylogenetic and physiological analyses of soil microbial communities across nitrogen gradients. ISME J. 6, 1007–1017. doi: 10.1038/ismej.2011.159
Goldberg, D. E., and Barton, A. M. (1992). Patterns and consequences of interspecific competition in natural communities: a review of field experiments with plants. Am. Nat. 139, 771–801. doi: 10.1086/285357
Goldfarb, K. C., Karaoz, U., Hanson, C. A., Santee, C. A., Bradford, M. A., Treseder, K. K., et al. (2011). Differential growth responses of soil bacterial taxa to carbon substrates of varying chemical recalcitrance. Front. Microbiol. 2:94. doi: 10.3389/fmicb.2011.00094
Grace, J. B. (2006). Structural Equation Modeling and Natural Systems. Cambridge: Cambridge University Press. doi: 10.1017/CBO9780511617799
Kardol, P., Martijn Bezemer, T., and van der Putten, W. H. (2006). Temporal variation in plant–soil feedback controls succession. Ecol. Lett. 9, 1080–1088. doi: 10.1111/j.1461-0248.2006.00953.x
Kowalchuk, G. A., Buma, D. S., de Boer, W., Klinkhamer, P. G. L., and van Veen, J. A. (2002). Effects of above-ground plant species composition and diversity on the diversity of soil-borne microorganisms. Antonie Van Leeuwenhoek 81, 509–520. doi: 10.1023/A:1020565523615
Kulmatiski, A., Beard, K. H., Stevens, J. R., and Cobbold, S. M. (2008). Plant–soil feedbacks: a meta-analytical review. Ecol. Lett. 11, 980–992. doi: 10.1111/j.1461-0248.2008.01209.x
Kuramae, E., Gamper, H., van Veen, J., and Kowalchuk, G. (2011). Soil and plant factors driving the community of soil-borne microorganisms across chronosequences of secondary succession of chalk grasslands with a neutral pH. FEMS Microbiol. Ecol. 77, 285–294. doi: 10.1111/j.1574-6941.2011.01110.x
Ladygina, N., and Hedlund, K. (2010). Plant species influence microbial diversity and carbon allocation in the rhizosphere. Soil Biol. Biochem. 42, 162–168. doi: 10.1016/j.soilbio.2009.10.009
Lamb, E. G., Kennedy, N., and Siciliano, S. D. (2010). Effects of plant species richness and evenness on soil microbial community diversity and function. Plant Soil 338, 483–495. doi: 10.1007/s11104-010-0560-6
Li, Y., Chen, L., and Wen, H. (2015). Changes in the composition and diversity of bacterial communities 13 years after soil reclamation of abandoned mine land in eastern China. Ecol. Res. 30, 357–366. doi: 10.1007/s11284-014-1230-6
Liu, W., and Wang, Z. (2009). Nitrogen isotopic composition of plant-soil in the Loess Plateau and its responding to environmental change. Chin. Sci. Bull. 54, 272–279. doi: 10.1007/s11434-008-0442-y
Madigan, M., Cox, S. S., and Stegeman, R. A. (1984). Nitrogen fixation and nitrogenase activities in members of the family Rhodospirillaceae. J. Bacteriol. 157, 73–78.
Marschner, P., Crowley, D., and Yang, C. H. (2004). Development of specific rhizosphere bacterial communities in relation to plant species, nutrition and soil type. Plant Soil 261, 199–208. doi: 10.1023/B:PLSO.0000035569.80747.c5
McHugh, T. A., and Schwartz, E. (2015). Changes in plant community composition and reduced precipitation have limited effects on the structure of soil bacterial and fungal communities present in a semiarid grassland. Plant Soil 388, 175–186. doi: 10.1007/s11104-014-2269-4
Murphy, J., and Riley, J. P. (1962). A modified single solution method for the determination of phosphate in natural waters. Anal. Chim. Acta 27, 31–36. doi: 10.1016/S0003-2670(00)88444-5
Nelson, D. W., and Sommers, L. E. (1982). “Total carbon, organic carbon, and organic matter,” in Methods of Soil Analysis: Chemical and Microbial Properties, Part 2, eds A. L. Page, R. H. Miller, and D. R. Keeney (Madison, WI: Agronomy Society of America), 539–552.
Nielsen, U. N., Ayres, E., Wall, D. H., and Bardgett, R. D. (2011). Soil biodiversity and carbon cycling: a review and synthesis of studies examining diversity–function relationships. Eur. J. Soil Sci. 62, 105–116. doi: 10.1111/j.1365-2389.2010.01314.x
Ning, Y., Liu, W., and An, Z. (2008). A 130-ka reconstruction of precipitation on the Chinese Loess Plateau from organic carbon isotopes. Palaeogeogr. Palaeocl. 270, 59–63. doi: 10.1016/j.palaeo.2008.08.015
Olsen, S. R., and Sommers, L. E. (1982). “Phosphorous,” in Methods of Soil Analysis: Chemical and Microbial Properties, Part 2, eds A. L. Page, R. H. Miller, and D. R. Keeney (Madison, WI: Agronomy Society of America), 403–430.
Peiffer, J. A., Spor, A., Koren, O., Jin, Z., Tringe, S. G., Dangl, J. L., et al. (2013). Diversity and heritability of the maize rhizosphere microbiome under field conditions. Proc. Natl. Acad. Sci. U.S.A. 110, 6548–6553. doi: 10.1073/pnas.1302837110
Philippot, L., Raaijmakers, J. M., Lemanceau, P., and van der Putten, W. H. (2013). Going back to the roots: the microbial ecology of the rhizosphere. Nat. Rev. Microbiol. 11, 789–799. doi: 10.1038/nrmicro3109
Qiu, M., Zhang, R., Xue, C., Zhang, S., Li, S., Zhang, N., et al. (2012). Application of bio-organic fertilizer can control Fusarium wilt of cucumber plants by regulating microbial community of rhizosphere soil. Biol. Fertil. Soils 48, 807–816. doi: 10.1007/s00374-012-0675-4
R Development Core Team (2004). R: A Language and Environment for Statistical Computing. Vienna: R Foundation for Statistical Computing.
Reynolds, H. L., Packer, A., Bever, J. D., and Clay, K. (2003). Grassroots ecology: plant–microbe–soil interactions as drivers of plant community structure and dynamics. Ecology 84, 2281–2291. doi: 10.1890/02-0298
Sims, J. R., and Haby, V. A. (1971). Simplified colorimetric determination of soil organic matter. Soil Sci. 112, 137–141. doi: 10.1097/00010694-197108000-00007
Singh, B. K., Millard, P., Whiteley, A. S., and Murrell, J. C. (2004). Unravelling rhizosphere–microbial interactions: opportunities and limitations. Trends Microbiol. 12, 386–393. doi: 10.1016/j.tim.2004.06.008
Snaydon, R. W. (1991). Replacement or additive designs for competition studies? J. Appl. Ecol. 28, 930–946. doi: 10.2307/2404218
van de Voorde, T. F. J., van der Putten, W. H., and Martijn Bezemer, T. (2011). Intra- and interspecific plant–soil interactions, soil legacies and priority effects during old-field succession. J. Ecol. 99, 945–953. doi: 10.1111/j.1365-2745.2011.01815.x
Wang, G., Liu, G., and Xu, M. (2009). Above- and belowground dynamics of plant community succession following abandonment of farmland on the Loess Plateau, China. Plant Soil 316, 227–239. doi: 10.1007/s11104-008-9773-3
Wang, G.-H. (2006). Can the restoration of natural vegetation be accelerated on the Chinese Loess Plateau? A study of the response of the leaf carbon isotope ratio of dominant species to changing soil carbon and nitrogen levels. Ecol. Res. 21, 188–196. doi: 10.1007/s11284-005-0103-4
Wang, N., Jiao, J., Jia, Y., and Zhang, X. (2011). Soil seed bank composition and distribution on eroded slopes in the hill-gully Loess Plateau region (China): influence on natural vegetation colonization. Earth Surf. Proc. Land. 36, 1825–1835. doi: 10.1002/esp.2209
Wang, Q., Garrity, G. M., Tiedje, J. M., and Cole, J. R. (2007). Naïve bayesian classifier for rapid assignment of rRNA sequences into the new bacterial taxonomy. Appl. Environ. Microbiol. 73, 5261–5267. doi: 10.1128/AEM.00062-07
Willey, R., and Rao, M. (1980). A competitive ratio for quantifying competition between intercrops. Exp. Agric. 16, 117–125. doi: 10.1017/S0014479700010802
Xu, B., Xu, W., Huang, J., Shan, L., and Li, F. (2011). Biomass allocation, relative competitive ability and water use efficiency of two dominant species in semiarid Loess Plateau under water stress. Plant Sci. 181, 644–651. doi: 10.1016/j.plantsci.2011.03.005
Zak, D. R., Holmes, W. E., White, D. C., Peacock, A. D., and Tilman, D. (2003). Plant diversity, soil microbial communities, and ecosystem function: are there any links? Ecology 84, 2042–2050. doi: 10.1890/02-0433
Zhang, C., Liu, G., Xue, S., and Wang, G. (2016). Soil bacterial community dynamics reflect changes in plant community and soil properties during the secondary succession of abandoned farmland in the Loess Plateau. Soil Biol. Biochem. 97, 40–49. doi: 10.1016/j.soilbio.2016.02.013
Keywords: 16S rRNA sequencing, grass, pot experiment, plant competition, plant-soil interaction
Citation: Sun C, Liu G and Xue S (2018) Interaction Between Plant Competition and Rhizospheric Bacterial Community Influence Secondary Succession of Abandoned Farmland on the Loess Plateau of China. Front. Plant Sci. 9:898. doi: 10.3389/fpls.2018.00898
Received: 10 February 2018; Accepted: 07 June 2018;
Published: 12 July 2018.
Edited by:
Brigitte Mauch-Mani, University of Neuchâtel, SwitzerlandReviewed by:
Gaihe Yang, Northwest A&F University, ChinaAnna Gray Aguilera, Simmons College, United States
Copyright © 2018 Sun, Liu and Xue. This is an open-access article distributed under the terms of the Creative Commons Attribution License (CC BY). The use, distribution or reproduction in other forums is permitted, provided the original author(s) and the copyright owner(s) are credited and that the original publication in this journal is cited, in accordance with accepted academic practice. No use, distribution or reproduction is permitted which does not comply with these terms.
*Correspondence: Sha Xue, eHVlc2hhMTAwQDE2My5jb20=