 Zexun Huai
 Lishun Peng
 Sheliang Wang
 Hua Zhao1
 Lei Shi
 Fangsen Xu
- 1National Key Laboratory of Crop Genetic Improvement, Microelement Research Center, Huazhong Agricultural University, Wuhan, China
- 2Institute of Tropical Bioscience and Biotechnology, Chinese Academy of Tropical Agricultural Sciences, Haikou, China
Boron (B) is an essential micronutrient of plants. In the present study, we characterized an Arabidopsis mutant lbt with significant low-boron tolerance that was identified based on our previous mapping of QTL for B efficiency in Arabidopsis. Multiple nutrient-deficiency analyses point out that lbt mutant is insensitive to only B-limitation stress. Compared with wild-type Col-0, the fresh weight, leaf area, root length and root elongation rate of lbt mutant were significantly improved under B deficiency during vegetative growth. lbt mutant also showed the improvements in plant height, branches and inflorescences compared with Col-0 during the reproductive stage under B limitation. Ultrastructure analysis of the leaves showed that starch accumulation in lbt mutant was significantly diminished compared with Col-0. Furthermore, there were no significant differences in the expression of transporter-related genes and B concentrations between Col-0 and lbt mutant under both normal B and low-B conditions. These results suggest that lbt mutant has a lower B demand than Col-0. Genetic analysis suggests that the low-B tolerant phenotype of lbt mutant is under the control of a monogenic recessive gene. Based on the high-density SNP linkage genetic map, only one QTL for low-B tolerance was mapped on chromosome 4 between 10.4 and 14.8 Mb. No any reported B-relative genes exist in the QTL interval, suggesting that a gene with unknown function controls the tolerance of lbt to B limitation. Taken together, lbt is a low-B tolerant mutant that does not depend on the uptake or transport of B and is controlled by a monogenic recessive gene mapped on chromosome 4, and cloning and functional analysis of LBT gene are expected to reveal novel mechanisms for plant resistance to B deficiency.
Introduction
Boron (B) is essential for the development and growth of higher plants (Warington, 1923). Considerable yield reduction in crop plants due to B deficiency is a worldwide agricultural problem (Shorrocks, 1997). Typical symptoms of B deficiency are reflected in the brittleness of leaves and inhibition of root elongation (Shorrocks, 1997). B deficiency hampers many physiological and metabolic aspects of plants, including sugar transport, cell wall structure, photosynthesis, starch granule synthesis and the metabolism of indole acetic acid (Herrera-Rodríguez et al., 2010; Li et al., 2015). B plays an important structural role in the cross-linking of cell wall rhamnogalacturonan II (RG-II) to form a stable three-dimensional pectic network which contributes to the mechanical properties of cell wall structure (Funakawa and Miwa, 2015), or vice versa, and many of the effects associated with B deficiency could be the consequence of a disturbed cell wall structure (Camacho-Cristóbal et al., 2015).
In Arabidopsis thaliana, genes involved in B uptake and transport have been cloned, and they include the BOR transporter gene family and NIP (NOD26-like intrinsic proteins) channel gene family. BOR1 is an efflux-type transporter for xylem loading in root, which is an important process for shoot response to B deficiency (Takano et al., 2002). BOR2 is essential for effective RG-II cross linking in the cell wall and root elongation under B limitation (Miwa et al., 2013). BOR4 is critical for B export from plant roots to prevent the over accumulation of B in root cells (Miwa et al., 2007). Aquaporin channel proteins NIP5;1 and NIP6;1 are required for the efficient influx of B from soils into root cells and the preferential distribution of B into young tissues, respectively (Takano et al., 2006; Tanaka et al., 2008). NIP7;1 is a channel protein with an extremely low intrinsic boric acid transport activity and is expressed principally in developing pollen grains (Li et al., 2011).
Arabidopsis thaliana mutant bor-1 is extremely sensitive to B deficiency, and its shoot growth was more inhibited than root growth, and the main reason for the defects in the bor1-1 mutant growth is the disability of B transport from root to shoot (Noguchi et al., 1997, 2000; Takano et al., 2001). Under the condition of B deficiency, overexpression lines of the BOR1 gene in A. thaliana wild-type showed increased B transport and shoot growth, which improved the fertility and seed yield of the plants (Miwa et al., 2006). Expression of NIP5;1 in response to B deficiency is mainly controlled by a conservative AUGUAA (AUG-stop) sequence in the 5′UTR (Tanaka et al., 2016). The polar localization of NIP5;1 in root was mediated by the phosphorylation of Thr in a conserved three-amino acid (ThrProGly) repeat in its N-terminal region (Wang et al., 2017). Overexpression of the NIP5;1 gene in the nip5;1 mutant could improve root elongation, fertility and B uptake under B deficiency conditions (Kato et al., 2009). However, there is few genes to be cloned related to low-B tolerance except NIPs family and the BORs family.
Map-based cloning is one of the most available methods to identify unknown function genes in plants, such as BOR1 (Takano et al., 2002). Quantitative trait loci (QTL) mapping is an important first step for map-based cloning and illuminating the genetic characteristics of complex traits (Mauricio, 2001). However, the identification of QTL mapping depends on a large of population of individuals and a high-density linkage map, which is laborious and time-consuming to construct (Shen et al., 2018). Next-generation sequencing (NGS) technologies provide a wealth of previously impossible approaches for genetic studies. High-throughput-based whole genome sequencing (WGS) is efficient for SNP discovery and high-density genetic map construction (Xu and Bai, 2015).
One of the QTLs for B efficiency, AtBE1-2 was mapped to the chromosome 1 of A. thaliana (Zeng et al., 2008). Fifty-eight genes in the confidence interval of AtBE1-2 showed up- or down-regulation under B deficiency based on a transcript profile analysis (Peng et al., 2012). T-DNA insertion mutants for the 58 genes acquired through A. thaliana Biological Resource Center (ABRC1) were employed to assess low-B tolerance capacity under low-B conditions. There were no significant differences in growth phenotypes under normal B (30 μM) condition between wild-type Col-0 and all mutants (data not shown). However, one homozygous mutant with T-DNA insertion in the exon of At1g78860 (SALK_144144C) showed significantly higher tolerance to low-B (0.1 μM) stress than Col-0, and we named it ‘lbt mutant.’ In this study, we phenotypically characterized the mutant with improved growth performance under B limitation in both vegetative and reproductive growth and analyzed its physiological characterizations in response to low-B stress. Furthermore, a major QTL for low-B tolerance was mapped to the region of 10.4–14.8 Mb on chromosome 4.
Materials and Methods
Plant Materials and Growth Conditions
Arabidopsis thaliana Col-0 was kept in our laboratory stock. Two T-DNA insertion mutant lines of At1g78860 with a Col-0 background, SALK_144144C (lbt mutant) and SALK_021225C, were acquired through A. thaliana Biological Resource Center (ABRC1). Two F2 populations were developed and used in the present study. The first F2 population was derived from a cross between Col-0 and lbt mutant (SALK_144144C) and used to analyze the co-segregation of the low-B tolerance phenotype with the genotype of T-DNA insertion in At1g78860. Another F2 mapping population was developed by a cross of lbt mutant and Cs1909 line to map the QTL for low-B tolerance of lbt mutant. Map-based cloning needs two genotypes with significant differences in target traits and genetic variation in parents to facilitate the development of molecular markers for the construction of a linkage genetic map. Col-0 and lbt mutant have a similar genetic background, so it is difficult to find additional polymorphism molecular markers from the two genotypes for the construction of a linkage map. Landsberg erecta (Ler) showed tolerance to low-B stress (identified in our previous study) and was not suitable as a parent with the low-B tolerance lbt mutant to develop a F2 population. Cs1909 is a low-B sensitive line selected from a recombinant inbred line (RIL) population that was developed by a cross between Ler and Columbia-4 (Col-4).
Seeds of the plants described above were surface-sterilized using 1% (w/v) NaClO for 10 min and rinsed in ultrapure water. The seeds were then planted on solid medium [1.51 mM NaH2PO4, 0.26 mM Na2HPO4, 1.5 mM MgSO4, 2.0 mM Ca(NO3)2, 3.0 mM KNO3, 10.3 μM MnSO4, 1.0 μM ZnSO4, 1.0 μM CuSO4, 130 nM CoCl2, 24 nM (NH4)6Mo7O24, and 50 μM FeNa-EDTA] (Fujiwara et al., 1992) containing 1% sucrose and 1% Gellan Gum supplemented with 30 μM or 0.1 μMB, respectively. For other element stress treatments, plants were cultivated in a hydroponic culture system with Hoagland and Arnon solution [5 mM KNO3, 1 mM KH2PO4, 2 mM MgSO4, 5 mM Ca(NO3)2, 50 μM FeNa-EDTA, 9 μM MnCl2, 300 nM CuSO4, 800 nM ZnSO4, and 370 nM Na2MoO4] (Hoagland and Arnon, 1950) for 10 days and then transferred into various stress conditions for 10 additional days of growth. These stress conditions included -B (0.1 μM), -N (2 μM), -P (2 μM), -K (2 μM), -Fe (0.1 μM), and ++B (3 mM). For -N treatment, KNO3 and Ca(NO3)2 were replaced by 2.5 mM K2SO4 and 5 mM CaSO4, respectively. For -K treatment, KNO3 and KH2PO4 were replaced by 2.5 mM Ca(NO3)2 and 1 mM NaH2PO4, respectively. For -P treatment, KH2PO4 was replaced by 0.5 mM K2SO4 (Qin et al., 2012). All plants were cultivated with a temperature regime of 22/20°C (day/night) and a photoperiod of 16/8 h (day/night) with a light intensity of 300–320 μmol⋅m-2⋅s-1. For the phenotypic characterization of reproductive growth, Col-0 and lbt mutant were grown on solid vertical pates with 30 μMB for 10 days and then transferred to the hydroponic culture system with various B conditions (0.5, 1, 3, 10, or 30 μM) for 25–35 days of additional growth.
Co-segregation Analysis
To verify whether the low-B tolerance of lbt mutant was caused by At1g78860, we analyzed the co-segregation of the low-B tolerance phenotype with the T-DNA insertion genotype of At1g78860. Low-B tolerance individuals in the F2 population from the cross between Col-0 and lbt mutant were used to identify the low-B tolerant genotype by PCR with three primers. The forward/reverse primers of At1g78860 corresponding to A. thaliana genomic sequences flanking the T-DNA insertion and the left border primer of the T-DNA insertion (T-DNA primer) corresponding to the sequence of the T-DNA fragment were designed for PCR analysis used and listed in Table 1. If all the low-B tolerance individuals have the homozygous T-DNA insertion genotype (lbt mutant genotype), it suggests that the phenotype is co-segregated with T-DNA insertion and that the T-DNA insertion (At1g78860) is relevant for the phenotype of low-B tolerance. Otherwise, any these individuals without the T-DNA insertion of At1g78860 can rule out the co-segregation.
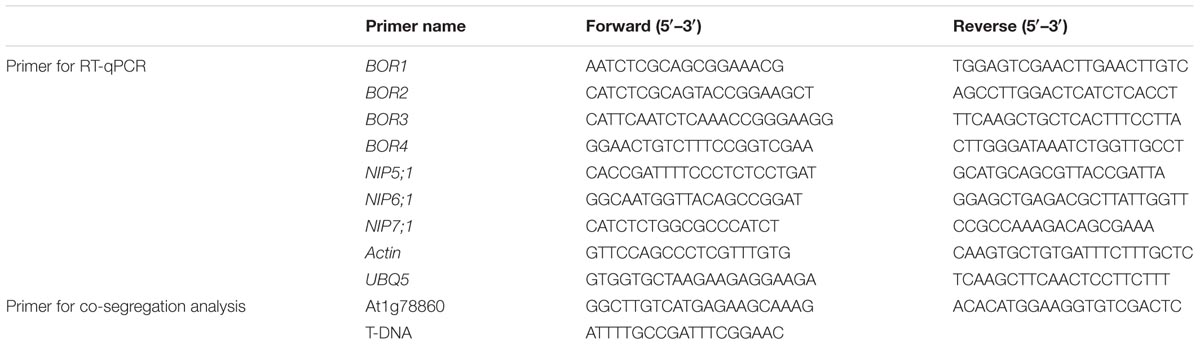
TABLE 1. Primer sequences.
Characterization of the Growth Parameters of Plants
Seven-day-old Col-0 and lbt mutant grown on the solid plates with 30 or 0.1 μMB were harvested to measure the shoot fresh weight and imaged to calculate primary root length and lateral root number. Images of 11-day-old plants were taken to calculate the leaf area. The root elongation rate was measured based on the everyday images of plants from 5- to 11-day-olds, the root elongation of each day was measured according to the root length on 1 day minus that on the previous day. ImageJ software was used in this determination2.
Transmission Electron Microscopy and Stereoscopic Microscopy
The root tip distance of 7-day-old seedlings was examined using an Olympus SZX16 stereoscopic microscope (Olympus, Tokyo, Japan). The distance from the root tip to the first appearance of root hairs was quantified using ImageJ2. Juvenile leaves of 11-day-old Col-0 and lbt mutant grown on solid plates with 30 or 0.1 μMB were fixed in 0.1 M potassium phosphate (pH 6.8) with 2.5% glutaraldehyde at 10 a.m. Then, the samples were dehydrated in a series of ethanol [30, 50, 70, 80, 90, 95, and 100% (v/v) ethanol/water] and propylene oxide for dehydration and embedded in epoxy resin. Ultramicrotome (UC6/FC6; Leica, Germany) was used to prepare ultra-thin sections (0.5–1.0 μm) (Zhang et al., 2017). Specimens of the ultrastructure were observed using transmission electron microscopy (TEM) (H-7650; Hitachi, Tokyo, Japan).
Real-Time Quantitative PCR
Nine-day-old Col-0 and lbt mutant grown vertically on solid plates with 30 μMB were transferred to 30 or 0.1 μMB medium for 48 h and then harvested for total RNA extraction by the Eastep® Super Total RNA Extraction Kit (Promega, Madison, WI, United States). cDNA was prepared by reverse transcription with M-MLV reverse transcriptase (Promega, Madison, WI, United States) and oligo (dT)15 primers (Promega, Madison, WI, United States) according to the manufacturer’s protocol. RT-qPCR assays for the detection of the relative gene expression were performed under a CFX96TM Real-Time PCR Detection System (Bio-Rad, Hercules, CA, United States) using the SYBR Green Real-Time PCR Master Mix Kit (TOYOBO, Osaka, Japan). The primers for RT-qPCR analysis are listed in Table 1. Actin and UBQ5 genes were used as the housekeeping genes for RT-qPCR analysis, and the expression data were analyzed using the geometric mean of the two housekeeping genes.
Measurement of Starch Concentration in Leaves
Leaves of 11-day-old Col-0 and lbt mutant grown on solid plates with 30 or 0.1 μMB were sampled at 10 a.m. Starch concentration was determined using the Starch Content Assay Kit (Solarbio, Beijing, China).
Whole Genome Sequencing and Linkage Map Construction
Total genomic DNA of all plants was extracted from fresh leaves (Doyle, 1987). The whole genome sequence (WGS) of lbt mutant, Cs1909 and F2 population individuals were analyzed using an Illumina HiSeqTM PE150 (Illumina Inc., San Diego, CA, United States). Ten lbt mutant plants and Cs1909 plants were sampled to construct two DNA-bulk for WGS, and the sequencing depth was 10×. The average sequencing depth of F2 population individuals was 1×. The homozygous single nucleotide polymorphisms (SNPs) between lbt mutant and Cs1909 were further structurally identified by alignment analysis with the reference genome (TAIR103) using BWA software. The SNPs exhibiting sequencing errors or significant segregation distortion were filtered using a custom Perl script (Zhou et al., 2016). SNP index is calculated by the ratio between the number of reads of a mutant SNP and the total number of reads corresponding to the SNP. Homozygous SNPs were defined as SNPs with minimum coverage of the sites of three reads and a SNP index ≥ 0.9 (Abe et al., 2012). These SNPs markers were used to construct a high-density linkage map using JoinMap software version 4.0.
Phenotypic Traits Evaluation and QTLs Analysis
To locate LBT gene, QTL mapping was performed. In this study, the primary root length of plants was used as the phenotype to identify QTLs for low-B tolerance. Under low-B condition, the line with long primary root length similar to lbt mutant was defined as low-B tolerance, vice versa, the line with short primary root length similar to Col-0 was defined as low-B sensitive. The F2 mapping population with 120 lines from a cross between lbt mutant and Cs1909 line was grown hydroponically with 30 μMB, and then, the F2:3 seeds were harvested from the individual F2 lines. Twenty F2:3 plants from each F2 line were grown on the solid media with low-B (0.1 μM) for 14 days, and the primary root length of the plants was determined. The average value of the primary root length of each F2:3 line was then used as the phenotype of F2 individuals to identify QTLs associated with low-B tolerance. Based on the constructed linkage map with the SNPs, the primary root length average values of each F2:3 were used for QTL analysis. QTL analysis with the composite interval mapping (CIM) method was conducted using model 6 of WinQTL cartographer 2.5 software (Ding et al., 2012) with an LOD threshold of 3.3.
Statistical Analysis
All data were statistically analyzed using the software Statistical Product and Service Solutions 17.0 (SPSS, Chicago, IL, United States). Student’s t-test or Duncan’s multiple test was used to assess significant differences for p < 0.05.
Results
Effect of Low-B Stress on lbt Mutant Growth at the Seedling Stage
There was no significant difference in plant growth between Col-0 and lbt mutant at a normal B (30 μM) level (Figure 1A), but lbt mutant showed larger shoot and longer primary root length at a low-B (0.1 μM) level than Col-0 (Figure 1B). The fresh weight of lbt mutant was remarkably higher than that of Col-0 and the primary root length of lbt mutant was 85.5% longer than that of Col-0 under B deficiency conditions (Figures 1G,H). Both Col-0 and lbt mutant had similar root tip architecture at 30 μMB (Figures 1C,D), but lbt mutant showed more lateral roots, less root hair density and longer distance from the root tip to the first appearance of root hairs than that of Col-0 at 0.1 μMB condition (Figures 1E,F,I–K). The primary root length of both Col-0 and lbt mutant were recorded from the 5- to 11-day-old plants to estimate the root elongation rate. No significant differences in the root elongation rate were observed between Col-0 and lbt mutant at the 30 μMB condition. However, lbt mutant showed a faster root growth rate than that of Col-0 plants at the 0.1 μMB condition (Figure 1L). The leaf area of the 11-day-old lbt mutant was 64.1% larger than that of Col-0 at 0.1 μMB, but the difference was indistinguishable at the 30 μMB condition (Figures 2A,B). These results indicate that lbt mutant harbored high tolerance to low-B stress at the seedling stage.
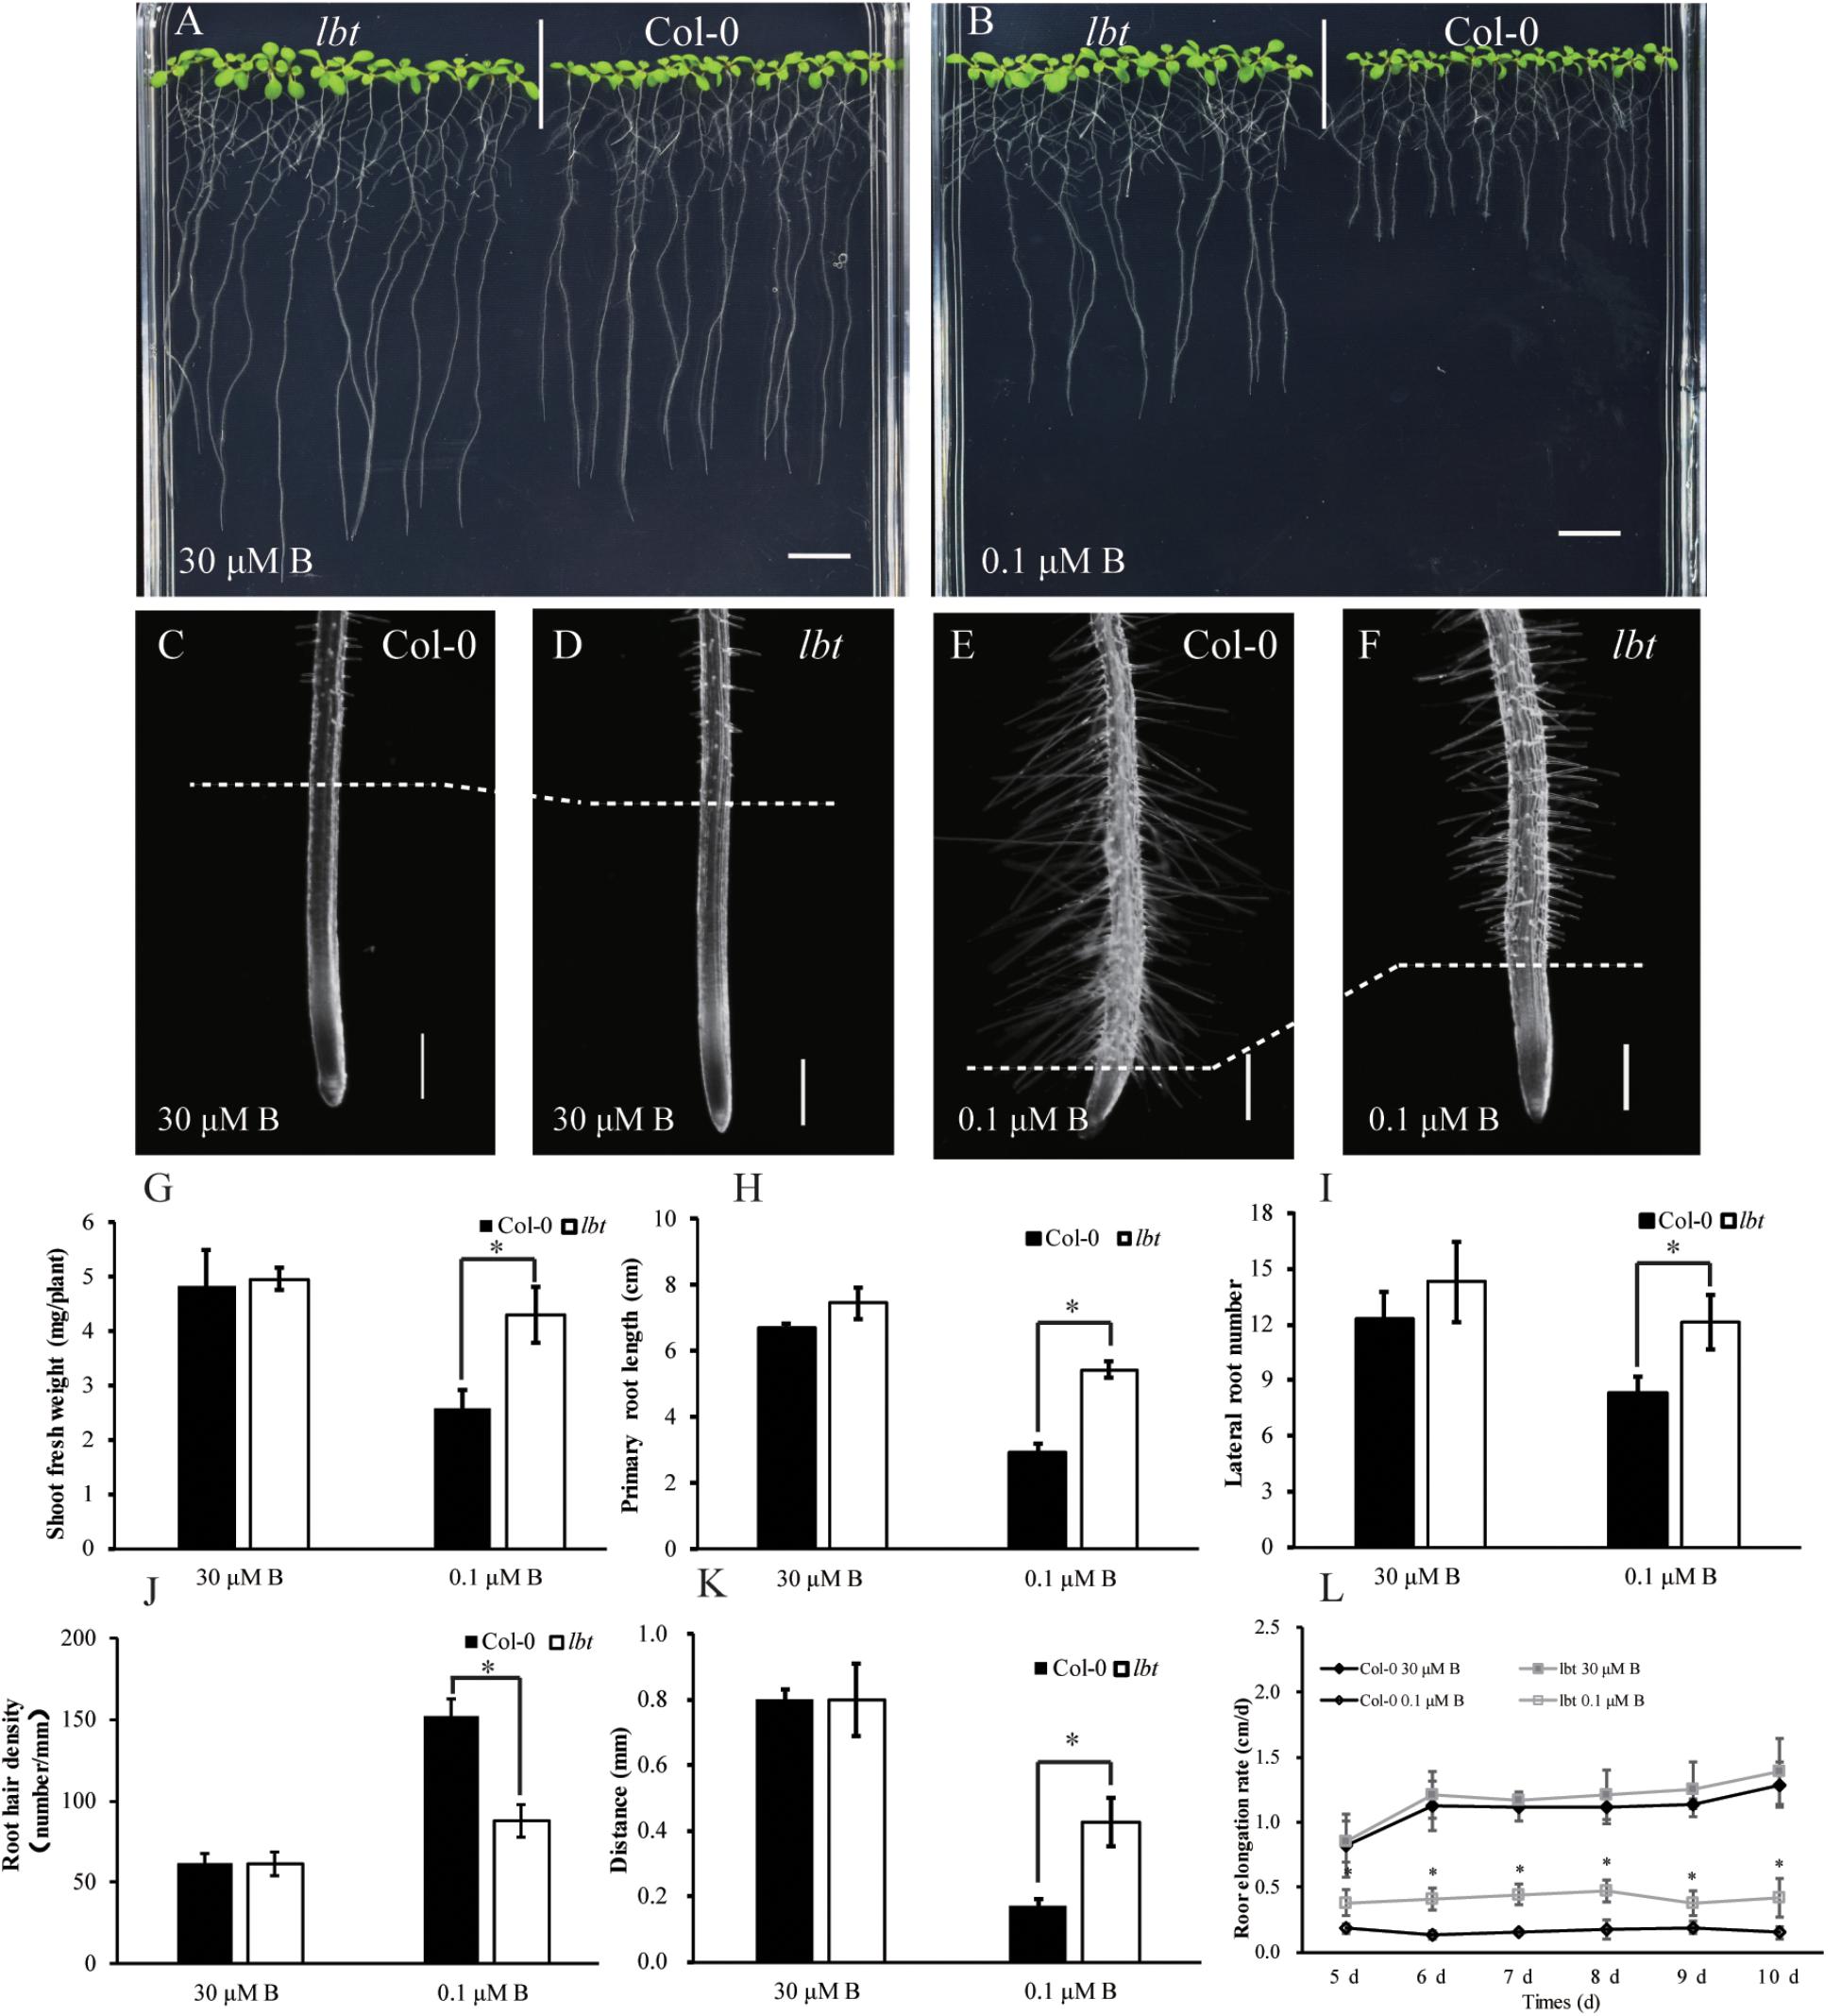
FIGURE 1. Performance of Arabidopsis thaliana wide-type Col-0 and lbt mutant. (A,B) Growth performance of Col-0 and lbt mutant grown on MGRL media for 7 days under 30 (A) and 0.1 (B) μMBconditions. Bars = 1 cm. (C–F) Stereoscopic microscopy analysis of Col-0 and lbt root tips under 30 (C,D) and 0.1 μMB (E,F) conditions. Bars = 200 μm. (G,H) Shoot fresh weight (G) and primary root length (H) of Col-0 and lbt mutant. Error bars indicate standard deviations of the mean (n = 14). (I–L) Lateral root number (I), root hair density (J), the distance from the root tip to the first appearance of root hairs (K) and primary root elongation rate (L) of Col-0 and lbt mutant. Error bars denote standard deviations of the mean (n = 5). (G,H) The asterisks show significant differences (Student’s t-test, p ≤ 0.05).
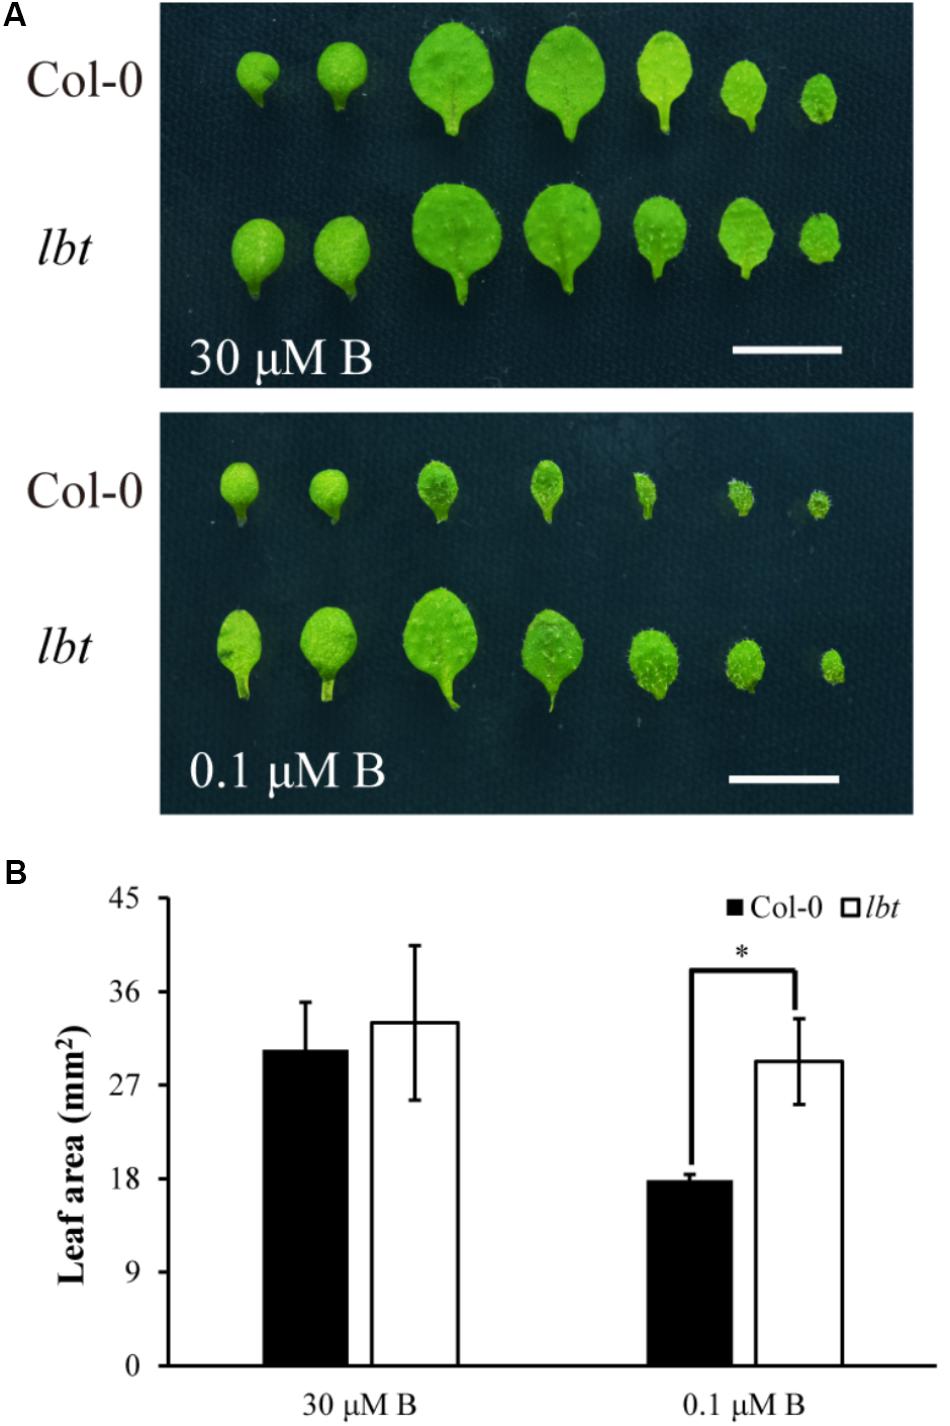
FIGURE 2. Leaf area of Col-0 and lbt mutant plants. (A) Leaf phenotype of Col-0 and lbt mutant seedlings under 30 μM and 0.1 μMB conditions for 11 days. On the left, two cotyledons precede the true leaves, and leaves are arranged from left to right in order of emergence. Bars = 5 mm. (B) Leaf areas of Col-0 and lbt mutant were measured. Error bars denote the standard deviations (n = 5). The asterisks indicate significant differences (Student’s t-test, p ≤ 0.05).
Effect of Low-B Stress on lbt Mutant Growth at the Reproductive Growth Stage
To assess the differential responses to B deficiency between Col-0 and lbt mutant during the reproductive stage, the plants were grown in a hydroponic culture system. The shoot growth of Col-0 was inhibited severely relative to lbt mutant with B limitation (0.5 and 1 μM) for 35 days (Figures 3A,B). At these low-B conditions, the 45-day-old lbt mutant showed more branches and a greater inflorescences number than Col-0 (Figures 3C,D,G,H). However, lbt mutant grew similarly to Col-0 when a normal concentration of B was supplied (10 and 30 μMB, Figures 3E,F). Both genotypes were unable to produce seeds at 0.5 and 1 μM. lbt mutant was able to produce few seeds when it was cultured in the 2 μMB condition, whereas Col-0 did not produce any seeds in this condition (Supplementary Figure S1). These results indicate that lbt mutant exerted sustainable effect on the low B tolerance at both vegetative stage and reproductive stage.
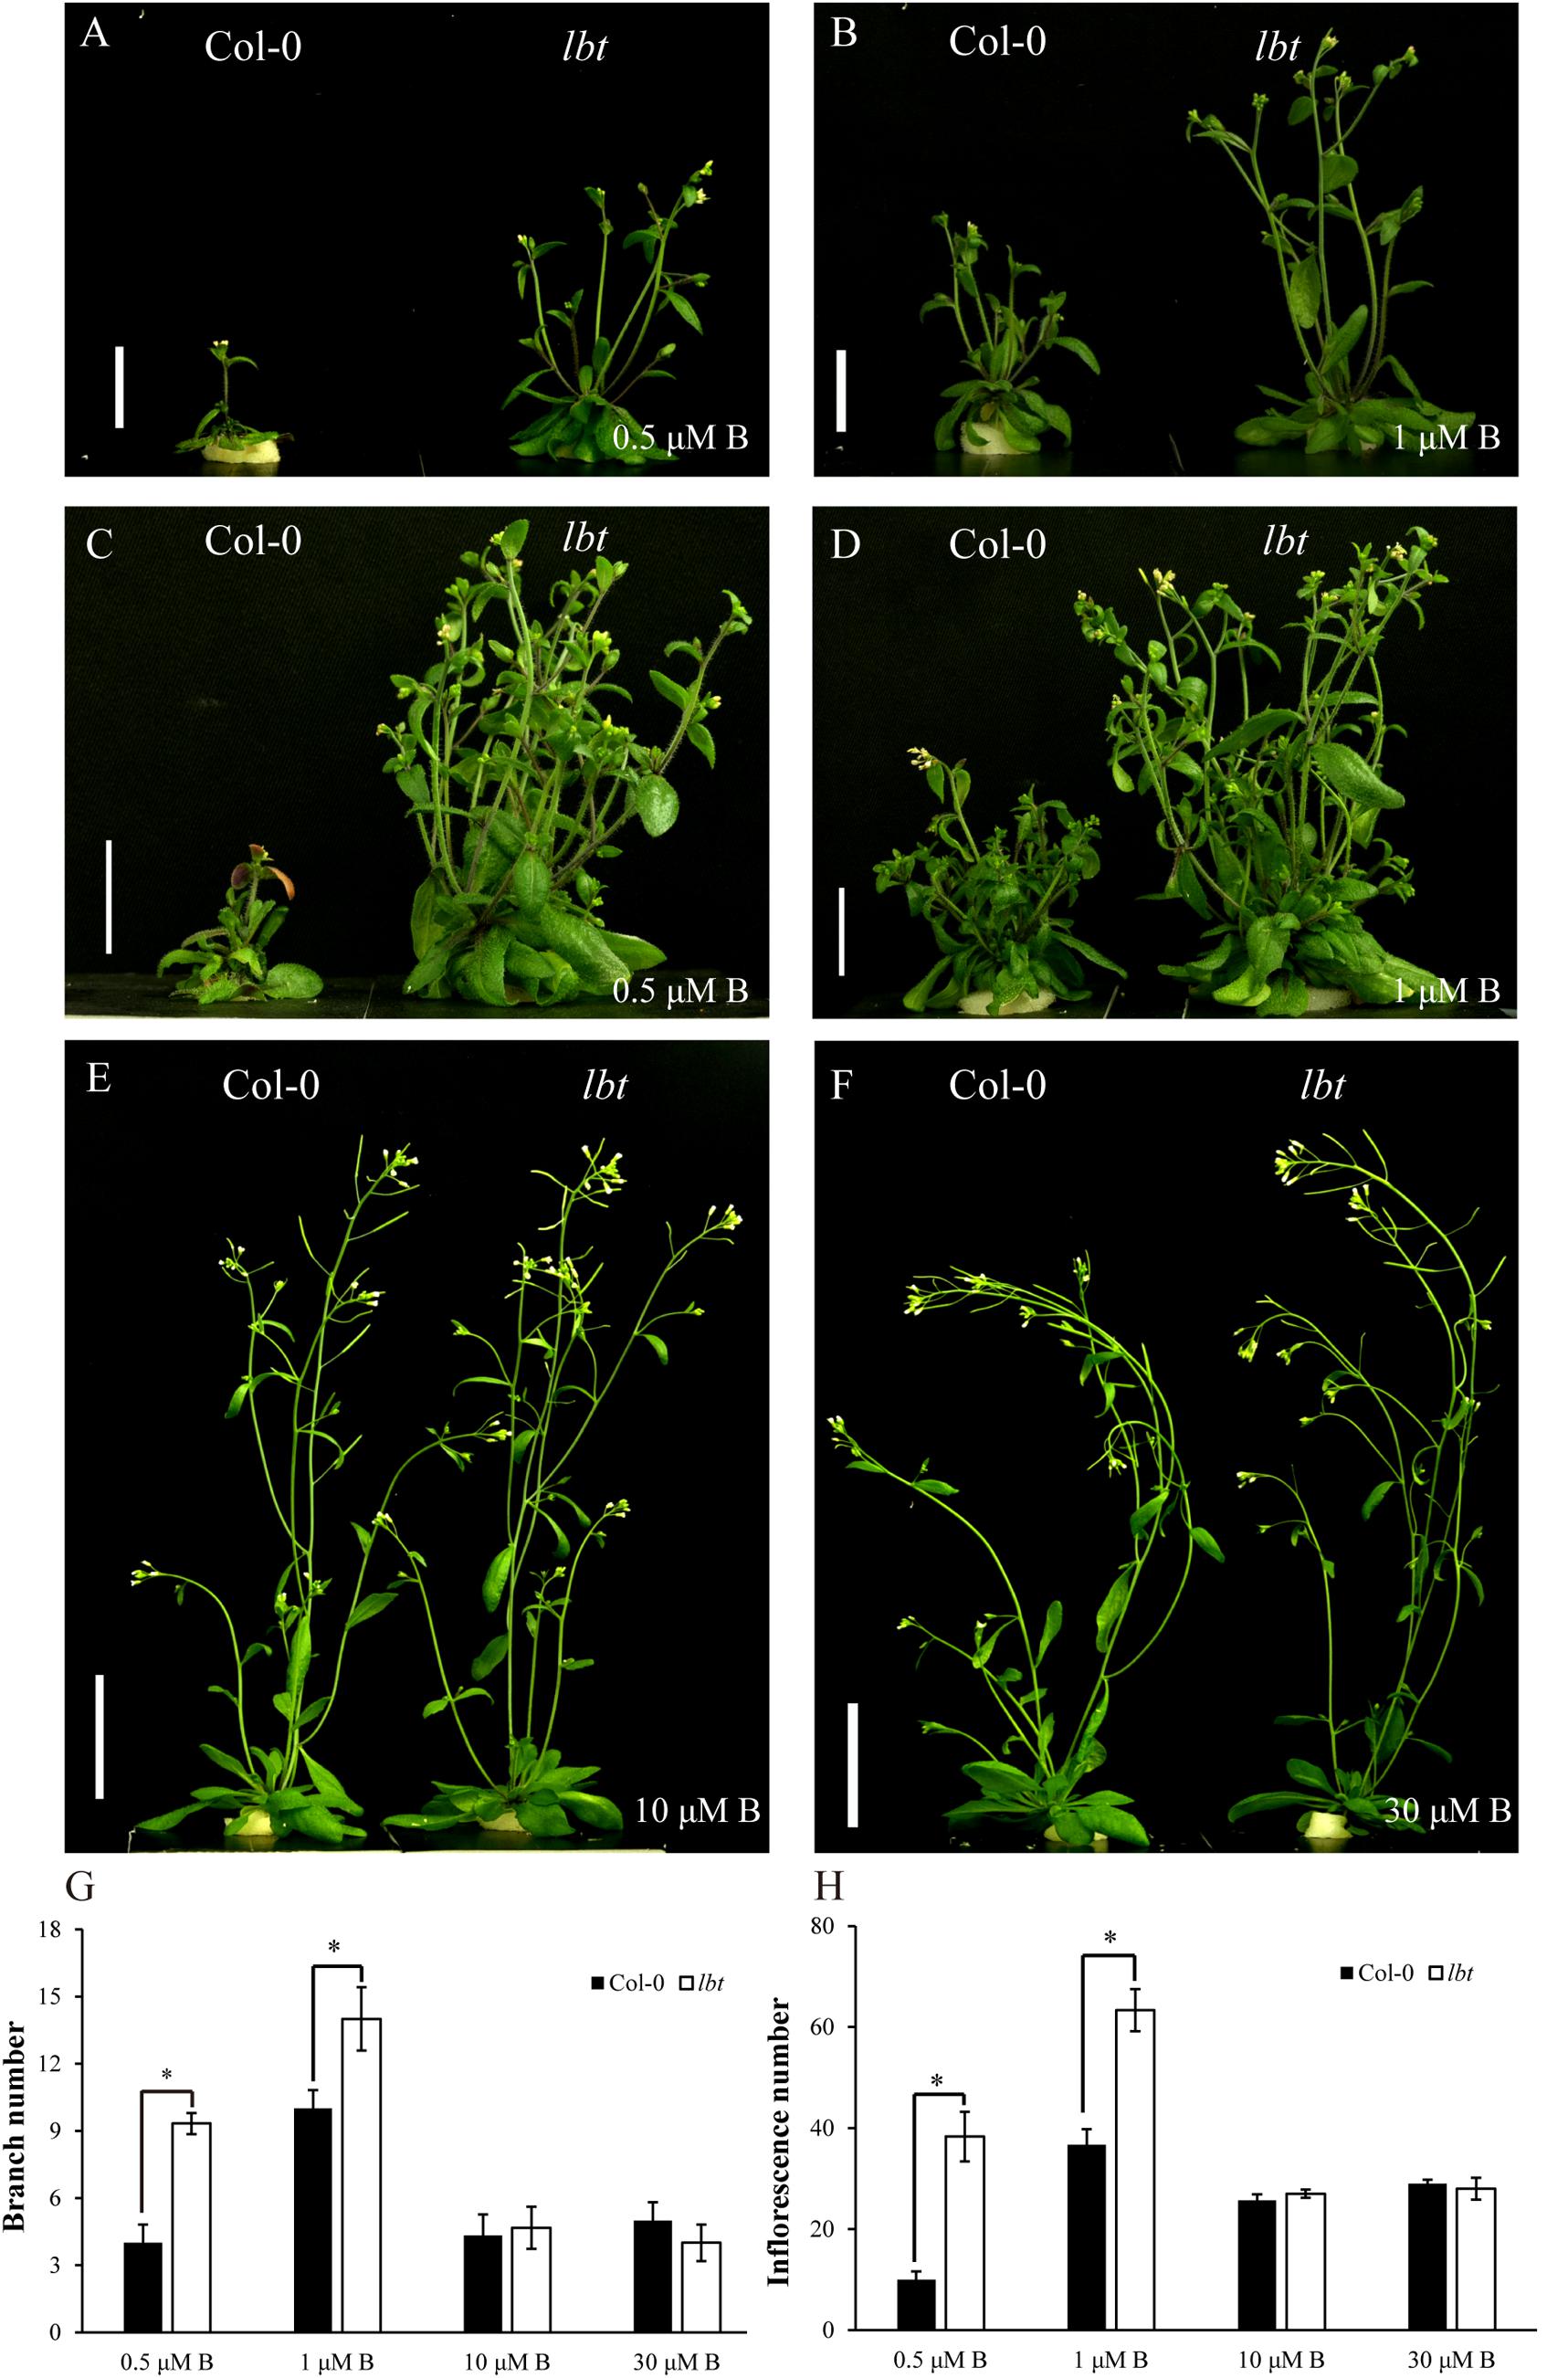
FIGURE 3. Reproductive growth of Col-0 and lbt mutant under different B conditions. (A,B) Col-0 and lbt mutant were grown for 35 days under 0.5 (A) and 1 (B) μMB conditions. Bars = 2 cm. (C,D) Col-0 and lbt mutant were grown for 45 days under 0.5 (C) and 1 (D) μMB conditions. Bars = 2 cm. (E,F) Col-0 and lbt mutant were grown for 35 days under 10 (E) and 30 (F) μMB conditions. Bars = 4 cm. (G,H) Branch and inflorescence number of Col-0 and lbt mutant under different B conditions. Branch number means the branch grown out from only the rosette base, and inflorescence number includes all the branches grown out from both the rosette base and branches (secondary branches and tertiary branches) from the first branches. Error bars denote the standard deviations (n = 3). The asterisks indicate significant differences (Student’s t-test, p ≤ 0.05).
Effect of Other Nutrient Stresses on lbt Mutant Growth
The low-B tolerance of lbt mutant led us to question whether lbt mutant has tolerance to other stresses. To clarify its tolerance, we cultured Col-0 and lbt mutant in diverse stresses using a hydroponic culture system including nitrogen (N) deficiency (-N, 2 μM), phosphorus (P) deficiency (-P, 2 μM), potassium (K) deficiency (-K, 2 μM), iron (Fe) deficiency (-Fe, 0.1 μM), and high B stress (++B, 3 mM). Similar to the result above, there was no significant difference in plant growth between Col-0 and lbt mutant for the normal control treatment (Figure 4A). N deficiency caused significant growth retardance and brownness of the cotyledons of both Col-0 and lbt mutant (Figure 4B). When the plants were cultured in the solution lacking P, the leaves gradually turned to dark green color (Figure 4C). Both Col-0 and lbt mutant were retarded with K deficiency, displaying strong yellow color in the cotyledons (Figure 4D). Most of the leaves of Col-0 and lbt mutant changed to yellow under Fe deficiency (Figure 4E). B toxicity led to necrosis of old leaf margin to comparable extent in both Col-0 and lbt mutant (Figure 4F). Distinctively, lbt mutant showed a larger shoot than Col-0 under B deficiency (Figure 4G). Taken together, there was no significant difference in phenotypical performance between Col-0 and lbt mutant under various nutrient deficiencies with the exception of B limitation, which was confirmed by the statistical analysis of shoot fresh weight and primary root length (Figures 4H,I). These results indicate that lbt mutant is specifically tolerant to B limitation.
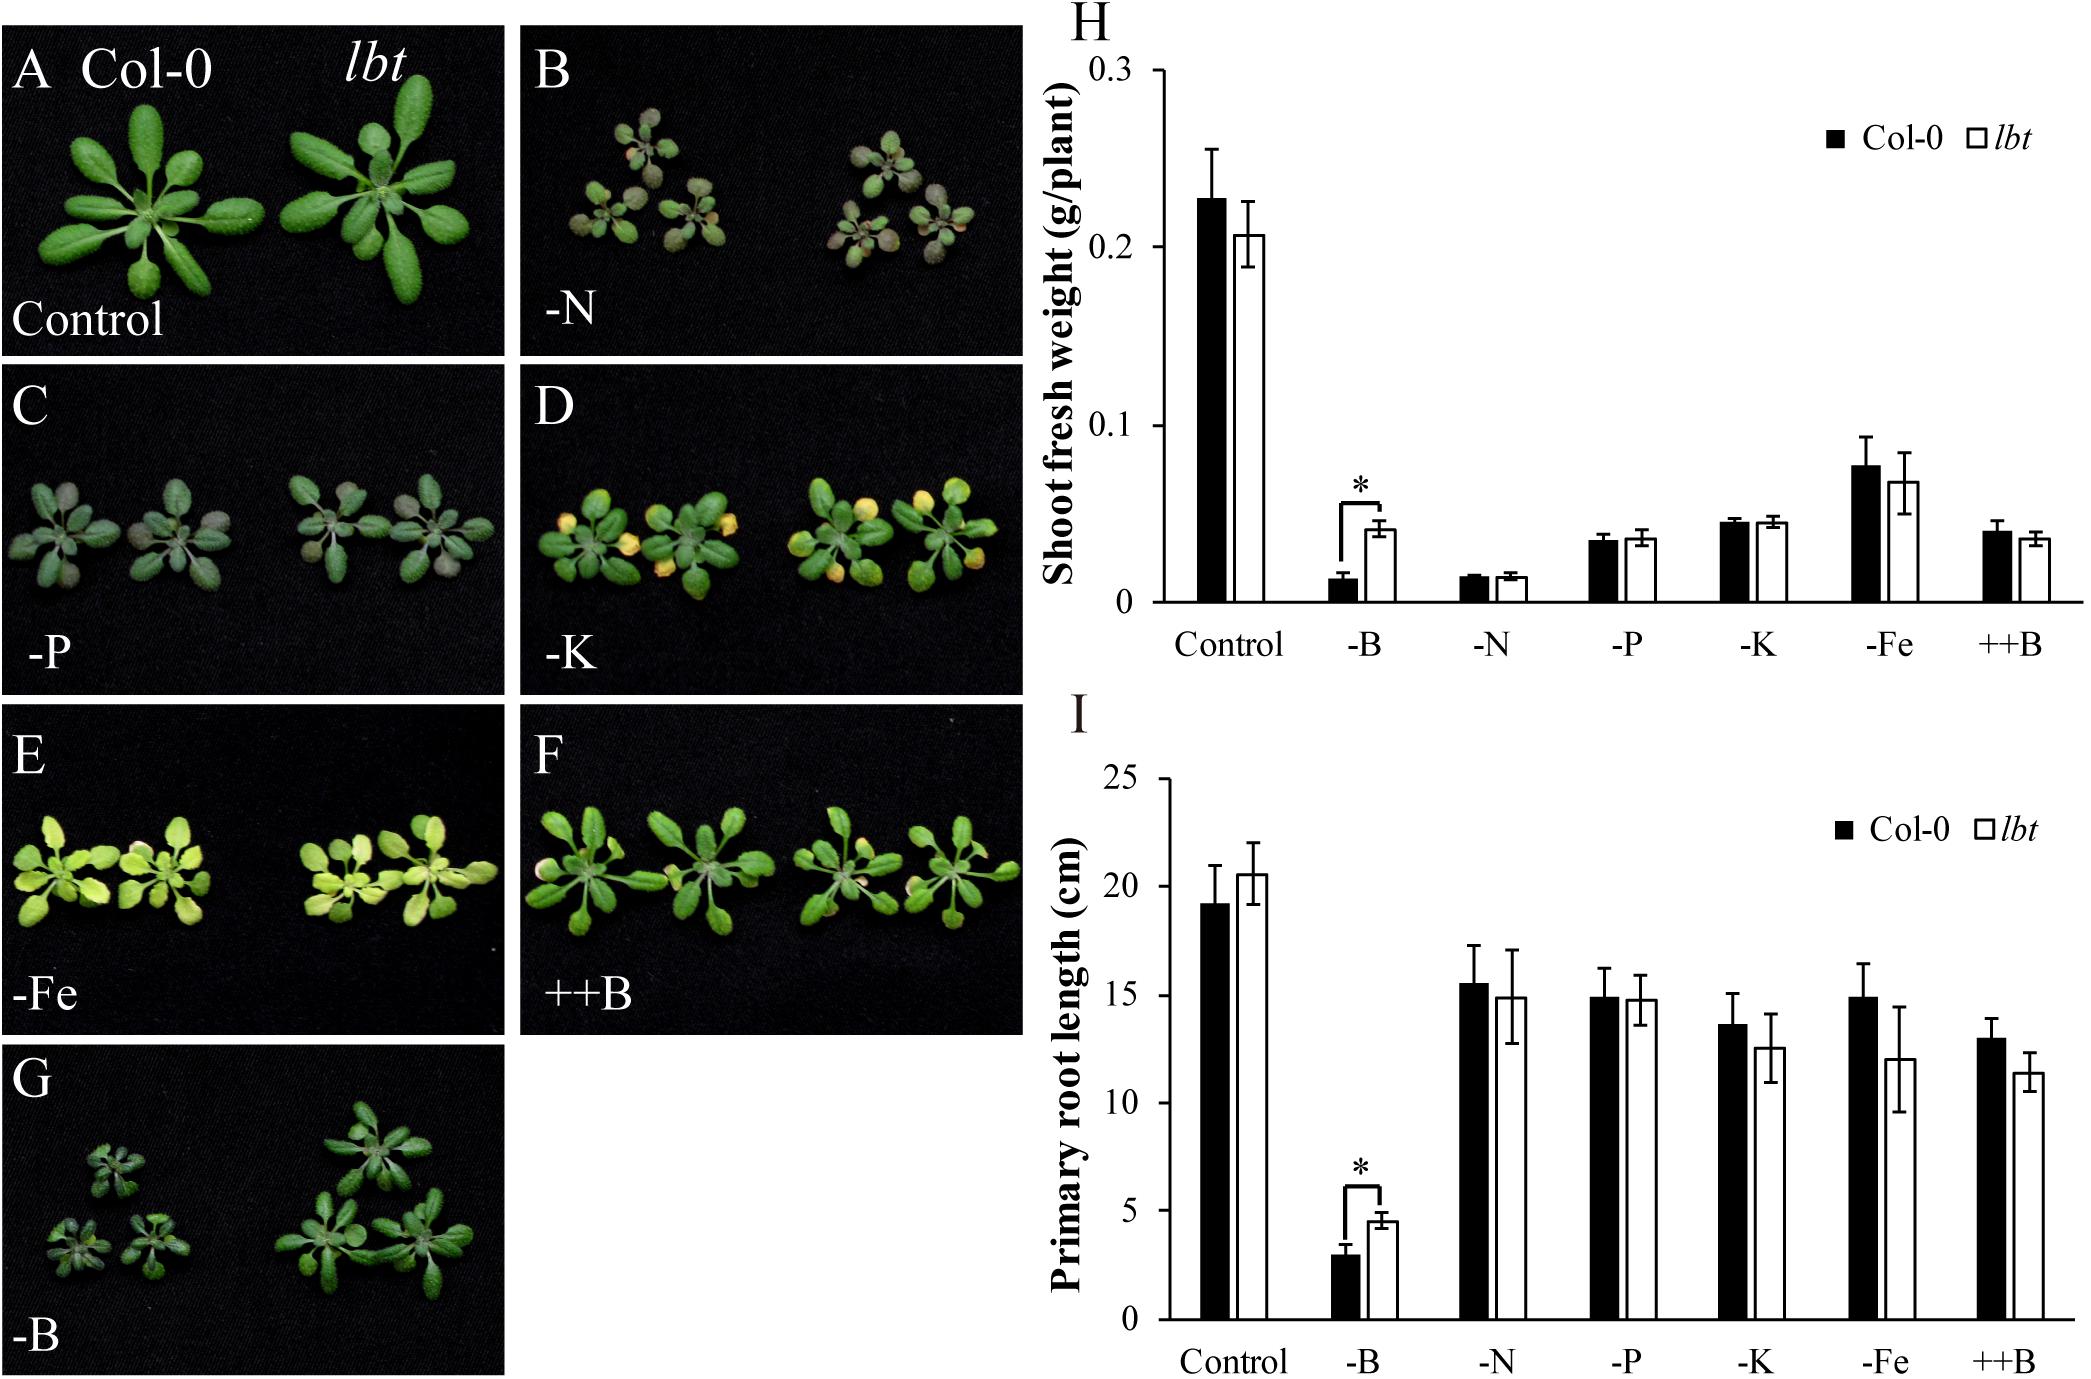
FIGURE 4. Responses of Col-0 and lbt mutant to different stresses. (A–G) Col-0 and lbt mutant grown in various stress conditions using a hydroponic culture system, including control (A), –N (2 μM) (B), –P (2 μM) (C), –K (2 μM) (D), –Fe (0.1 μM) (E), ++B (3 mM) (F), –B (0.1 μM) (G). (H,I) Shoot fresh weight (H) and root length (I) of Col-0 and lbt mutant under various stresses. The asterisks show significant differences between Col-0 and lbt plants (Student’s t-test, p ≤ 0.05).
Expression of B Transport-Related Genes in lbt Mutant
It has been demonstrated that NIP5;1, NIP6;1, BOR1 and BOR2 are essential for B homeostasis under B limitation stress (Takano et al., 2002, 2006; Miwa et al., 2013). To elucidate whether the low-B tolerance of lbt mutant is mediated by B transport-related genes, we investigated the expression of NIP5;1, NIP6;1, NIP7;1, BOR1, BOR2, BOR3, and BOR4 in lbt mutant by RT-qPCR. NIP5;1 was up-regulated in roots by low-B without differences between Col-0 and lbt mutant (Figure 5A). However, the expression of NIP6;1 and NIP7;1 was significantly lower than NIP5;1 without differences between Col-0 and lbt mutant in both root and shoot under 30 μMB or 0.1 μMB (Figure 5A and Supplementary Figure S2). The expression of BOR1 was stronger in roots than in shoots regardless of B concentrations; however, BOR1 mRNA abundance was lower in lbt mutant roots than in Col-0 root at the 0.1 μMB condition (Figure 5B). BOR2 was insensitive to B concentrations but was strongly expressed in the roots of Col-0 and lbt mutant (Figure 5C). The expression of BOR3 and BOR4 in both root and shoot of Col-0 and lbt mutant was similar under 30 μMB or 0.1 μMB (Figures 5D,E).
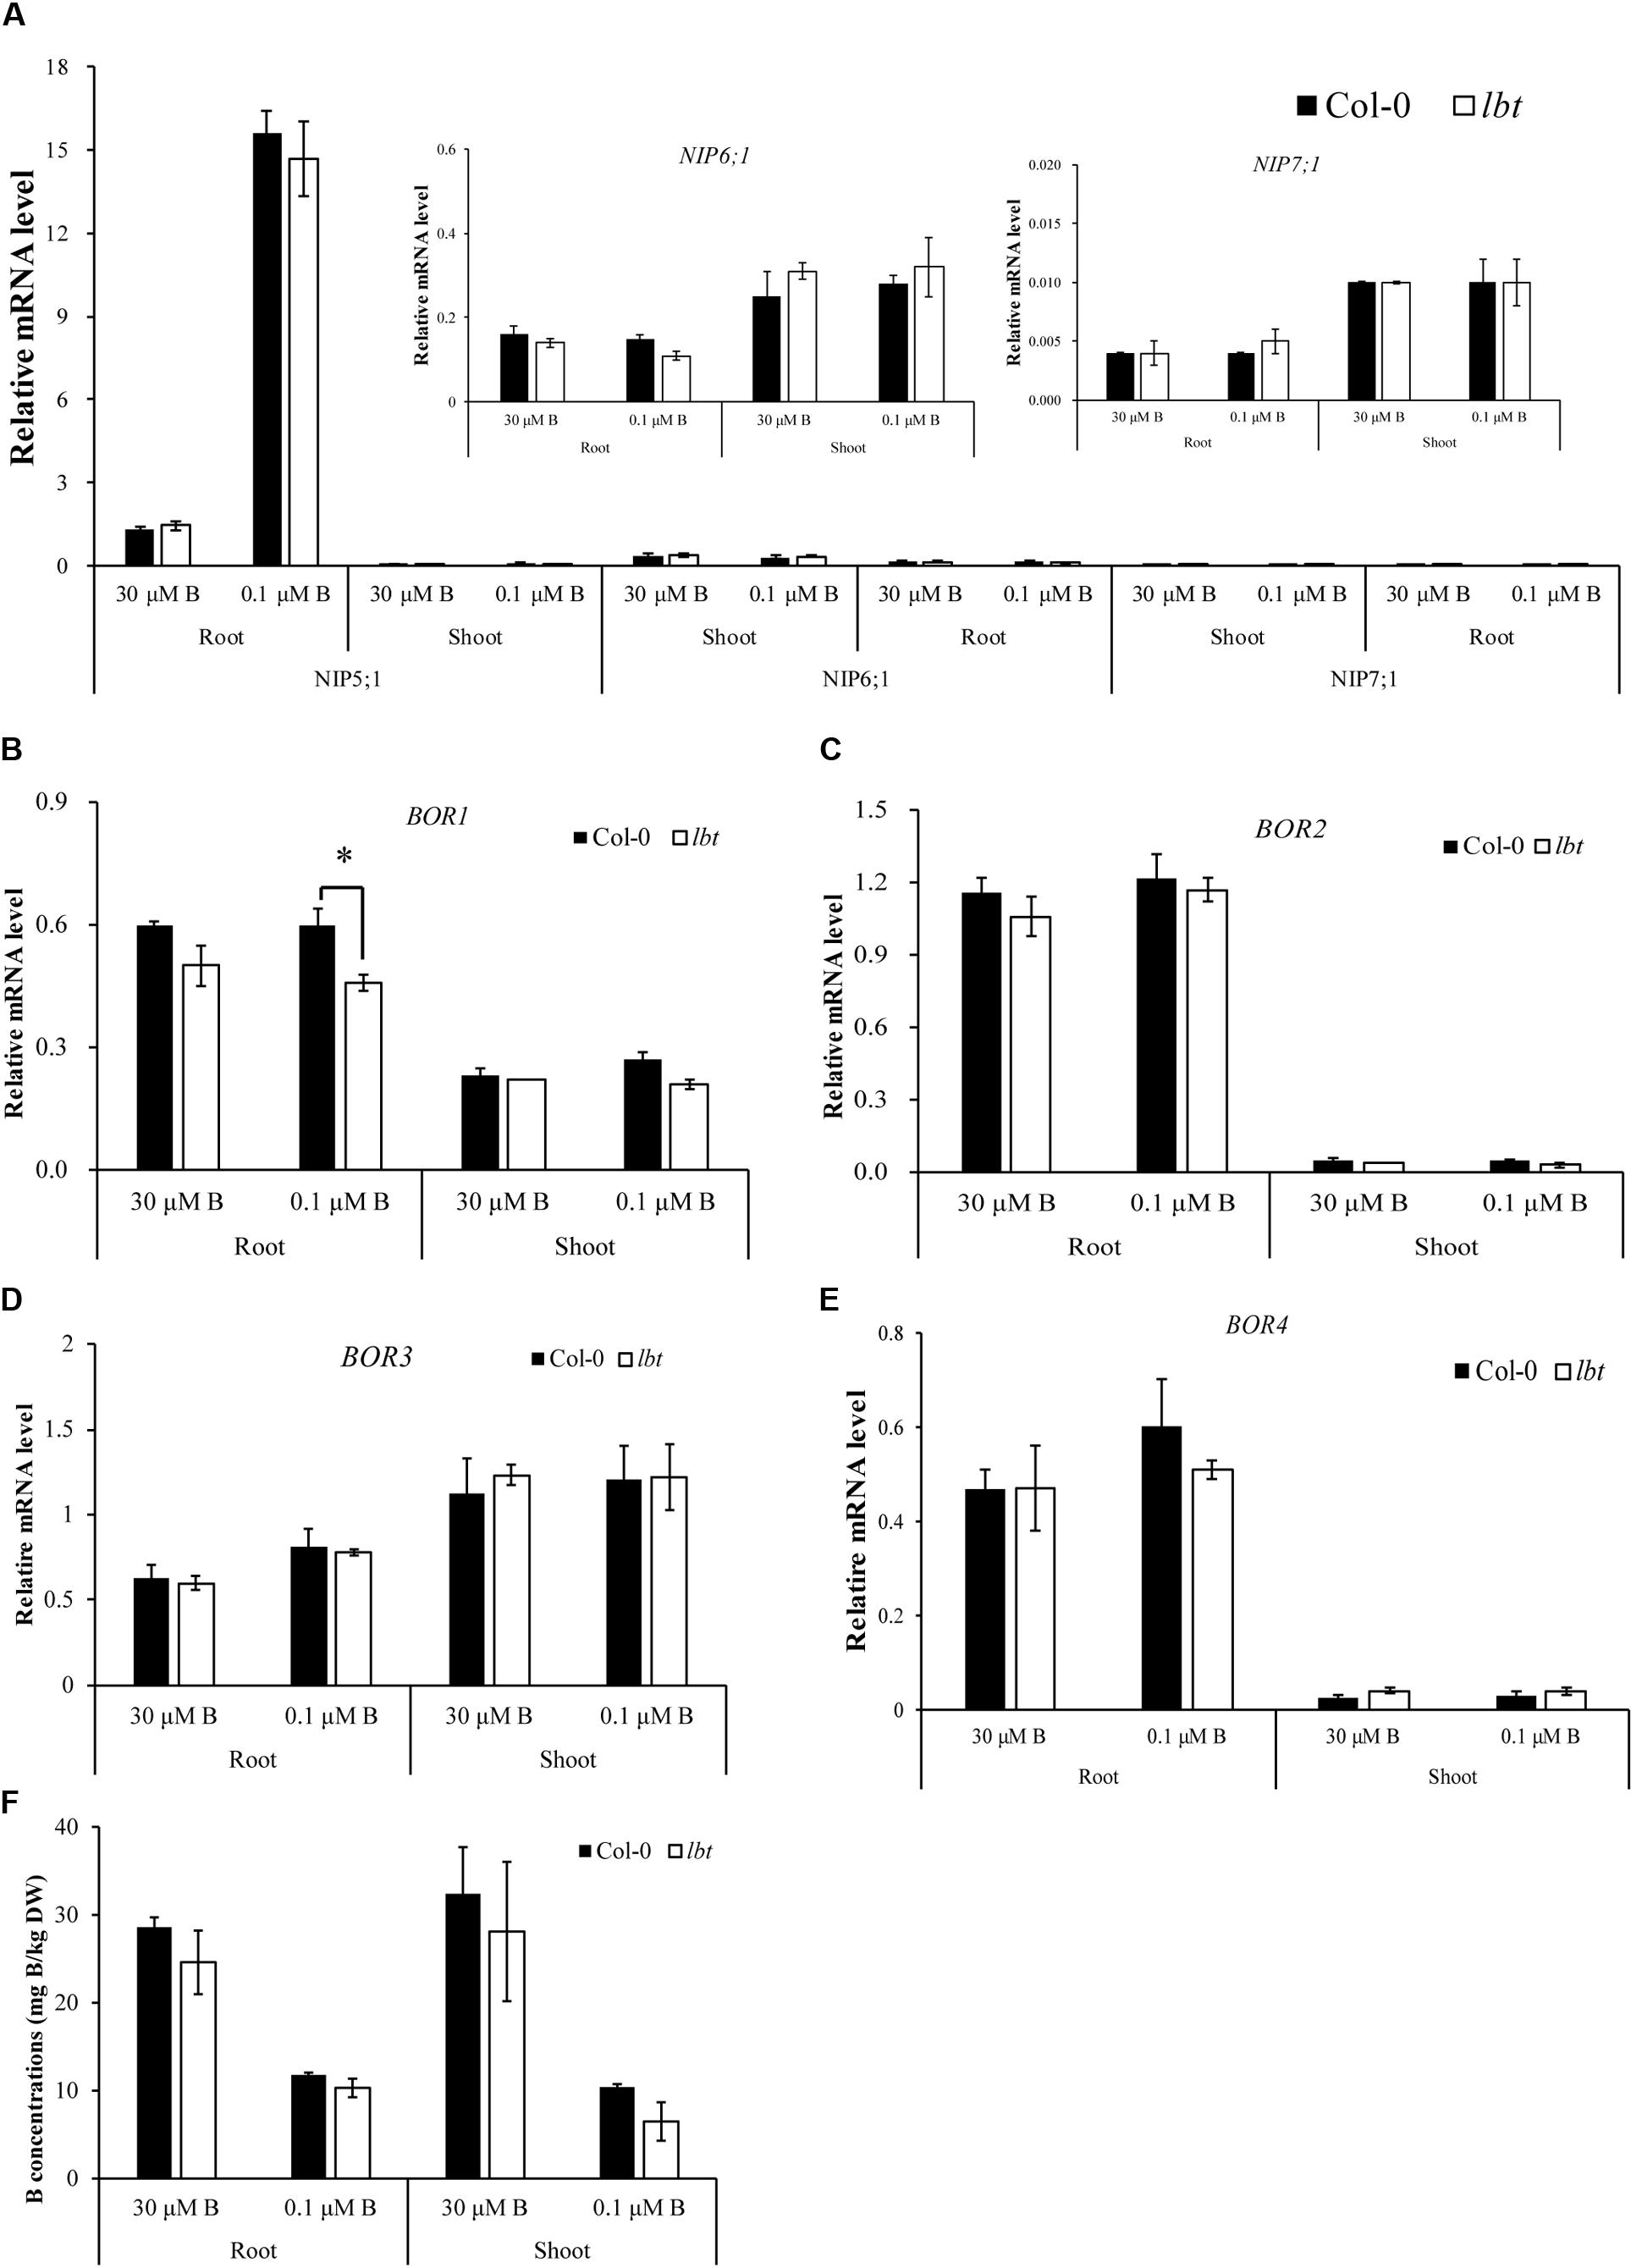
FIGURE 5. Relative expression of B transport-related genes in Col-0 and lbt mutant. (A–F) Relative expressions of NIP5;1, NIP6;1 and NIP7;1 (A), BOR1 (B), BOR2 (C), BOR3 (D), BOR4 (E) in root and shoot under 30 and 0.1 μMB. (F) B concentrations in root and shoot under 30 and 0.1 μMB. The expression data were analyzed using the geometric mean of two housekeeping genes Actin and UBQ5. Error bars denote the standard deviations (n = 3). The asterisks indicate significant differences (Student’s t-test, p ≤ 0.05).
Furthermore, we determined the B concentrations in both Col-0 and lbt mutant at the 30 and 0.1 μMB conditions (Figure 5F). The B concentrations of Col-0 and lbt mutant were higher under 30 μMB than under 0.1 μMB in the roots and shoots, but there was no significant difference in the B concentrations between Col-0 and lbt mutant. These results suggest that the low-B tolerance of lbt mutant might presumably not be related to the function of B transporters.
Ultrastructure of lbt Mutant
To examine the differences in cell levels between Col-0 and lbt mutant, we performed the ultrastructure analysis of juvenile leaves of 11-day-old seedling using a transmission electron microscopy (TEM) system. Cells of both Col-0 and lbt mutant showed structural integrity, and the chloroplasts (CHLs) were orderly arrayed along the plasma membranes (PMs) at 30 μMB (Figures 6A,C) and 0.1 μMB (Figures 6B,D). Under the low-B condition more starch granules were accumulated and embedded in the chloroplasts of Col-0, however, tiny starch granules were observed in lbt mutant (Figures 6B,D).
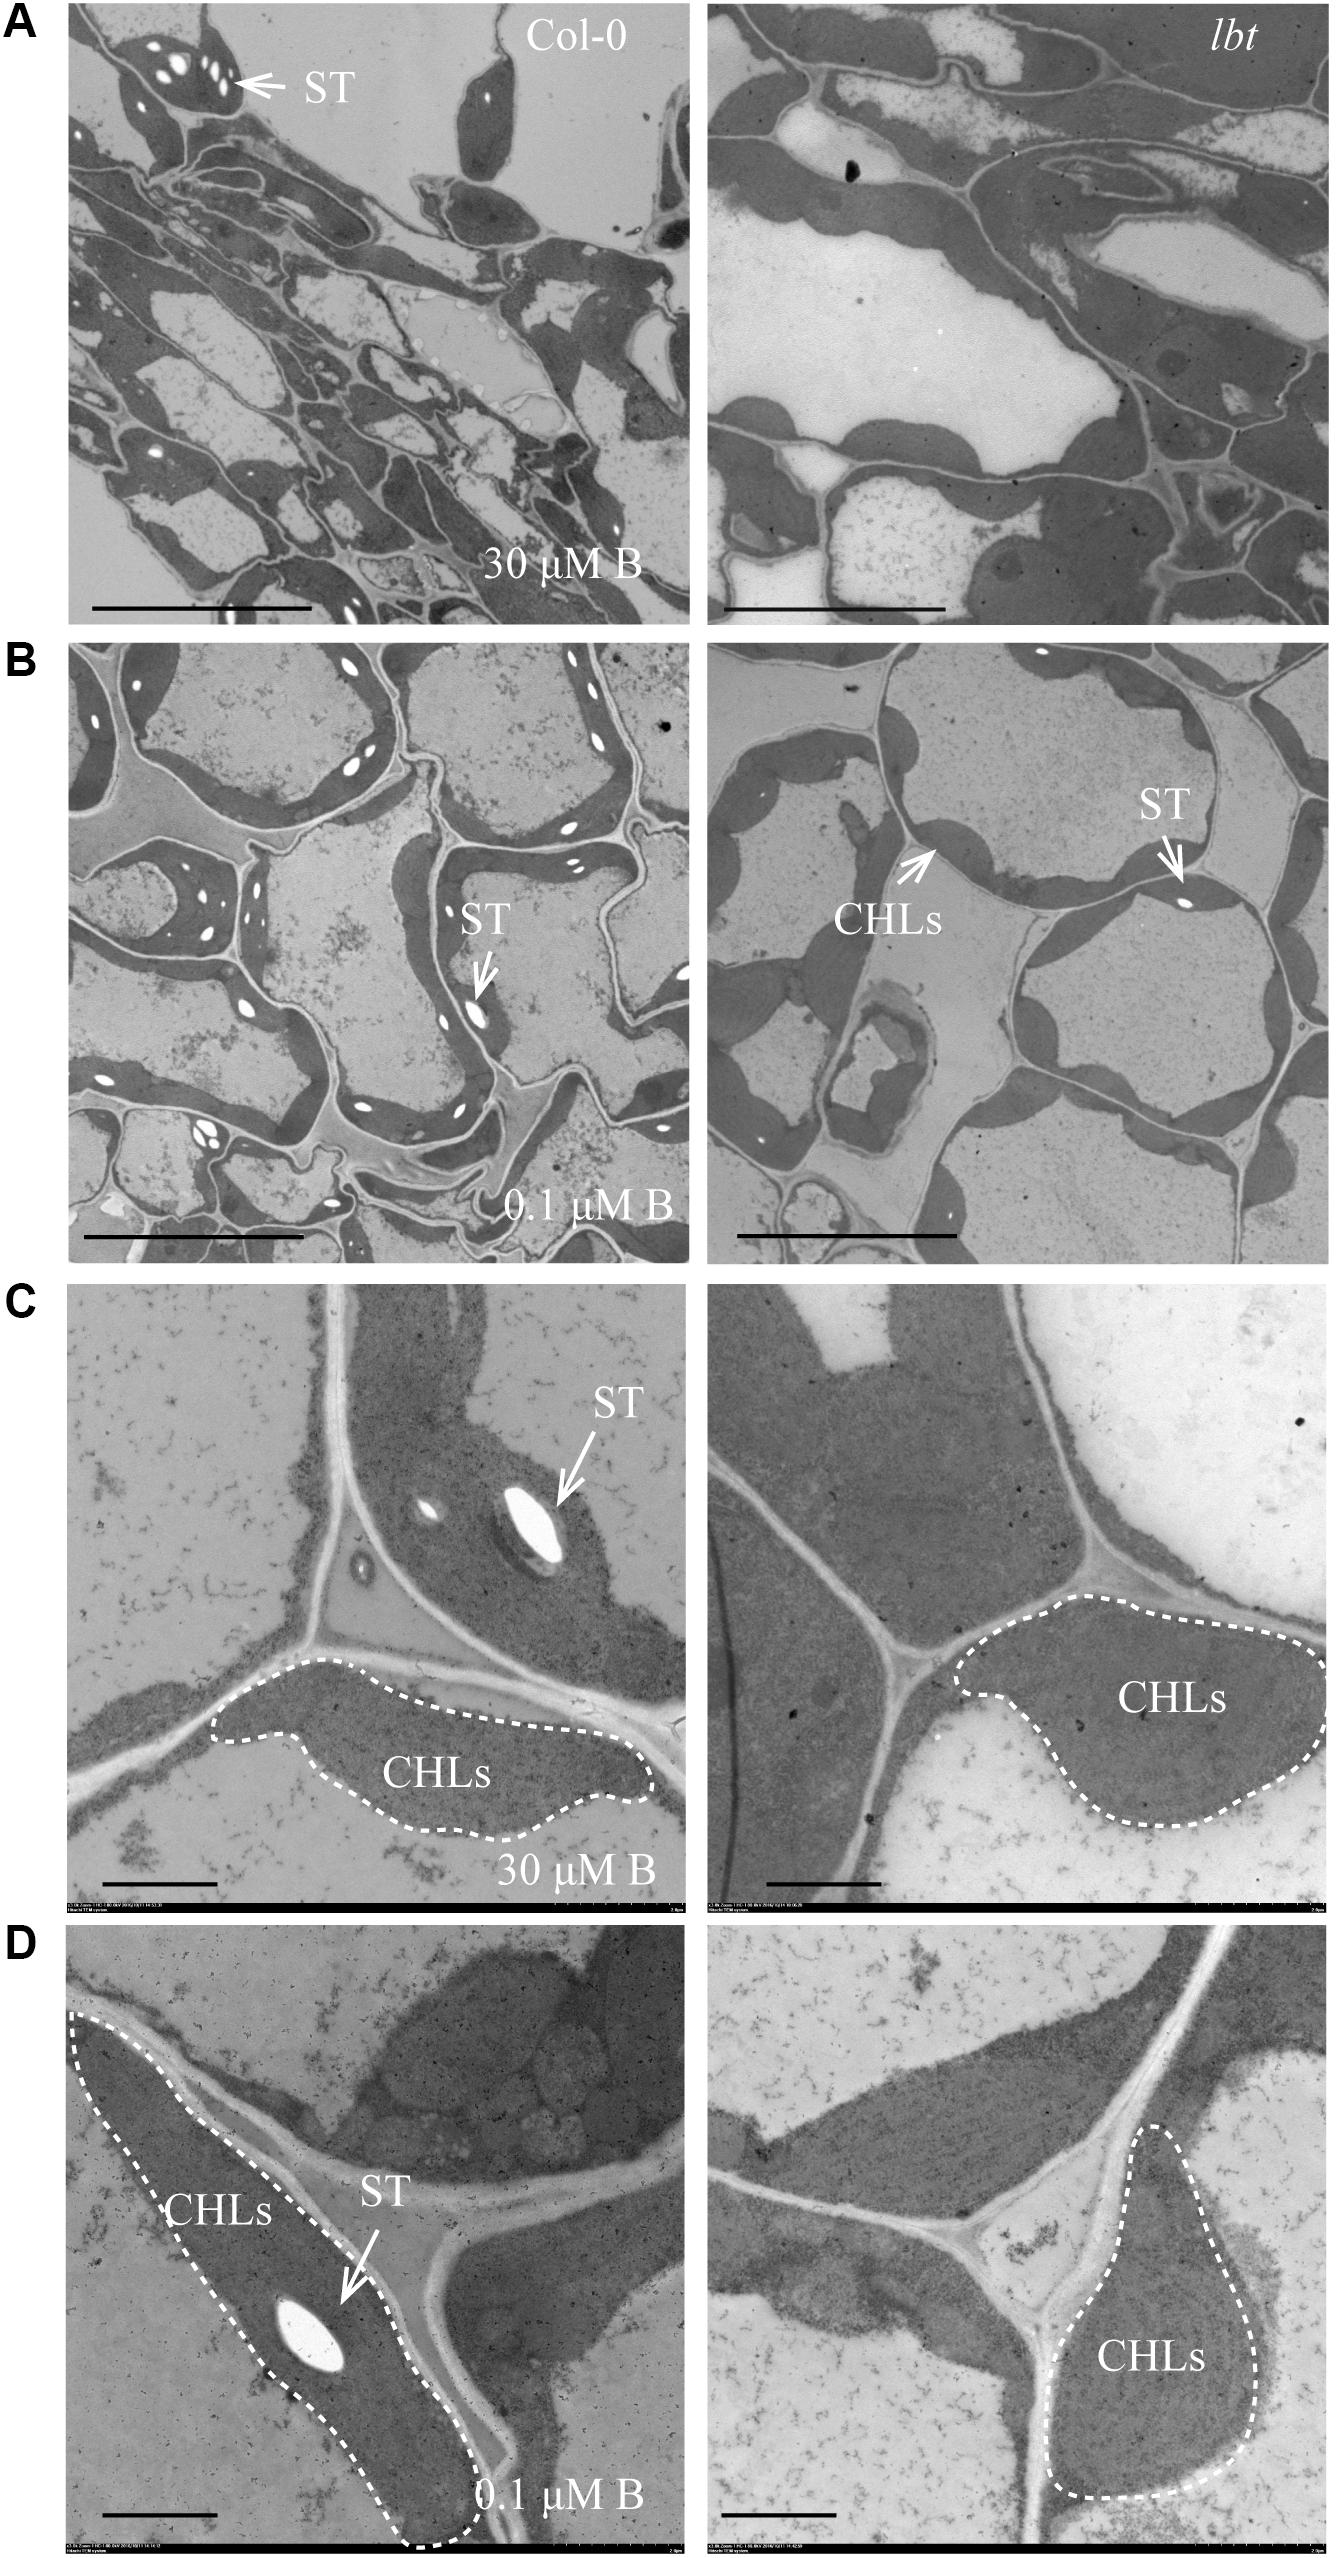
FIGURE 6. Transmission electron microscopy (TEM) analysis of the juvenile leaves of Col-0 and lbt 11-day-old seedlings. (A,B) The starch granules (ST) in chloroplasts (CHLs) in Col-0 and lbt mutant under 30 (A) and 0.1 (B) μMB conditions. Bars = 10 μm. (C,D) Local magnification of (A,B). Bars = 2 μm.
Relationship Between the Low-B Tolerance of lbt Mutant and T-DNA Insertion in At1g78860
To verify whether the low-B tolerance of lbt mutant was the result of T-DNA insertion in At1g78860, we constructed an F2 population by the cross of Col-0 and lbt mutant (T-DNA insertion line SALK_144144C of At1g78860, Supplementary Figures S3A,B) to analyze the co-segregation of the low-B tolerance phenotype with the T-DNA insertion genotype. Under the low-B (0.1 μM) condition, 29 F2 individuals with the low-B tolerance phenotype were chosen to identify their genotypes by PCR. The results indicate that 9 plants showed Col-0’s genotype with one band of 1024 bp, 7 plants were homozygous with one band (493 bp) of T-DNA insertion (lbt), and 13 plants were heterozygous among these 29 F2 plants (Figure 7A). This result indicates that low-B tolerance phenotype of these F2 population individuals was not co-segregated with their T-DNA insertion genotype, suggesting that the low-B tolerance of lbt mutant was not caused by T-DNA insertion in At1g78860.
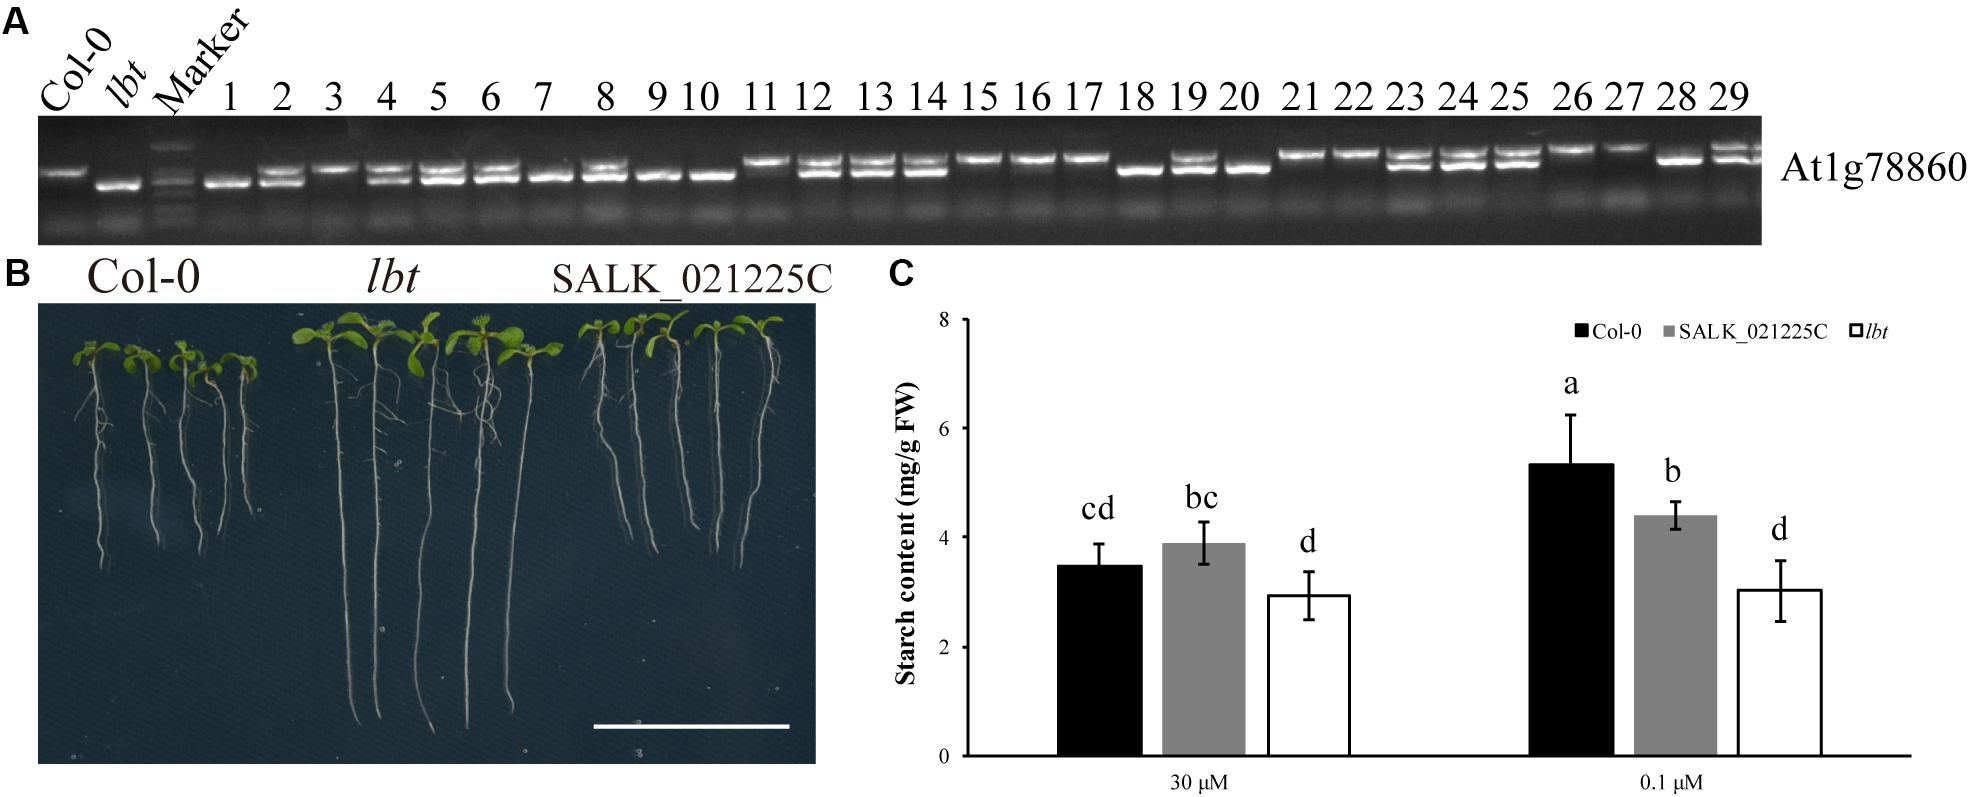
FIGURE 7. Genotype of F2 population with low-B tolerance phenotype. The primer is shown in Table 1. (A) Genotype of Col-0, lbt (At1g78860 T-DNA insertion) and 29 low-B tolerant individuals of the F2 population. lbt band is 1024 bp production of PCR with a T-DNA primer and gene-specific primer (At1g78860 Reverse) to detect T-DNA insertion. The WT band is 493 bp production of PCR with a pair of gene-specific primers (At1g78860 Forward and At1g78860 Reverse). (B) Phenotype of Col-0, lbt mutant (SALK_144144C) and SALK_021225C line under low-B condition. Bar = 2 cm. (C) Starch content of Col-0, SALK_021225C line and lbt mutant. Different letters indicate significant differences at p-value < 0.05.
To prove the results, another T-DNA insertion line of At1g78860 (SALK_021225C, Supplementary Figures S3A,B) was used to identify the phenotypes of fresh weight, primary root and starch accumulation under the low-B (0.1 μM) condition. There was no significant difference in these three traits between Col-0 and SALK_021225C line under normal and low-B conditions. Seven-day-old SALK_021225C line and Col-0 showed shorter primary root length than lbt mutant at 0.1 μMB condition (Figure 7B). The starch concentration of 11-day-old SALK_021225C line and Col-0 was significantly higher than that of lbt mutant under low-B condition (Figure 7C). These results indicate that SALK_021225C line is sensitive to low-B stress, like Col-0. Taken together, At1g78860 did not contribute to the low-B tolerance of lbt mutant.
Mapping of QTL for Low-B Tolerance in lbt Mutant
To identify LBT gene in A. thaliana, genetic analysis of lbt mutant was carried out. A F2 population from Col-0 and lbt mutant was used to determine the segregation ratio of individual phenotypes. A total of 43 of 191 F2 individual phenotypes showed a tolerance phenotype similar to lbt mutant with long primary root length, and 148 F2 individuals showed a sensitive phenotype similar to Col-0 with short primary root length at the 0.1 μMB condition. The segregation ratios of short primary root length vs. long primary root length in the 191 F2 individuals was consistent with the expected Mendelian ratio of 3:1 (χ2 = 0.504; χ2 < χ20.01 = 6.64, Table 2). This result indicates that the low-B tolerance achieved by lbt mutant is controlled by a monogenic recessive mutation.
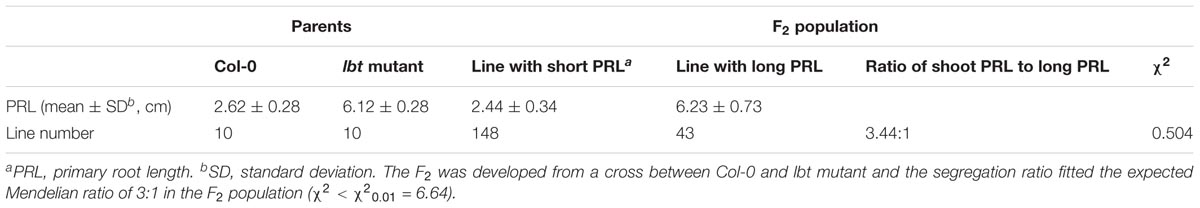
TABLE 2. The segregation ratio of low-B sensitive lines to low-B tolerance lines in F2 population.
The F2 mapping population with 120 individuals derived from a cross of Cs1909 × lbt were sequenced together with the parents based on WGS technique. A total of 102,409 homozygous SNPs were identified by the WGS analysis of the two parental lines. The SNPs that exhibited significant segregation distortion in the F2 population were filtered out (p < 0.001, χ2 test) and then 102,283 SNPs were selected from the F2 population, which were divided into 620 bin markers for linkage genetic map construction using JoinMap 4.0 software. As a result, these bin markers were assigned to 4 chromosomes (Figure 8A). Based on the high-density linkage genetic map of 620 bin markers, the primary root length (Supplementary Figure S4) under the low-B condition of the F2 population were used for QTL mapping. One QTL for low-B tolerance was identified and flanked by two bin markers (bin 335-bin 350), and it was physically located in the region of 10.4–14.8 Mb on chromosome 4 (Figure 8B). This QTL could explain 75.1% of the phenotypic variance of low-B tolerance, and the LOD value was as high as 12.2 (Figure 8B). A total of 1,324 genes existed in this QTL interval, but it does not contain any reported B-related genes.
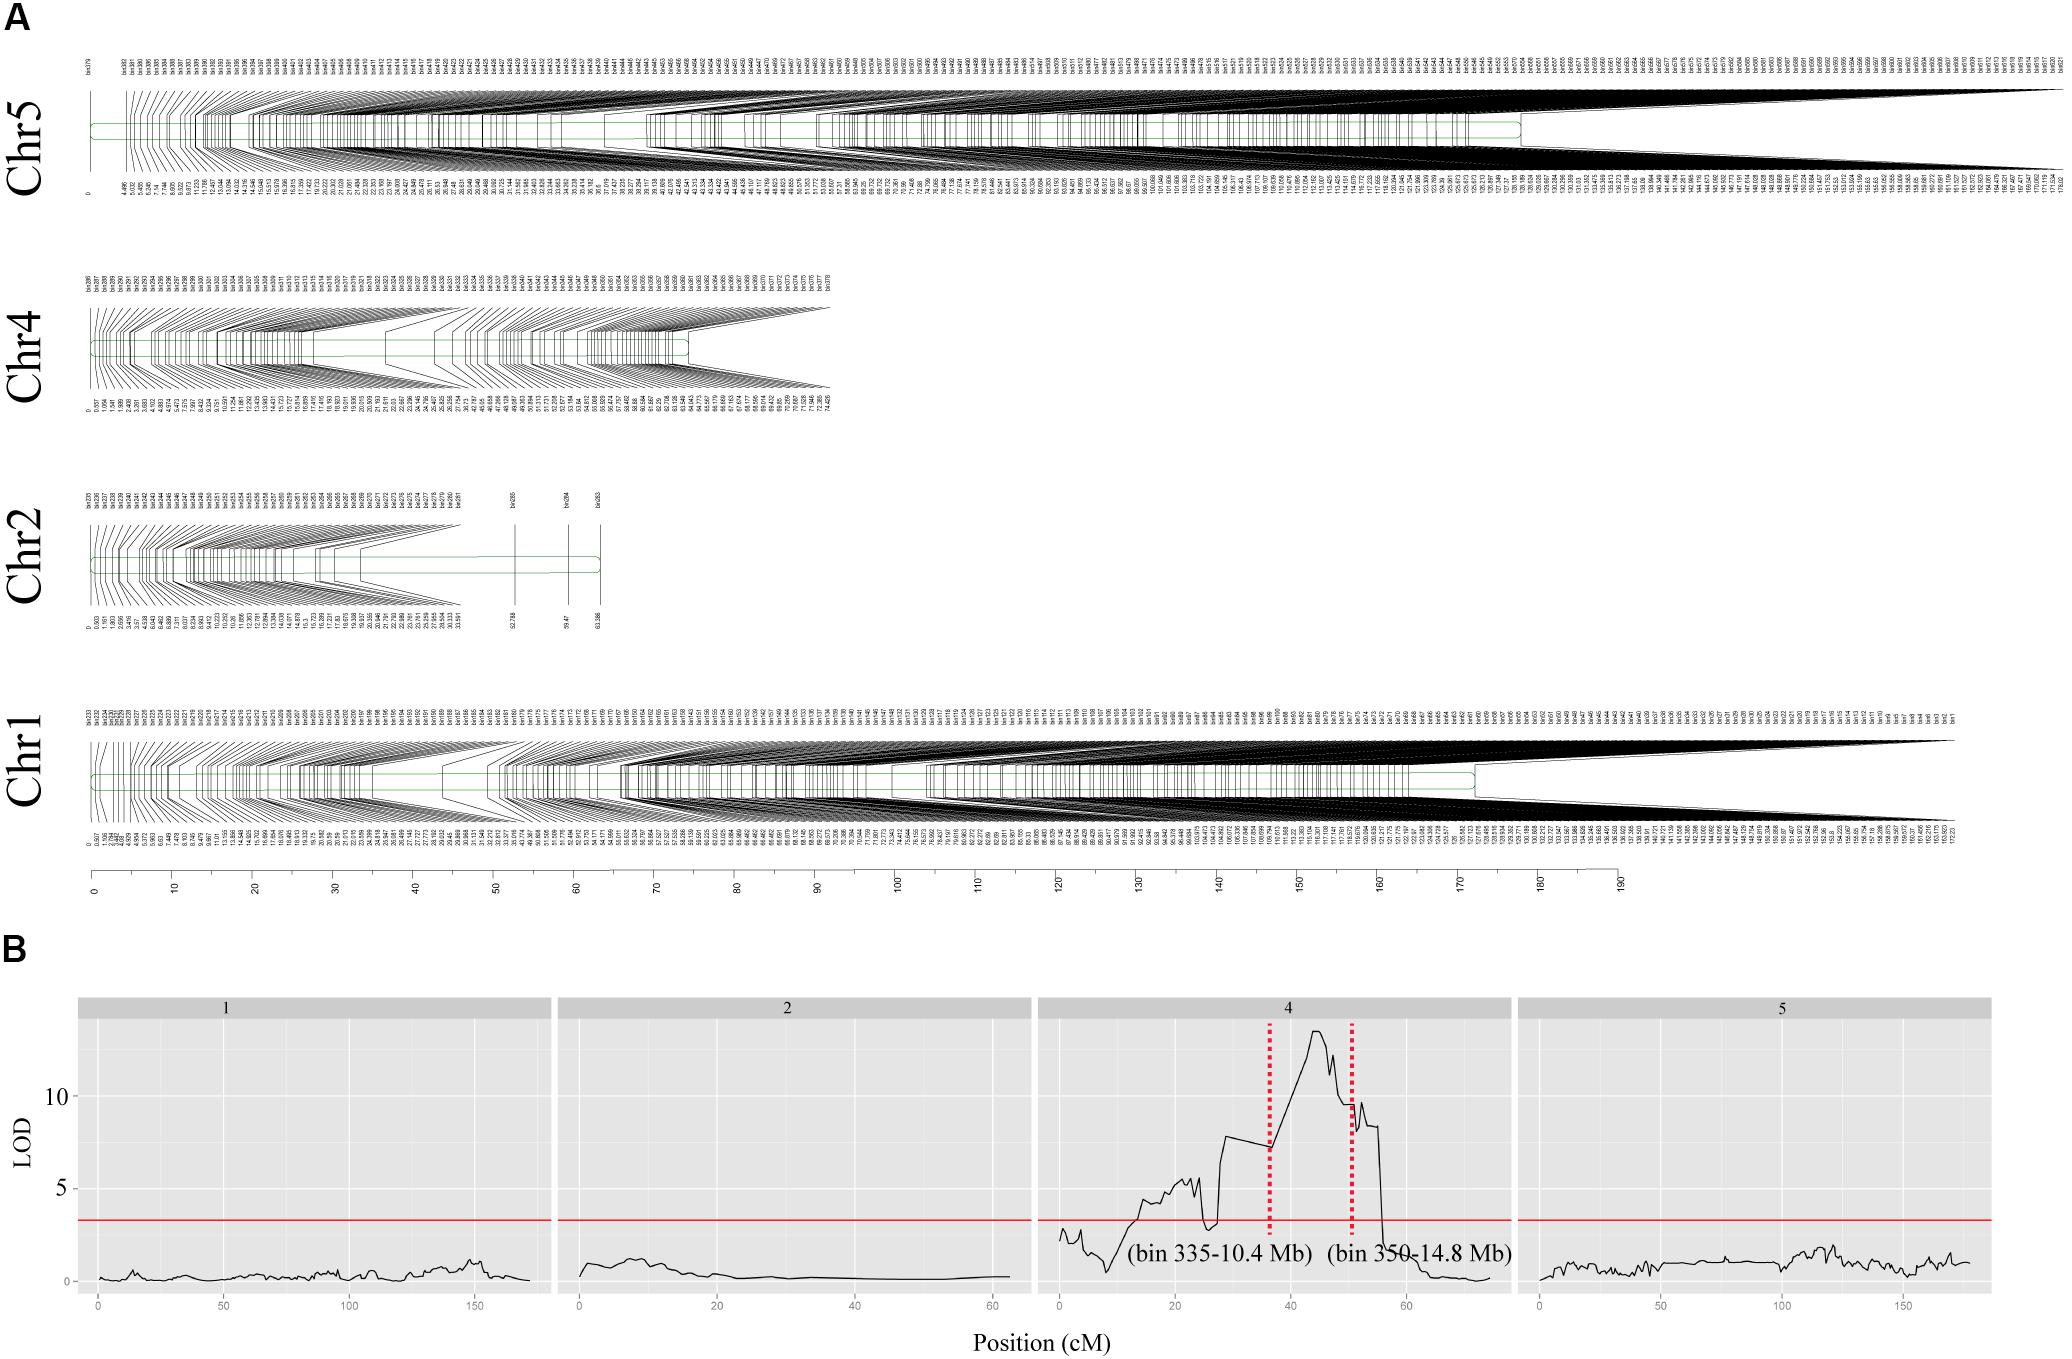
FIGURE 8. Linkage genetic map and positions of putative QTL. (A) Linkage genetic map of chromosomes 1, 2, 4, and 5 were constructed with 620 SNPs bin markers. Marker names are shown above each chromosome and map distances (cM) are shown below each chromosome. (B) Mapping of QTL for low-B tolerance on each chromosome, the y-coordinate represents the LOD value and the x-coordinate represents the genetic location. The red solid line indicates an LOD threshold of 3.3, and the red dashed line refers to the QTL flank with bin marker.
Discussion
In the present study, we reported an A. thaliana mutant lbt that showed high tolerance to B deficiency. This low-B tolerant phenotype was accompanied by improved growth performance under low-B conditions (Figure 1). The QTL for low-B tolerance was then mapped to chromosome 4 by genetic analysis.
Identification of a Low-B Tolerance Specific Mutant lbt With Low B Demand
Root growth was more sensitive to B limitation than shoot growth in A. thaliana (Takano et al., 2001). Our research indicates that lbt mutant was overly different from Col-0 in both shoot and root growth under B deficiency. lbt mutant showed improved growth performance during the vegetative stage and reproductive stage under B limitation stress (Figures 1–3). Most importantly, lbt mutant showed low-B tolerance specificity (Figure 4). Unexpectedly, the B concentrations in the root and shoot of lbt mutant were indistinguishable from those of Col-0 under low-B conditions (Figure 5F), suggesting that lbt mutant has low B demand under low-B conditions. To the best of our knowledge, at present, no research studies have reported the identification of low B demand line. The overexpression of tonoplast-localized TIP5;1 in A. thaliana conferred tolerance to B toxicity without a B concentration change in the plants (Pang et al., 2010). AtTIP5;1 accumulates on the tonoplast, facilitating the influx of B in vacuoles and leading to the compartmentalization of B. Similarly, overexpression of DUR3 gene in yeast slightly enhanced its sensitivity to B toxicity but did not affect the cellular B concentration (Nozawa et al., 2006). Taken together, it is an important finding that lbt mutant has low-B tolerance specificity with low B demand in our study.
lbt Mutant Tolerant to Low-B Condition Is Independent on Differential Expression of B Transporter Genes
Many genes involved in the uptake and transport of B have cloned from A. thaliana, including members of the NIP family and BOR family (Takano et al., 2002, 2006; Miwa et al., 2013). The B concentrations of both the root and shoot of the nip5;1 mutants and the leaves of the bor1 mutants were lower than that of wild-type plants at B limitation (Noguchi et al., 1997; Takano et al., 2006). This difference is due to the loss of uptake function in the nip5;1 mutant and translocation function in bor1 mutants, respectively. In our study, there was no significant difference in the expression of NIP5;1 and BOR2 genes between Col-0 and lbt mutant at both normal and low-B conditions (Figures 5A,C). Furthermore, compared to Col-0, BOR1 transcription abundance decreased at low-B conditions, but this decrease cannot account for the growth improvements of the shoots in lbt mutant (Figure 5B). These results suggest that transporter-related genes are not the determinant of low-B tolerance in lbt mutant.
lbt Mutant With Less Starch Accumulation Compared With Col-0 Under Low-B Condition
Previous studies have shown that B deficiency widely caused starch granule accumulation in plants, e.g., tobacco leaves (Camacho-Cristóbal et al., 2004), citrus leaves (Han et al., 2008) and navel orange leaves (Liu et al., 2015). Starch synthesis is ascribed to a cascade of enzyme functions in pathways from the Calvin–Benson cycle (Guo et al., 2017), and B deficiency inhibits plant photosynthetic capacity (Kastori et al., 1995; Zhao and Oosterhuis, 2002). These authors thus speculated the possible mechanisms that are responsible for B deficiency triggered starch accumulation in plants, such as plants reduced the ability to translocate photosynthates, decreased the demand for carbon in growing tissues due to growth inhibition or decreased the sugar usage under B deficiency. In our study, TEM analysis at the cell level revealed the distinct starch accumulation in juvenile leaves between Col-0 and lbt mutant (Figure 6). Consistent with this observation, starch level assay showed Col-0 leaves had significantly higher starch level at 0.1 μMB than at 30 μMB, whereas lbt mutant accumulated steady state level of starch which is significantly lower than Col-0 at 0.1 μMB (Figure 7C). Based on these results, we propose that the accumulation of the starch in Col-0 is merely a consequence of a B-deficiency-induced growth inhibition because less carbon demand is fulfilled. In contrast, the less growth inhibition of lbt mutant under B deficiency brings about sugar demand increase which reasonably contributes to starch consumption to some extent. We yet consider another possibility by which the starch synthesis was inhibited or its degradation was facilitated in lbt mutant due to the mutation of LBT gene. Starch can be degraded, which then generates plentiful sugars, such as maltose, glucose, and glucose-1-phosphate via enzymatic steps for energy consumption (Stitt and Zeeman, 2012). The accumulated precursors (e.g., Glc-6-P, Glc-1-P, and UDPG1c) for starch synthesis can be directly used rapidly growing tissues, decreasing starch accumulation. The mechanisms understanding low-B tolerance through the pathway of starch metabolism in lbt mutant require further experimental evidence on the precise cloning of LBT gene.
In this study, we found that T-DNA insertion was not relevant to the phenotype of lbt mutant, and the tolerance of lbt mutant to low-B stress was also not related to B transport-related genes. These results suggest that the insertion of T-DNA caused other mutations in the genome and affected the function of a gene with unknown function, which led to the phenotypic changes. To locate the target gene, we identified one major QTL for low-B tolerance, indicating that the QTL is located on chromosome 4 between 10.4 and 14.8 Mb, which contains 1324 genes, such as protein kinase genes, F-box family genes, UDP-galactose transporters and a large number of genes with unknown function. However, there are no reported B-related genes in this region. In future work, a larger F2 population based on a cross of lbt mutant and Cs1909 line and fine-mapping is required to precisely identify LBT gene in the genomic region, which may contribute to a novel understanding on the mechanism of low-B tolerance and breeding research with the cloning and function analysis of LBT gene.
Author Contributions
ZH and FX designed the experiments. ZH and LP conducted the experiments. ZH, SW, and FX analyzed the data and wrote the article. HZ and LS provided technical guidance and revised the article.
Funding
This work was financially supported by the National Natural Science Foundation of China (Project Nos. 31572185 and 31772380) and the Fundamental Research Funds for the Central Universities of China (Project No. 2662017QD039).
Conflict of Interest Statement
The authors declare that the research was conducted in the absence of any commercial or financial relationships that could be construed as a potential conflict of interest.
Acknowledgments
We would like to acknowledge Professor Toru Fujiwara (The University of Tokyo, Japan) for technical assistance.
Supplementary Material
The Supplementary Material for this article can be found online at: https://www.frontiersin.org/articles/10.3389/fpls.2018.00736/full#supplementary-material
FIGURE S1 | Reproductive growth of Col-0 and lbt mutant under 2 μMB for 60 days conditions. (A) The first branch of Col-0 and lbt mutant. Bars = 2 cm. (B) The pod of Col-0 and lbt mutant. Bars = 2 mm.
FIGURE S2 | Expressions of NIP5;1, NIP6;1 and NIP7;1 genes. Transcripts of the NIP5;1, NIP6;1 and NIP7;1 genes were detected by RT-PCR.
FIGURE S3 |(A) Structure of At1g78860 gene. Black box represents exon, gray boxes represent 5′UTR and 3′UTR and bars indicate other genomic regions. Triangles indicate the T-DNA insertions. (B) Relative expression of At1g78860 in Col-0, SALK_021225C and lbt mutant. Different letters indicate significant differences at p-value < 0.05.
FIGURE S4 | The primary root length of Cs1909, lbt mutant and F2 population individuals.
Footnotes
- ^ http://abrc.osu.edu/
- ^ http://rsb.info.nih.gov/ij/
- ^ ftp://ftp.ensemblgenomes.org/pub/plants/release-34/fasta/arabidopsis_thaliana/dna/
References
Abe, A., Kosugi, S., Yoshida, K., Natsume, S., Takagi, H., Kanzaki, H., et al. (2012). Genome sequencing reveals agronomically important loci in rice using mutmap. Nat. Biotechnol. 30, 174–178. doi: 10.1038/nbt.2095
Camacho-Cristóbal, J. J., Lunar, L., Lafont, F., Baumert, A., and González-Fontes, A. (2004). Boron deficiency causes accumulation of chlorogenic acid and caffeoyl polyamine conjugates in tobacco leaves. J. Plant Physiol. 161, 879–881. doi: 10.1016/j.jplph.2003.12.003
Camacho-Cristóbal, J. J., Martín-Rejano, E. M., Herrera-Rodríguez, M. B., Navarro-Gochicoa, M. T., Rexach, J., and González-Fontes, A. (2015). Boron deficiency inhibits root cell elongation via an ethylene/auxin/ROS-dependent pathway in Arabidopsis seedlings. J. Exp. Bot. 66, 3831–3840. doi: 10.1093/jxb/erv186
Ding, G., Zhao, Z., Yuan, L., Hu, Y., Shi, L., Yan, L., et al. (2012). Quantitative trait loci for seed yield and yield-related traits, and their responses to reduced phosphorus supply in Brassica Napus. Ann. Bot. 109, 747–759. doi: 10.1093/aob/mcr323
Doyle, J. (1987). A rapid DNA isolation procedure for small quantities of fresh leaf tissue. Phytochem. Bull. 19, 11–15.
Fujiwara, T., Hirai, M. Y., Chino, M., Komeda, Y., and Naito, S. (1992). Effects of sulfur nutrition on expression of the soybean seed storage protein genes in transgenic petunia. Plant Physiol. 99, 263–268. doi: 10.1104/pp.99.1.263
Funakawa, H., and Miwa, K. (2015). Synthesis of borate cross-linked rhamnogalacturonan II. Front. Plant Sci. 6, 1–8. doi: 10.3389/fpls.2015.00223
Guo, H., Liu, Y., Li, X., Yan, Z., Xie, Y., Xiong, H., et al. (2017). Novel mutant alleles of the starch synthesis gene TaSSIVb-D result in the reduction of starch granule number per chloroplast in wheat. BMC Genomics 18:358. doi: 10.1186/s12864-017-3724-4
Han, S., Chen, L. S., Jiang, H. X., Smith, B. R., Yang, L. T., and Xie, C. Y. (2008). Boron deficiency decreases growth and photosynthesis, and increases starch and hexoses in leaves of citrus seedlings. J. Plant Physiol. 165, 1331–1341. doi: 10.1016/j.jplph.2007.11.002
Herrera-Rodríguez, M. B., González-Fontes, A., Rexach, J., Camacho- Cristóbal, J. J., Maldonado, J. M., and Navarro-Gochicoa, M. T. (2010). Role of boron in vascular plants and response mechanisms to boron stresses. Plant Stress 4, 115–122.
Hoagland, D. R., and Arnon, D. I. (1950). The water-culture method for growing plants without soil. Calif. Agric. Exp. Stn. Circ. 347, 357–359.
Kastori, R., Plesničar, M., Pankovič, D., and Sakač, Z. (1995). Photosynthesis, chlorophyll fluorescence and soluble carbohydrates in sunflower leaves as affected by boron deficiency. J. Plant Nutr. 18, 1751–1763. doi: 10.1080/01904169509365021
Kato, Y., Miwa, K., Takano, J., Wada, M., and Fujiwara, T. (2009). Highly boron deficiency-tolerant plants generated by enhanced expression of NIP5;1, a boric acid channel. Plant Cell Physiol. 50, 58–66. doi: 10.1093/pcp/pcn168
Li, K., Kamiya, T., and Fujiwara, T. (2015). Differential roles of PIN1 and PIN2 in root meristem maintenance under low-B Conditions in Arabidopsis thaliana. Plant Cell Physiol. 56, 1205–1214. doi: 10.1093/pcp/pcv047
Li, T., Choi, W. G., Wallace, I. S., Baudry, J., and Roberts, D. M. (2011). Arabidopsis thaliana NIP7;1: an anther-specific boric acid transporter of the aquaporin superfamily regulated by an unusual tyrosine in helix 2 of the transport pore. Biochemistry 50, 6633–6641. doi: 10.1021/bi2004476
Liu, G., Dong, X., Liu, L., Wu, L., Peng, S., and Jiang, C. (2015). Metabolic profiling reveals altered pattern of central metabolism in navel orange plants as a result of boron deficiency. Physiol. Plant 153, 513–524. doi: 10.1111/ppl.12279
Mauricio, R. (2001). Mapping quantitative trait loci in plants: uses and caveats for evolutionary biology. Nat. Rev. Genet. 2, 370–381. doi: 10.1038/35072085
Miwa, K., Takano, J., and Fujiwara, T. (2006). Improvement of seed yields under boron-limiting conditions through overexpression of BOR1, a boron transporter for xylem loading, in Arabidopsis thaliana. Plant J. 46, 1084–1091. doi: 10.1111/j.1365-313X.2006.02763.x
Miwa, K., Takano, J., Omori, H., Seki, M., Shinozaki, K., and Fujiwara, T. (2007). Plants tolerant of high boron levels. Science 318:1417. doi: 10.1126/science.1146634
Miwa, K., Wakuta, S., Takada, S., Ide, K., Takano, J., Naito, S., et al. (2013). Roles of BOR2, a boron exporter, in cross linking of rhamnogalacturonan II and root elongation under boron limitation in Arabidopsis. Plant Physiol. 163, 1699–1709. doi: 10.1104/pp.113.225995
Noguchi, K., Dannel, F., Pfeffer, H., Römheld, V., Hayashi, H., and Fujiwara, T. (2000). Defect in root-shoot translocation of boron in Arabidopsis thaliana mutant bor 1-1. J. Plant Physiol. 156, 751–755. doi: 10.1016/S0176-1617(00)80242-4
Noguchi, K., Yasumori, M., Imai, T., Naito, S., Matsunaga, T., Oda, H., et al. (1997). bor1-1, an Arabidopsis thaliana mutant that requires a high level of boron. Plant Physiol. 115, 901–906. doi: 10.1104/pp.115.3.901
Nozawa, A., Takano, J., Kobayashi, M., Von Wiren, N., and Fujiwara, T. (2006). Roles of BOR1, DUR3, and FPS1 in boron transport and tolerance in Saccharomyces cerevisiae. Fems Microbiol. Lett. 262, 216–222. doi: 10.1111/j.1574-6968.2006.00395.x
Pang, Y., Li, L., Fei, R., Lu, P., Wei, P., Cai, J., et al. (2010). Overexpression of the tonoplast aquaporin AtTIP5;1 conferred tolerance to boron toxicity in Arabidopsis. J. Genet. Genomics 37, 389–397. doi: 10.1016/S1673-8527(09)60057-6
Peng, L., Zeng, C., Shi, L., Cai, H., and Xu, F. (2012). Transcriptional profiling reveals adaptive responses to boron deficiency stress in Arabidopsis. Z. Naturforsch. C. 67, 510–524. doi: 10.5560/ZNC.2012.67c0510
Qin, L., Guo, Y., Chen, L., Liang, R., Gu, M., Xu, G., et al. (2012). Functional characterization of 14 Pht1 family genes in yeast and their expressions in response to nutrient starvation in soybean. PLoS One 7:e47726. doi: 10.1371/journal.pone.0047726
Shen, Y., Xiang, Y., Xu, E., Ge, X., and Li, Z. (2018). Major co-localized QTL for plant height, branch initiation height, stem diameter, and flowering time in an alien introgression derived Brassica napus DH population. Front. Plant Sci. 9:390. doi: 10.3389/fpls.2018.00390
Shorrocks, V. M. (1997). The occurrence and correction of boron deficiency. Plant Soil 193, 121–148. doi: 10.1023/A:1004216126069
Stitt, M., and Zeeman, S. C. (2012). Starch turnover: pathways, regulation and role in growth. Curr. Opin. Plant Biol. 15, 282–292. doi: 10.1016/j.pbi.2012.03.016
Takano, J., Noguchi, K., Yasumori, M., Kobayashi, M., Gajdos, Z., Miwa, K., et al. (2002). Arabidopsis boron transporter for xylem loading. Nature 420, 337–340. doi: 10.1038/nature01139
Takano, J., Wada, M., Ludewig, U., Schaaf, G., Wirén, N. von, Fujiwara, T., et al. (2006). The Arabidopsis major intrinsic protein NIP5;1 is essential for efficient boron uptake and plant development under boron limitation. Plant Cell 18, 1498–1509. doi: 10.1105/tpc.106.041640
Takano, J., Yamagami, M., Noguchi, K., Hayashi, H., and Fujiwara, T. (2001). Preferential translocation of boron to young leaves in Arabidopsis thaliana regulated by the BOR1 Gene. Soil Sci. Plant Nutr. 47, 345–357. doi: 10.1080/00380768.2001.10408398
Tanaka, M., Sotta, N., Yamazumi, Y., Yamashita, Y., Miwa, K., Murota, K., et al. (2016). The minimum open reading frame, AUG-Stop, induces boron-dependent ribosome stalling and mRNA degradation. Plant Cell 28, 2830–2849. doi: 10.1105/tpc.16.00481
Tanaka, M., Wallace, I. S., Takano, J., Roberts, D. M., and Fujiwara, T. (2008). NIP6;1 is a boric acid channel for preferential transport of boron to growing shoot tissues in Arabidopsis. Plant Cell 20, 2860–2875. doi: 10.1105/tpc.108.058628
Wang, S., Yoshinari, A., Shimada, T., Hara-Nishimura, I., Mitani-Ueno, N., Feng Ma, J., et al. (2017). Polar localization of the NIP5;1 boric acid channel is maintained by endocytosis and facilitates boron cransport in Arabidopsis Roots. Plant Cell 29, 824–842. doi: 10.1105/tpc.16.00825
Warington, K. (1923). The effect of boric acid and borax on the broad bean and certain other plants. Ann. Bot. 37, 629–672. doi: 10.1093/oxfordjournals.aob.a089871
Xu, X., and Bai, G. (2015). Whole-genome resequencing: changing the paradigms of SNP detection, molecular mapping and gene discovery. Mol. Breed. 35:33. doi: 10.1007/s11032-015-0240-6
Zeng, C., Han, Y., Shi, L., Peng, L., Wang, Y., Xu, F., et al. (2008). Genetic analysis of the physiological responses to low-Boron stress in Arabidopsis thaliana. Plant Cell Environ. 31, 112–122.
Zhang, Q., Chen, H., He, M., Zhao, Z., Cai, H., Ding, G., et al. (2017). The boron transporter BnaC4.BOR1;1c is critical for inflorescence development and fertility under boron limitation in Brassica napus. Plant Cell Environ. 40, 1819–1833. doi: 10.1111/pce.12987
Zhao, D., and Oosterhuis, D. M. (2002). Cotton carbon exchange, nonstructural carbohydrates, and boron distribution in tissues during development of boron deficiency. Field Crops Res. 78, 75–87. doi: 10.1016/S0378-4290(02)00095-3
Keywords: Arabidopsis thaliana, low-boron, tolerance, lbt mutant, genetic analysis, starch accumulation
Citation: Huai Z, Peng L, Wang S, Zhao H, Shi L and Xu F (2018) Identification and Characterization of an Arabidopsis thaliana Mutant lbt With High Tolerance to Boron Deficiency. Front. Plant Sci. 9:736. doi: 10.3389/fpls.2018.00736
Received: 09 February 2018; Accepted: 15 May 2018;
Published: 04 June 2018.
Edited by:
Manuel González-Guerrero, Universidad Politécnica de Madrid (UPM), SpainReviewed by:
Monika Wimmer, Universität Bonn, GermanyGerd Patrick Bienert, Leibniz-Institut für Pflanzengenetik und Kulturpflanzenforschung (IPK), Germany
Copyright © 2018 Huai, Peng, Wang, Zhao, Shi and Xu. This is an open-access article distributed under the terms of the Creative Commons Attribution License (CC BY). The use, distribution or reproduction in other forums is permitted, provided the original author(s) and the copyright owner are credited and that the original publication in this journal is cited, in accordance with accepted academic practice. No use, distribution or reproduction is permitted which does not comply with these terms.
*Correspondence: Fangsen Xu, ZmFuZ3Nlbnh1QG1haWwuaHphdS5lZHUuY24=