 Chenrui Gong1,2,3†
 Qingzhang Du
 Mingyang Quan
 Deqiang Zhang
94% of researchers rate our articles as excellent or good
Learn more about the work of our research integrity team to safeguard the quality of each article we publish.
Find out more
ORIGINAL RESEARCH article
Front. Plant Sci. , 18 January 2018
Sec. Plant Biotechnology
Volume 8 - 2017 | https://doi.org/10.3389/fpls.2017.02199
Short insertions and deletions (InDels) are one of the major genetic variants and are distributed widely across the genome; however, few investigations of InDels have been conducted in long-lived perennial plants. Here, we employed a combination of RNA-seq and population resequencing to identify InDels within differentially expressed (DE) genes underlying wood formation in a natural population of Populus tomentosa (435 individuals) and utilized InDel-based association mapping to detect the causal variants under additive, dominance, and epistasis underlying growth and wood properties. In the present paper, 5,482 InDels detected from 629 DE genes showed uneven distributions throughout all 19 chromosomes, and 95.9% of these loci were diallelic InDels. Seventy-four InDels (positive false discovery rate q ≤ 0.10) from 68 genes exhibited significant additive/dominant effects on 10 growth and wood-properties, with an average of 14.7% phenotypic variance explained. Potential pleiotropy was observed in one-third of the InDels (representing 24 genes). Seven genes exhibited significantly differential expression among the genotypic classes of associated InDels, indicating possible important roles for these InDels. Epistasis analysis showed that overlapping interacting genes formed unique interconnected networks for each trait, supporting the putative biochemical links that control quantitative traits. Therefore, the identification and utilization of InDels in trees will be recognized as an effective marker system for molecular marker-assisted breeding applications, and further facilitate our understanding of quantitative genomics.
Short insertions and deletions (InDels), as one of the major sources of structural genetic variants, are receiving increasing attention in genetic studies of humans and several model species for their contribution of economic or agricultural traits and human diseases (Mullaney et al., 2010; Yang et al., 2014). In recent years, great efforts have focused on discovering InDel variants, identifying causal InDels, examining the evolutionary processes, and detecting genomic signatures for selection. In model plants Arabidopsis and rice, intragenic InDels were correlated to functional roles in flowering time and grain filling (Kuittinen et al., 2008; Rao et al., 2011). Exonic InDels resulting in nonsense mutation or frameshift mutation had also been proved to control carotenoid accumulation in carrot and impair the transcription of gene in pink-fruited tomato (Lin et al., 2014; Iorizzo et al., 2016). All of these studies suggested a potential and important role of InDels in exerting deleterious or beneficial effect on genome and further influencing the phenotypes. However, minimal studies on InDels have been conducted in long-lived perennial and woody plants.
Trees have many notable differences from herbaceous species, particularly in size, lifespan, and perennial and woody growth. They occur in wide geographical distributions that promote abundant diversity in morphology, physiology, adaptation, and disease resistance, which is caused by underlying genetic architectures and their interaction with the environment (Tuskan et al., 2006). Dissecting the causative relationships between naturally occurring allelic variants and phenotypic variation may improve our understanding of the mechanisms of complex quantitative traits, environmental adaptation, and speciation (Mackay et al., 2009). In this regard, progress has been made, primarily through the development and dissection of numerous genome/gene-derived simple sequence repeats (SSRs) and single nucleotide polymorphisms (SNPs) in diverse, natural tree populations (Evans et al., 2014; Du et al., 2015). Recently, InDel variants had been recognized as an effective marker system for genomic studies and molecular marker-assisted breeding applications, and should be employed in genetic studies of trees (Yang et al., 2014).
Moreover, tree growth derives from a succession of developmental process involving cell division and expansion, cell wall deposition and requires the coordinated regulation of diverse biological pathways (Groover, 2005). Stem diameter growth results from cell division activity originating in the vascular cambium where new cells differentiate into phloem that convert photosynthate into water-conducting and supportive xylem tissues (wood). In the past few decades, genetic transformation techniques have helped to make remarkable progress in our understanding of key genes and proteins involved in the biosynthesis of primary and secondary cell wall components (especially lignin) in trees (Groover, 2005). However, these findings also indicate that current methods and understandings are insufficient to fully uncover the complex genetic architecture of cell wall biosynthesis.
Association genetics has proved its power in identification of causal variants underlying quantitative variation in some economically important traits, based on allelic SNPs and/or SSRs (Eckert et al., 2012; McKown et al., 2014); however, “missing heritability” and the low contribution rate explained by each locus (an average effect of c. 5.0% in forest trees) remain unexplained. One frequently assumed explanation is non-SNP allelic variation, for example, InDels (Manolio et al., 2009), which has been largely unexamined for complex traits. Recent progress in Populus revealed an alternative approach which captures numerous variants within interacting genes with additive, dominant, and epistatic effects underlying quantitative traits (Du et al., 2015). This novel approach tested the interacting variants and found a highly dynamic and sensitive genetic architecture of complex quantitative traits. It may be suited for identifying the potential gene-derived InDel variants underlying the complexities of wood biosynthesis, in which all investigations on discovery and dissection of InDels remain to be addressed.
Herein, we developed a method that combined RNA-seq and population resequencing profile to identify InDel variants within differentially expressed (DE) genes underlying wood formation in a randomly collection with 435 natural individuals of Populus tomentosa. Additionally, we performed multi-InDel association mapping, joining additive, dominant, and epistatic effects to preferably decipher the genetic architecture of growth and lignocellulose biosynthesis in Populus, which could provide a better understanding of the causal networks of InDels/genes affecting the quantitative variation in wood formation in trees.
The 435 24-year-old, unrelated natural individuals of P. tomentosa in this study were from a random collection of 1,047 native individuals (Guan Xian County, Shandong Province, China, 36°23′N, 115°47′E), which represented almost the entire natural distribution range of P. tomentosa (Supplementary Methods S1). Population structure was estimated and resulted in three climatic regions (Northeastern, Northwestern, and Southern) (Du et al., 2012). Ten growth and wood property traits were measured in this population using at least three replications per phenotype. The growth traits included stem height (H), diameter at breast height (DBH), and stem volume (V) with at least three technical replications per sample. Wood property traits included three physical properties: fiber length, fiber width (FW), and microfiber angle (MFA), as well as four chemical compositions: holocellulose, α-cellulose, hemicelluloses, and lignin. Details on the sampling method, measuring phenotypic variance, and Pearson’s correlation tests of these traits were described in the previous study (Du et al., 2014).
Mature xylem, developing xylem, and cambium tissues from a 3-year-old P. tomentosa tree (clone “LM50”) were collected at breast height with three biological replicates (Supplementary Methods S1). The tissues were immediately frozen in liquid nitrogen and used for high-throughput transcriptome sequencing. Total RNA extraction was performed as Chen et al. (2015) described. The paired-end cDNA library was constructed with the TruSeq RNA Sample Preparation Guide (Illumia) after purifying the total RNA with the RNeasy micro kit (Cat#74004, Qiagen) and then sequenced on Illumina HiSeq 2000 platform to generate 100 bp paired-end reads, following the manufacturer’s instructions (Supplementary Methods S1). Three biological replicates were used for all RNA-seq experiments. Raw sequencing data were filtered with the quality requirement using FastX software (v0.0.13, http://hannonlab.cshl.edu/fastx_toolkit/) (Supplementary Methods S1). After screening and trimming, all clean reads were mapped to the Populus trichocarpa reference genome v3.0 (Sundell et al., 2015) using the splice mapping algorithm in TopHat (v2.0.9, Kim et al., 2013) with default parameters, excepting for multiple hits ≤1. Cufflinks (version 2.1.1, Trapnell et al., 2010) was used to calculate the expression level of genes and DE gene were identified using the fold change (FC) ≥2 or ≤0.5 with the cut off at P-value of 1.0e-03 and a q-value of 0.10 (Supplementary Methods S1).
To validate the quality of the expression pattern determined from the RNA-seq data, 10 genes were randomly selected from the RNA-seq experiments for tissue-specific expression analysis. Eight tissues and organs from the 3-year-old clone “LM50” of P. tomentosa, including root, stem (phloem, cambium, developing xylem, mature xylem), developing leaf, mature leaf, and apical shoot meristem were investigated using real-time quantitative PCR (RT-qPCR). All RT-qPCRs were performed on a 7500 Fast Real-Time PCR System (ABI) using the Light Cycler-Fast Start DNA master SYBR Green I kit (Roche). All primer pairs for the DE genes and the internal control (Actin, accession number: EF145577) were designed using Primer Express v3.0 (Applied Biosystems) and are provided in Supplementary Table S1. The thermocycler program and reaction components were done as Du et al. (2015) described. All reactions were performed with three technical replications and three biological replications. The data were analyzed using Opticon Monitor Analysis Software v3.1 and standardized to the levels of Actin (accession no. GQ988327) using the 2-ΔΔCt method.
All 435 individuals were resequenced with an average of 15-fold coverage (raw data) using the Illumina GA2 instrument and the quality of paired-end short reads of 100 bp was controlled by removing low-quality reads (≥50% of nucleotides with a quality score (Q) <20). Then the short reads were mapped and aligned to the P. trichocarpa reference genome v3.0 using SOAP aligner/SOAP2 v2.20 with the default options (Li et al., 2008). The mapping rate for different individuals varied from 81 to 92% with the effective mapping depth about 11×. To get high-quality InDels, only the uniquely mapped paired-end reads were used to perform InDels calling, using the GATK v3 (McKenna et al., 2010) with default parameters. The original InDel data was filtered using the Variant Call Format (VCF) tool v4.1 (Danecek et al., 2011) with InDel size >1 bp, quality score (Q) > 20, missing rate ≤0.25, and minor allele frequency (MAF) >0.001 (Supplementary Methods S1).
InDels for the DE genes were extracted by a custom Python script, including InDels within 2 kb upstream (promoter) and 500 bp downstream (3′UTR). InDel genotypic data for association were filtered by removing: (1) the complex InDels sites (more than two allele at one site); (2) unseparated InDel sites among 435 P. tomentosa individuals; (3) minor genotype frequency <5%. After this procedure, the clean InDels and genotypes were obtained for P. tomentosa natural population (Supplementary Methods S1). Additionally, we validated several of the genic-InDels by PCR and capillary electrophoresis on a capillary sequencer ABI3730xl DNA Analyzer (Applied Biosystems, Carlsbad, CA, United States) and found that the accuracy of genic-InDel calling reached 96.7% (Supplementary Data S1).
InDel heterozygosity (He) was calculated by Nei’s expected heterozygosity: , where pt represented the allele frequency of the ith allele (Nei, 1973). Linkage disequilibrium (LD) tests were performed in the association population using common diallelic InDels (MAF ≥ 0.05). The squared correlation of the allele frequency values (r2) and high-LD blocks was calculated in Haploview v4.2 (Barrett et al., 2005). To assess the extent of LD, the decay of LD with physical distance was estimated by non-linear regression.
We performed single-InDel association analysis based on the mixed linear model (MLM) in TASSEL v5.0 (Yu et al., 2006), where the population structure matrix (Q) and the relative kinship matrix (K) were respectively considered to evaluate the effects of population structure and relatedness among individuals. The values of Q and K were calculated similar to the previous study (Du et al., 2012). A cutoff of positive false discovery rate (FDR) q < 0.10 with 104 iterations were used for selecting significance threshold (Storey and Tibshirani, 2003).
We used the TASSEL v5.0 to detect the additive and dominant effects, and epistatic effects between each InDel pair was calculated by epiSNP computer program (Ma et al., 2008). Here, epiSNP is a computer package of serial computing programs, in which an extended Kempthorne model were implemented for estimating epistatic effects between each locus pair. In this program, epistatic effects were orthogonally decomposed divided into four components: additive × additive (A × A), additive × dominance (A × D), dominance × additive (D × A), and dominance × dominance (D × D) interactions, which genetic interpretations of allele × allele, allele × genotype, genotype × allele, and genotype × genotype interactions. More details about this program are described in Ma et al. (2008).
To test whether the significant InDels (FDR q < 0.10) affect the relative transcript abundance of their corresponding DE genes, we quantified the mRNA levels of the different InDel genotypic classes in the association population by RT-qPCR. For each genotypic class, 10 individuals were sampled by obtaining cDNA from the mature xylem, developing xylem, and cambium tissues of the stem at breast height. The differential expression across the three genotypic classes of InDel (SS, SL, and LL represent deletion/deletion, insertion/deletion, and insertion/insertion, respectively) was tested by ANOVA (P < 0.01). The specific primer pairs were individually designed for all genes (depending on the positions of significant InDels) and are shown in Supplementary Table S1.
Our RNA-seq comparison of three woody tissues in P. tomentosa identified 697 DE genes (FC ≤ 0.5 or ≥2 at P < 1.0e-03 with FDR q < 0.10, Figure 1A and Supplementary Data S2). Of these, 322, 122, and 253 showed the highest expression in mature xylem, developing xylem, and cambium tissues, respectively (Figure 1B). Furthermore, 10 genes were randomly selected and successfully validated in tissue-specific differential expression by RT-qPCR (Figure 1C), suggesting their potential functional role during wood formation.
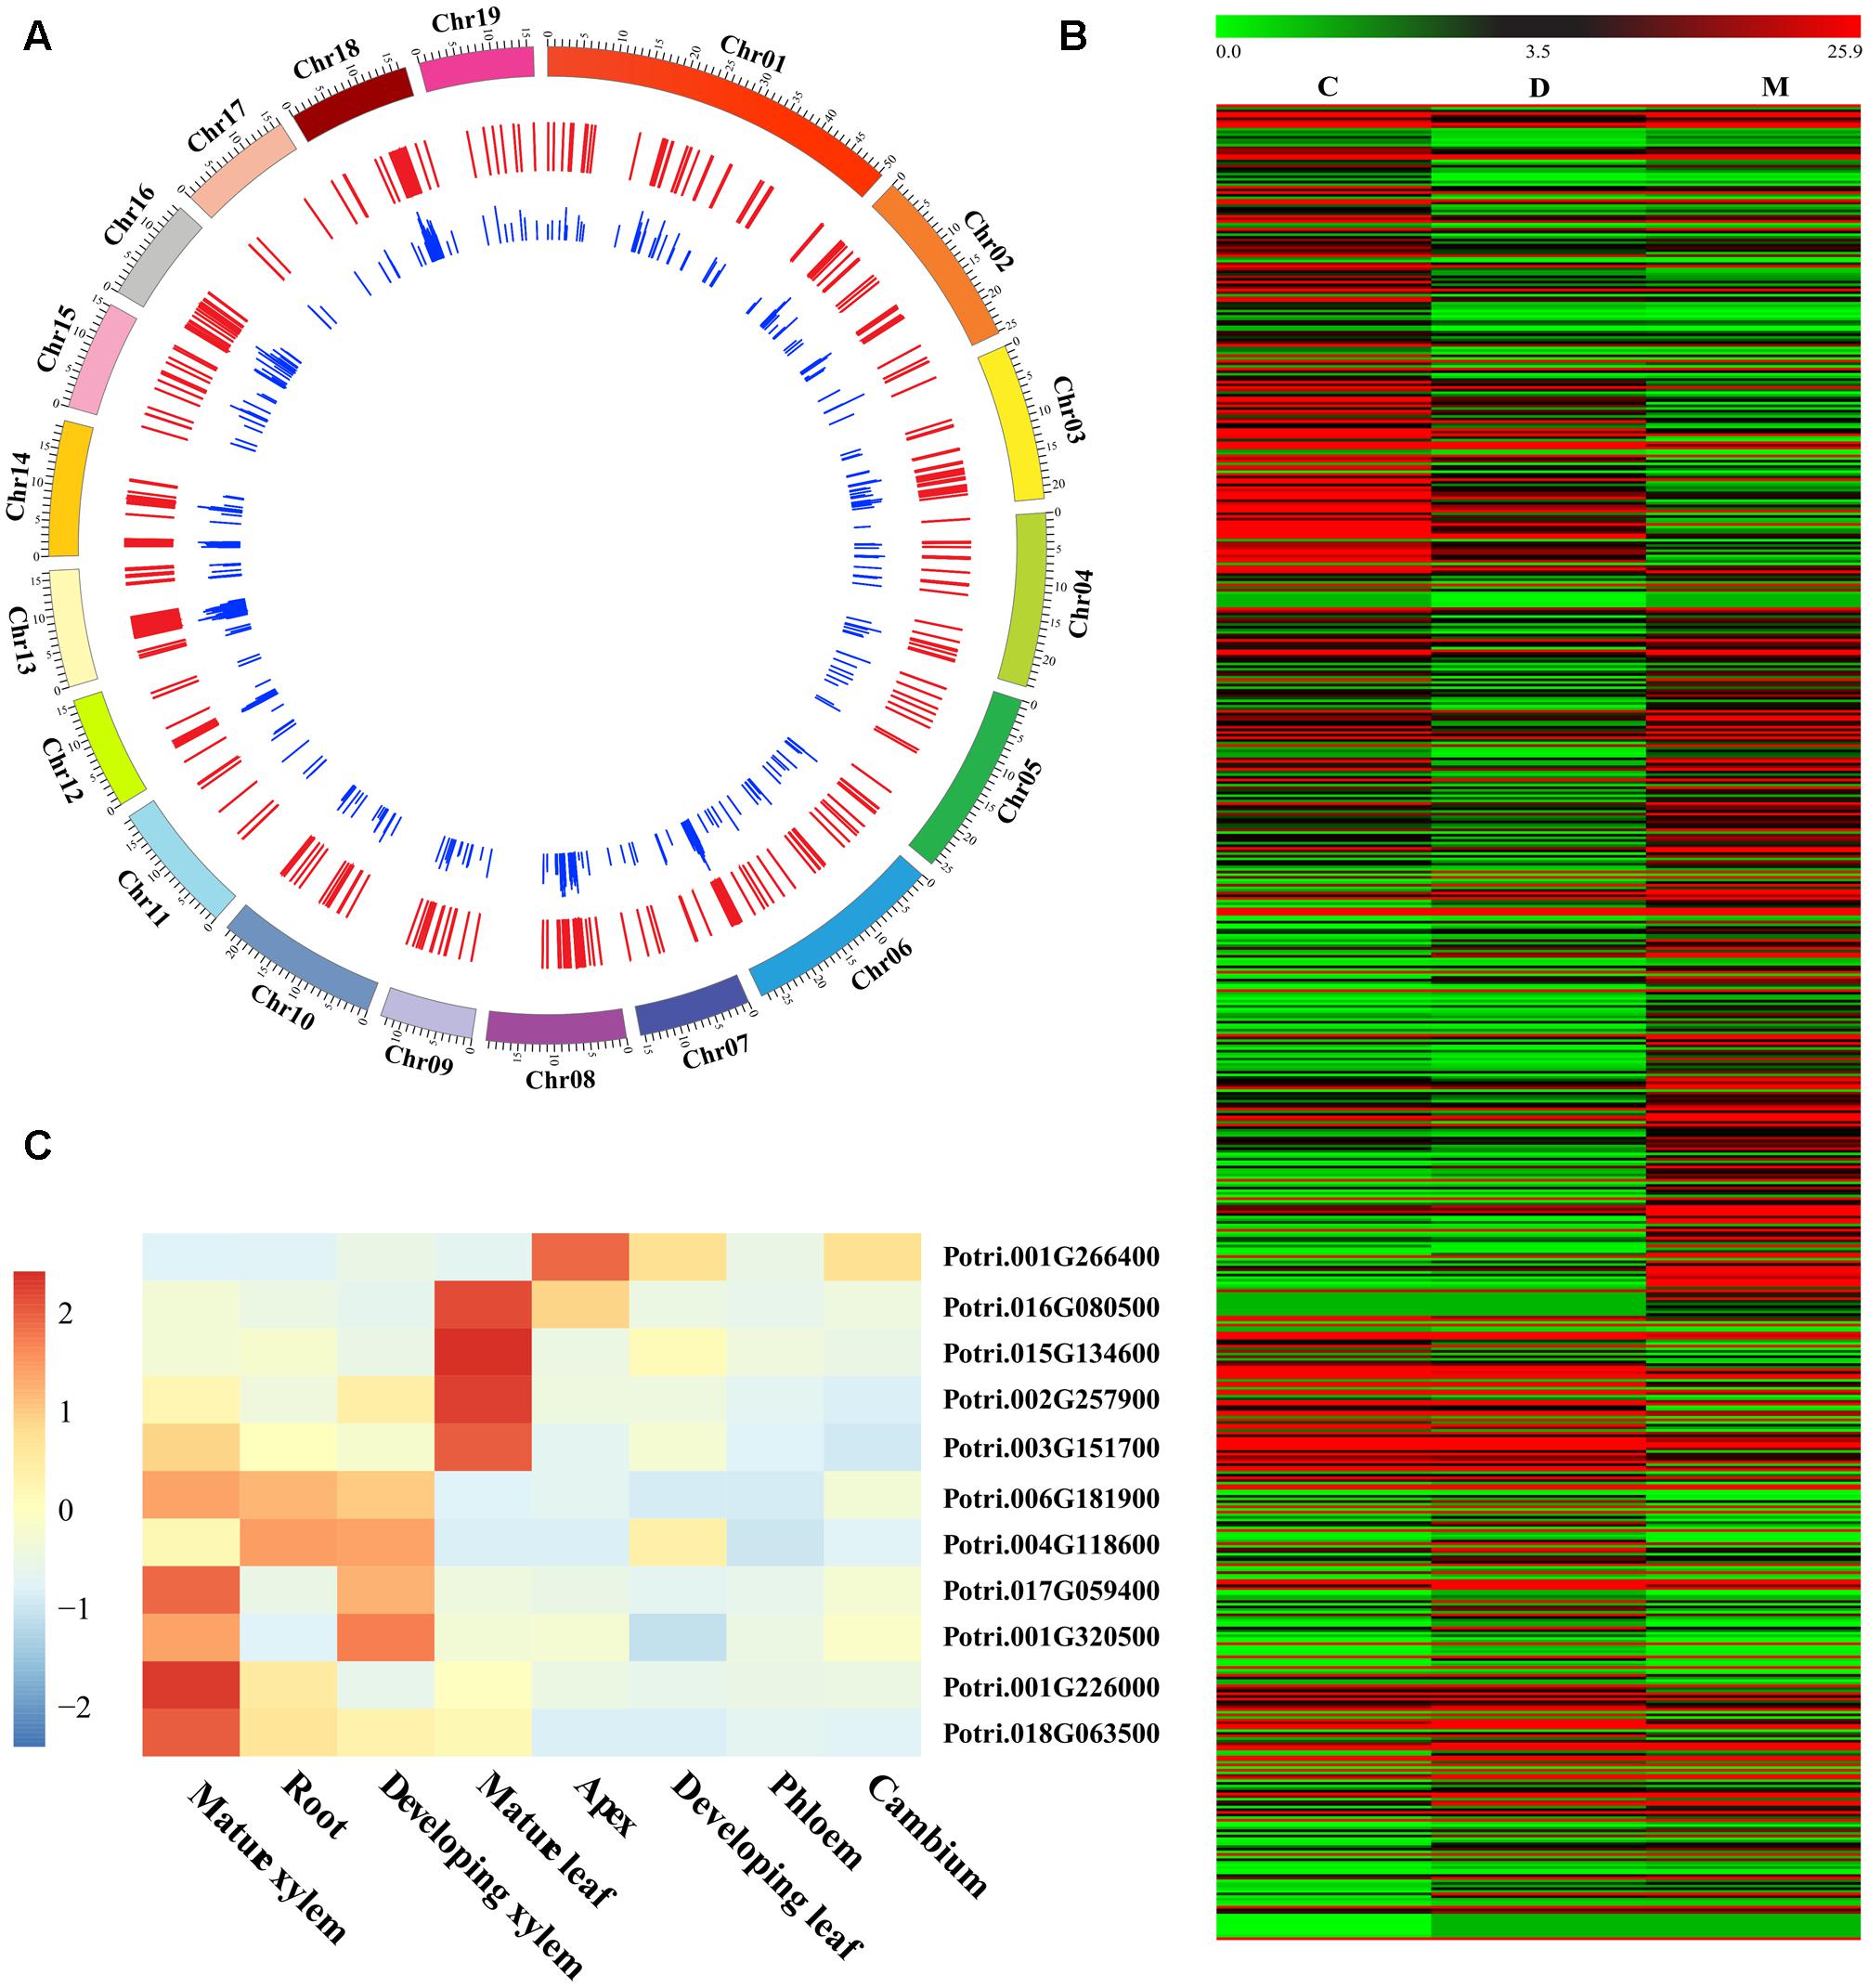
FIGURE 1. Identification and characterization of differentially expressed (DE) genes in wood tissues of Populus tomentosa. (A) Circular diagram depicting the genomic distribution of the DE genes. The P. tomentosa chromosomes (outer tract), 697 DE genes (middle track), and the frequency of InDels within each gene (inner track) were shown. (B) Heat map of transcriptome data for the DE genes in cambium (C), developing xylem (D), and mature xylem (M) tissues. The color scale is shown at the top. (C) Relative transcript levels of 10 randomly selected DE genes in different tissues and organs of P. tomentosa by RT-qPCR. Expression levels were normalized to the Actin gene.
Combining with resequencing data of P. tomentosa and gene models in PopGenie v3.0, a total of 2,565,583 bp sequences for 679 genes/gene fragments were obtained (Supplementary Data S2). Gene ontology (GO) analysis revealed 77 significant GO terms in which genes for glucan metabolism, polysaccharide biosynthesis, UDP-glucosyltransferase activity, and molecular binding were over-represented (Supplementary Data S3). Functional annotation showed that these genes were related to the cellulose synthase (CesA) family proteins, sucrose synthase (SuSy), caffeoyl-CoA O-methyltransferase (CCoAOMT), phenylalanine ammonia-lyase (PAL), auxin/indole-3-acetic acid protein (Aux/IAA), and auxin response factors (ARF). For example, 10 members from CesA family showed highest expression in cambium, while only two in mature xylem, suggesting a tissue differential expression of DE genes. We also predicted the motifs present in the promoters of DE genes using PlantPAN 2.0 (Chow et al., 2015), and found several motifs were specifically bound to WRKY, MYB, bHLH, and bZIP transcription factors. All of these strongly suggested DE genes were participated in cellulose and lignin biosynthesis pathway (Supplementary Data S2).
Through the InDel filtering pipeline, 5,482 high-quality InDels, including 2,495 insertions and 2,987 deletions, were identified with an average density of 2.14 InDels per kb and 8 per gene (Supplementary Table S2 and Data S4). Of these, 1,604 were also identified as short tandem repeat. The average length of InDels was 5.0 bp with a range of 2–41 bp. We further characterized the distribution of InDels and found most of them locating in non-coding regions, including promoter (21.9%), intron (36.8%), 5′UTR (7.7%), and 3′UTR (29.4%) (Figure 2A). Besides, about 4.3% InDels located in exon where frameshifts or premature termination often results in a putative influence in gene function (Figure 2B). Further analysis showed a clearly higher frequency of in-frame InDels, indicating a strong purifying selection on coding regions (Supplementary Data S5).
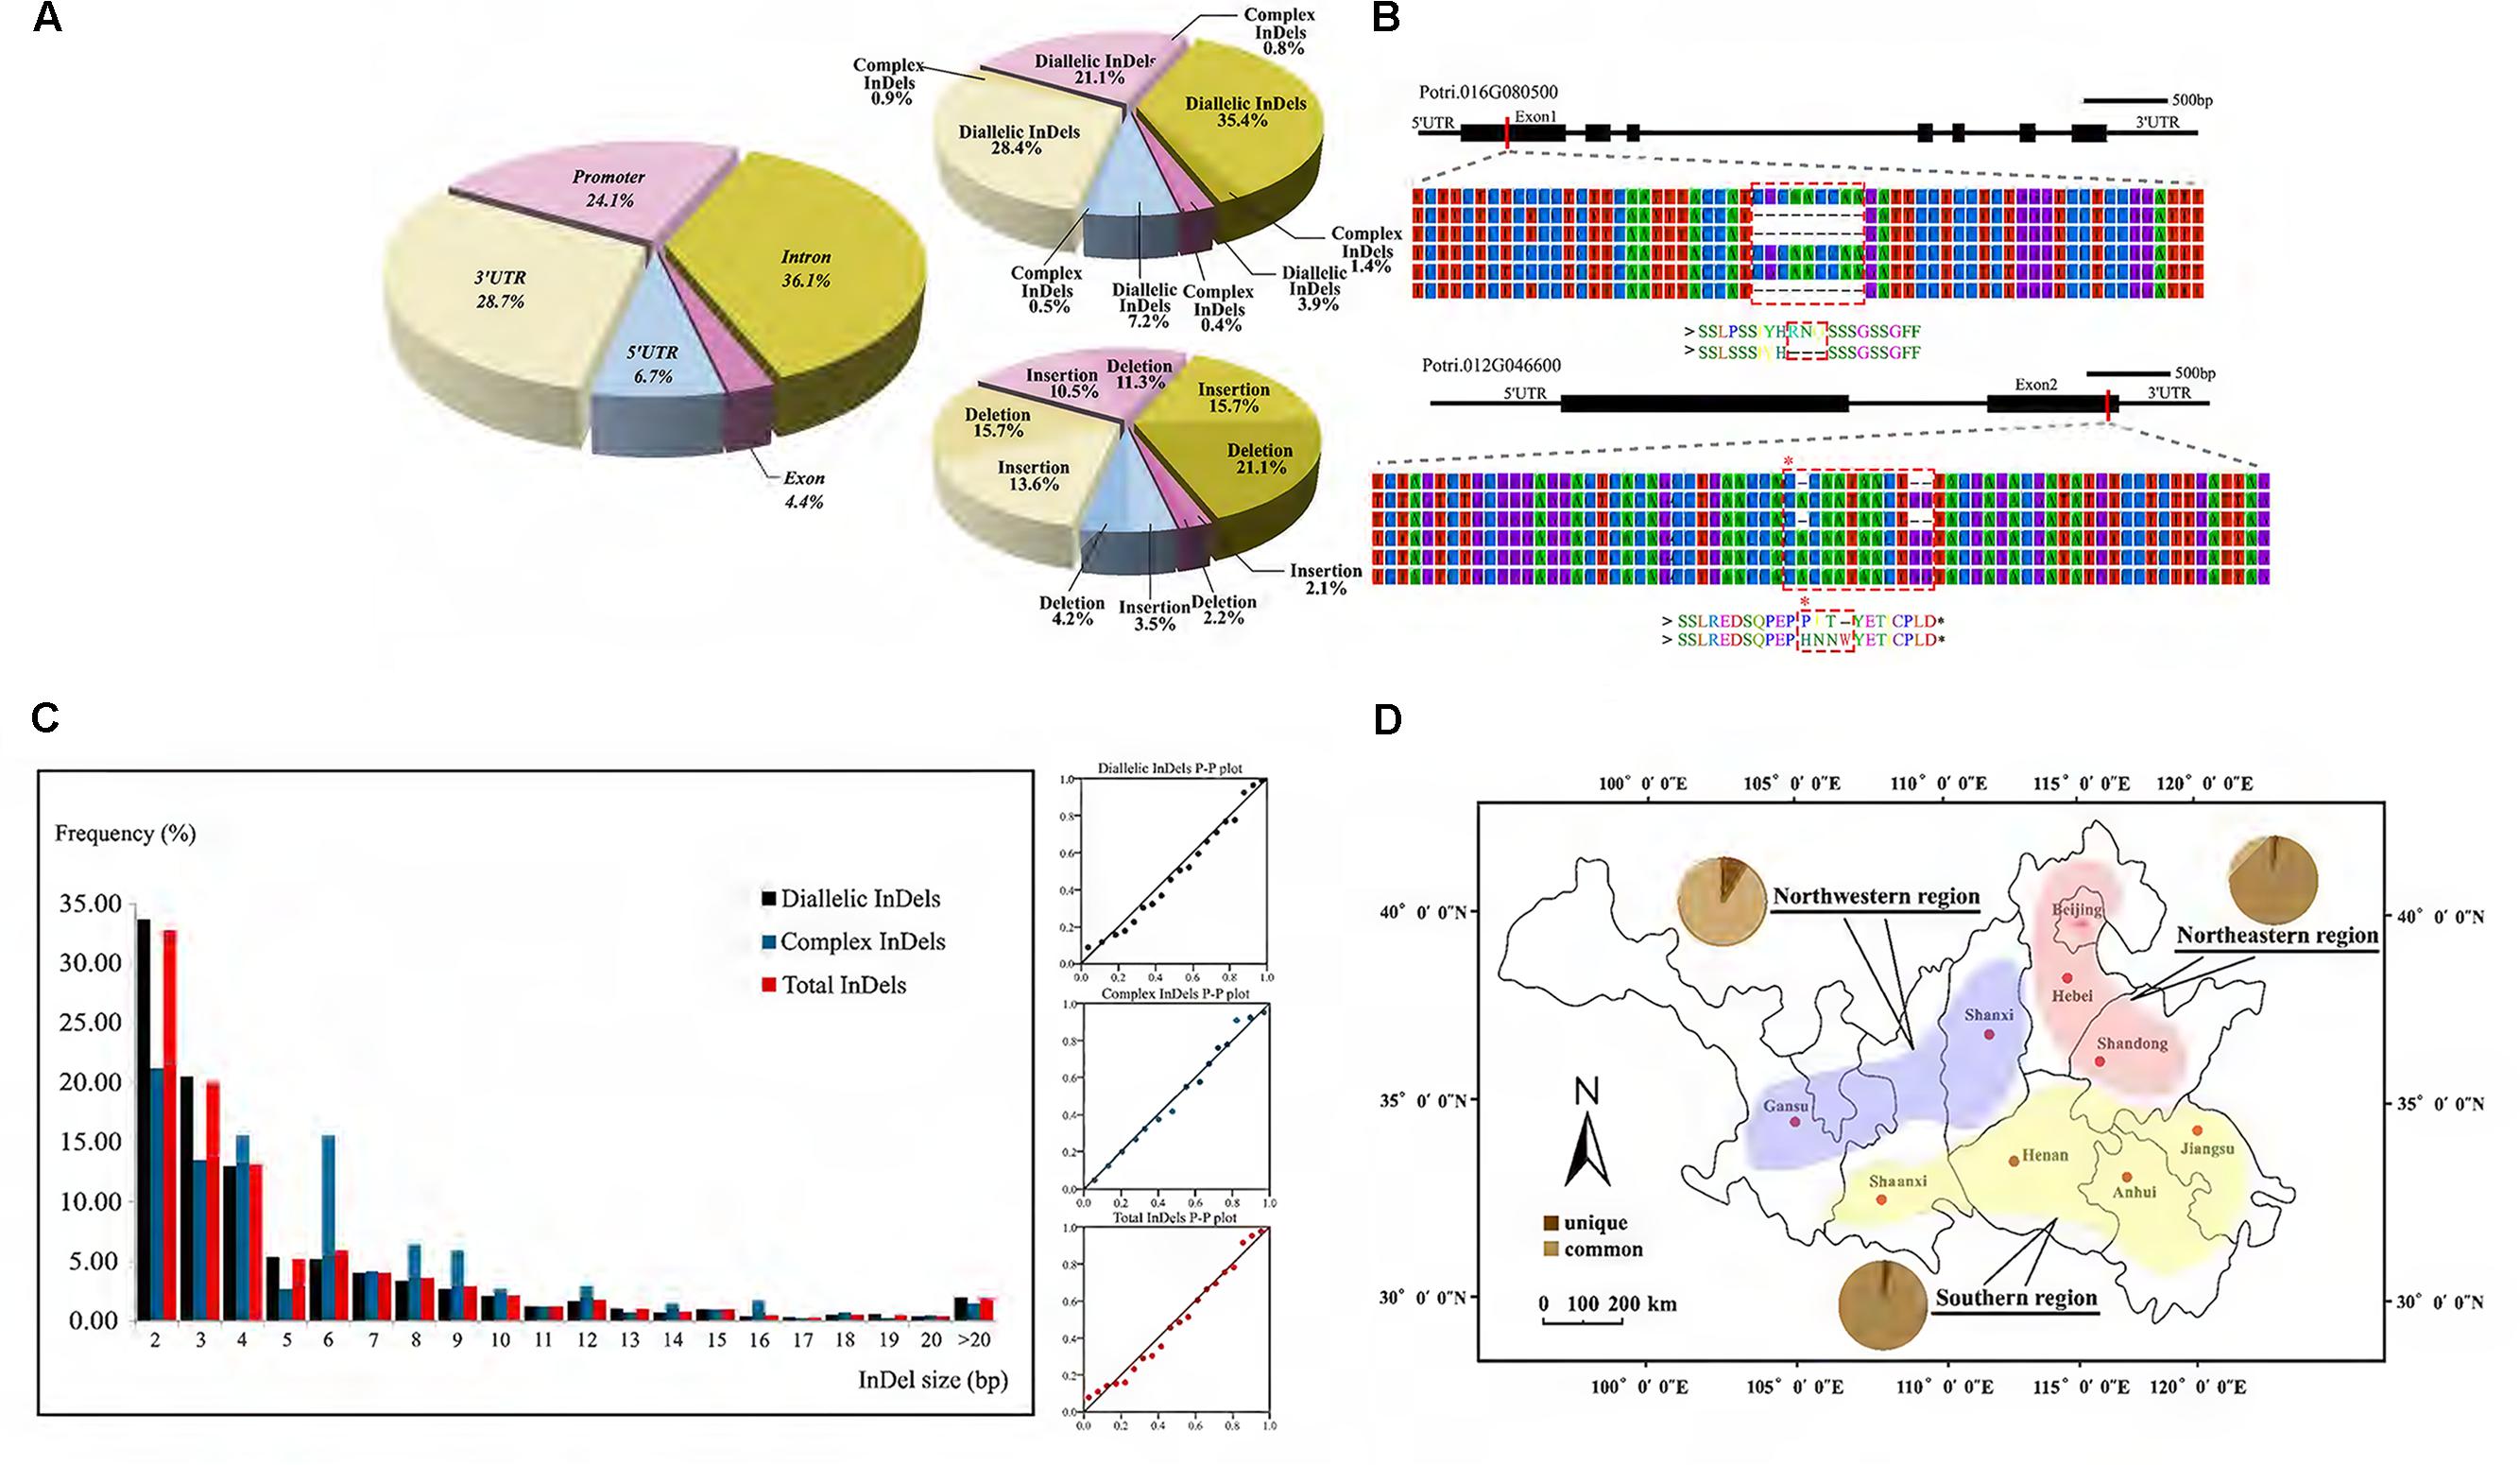
FIGURE 2. Characterization of genic-InDels in the P. tomentosa natural population. (A) Distribution pattern of genic-InDels. The distribution of total InDels among the different gene regions was shown on the left. The rates of diallelic/complex InDels and insertions/deletions were shown on the right. (B) InDels occurred within exon regions. A deletion of CGCAACCAA (dashed box) in Potri.016G080500 that caused a deletion of three amino acids [Arg(R)-Asn(N)-Gln(Q)] was shown in the upper figure. Two deletions within Potri.012G046600 that caused a frameshift (dashed box) were shown in the lower figure. (C) The length and distribution frequency of genic-InDels. The frequency distribution of InDels with different sizes (left) and the P–P plot of the frequency distribution trend (right) were shown. (D) Distribution patterns of common and unique alleles (pie charts) among the three climatic regions of P. tomentosa. The red, blue, and yellow regions represent the northeastern region (NE), the northwestern region (NW), and the southern region (S) of the P. tomentosa natural population.
Two major InDels classes were identified by analyzing the sequences of our InDels: diallelic InDels and complex InDels (also defined as multi-allelic InDels) (Supplementary Table S2). 5,259 diallelic InDels represented 95.9% of all InDels in our collection from 621 genes with three genotypes of SS, SL, and LL, indicating a dominant position. Among these, the frequency of deletions was slightly higher than that of insertions (deletion/insertion radio was 1.25:1). The majority of discovered InDels (98%) were short (2–20 bp), whereas longer InDels were relatively rare (2.0%), showing a pattern that the frequencies decreased as the length of the InDels increased (Figure 2C). Complex InDels only represented 222 sites from 175 genes which generated 731 alleles and varied from three to seven InDels per locus. Specially, 37% multi-allelic sites were caused by containing SNPs in different alleles.
According to the three climatic regions of P. tomentosa, unique and common alleles were differentially distributed, and Northwestern region hold the most variable unique alleles (Figure 2D). Pathway enrichment analysis of unique alleles revealed enrichment in biosynthesis of secondary metabolites pathway, phenylpropanoid biosynthesis pathway and plant hormone signal transduction pathway, potentially indicating evidence for climate adaptation loci varied across the climatic regions (Supplementary Data S6). We further evaluate the InDels He using 742 common diallelic InDels (MAF ≥ 0.05, Supplementary Data S7) from 358 unique genes. Results showed the He ranging from 0.19 to 0.50 with an average of 0.44 (Supplementary Data S8). In order to study characteristics of pairwise association between diallelic InDels, we performed LD tests among genic InDels. Results showed a similar low LD level (with an average r2 value of 0.053) which consistent with earlier studies using SNPs. The extent of LD declined rapidly within scales comparable to single gene, however, the levels of LD varied extensively across the genes (Supplementary Figure S1).
In total, 7,420 associations (742 InDels × 10 traits) were performed using the MLM in TASSEL v5.0, which takes into account the kinship matrix and genetic structure (K + Q), and detected 119 significant associations (FDR q < 0.10) representing 89 InDels in 81 DE genes, ranging from one to three for each gene (Table 1 and Supplementary Table S3). Among these, only one (Potri.012G044600_02) was located in exon showing significant association with α-cellulose content. Eighty-two were located in promoter or UTRs, and 36 were located in intron. The individual InDel explained 10.4–24.7% of the phenotypic variation (average R2 = 14.7%, Table 1 and Supplementary Table S3), implying that these genes might play important roles in tree growth and wood properties. Besides, unique InDels and genes both exhibited significant associations across growth, wood physical and chemical properties. For instance, Potri.006G251300 (a zinc finger family protein) held two significant InDels which separately associated with lignin, DBH and V, suggesting an evidence for potential pleiotropy of allelic loci/genes in tree growth and wood formation, as well as clues for discerning overall genetic effects underlying multi-gene interaction tests.
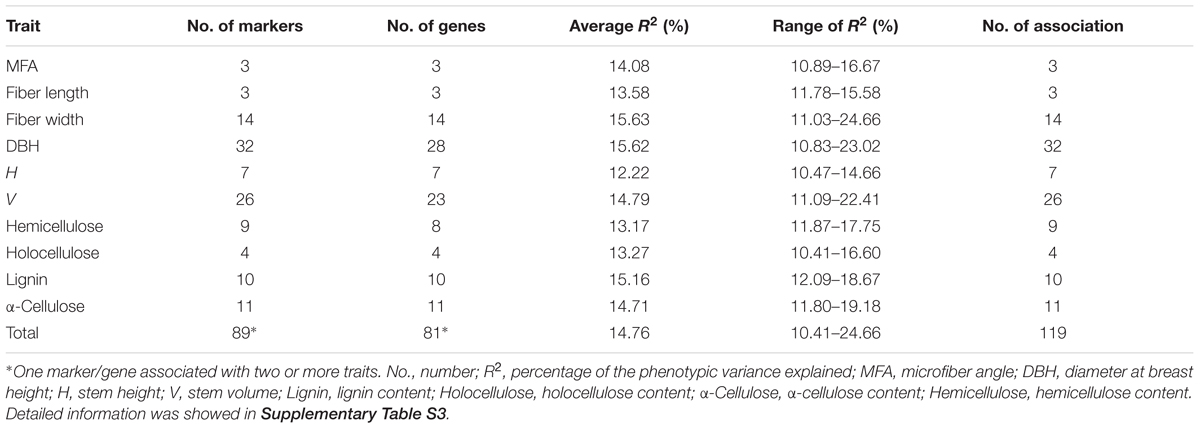
TABLE 1. Summary of the significant InDel marker associations tested in the P. tomentosa natural population with the positive false discovery rate (FDR) q < 0.10.
We further calculated the detailed additive and/or dominant effects for 119 significant associations above (Table 2), and 108 associations demonstrated notable additive or dominant effects across 10 traits, representing 74 unique InDels from 68 genes (FDR q < 0.10). Of these, nine loci have a combination of additive and dominant effects for a certain trait. Remarkably, two InDels within Potri.008G112200_01 and Potri.008G161200_05 demonstrated opposite direction of dominant effects for different traits, that is, Potri.008G112200_01 associated with MFA for negative dominant effects while with FW for positive dominant effects. Potri.008G161200_05 associated with α-cellulose for positive dominant effects while with H for negative dominant effects, indicating a complicated and non-negligible combination effects underlying tree growth and wood biosynthesis, and further implying a combined selection of traits when performing tree breeding.
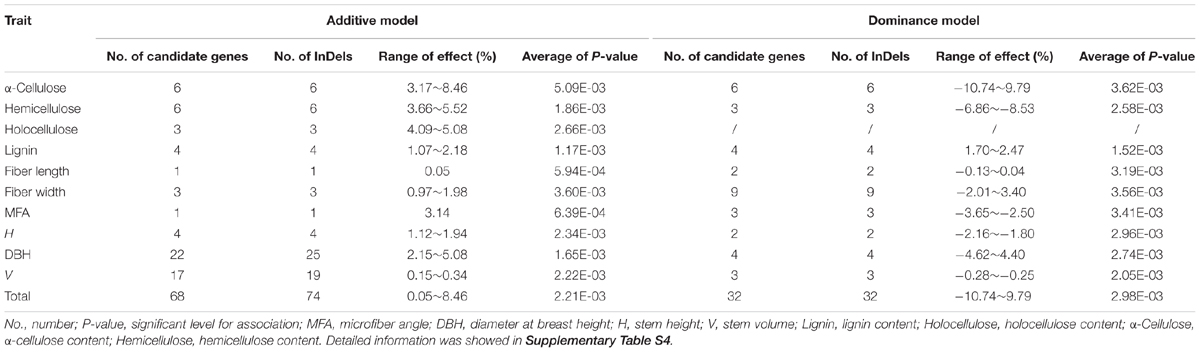
TABLE 2. Summary of the additive and dominance effects of all significant InDels for each trait in the P. tomentosa natural population at a threshold value of FDR q < 0.10.
Furthermore, analysis of the pattern of gene–trait–effect revealed four association groups: (1) when a gene only associated with one trait, the gene showed single effect. For instance, the gene Potri.003G058600 (coding a Populus hypothetical protein) only associated with MFA for dominant effect. However, as clues for potential pleiotropy, genes always appeared to have multi-trait associations, which resulted in following three complicated groups. (2) A gene represented the same effects for all associated traits. For example, Potri.014G106600 (similar to caffeic acid/5-hydroxyconiferaldehyde O-methyltransferase, COMT) showed all additive effects for DBH, α-cellulose, and V. (3) A gene showed separated additive or dominance effects for different traits. For example, Potri.013G154700 (similar to expansin S1 precursor, EXP) showed an additive effect for DBH but a dominant effect for FW. (4) A gene showed a combination of additive and dominant effects. For example, Potri.008G161200 (similar to aux/IAA protein, PtIAA14.1) showed only additive effect for V whereas a combination of additive and dominant effects for H and α-cellulose content (Supplementary Table S4). These findings implied that when genes function in separate metabolic pathway which generating different traits, they might perform diverse or even opposite effects, and then these pathways overlapped or shared common systemic signals finally resulting in complicated biological networks and variable phenotypes.
To validate the significant associated InDels, we quantified the relative abundance of mRNA products for the corresponding genes among the three genotypic classes of each significant InDel. In total, 74 tests (74 unique InDels, Table 2) representing 68 genes indicated that only seven genes showed significant differential expression among their genotypic classes at P < 0.01 (Supplementary Table S5). Most of the significant InDels were located in non-coding regions where InDels could be attributed to the differences noted in genotype-specific gene expression (Figures 3A–C and Supplementary Table S5). In addition, the significant InDels located in exon may also change the transcript levels of their target genes (Figures 3D,E).
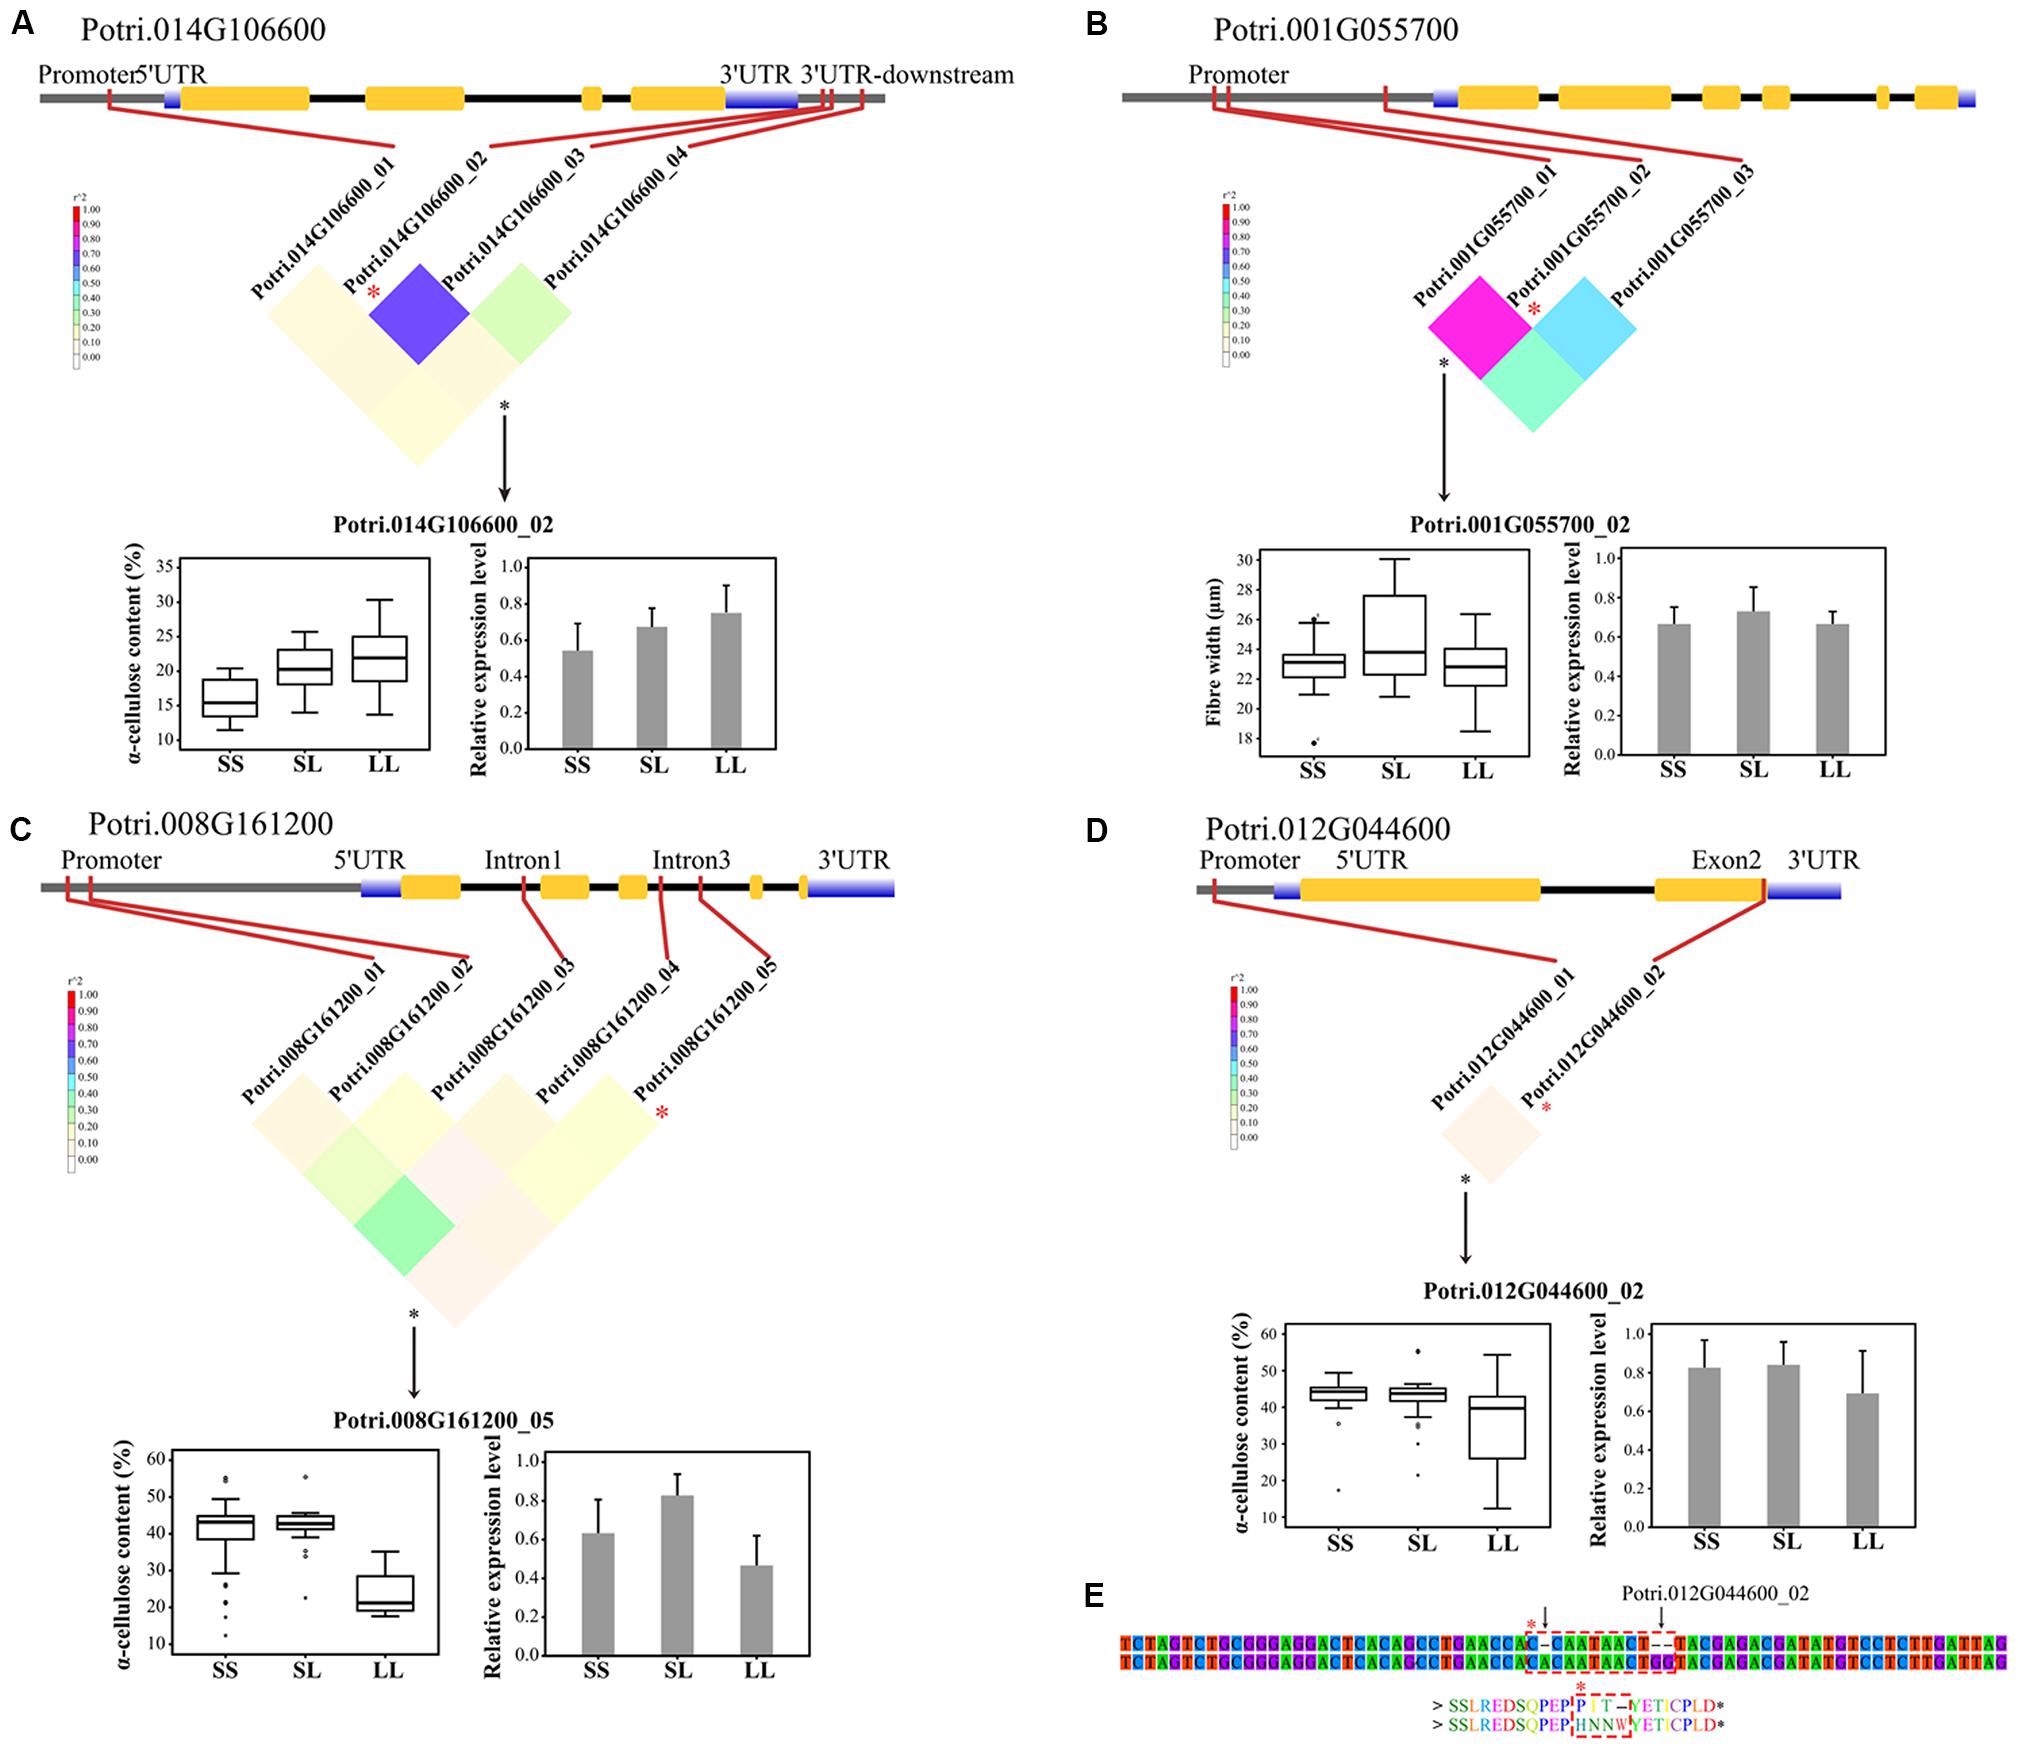
FIGURE 3. Dissection of the regulatory InDels with additive and/or dominant effects in the P. tomentosa natural population. (A) A causal InDel (Potri.014G106600_02, T > TATTA) within the 3′UTR-downstream of Potri.014G106600 (COMT) showed a significant association with α-cellulose under additive effect. (B) A causal InDels (Potri.001G055700_02, A > AACCT) within the promoter region of Potri.001G055700 (4CL) showed significant association with fiber width under dominant effect. (C) A causal InDel (Potri.008G161200_05, ATATATATAT > A) within the intron of Potri.008G161200 (similar to the indole-3-acetic acid protein, IAA) showed a significant association with α-cellulose contents under additive and dominant effects. (D) A causal InDel (Potri.016G090300_02, T > TGG) within exon 2 of Potri.012G044600 (a receptor-like kinase) showed a significant association with α-cellulose content under additive effect. (E) Potri.016G090300_02, together with another 1-bp insertion (C > CA), caused an ORF shift and an amino acid insertion (dashed box). SS, SL, and LL represent deletion/deletion, insertion/deletion, and insertion/insertion, respectively. The colored, inverted triangle represents the linkage disequilibrium (LD) levels (the color of each box corresponds to the legend). The genotypic effects on phenotypic traits (box plots) and the relative expression level (histograms) are shown.
Potential epistatic interactions of InDels within DE genes for growth and wood property traits were examined by epiSNP package using all InDels. In total, 1,004 significant InDel epistatic pairs (P < 1e-04, q < 0.10) were detected with four decomposed components of A × A, A × D, D × A, and D × D (Supplementary Figure S2), representing 517 InDels from 290 unique genes (Table 3 and Supplementary Data S9). The significant epistatic interacted InDels covered 69.6% of the tested InDels, in which only 58 (11.3%) displayed significant additive/dominant effect (Table 3), implying a possibility that epistatic interactions commonly occurred between mutations that without significant main effects.
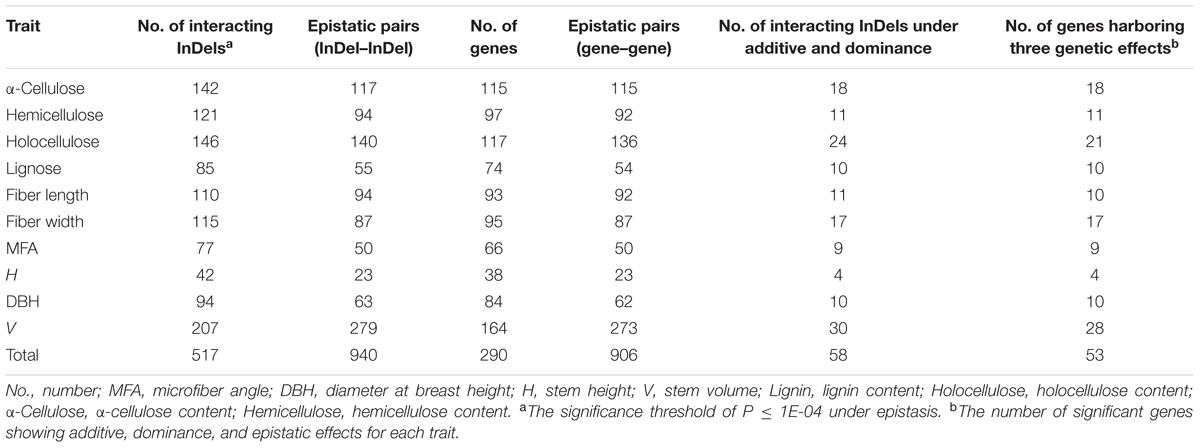
TABLE 3. Summary of the additive, dominant, and epistatic effects of all significant InDels for each trait in P. tomentosa natural population.
To further investigate how the epistatic interactions affecting different traits, we identified 122 epistatic InDel pairs which associated with at least two traits. For instance, in the model of calculating additive/dominant effect, Potri.013G082500_01 and Potri.014G022700_01 did not display any significant associations, whereas under the epistatic model, their combinations of different genotypes showed unexpected non-additive effects on hemicellulose and holocellulose contents with synergetic effect (Figures 4A,B). Another epistatic InDel pair, between Potri.016G017100_01 and Potri.018G084500_01 (without main effect), showed an antagonistic effect with lignin and hemicellulose contents (Figures 4C,D). This revealed a pattern that the same combinations of genotypes under epistatic effect could either enhance or reduce different traits at the same time, strongly suggested that epistasis gave a considerable and complicated influence on phenotypic variations even though without additive/dominant effect (main effect).
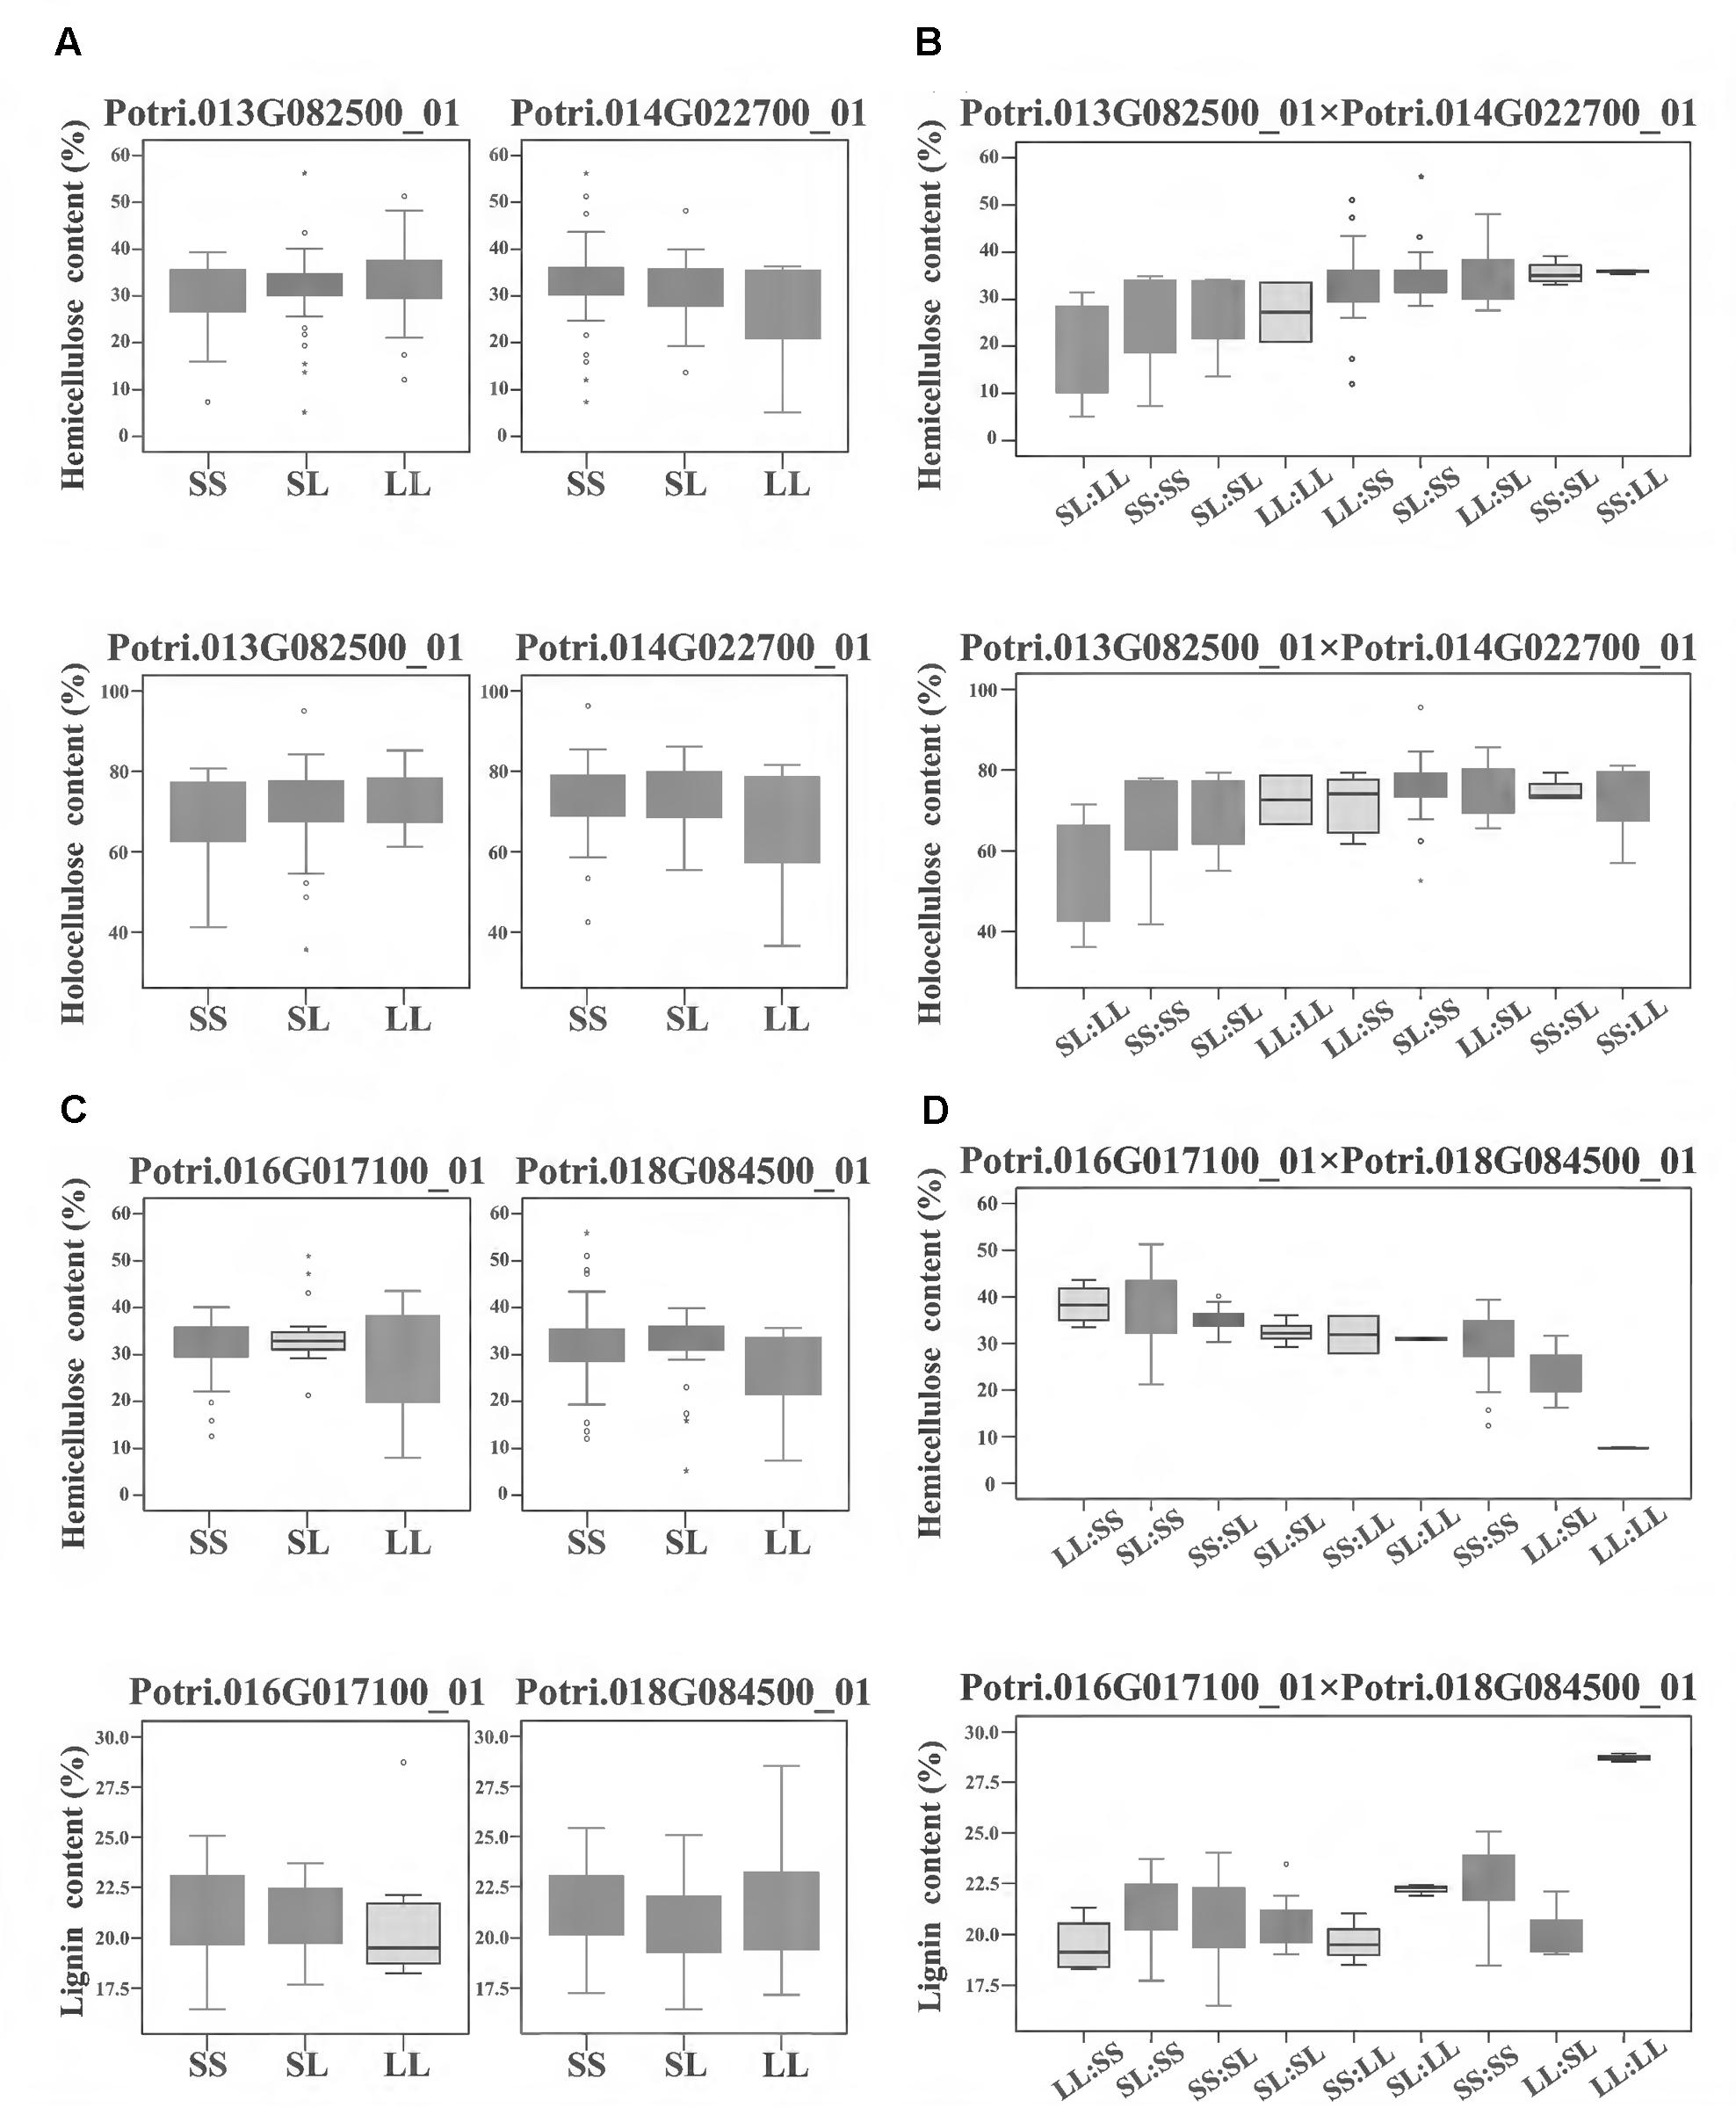
FIGURE 4. The epistatic interactions of InDel pairs in the P. tomentosa natural population. (A,B) The epistatic interaction between Potri.013G082500_01 and Potri.014G022700_01 showed a negative D × A effect for hemicellulose and holocellulose contents. For hemicellulose contents (upper line), in the absence of epistasis, genotypic effects for Potri.013G082500_01 and Potri.014G022700_01 were almost same. However, with epistasis, their genotypic combination effect (SS:LL) leaded to a considerable increase in hemicellulose contents (an average increase of 18%) and the combination of SL:LL leaded to approximately a 38% decrease in hemicellulose contents. For holocellulose contents (lower line), similar genotypic effects were found for the genotypic combination. (C,D) The epistatic interaction between Potri.016G017100_01 and Potri.018G084500_01 showed an opposite A × A effect on hemicellulose content (upper line) and lignin contents (lower line). In the absence of epistasis, the genotypic effects for Potri.016G017100_01 and Potri.018G084500_01 were almost same. However, with epistasis, the genotypic combination LL:LL led to the highest lignin content as well as the lowest hemicellulose content, and the genotypic effect for hemicellulose content dropped with the increase of lignin content. (A,C) Box plot indicates the additive/dominant effect for each InDel without epistatic effects. (B,D) Box plot indicates the epistatic effects between InDel pairs. D × A and A × A represent dominance × additive and additive × additive interaction. SS, SL, and LL represent deletion/deletion, insertion/deletion, and insertion/insertion, respectively.
For improving our understanding of the genetic architecture affecting complex phenotypic variation, the gene–gene interaction networks for each trait were drawn based on the epistatic InDel pairs between chromosomes (918 pairs) and within the chromosomes (86 pairs) (Figure 5A and Supplementary Figure S3). In total, 973 gene–gene interactions were detected and 127 of these interactions were associated with at least two traits (Supplementary Figure S3). Furthermore, we focused on 55 gene–gene epistatic interactions underlying lignin content to detect the potential epistatic networks affecting lignin biosynthesis (Figure 5B). Among these interactions, only 12 genes were mapped to monolignol biosynthesis pathway (Shi et al., 2010), while majority of the remaining genes were belonged to other biologic pathways, including cellulose synthesis and hormone metabolism (Figure 5C). Specifically, two interactions between four lignin-related genes, PtoCCoAOMT6 with Pto4CL7 (4-coumarate:CoA ligase), and PtoCCoAOMT4 with Pto4CL9, were observed having opposite epistatic effects, both of which showed A × A epistatic effects consistent with the proposed monolignol biosynthesis pathway (Figure 5D and Supplementary Table S6). When ignoring the epistatic effect, the phenotypic effects of lignin content for the different genotypes at these four genes were almost the same (no main effect). However, in the presence of epistasis, the lignin content at three genotypic classes of PtoCCoAOMT6 was decreased at Pto4CL7 by LL and increased at Pto4CL7 by SS, which contributed to their negative epistatic effects (Supplementary Table S6). Similarly, with positive epistatic effects, the lignin content at three genotypic classes of PtoCCoAOMT4 was sharply enhanced at Pto4CL9 by LL and SS, but this increasing trend was suppressed by the genotype combination of LL at PtoCCoAOMT4 and SS at Pto4CL9.
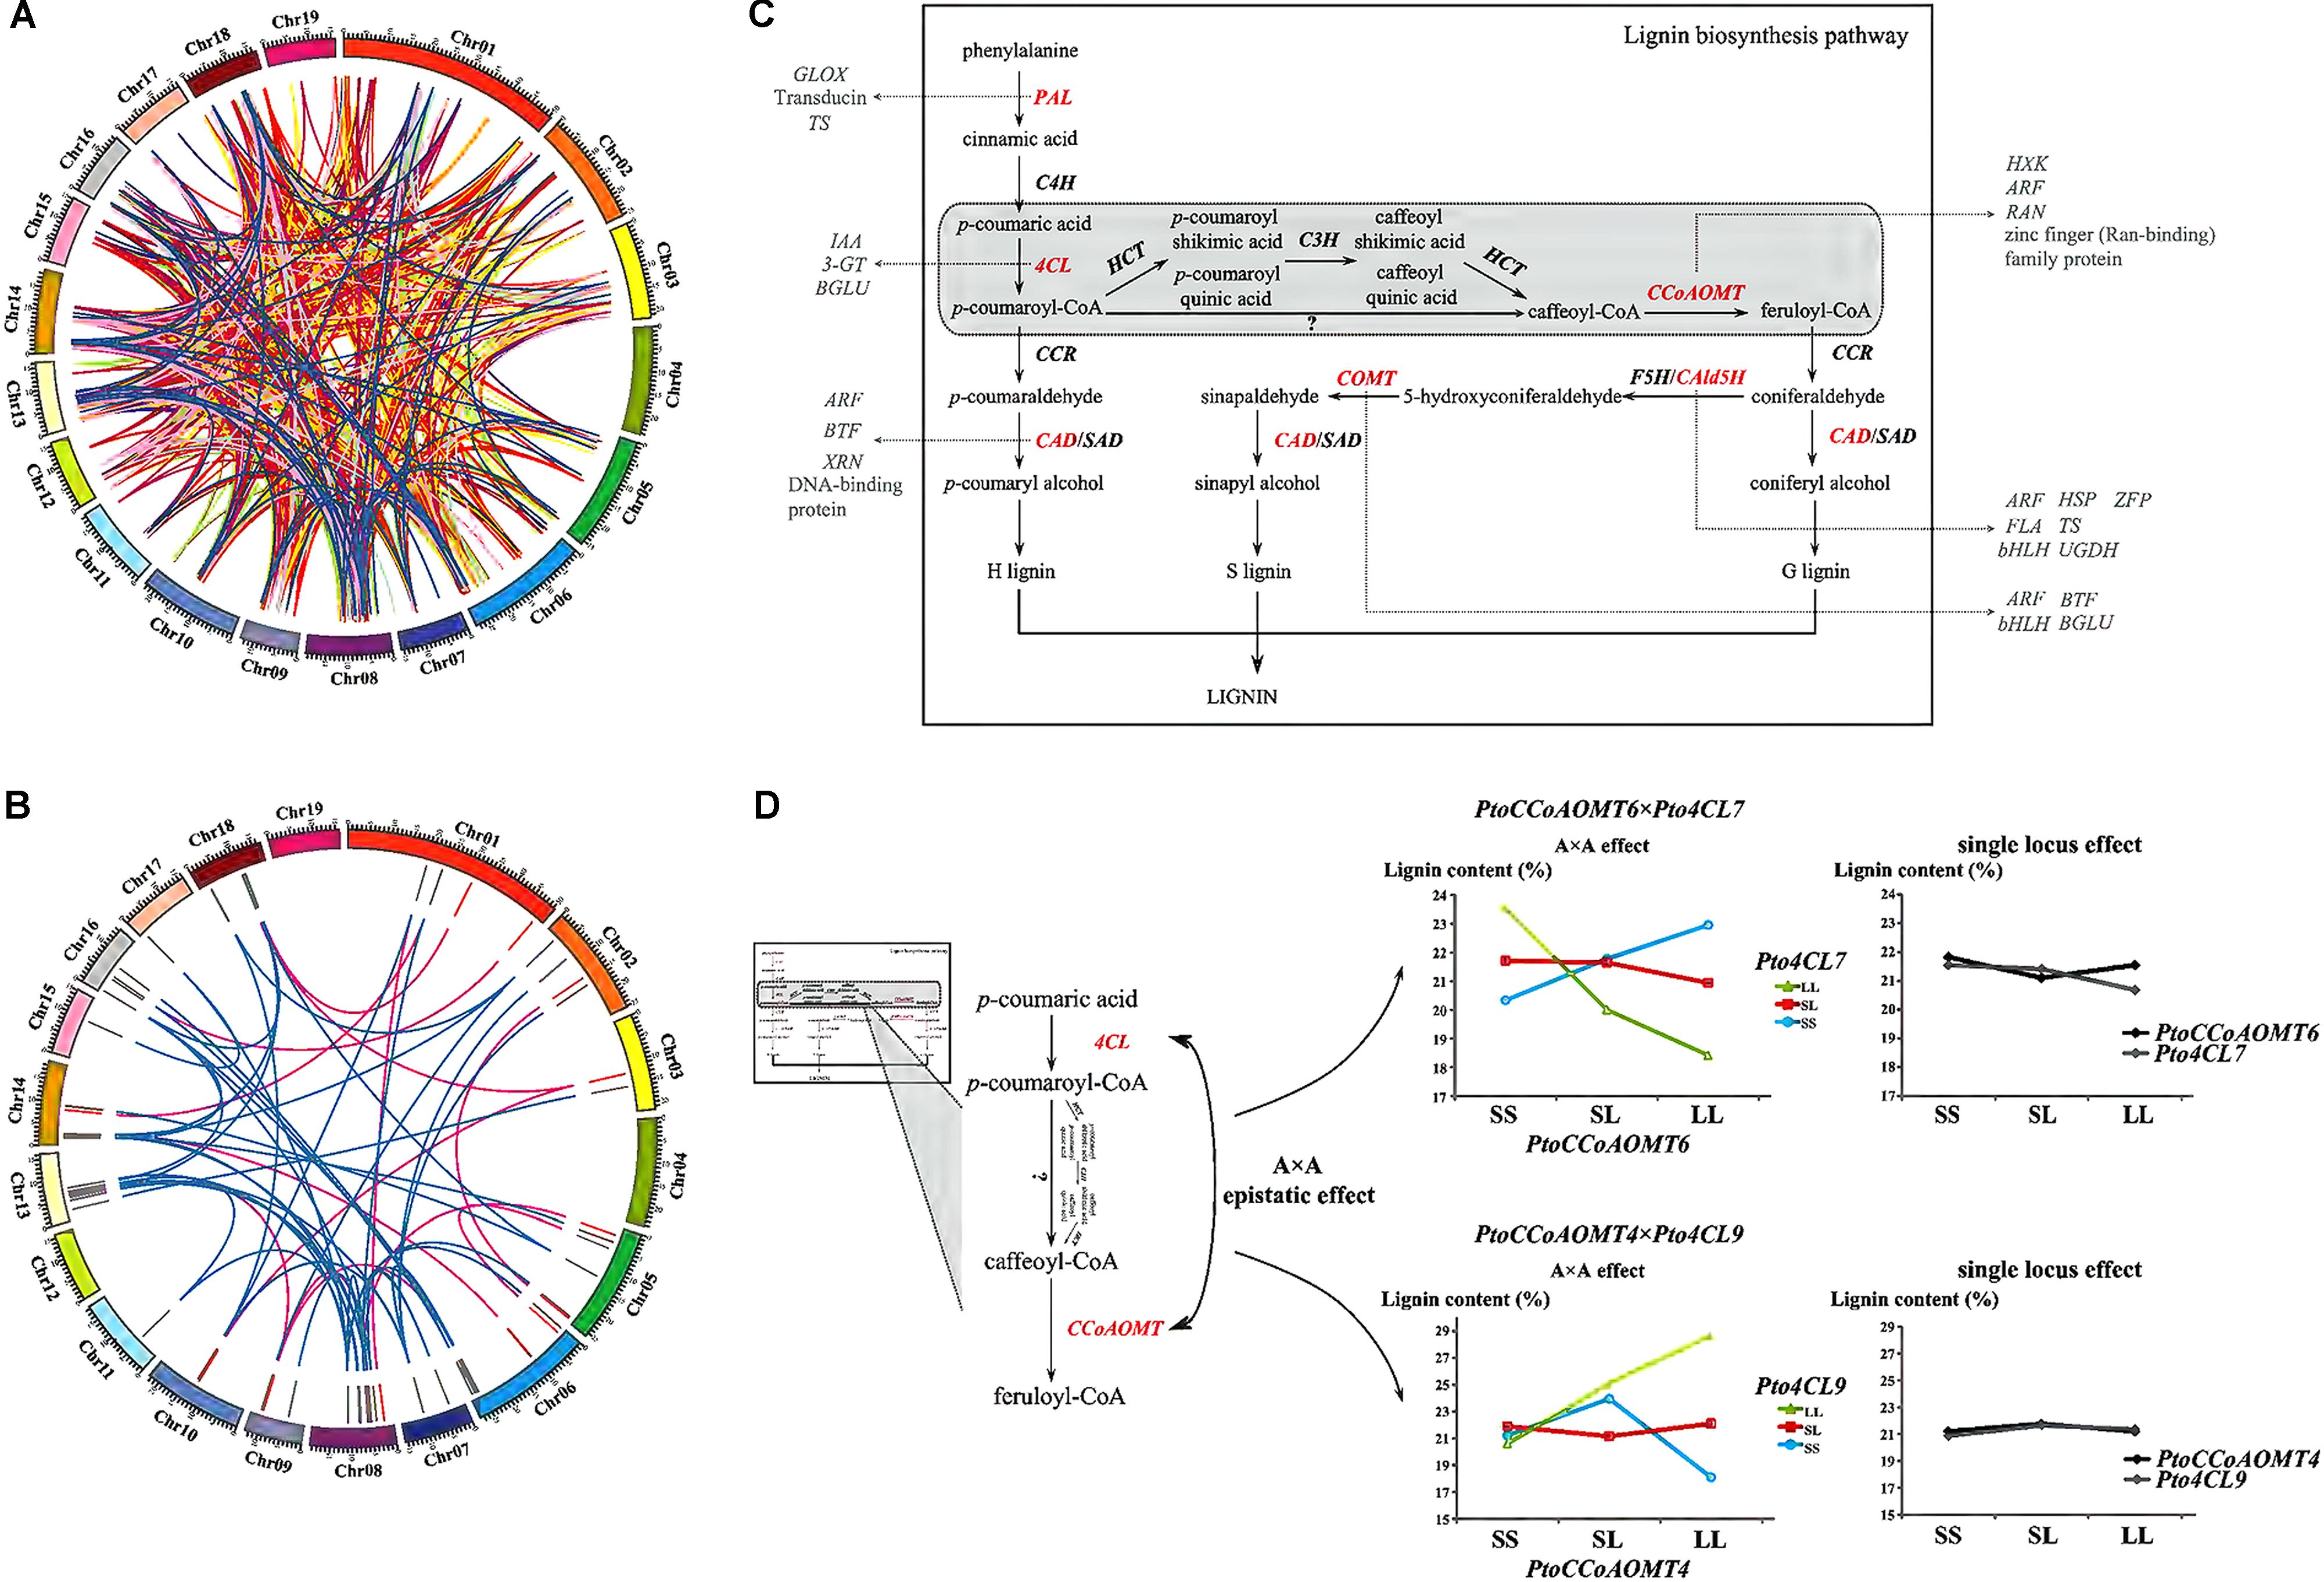
FIGURE 5. Dissection of the gene–gene epistatic interaction networks for 10 growth and wood-property traits. (A) Circular diagram depicting 973 gene–gene interaction networks for 10 growth and wood-property traits. The different colored links represent different traits. Detailed information for each trait was showed in Supplementary Figure S3. (B) Circular diagram depicting the 55 epistatic gene–gene interaction networks underlying lignin contents. The outer track showed the P. Tomentosa chromosomes (Chr01 through Chr19 on an Mb scale). The middle track showed the epistatic genes involved in the monolignol biosynthesis pathway (red) or in other pathways (gray). The inner links showed the epistatic interactions between genes where at least one gene belonged to the monolignol biosynthesis pathway (pink), or neither belonged (blue). (C) Proposed pathway of lignin biosynthesis. The genes that had epistatic effects involved in the lignin biosynthesis pathway (red), and the putative genes and epistatic interactions that contributed to the proposed monolignol biosynthesis pathway revealed in our study (gray) were shown. (D) Dissection of two epistatic gene–gene interactions underlying the monolignol biosynthesis pathway with A × A epistatic effects. PAL, phenylalanine ammonia-lyase; C4H, cinnamate-4-hydroxylase; 4CL, 4-coumarate:CoA ligase; CCR, cinnamoyl-CoA reductase; CAD, cinnamyl alcohol dehydrogenase; SAD, sinapyl alcohol dehydrogenase; HCT, p-hydroxycinnamoyl-CoA:quinateshikimate p-hydroxycinnamoyltransferase; C3H, 4-coumarate 3-hydroxylase; CCoAOMT, caffeoyl-CoA O-methyltransferase; CAld5H/F5H, coniferyl aldehyde 5-hydroxylase; COMT, caffeic acid/5-hydroxyconiferaldehyde O-methyltransferase; 3-GT, anthocyanidin 3-O-glucosyltransferase; ARF, auxin responsive factor; BGLU, beta glucosidase; BTF, basic transcription factor; FLA, FASCICLIN-like arabinogalactan protein precursor; GLOX, glyoxal oxidase; bHLH, basic helix-loop-helix transcription factor; HSP, heat shock protein; HXK, hexokinase; IAA, indole-3-acetic acid; RAN, RAN GTPase; TS, threonine synthase; UGDH, UDP-glucose dehydrogenase; XRN, exoribonuclease; ZFP, zinc finger protein.
InDels had been recognized as the second most abundant form of genetic variation in humans (Mullaney et al., 2010) and widely distributed among several annual species (Kuittinen et al., 2008; Rao et al., 2011; Yang et al., 2014). Here, combining transcriptome sequencing with population resequencing programs, we identified a set of DE genes involved in wood formation with 5,841 InDel polymorphisms had a genome-wide representation through P. tomentosa, a perennial woody species (Figure 1A). Approximately 95.9% of these InDels were diallelic InDels and their length and distribution showed a similar pattern to that of the total InDels (Figure 2C), indicating their dominant position at the gene level. Complex InDels were generally excluded in many earlier studies because of limited statistical and methodological methods. While combining GATK v3 with PCR and capillary electrophoresis (Supplementary Data S1), we found 222 (3.8%) complex InDels from 175 genes which generated 731 alleles (Figure 2C), 37% of these were caused by containing SNPs in different alleles. It has been assumed that complex InDels provide a large proportion of the inherited susceptibility to inflammatory bowel disease (McGovern et al., 2005), suggesting that such complex InDels might influence biological traits and deserve more comprehensive investigation. Interestingly, we also observed co-separation of InDels with nearby SNPs. Recently, InDels and SNPs within the same haplotype block were identified in carrot which resulted into high carotenoid accumulation in carrot (Iorizzo et al., 2016), as well as InDel and SNP variants had similar LD profiles (Lu et al., 2012), thus implying inclusion of InDels with other gene-derived genetic markers to reveal a more detailed picture of the sequence variation for genomics-assisted breeding applications in woody plants.
The influence of gene function due to InDels was expected to be greater than that of substitutions as they gave rise to a more severe alteration in the sequence. As consequence, the InDels identified in this study were mapped to both coding and non-coding regions, showing significantly lower frequency and dominating in-frame InDels in coding regions (Figure 2A and Supplementary Data S5). This result is similar to findings in recent studies on the distribution of genic-SNPs and SSRs in Populus, although the density of InDels was lower than the other two genic markers (Du et al., 2015). It also suggests stronger purifying selection within the coding regions and that exon-derived InDels may have more deleterious effects as they can disrupt protein structure as well as influence transcriptional or post-transcriptional regulation (Figures 2B, 3D,E; Iorizzo et al., 2016). Here, 4.3% of the InDels were found in coding regions (Figure 2A), which may contribute to alterations of gene function. Moreover, InDels (21.9%) located in promoter may envisioned to explain the differences in gene expression and have large effects on phenotypic variation in Populus (Figures 3A–C and Supplementary Table S5).
The decay of LD for InDels within genes was similar to our recent findings based on SNPs within 11 candidate genes involved in cellulose biosynthesis (Du et al., 2015), highlighting the promising utility of small InDels in LD-based association mapping (Supplementary Figure S1). However, the extent of LD varied extensively across genes, which might reflect alterable natural selection strength on different parts of genome. Collectively, our findings suggest that InDels could be a valuable complement to sequence variances such as SNPs for improving the marker density and resolutions in genome-wide association mapping studies (Lu et al., 2012).
Our study provides an in-depth genetic dissection of gene-derived InDels in a natural Populus population under additive, dominance and epistasis models. Most importantly, this study, being the first InDel-based association mapping study on a long-lived perennial species, sheds light on detecting more causal genes/variations underlying quantitative traits. Interestingly, the majority of the InDels detected by the single-InDel association model had a higher effect size (average of 14.7%, Table 1) than that of c. 5.0% explained by the single-SNP association model in poplar species (McKown et al., 2014; Du et al., 2015). Even though such large phenotypic variance probably results from some other potentially linked markers, due to the alteration in the sequence, InDels are likely to have the major impact on phenotypic variance, which highlights an important role in the dissection of quantitative traits and molecular breeding.
Here, we detected an InDels located in exon region that led to ORF shifts and exhibited significant associations with wood properties (Figures 3D,E). In detail, Potri.012G044600_02, a 2-bp insertion (T > TGG) located within exon 2 of Potri.012G044600 (similar to receptor-like kinase) was significantly associated with α-cellulose content. Further analysis revealed another 1-bp insertion (C > CA) which was just eight bp upstream of Potri.012G044600_02. These two sites simultaneously showed an ORF shift and an amino acid (AA) insertion [Pro(P)-Ile(I)-Thr(T) > His(H)-Asn(N)-Asn(N)-Trp(W); Figures 3D,E], suggesting that the locus might be in close proximity to the causal polymorphisms or even the functional variant itself. Analysis of protein structure revealed that this ORF shift (PIT > HNNW) was 16 AAs downstream of the serine/threonine/tyrosine protein kinase (STYKc) domain, suggesting a possible effect on the protein kinase domain for genetic regulation of α-cellulose content. This conjecture was also supported by the significant differences in expression among the three genotypic classes of Potri.012G044600_02 (Figure 3D). Therefore, these results suggest that InDels, especially the exon-InDels, could potentially affect gene function and finally result in phenotypic variation.
Lignin is polymerized mainly from coniferyl (G) and sinapyl (S) as well as low level of p-coumaryl (H) in Populus, which synthesized by phenylpropanoid pathway with key enzymes like PAL, 4CL, cinnamyl alcohol dehydrogenase (CAD), and CCoAOMT (Shi et al., 2010). The biosynthesis pathway also regulated by some well-known transcription factors belonging to NAC, MYB, and WRKY gene families (Vanholme et al., 2010). Here, two non-coding InDels, Potri.009G095800_01 and Potri.013G067500_05 were found to significantly associate with lignin content under additive/dominant effects (Supplementary Tables S4, S5). Potri.009G095800 was belonging to CAD family that catalyze the last step of reducing hydroxyl cinnamyl aldehydes to their corresponding monolignols (Shi et al., 2010). Previous studies reported that deficiency of CAD led to abnormal lignin structural changes (Ralph et al., 1997). Supportively, the significant differences in expression of PtCAD4.1 were found among the three genotypic classes (Supplementary Table S5), suggesting that InDels might have a regulatory effect or are in very strong LD with a nearby regulatory polymorphism (Thumma et al., 2009). Moreover, Potri.013G067500 was similar to MYB transcription factor that had been demonstrated diverse functions in lignin biosynthesis pathway. Collectively, our findings show that significant InDels/genes associating with specific traits were validated by direct biochemical pathway of genes, and also suggested that InDels could change traits from altering the expression of gene in certainly biological pathways (Shi et al., 2010).
Biosynthesis of cell wall components is coordinated with other biological processes during plant vascular development and these genes are possibly involved or indirectly participate in the shared pathways (Eckert et al., 2012). For instance, two loci (Potri.007G076500_03 and Potri.007G076500_04) close to the 3′UTR of CesA (Potri.007G076500) were associated with hemicellulose content. The encoded protein is predominantly essential for building a cellulose-hemicellulose network, which creates strong but flexible plant cell walls (Cosgrove, 2005). Previous research also showed the significant haplotypes within CesA were also associated with hemicellulose (Du et al., 2015), suggesting that some cellulose synthase genes might be involved into hemicellulose biosynthesis. Contrasting with the known genes or biochemical links in biological pathways, our study also identified significant genes/variants of unknown function (Supplementary Table S4), suggesting that genetic associations could not only uncover candidate genes involved in shared pathways, but also reveal genes which have not yet been placed within known biological pathways. These findings provide valuable clues for understanding the biology inside the “black box” that lies between genotype and phenotype in terms of causal networks of interacting genes.
Genetic association studies often had an interesting observation that a genetic locus/gene is associated with multiple, sometimes seemingly distinct traits, consisting with our results (Supplementary Tables S3, S4). Such associations highlight the potential that traits share the common genetic pathways and underscore the relevance of pleiotropy (Solovieff et al., 2013). However, trait correlations can also result in such associations while no causal relation exists (Platt et al., 2010). When measuring the target traits at the population level, the resulting phenotypes would inevitably be correlated because of that traits had to be hierarchical refined into multifactorial components. In our previous report, correlation matrices of all 10 traits were estimated (Du et al., 2014), implying that the correlated traits used here tended to be biologically related and shared the genetic bases (Porth et al., 2013). Recently, a multi-trait mixed model considering correlated phenotypes in structured populations has been reported (Korte et al., 2012), provided insight into distinguishing the pleiotropy loci from statistical associations. However, this model just focused on relatively simple pairwise correlations between two traits, challenges were still exist for larger multi-traits experiments.
In quantitative genetics, epistasis is defined as the statistical interaction between genotypes at two or more loci and also refers to a modification of the additive or dominant effects of the interacting loci. Therefore, phenotypic variations cannot be predicted simply by summing the effects of individual loci (Mackay, 2014). Epistasis is an important component of the genetic basis of complex traits, though often ignored because estimation of epistatic interactions has been challenging due to small population sizes, limited statistical methods, and the high computational demands. In this study, we detected large numbers of significant InDel–InDel epistatic pairs associated with tree growth and wood properties, covering c. 70% of all investigated InDels (Figure 5A and Table 3). This result revealed a pervasive epistatic effect among allelic mutations in a natural population of Populus, which was consistent with observations in Drosophila, mice, Arabidopsis, yeast, and humans (Flint and Mackay, 2009; Huang et al., 2012), and provides essential information for a deeper understanding of the mechanisms of gene interactions in this perennial species.
Here, we observed that only a small part of the InDels (11.3%) within the epistatic interactions showed significant additive and/or dominant effects, and epistasis showed variable effects on different phenotypes even with the same combinations of genotypes (Figure 4 and Table 3). This observation further supports the idea that epistasis plays a key role in genetic architecture and has a considerable influence on phenotypic variations when constricting to main effect (Mackay, 2014). In addition, some investigations have shown that epistasis could be responsible for the missing heritability and the lack of replication in association genetics (Manolio et al., 2009). Epistatic interactions in populations depend on allele frequencies, and therefore, the replication of estimating loci with epistatic effects would be different among diverse populations, but the underlying epistatic architecture in different populations seems to be the same (Huang et al., 2012). Consequently, our detection of epistasis could contribute to the quantitative variation, which was hidden or not apparent in the identification of the main effects and could potentially improve genetic predictions in modern plant breeding programs.
Two pairwise InDel interactions detected for lignin content illustrated the ability of epistasis for dissecting underlying genetic networks (Supplementary Table S6 and Figure 5D). Supporting this, two interactions were both occurred between CCoAOMT and 4CL, which matched the step of proposed monolignol biosynthesis pathway (Shi et al., 2010). These results demonstrated that epistasis could not only change the direction of phenotypic effects, but also alter its magnitude (Mackay, 2014), in which the phenotypic effect of one locus was either enhanced (negative effect for PtoCCoAOMT6 and Pto4CL7) or suppressed (positive effect for PtoCCoAOMT4 and Pto4CL9) by the other locus (Figure 5D). It was also supported by our transcriptome data that enhanced pairwise showed consistent expression in xylem tissue, whereas suppressed pairwise exhibited opposite case (Supplementary Figure S4). In addition, epistatic interaction between genes where the biological evidence for how they interacted had not yet been found were identified (Figures 4A, 5B,C). This further illuminated that the genetic architecture of each quantitative trait was controlled by the interactions of multiple genes that belong to diverse biological pathways, suggesting that the power of epistasis could be as important as additive/dominant effects. However, we only detected the pairwise interactions, three- or even higher-order interactions between loci have not yet been explored, as estimating the exponential number of possible interactions at these levels remains a challenge.
In conclusion, we showed the first investigation of the InDel variants underlying the complexities of quantitative traits in a long-lived perennial species, which enables closer examination of the number and effect magnitudes of functionally relevant trait-regulatory genes/alleles responsible for complex quantitative traits in plants. We also showed valuable utility of InDels that may have roles in the dissection of quantitative traits and molecular breeding. Epistatic interactions of InDels suggested a powerful role in potentially improving genetic predictions in modern plant breeding programs. Finally, our findings will enable an effective marker system for molecular marker-assisted breeding applications, and further facilitate our understanding of quantitative genomics.
The accession numbers of all genes in the GenBank Data Library: KU573093 to KU573771; All data corresponding to genes, InDels and genotypes used in this study were provided as Supplementary Data.
DZ planned and designed the research. CG, QD, JX,-48pc MQ, and BC performed the experiments. CG, QD, and DZ analyzed the data. CG wrote the paper. All authors read and approved the manuscript.
The authors declare that the research was conducted in the absence of any commercial or financial relationships that could be construed as a potential conflict of interest.
This work was supported by the project of the National Natural Science Foundation of China (Nos. 31170622 and 31500550).
The Supplementary Material for this article can be found online at: https://www.frontiersin.org/articles/10.3389/fpls.2017.02199/full#supplementary-material
FIGURE S1 | Linkage disequilibrium (LD) in the P. tomentosa natural population.
FIGURE S2 | Representatives of the four components of epistatic effects.
FIGURE S3 | Detailed information of the gene–gene interaction networks for 10 growth and wood property traits.
FIGURE S4 | Heatmap of the transcriptome data for four epistatically interacting genes involved in the proposed monolignol biosynthesis pathway.
TABLE S1 | The RT-qPCR primers used in this study.
TABLE S2 | Summary of the 5,482 InDels identified within 629 genes or gene fragments after filtering pipeline.
TABLE S3 | Detailed information on significant InDel marker associations tested in the P. tomentosa natural population using the single-InDel model with a positive false discovery rate (FDR) q < 0.10.
TABLE S4 | Detailed information on the additive and dominance effects of all significant InDels for each trait in the P. tomentosa natural population at a threshold value of FDR q < 0.10.
TABLE S5 | Summary of seven significant differentially expressed genes among three genotypic classes at P < 0.01.
TABLE S6 | Two epistatic gene–gene interactions underlying the monolignol biosynthesis pathway with A × A epistatic effects between four lignin-related genes.
DATA S1 | Validation of InDels by PCR amplification and capillary electrophoresis.
DATA S2 | Summary of 697 differentially expressed genes with an FDR q < 0.10 and P < 1.0e-03.
DATA S3 | Seventy-seven significant gene ontology (GO) terms of 679 genes or gene fragments identified from the P. tomentosa genomic resequencing data with an FDR-adjusted value of ≤0.05.
DATA S4 | Detailed information on the 5,482 high-quality InDels identified from the 629 genes or gene fragments with a quality score (Q) >20.
DATA S5 | Frequency distribution of InDels sizes within coding regions.
DATA S6 | Pathway enrichment analysis of unique alleles among three climatic regions.
DATA S7 | The genotypic data for 742 common InDels (minor allele frequency ≥0.05) used in the association analysis of the P. tomentosa natural population.
DATA S8 | Detailed InDel heterozygosity calculated by Nei’s expected heterozygosity.
DATA S9 | Detailed information on the significant pairwise epistatic effects among the InDels for each trait in the P. tomentosa natural population with P < 1e-04.
Barrett, J. C., Fry, B., Maller, J., and Daly, M. J. (2005). Haploview: analysis and visualization of LD and haplotype maps. Bioinformatics 21, 263–265. doi: 10.1093/bioinformatics/bth457
Chen, J., Chen, B., and Zhang, D. (2015). Transcript profiling of Populus tomentosa genes in normal, tension, and opposite wood by RNA-seq. BMC Genomics 16:164. doi: 10.1186/s12864-015-1390-y
Chow, C. N., Zheng, H. Q., Wu, N. Y., Chien, C. H., Huang, H. D., Lee, T. Y., et al. (2015). PlantPAN2.0: an update of plant promoter analysis navigator for reconstructing transcriptional regulatory networks in plants. Nucleic Acids Res. 44, D1154–D1160. doi: 10.1093/nar/gkv1035
Cosgrove, D. J. (2005). Growth of the plant cell wall. Nat. Rev. Mol. Cell Biol. 6, 850–861. doi: 10.1038/nrm1746
Danecek, P., Auton, A., Abecasis, G., Albers, C. A., Banks, E., DePristo, M. A., et al. (2011). The variant call format and VCFtools. Bioinformatics 27, 2156–2158. doi: 10.1093/bioinformatics/btr330
Du, Q., Tian, J., Yang, X., Pan, W., Xu, B., Li, B., et al. (2015). Identification of additive, dominant, and epistatic variation conferred by key genes in cellulose biosynthesis pathway in Populus tomentosa. DNA Res. 22, 53–67. doi: 10.1093/dnares/dsu040
Du, Q., Wang, B., Wei, Z., Zhang, D., and Li, B. (2012). Genetic diversity and population structure of Chinese white poplar (Populus tomentosa) revealed by SSR markers. J. Hered. 103, 853–862. doi: 10.1093/jhered/ess061
Du, Q., Xu, B., Gong, C., Yang, X., Pan, W., Tian, J., et al. (2014). Variation in growth, leaf, and wood property traits of Chinese white poplar Populus tomentosa, a major industrial tree species in Northern China. Can. J. For. Res. 44, 326–339. doi: 10.1139/cjfr-2013-0416
Eckert, A. J., Wegrzyn, J. L., Cumbie, W. P., Goldfarb, B., Huber, D. A., Tolstikov, V., et al. (2012). Association genetics of the loblolly pine (Pinus taeda, Pinaceae) metabolome. New Phytol. 193, 890–902. doi: 10.1111/j.1469-8137.2011.03976.x
Evans, L. M., Slavov, G. T., Rodgers-Melnick, E., Martin, J., Ranjan, P., Muchero, W., et al. (2014). Population genomics of Populus trichocarpa identifies signatures of selection and adaptive trait associations. Nat. Genet. 46, 1089–1096. doi: 10.1038/ng.3075
Flint, J., and Mackay, T. F. C. (2009). Genetic architecture of quantitative traits in mice, flies, and humans. Genome Res. 19, 723–733. doi: 10.1101/gr.086660.108
Groover, A. T. (2005). What genes make a tree a tree? Trends Plant Sci. 10, 210–214. doi: 10.1016/j.tplants.2005.03.001
Huang, W., Richards, S., Carbone, M. A., Zhu, D., Anholt, R. R., Ayroles, J. F., et al. (2012). Epistasis dominates the genetic architecture of Drosophila quantitative traits. Proc. Natl. Acad. Sci. U.S.A. 109, 15553–15559. doi: 10.1073/pnas.1213423109
Iorizzo, M., Ellison, S., Senalik, D., Zeng, P., Satapoomin, P., Huang, J., et al. (2016). A high-quality carrot genome assembly provides new insights into carotenoid accumulation and asterid genome evolution. Nat. Genet. 48, 657–666. doi: 10.1038/ng.3565
Kim, D., Pertea, G., Trapnell, C., Pimentel, H., Kelley, R., and Salzberg, S. L. (2013). TopHat2: accurate alignment of transcriptomes in the presence of insertions, deletions and gene fusions. Genome Biol. 14:R36. doi: 10.1186/gb-2013-14-4-r36
Korte, A., Vilhjálmsson, B. J., Segura, V., Platt, A., Long, Q., and Nordborg, M. (2012). A mixed-model approach for genome-wide association studies of correlated traits in structured populations. Nat. Genet. 44, 1066–1071. doi: 10.1038/ng.2376
Kuittinen, H., Niittyvuopio, A., Rinne, P., and Savolainen, O. (2008). Natural variation in Arabidopsis lyrata vernalization requirement conferred by a FRIGIDA indel polymorphism. Mol. Biol. Evol. 25, 319–329. doi: 10.1093/molbev/msm257
Li, R., Li, Y., Kristiansen, K., and Wang, J. (2008). SOAP: short oligonucleotide alignment program. Bioinformatics 24, 713–714. doi: 10.1093/bioinformatics/btn025
Lin, T., Zhu, G., Zhang, J., Xu, X., Yu, Q., Zheng, Z., et al. (2014). Genomic analyses provide insights into the history of tomato breeding. Nat. Genet. 46, 1220–1226. doi: 10.1038/ng.3117
Lu, J. T., Wang, Y., Gibbs, R. A., and Yu, F. (2012). Characterizing linkage disequilibrium and evaluating imputation power of human genomic insertion-deletion polymorphisms. Genome Biol. 13:R15. doi: 10.1186/gb-2012-13-2-r15
Ma, L., Runesha, H. B., Dvorkin, D., Garbe, J. R., and Da, Y. (2008). Parallel and serial computing tools for testing single-locus and epistatic SNP effects of quantitative traits in genome-wide association studies. BMC Bioinformatics 9:315. doi: 10.1186/1471-2105-9-315
Mackay, T. F. (2014). Epistasis and quantitative traits: using model organisms to study gene-gene interactions. Nat. Rev. Genet. 15, 22–33. doi: 10.1038/nrg3627
Mackay, T. F., Stone, E. A., and Ayroles, J. F. (2009). The genetics of quantitative traits: challenges and prospects. Nat. Rev. Genet. 10, 565–577. doi: 10.1038/nrg2612
Manolio, T. A., Collins, F. S., Cox, N. J., Goldstein, D. B., Hindorff, L. A., Hunter, D. J., et al. (2009). Finding the missing heritability of complex diseases. Nature 461, 747–753. doi: 10.1038/nature08494
McGovern, D. P., Hysi, P., Ahmad, T., van Heel, D. A., Moffatt, M. F., Carey, A., et al. (2005). Association between a complex insertion/deletion polymorphism in NOD1 (CARD4) and susceptibility to inflammatory bowel disease. Hum. Mol. Genet. 14, 1245–1250. doi: 10.1093/hmg/ddi135
McKenna, A., Hanna, M., Banks, E., Sivachenko, A., Cibulskis, K., Kernytsky, A., et al. (2010). The Genome analysis toolkit: a mapreduce framework for analyzing next-generation DNA sequencing data. Genome Res. 20, 1297–1303. doi: 10.1101/gr.107524.110
McKown, A. D., Klápštì, J., Guy, R. D., Geraldes, A., Porth, I., Hannemann, J., et al. (2014). Genome-wide association implicates numerous genes underlying ecological trait variation in natural populations of Populus trichocarpa. New Phytol. 203, 535–553. doi: 10.1111/nph.12815
Mullaney, J. M., Mills, R. E., Pittard, W. S., and Devine, S. E. (2010). Small insertions and deletions (INDELs) in human genomes. Hum. Mol. Genet. 19, R131–R136. doi: 10.1093/hmg/ddq400
Nei, M. (1973). Analysis of gene diversity in subdivided populations. Proc. Natl. Acad. Sci. U.S.A. 70, 3321–3323. doi: 10.1073/pnas.70.12.3321
Platt, A., Vilhjálmsson, B. J., and Nordborg, M. (2010). Conditions under which genome-wide association studies will be positively misleading. Genetics 186, 1045–1052. doi: 10.1534/genetics.110.121665
Porth, I., Klápštì, J., Skyba, O., Lai, B. S., Geraldes, A., Muchero, W., et al. (2013). Populus trichocarpa cell wall chemistry and ultrastructure trait variation, genetic control and genetic correlations. New Phytol. 197, 777–790. doi: 10.1111/nph.12014
Ralph, J., MacKay, J. J., Hatfield, R. D., O’Malley, D. M., Whetten, R. W., and Sederoff, R. R. (1997). Abnormal lignin in a loblolly pine mutant. Science 277, 235–239. doi: 10.1126/science.277.5323.235
Rao, I. S., Srikanth, B., Kishore, V. H., Suresh, P. B., Chaitanya, U., Vemireddy, L. R., et al. (2011). Indel polymorphism in sugar translocation and transport genes associated with grain filling of rice (Oryza sativa L.). Mol. Breed. 28, 683–691. doi: 10.1007/s11032-011-9618-2
Shi, R., Sun, Y. H., Li, Q., Heber, S., Sederoff, R., and Chiang, V. L. (2010). Towards a systems approach for lignin biosynthesis in Populus trichocarpa: transcript abundance and specificity of the monolignol biosynthetic genes. Plant Cell Physiol. 51, 144–163. doi: 10.1093/pcp/pcp175
Solovieff, N., Cotsapas, C., Lee, P. H., Purcell, S. M., and Smoller, J. W. (2013). Pleiotropy in complex traits: challenges and strategies. Nat. Rev. Genet. 14, 483–495. doi: 10.1038/nrg3461
Storey, J. D., and Tibshirani, R. (2003). Statistical significance for genomewide studies. Proc. Natl. Acad. Sci. U.S.A. 100, 9440–9445. doi: 10.1073/pnas.1530509100
Sundell, D., Mannapperuma, C., Netotea, S., Delhomme, N., Lin, Y. C., Sjödin, A., et al. (2015). The plant genome integrative explorer resource: plantGenIE org. New Phytol. 208, 1149–1156. doi: 10.1111/nph.13557
Thumma, B. R., Matheson, B. A., Zhang, D., Meeske, C., Meder, R., Downes, G. M., et al. (2009). Identification of a Cis-acting regulatory polymorphism in a eucalypt COBRA-like gene affecting cellulose content. Genetics 183, 1153–1164. doi: 10.1534/genetics.109.106591
Trapnell, C., Williams, B. A., Pertea, G., Mortazavi, A., Kwan, G., Van Baren, M. J., et al. (2010). Transcript assembly and quantification by RNA-Seq reveals unannotated transcripts and isoform switching during cell differentiation. Nat. Biotechnol. 28, 511–515. doi: 10.1038/nbt.1621
Tuskan, G. A., Difazio, S., Jansson, S., Bohlmann, J., Grigoriev, I., Hellsten, U., et al. (2006). The genome of black cottonwood, Populus trichocarpa (Torr. & Gray). Science 313, 1596–1604. doi: 10.1126/science.1128691
Vanholme, R., Demedts, B., Morreel, K., Ralph, J., and Boerjan, W. (2010). Lignin biosynthesis and structure. Plant Physiol. 153, 895–905. doi: 10.1104/pp.110.155119
Yang, J., Wang, Y., Shen, H., and Yang, W. (2014). In silico identification and experimental validation of insertion–deletion polymorphisms in tomato genome. DNA Res. 21, 429–438. doi: 10.1093/dnares/dsu008
Keywords: association genetics, epistasis networks, high-throughput sequencing, InDel variants, wood formation
Citation: Gong C, Du Q, Xie J, Quan M, Chen B and Zhang D (2018) Dissection of Insertion–Deletion Variants within Differentially Expressed Genes Involved in Wood Formation in Populus. Front. Plant Sci. 8:2199. doi: 10.3389/fpls.2017.02199
Received: 18 September 2017; Accepted: 14 December 2017;
Published: 18 January 2018.
Edited by:
Junhua Peng, Center for Life Sci&Tech of China National Seed Group Co., Ltd., ChinaReviewed by:
Xusheng Wang, St. Jude Children’s Research Hospital, United StatesCopyright © 2018 Gong, Du, Xie, Quan, Chen and Zhang. This is an open-access article distributed under the terms of the Creative Commons Attribution License (CC BY). The use, distribution or reproduction in other forums is permitted, provided the original author(s) or licensor are credited and that the original publication in this journal is cited, in accordance with accepted academic practice. No use, distribution or reproduction is permitted which does not comply with these terms.
*Correspondence: Deqiang Zhang, ZGVxaWFuZ3poYW5nQGJqZnUuZWR1LmNu
†These authors have contributed equally to this work.
Disclaimer: All claims expressed in this article are solely those of the authors and do not necessarily represent those of their affiliated organizations, or those of the publisher, the editors and the reviewers. Any product that may be evaluated in this article or claim that may be made by its manufacturer is not guaranteed or endorsed by the publisher.
Research integrity at Frontiers
Learn more about the work of our research integrity team to safeguard the quality of each article we publish.