
94% of researchers rate our articles as excellent or good
Learn more about the work of our research integrity team to safeguard the quality of each article we publish.
Find out more
ORIGINAL RESEARCH article
Front. Plant Sci., 18 August 2017
Sec. Plant Breeding
Volume 8 - 2017 | https://doi.org/10.3389/fpls.2017.01412
 Weiping Shi1†
 Chenyang Hao2†
 Yong Zhang3†Jingye Cheng4†Zheng Zhang1Jian Liu3Xin Yi3Xiaoming Cheng3Daizhen Sun1Yanhao Xu5
 Xueyong Zhang2
 Shunhe Cheng3*Pingyi Guo1*
 Jie Guo1*
Kernel number per spike (KNPS) in wheat is a key factor that limits yield improvement. In this study, we genotyped a set of 264 cultivars, and a RIL population derived from the cross Yangmai 13/C615 using the 90 K wheat iSelect SNP array. We detected 62 significantly associated signals for KNPS at 47 single nucleotide polymorphism (SNP) loci through genome-wide association analysis of data obtained from multiple environments. These loci were on 19 chromosomes, and the phenotypic variation attributable to each one ranged from 1.53 to 39.52%. Twelve (25.53%) of the loci were also significantly associated with KNPS in the RIL population grown in multiple environments. For example, BS00022896_51-2ATT, BobWhite_c10539_201-2DAA, Excalibur_c73633_120-3BGG, and Kukri_c35508_426-7DTT were significantly associated with KNPS in all environments. Our findings demonstrate the effective integration of association mapping and linkage analysis for KNPS, and underpin KNPS as a target trait for marker-assisted selection and genetic fine mapping.
Yield improvement is an on-going endeavor in wheat breeding. Wheat yield is determined by spike number per unit area, kernel number per spike (KNPS) and thousand kernel weight. Increased yield mainly depends on increased KNPS when the other two parameters are unchanged (Slafer and Andrade, 1989; Fischer, 2008, 2011; Dobrovolskaya et al., 2015). Thus, molecular interpretation of the inheritance mechanism of KNPS is of significance for marker-assisted selection and molecularly designed wheat breeding.
The major methods for genetic dissection of complex traits in crop species include family-based linkage mapping and association mapping of germplasm collections (Mackay and Powell, 2007; Cadic et al., 2013). Association mapping has three advantages compared to conventional linkage mapping: (1) it saves time and cost of construction of suitable segregating populations, and by using existing populations there can be a wide diversity of materials; (2) it is able to detect multi-allelic variation, and thus helps to identify the most favorable alleles contributing to a target trait in a single analysis; and (3) its higher resolution is more powerful for fine mapping of quantitative trait loci (QTLs; Breseghello and Sorrells, 2006; Atwell et al., 2010). Research across many crops has shown that association analysis is a promising method for mining favorable alleles, despite some limitations. For example, association analysis is less efficient than linkage analysis for study of species with low genetic diversity (Zhao et al., 2007; Myles et al., 2009). However, association analysis and linkage mapping are complementary methods, and their combination can be used for cross-validation (Nordborg and Weigel, 2008). Thus, an integrated application of both methods is more efficient in discovering and validating QTLs in crop species (Zhang et al., 2011).
Since Paterson et al. (1988) first used restriction fragment length polymorphism (RFLP) to map QTLs for fruit mass, soluble solids concentration, and pH in tomatoes, more than 100 QTLs for KNPS distributed on all 21 chromosomes in wheat have been reported (Börner et al., 2002; Huang et al., 2004, 2006; Narasimhamoorthy et al., 2006; Kirigwi et al., 2007; Deng et al., 2011; Cui et al., 2012, 2014; Wu et al., 2012; Jia et al., 2013; Zhang et al., 2016). Börner et al. (2002) and Kirigwi et al. (2007) used recombinant inbred line (RIL) populations and both studies detected KNPS-related QTLs on chromosomes 4A and 7D. Advanced backcross populations were used in detecting KNPS-related QTLs in chromosomes 1D, 2A, 3B, 3D, 6A, 7A, and 7D (Huang et al., 2004; Narasimhamoorthy et al., 2006). QTLs for KNPS were identified on chromosomes 1A, 2A, 2B, 2D, 3A, 4A, 4D, 6A, 6B, and 7B using doubled haploid populations (McCartney et al., 2005; Huang et al., 2006; Heidari et al., 2011; Zhang et al., 2016). Using an F2:3 population of 237 families Wang et al. (2011) located QTLs on chromosomes 1A, 2D, 3B, 4A, 4B, 5A, 5B, 7A, and 7B. Through genome-wide association analysis based on a Chinese wheat mini core collection Zhang et al. (2012) detected 23 KNPS-associated loci on chromosomes 1A, 1B, 1D, 2A, 2B, 3A, 3B, 3D, 4D, 5B, 5D, 6A, 6B, and 6D. Guo et al. (2015a,b) identified 13 KNPS-associated loci on chromosomes 1A, 1B, 1D, 2D, 3B, 5B, 5D, 6B, and 7B using a set of wheat cultivars. All KNPS-associated QTLs reported so far in wheat have been mapped and located using RFLP and simple sequence repeat (SSR) markers. Although these findings provide valuable information, the marker densities proved insufficient for both marker assisted selection and gene isolation (Devos et al., 1993; Röder et al., 1998; Somers et al., 2004; Torada et al., 2006).
With recent developments in wheat gene chip technology and reduced of sequencing costs, single nucleotide polymorphism (SNP) markers have been extensively adopted due to their high density, representativeness, stable inheritance, and capability of automatic detection (Allen et al., 2011; Cavanagh et al., 2013). In particular, the 90K SNP GoldenGate chip based on the Illumina platform has been widely applied in detection of polymorphisms in both tetraploid and hexaploid wheat (Akhunov et al., 2009; Lai et al., 2012). The iSelect wheat 90K SNP chip has been used to discover yield-related QTLs in wheat. For example, an F8-generation RIL population derived from the cross Zhou 8425B/Chinese Spring was used by Gao et al. (2015) to identify 24 yield-related QTLs, of which five loci (QGC-W.caas-7AL, QNDVIS.caas-7AL, QGC-S.caas-3AS, QCTD-A.caas-5BS, and QCTD-10.caas-5BS) were detected simultaneously in multiple environments. Through genome-wide association analyses, Zanke et al. (2015) detected 58 loci significantly associated with thousand kernel weight and distributed in all chromosomes except 4D and 5D, and Ain et al. (2015) detected 44 loci significantly associated with yield (grain number per spike, thousand grain weight, grain yield, biological yield, and harvest index) in germplasm sets. As these genome-wide association studies were based on genetic resource collections and focused on mining of yield-related genes or loci the individual findings still need validation by linkage analysis in segregating populations.
In this study, a set of 264 wheat cultivars, and a RIL population with 198 lines derived from the cross Yangmai 13/C615 were genotyped using iSelect wheat 90K SNP high-density chips. Together with the KNPS phenotypic data detected in multiple environments, we confirmed the presence of KNPS-related loci and identified favorable alleles through an integration of association mapping and linkage analysis. The findings provide useful information for marker-assisted selection of KNPS in wheat.
The material for association analysis consisted of 264 wheat cultivars, including 258 from China and six from other countries. The six introduced accessions included three from Italy, one from Mexico, one from Chile, and one from Japan. The 258 domestic accessions (Table S1) were collected from Jiangsu (65 accessions), Henan (36), Shandong (22), Shaanxi (29), Sichuan (18), Anhui (16), Beijing (12), Hunan (12), Hebei (9), Hubei (7), Gansu (5), Zhejiang (4), Fujian (4), Shanxi (4), Guizhou (3), Heilongjiang (2), Jiangxi (1), and Yunnan (1) or were of unknown origin (8).
Yangmai 13, bred by Lixiahe Agricultural Institute in Jiangsu province, has been extensively promoted in the Lower and Middle Yangtze River Valley winter wheat region and C615 is a synthetic wheat accession [durum cultivar CEAT × AE. SQUARROSA (895)] introduced from the International Maize and Wheat Improvement Center (CIMMYT), Mexico. The average KNPS for Yangmai 13 exceeds that of C615 (57.9 vs. 47.0; Table 1). The F7 RIL population of 198 lines was developed by single seed descent from an initial F2 population.
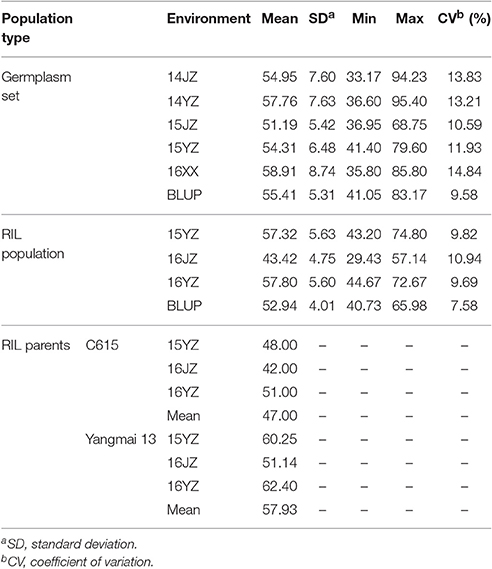
Table 1. Descriptive statistics for kernel number per spike in the two populations assessed in this study.
The cultivar set was planted in 2013–2014 and 2014–2015 at Jingzhou in Hubei province and Yangzhou in Jiangsu, and in 2015–2016 at Xinxiang in Henan; these environments were designated 14JZ, 14YZ, 15JZ, 15YZ, and 16XX, respectively. The field trials were grown as thrice-replicated randomized blocks. Lines in each replicate were planted in 3-row plots at a density of 40 kernels/133 cm row, and a row spacing of 25 cm. Plant densities were thinned to around 30 at the seedling stage. Thirty spikes of each line were randomly selected from the middle row and used to score KNPS. Field management followed local practices.
The Yangmai 13/C615 RIL population was planted in 2014–2015 at Yangzhou, and in 2015–2016 at Yangzhou and Jingzhou. These environments were named 15YZ, 16JZ, and 16YZ, respectively. The field experiments were designed as randomized blocks with three replicates. Plot sizes, plant densities, and spike sampling were similar to those described for the cultivars.
Genomic DNA was extracted from the test materials using the CTAB method (Sharp et al., 1989). Statistical analyses were conducted on SPSS 21.0 (http://www.brothersoft.com/ibm-spss-statistics-469577.html). The mean KNPS was computed by a best linear unbiased predictor (BLUP) method (Bernardo, 1996a,b; Bernardo et al., 1996).
SNP markers were detected by the Biotechnology Center, Department of Plants, University of California, USA, by using the Illumina SNP genotyping platform and BeadArray Microbead Chip (Cavanagh et al., 2013). SNP allele clustering and genotype calling were conducted on Genomestudio v2011.1 (Wang et al., 2014). Chromosome position of SNP markers are provided in Cavanagh et al. (2013).
Genetic diversity of SNP markers was analyzed on PowerMarker 3.25 (Liu and Muse, 2005). Genetic structure of the cultivar set was evaluated by Structure 2.3.2 using 3,656 SNP markers distributed on all 21 wheat chromosomes (Pritchard et al., 2000). The number of subpopulations was determined by a ΔK model (Evanno et al., 2005). Genome-wide association analysis of KNPS with SNP markers was based on a Q+K model (Yu et al., 2005; Zhang et al., 2010) and TASSEL 5.0 (Bradbury et al., 2007; http://www.maizegenetics.net/). SNP loci at frequencies lower than 0.05 were not considered, the threshold P of association signals was set as the 1/SNP marker number (1/20,037 = 4.99 × 10⁻⁵), or namely P < 4.99 × 10⁻⁵, −Log P > 4.30. The genetic effects of favorable alleles at associated loci in the cultivar set, and in the RIL population were tested via ANOVA on SPSS 21.0.
Analysis of KNPS in the cultivar population grown in five environments (14JZ, 14YZ, 15JZ, 15YZ, 16XX) and best linear unbiased predictions (BLUP) indicated coefficients of variation of KNPS data in the range 9.58–14.84%. Between-environment correlation coefficients for KNPS varied between 0.521 and 0.874 (P < 0.001) for cultivars, compared to 0.513 and 0.833 (P < 0.001) for the RIL population (Table S2). Although the coefficient of variation of KNPS for the RIL population of 7.58–10.94% was less than the cultivar population the variation was still quite rich (Table 1).
The genetic diversity of the cultivar population was analyzed using 22,325 SNP markers. The major allele frequency (MAF) varied from 0.500 to 0.998 (mean 0.785), polymorphism information content (PIC) varied between 0.004 and 0.375 (mean 0.238), and gene diversity varied between 0.004 and 0.500 (mean 0.294; Table S3), indicating this set of cultivars has high genetic diversity at the SNP level.
To reduce false associations, genetic structure (Q-value) and between-individual relationship coefficient (K-value) of the cultivar population were determined. The population divided into two subpopulations (Figure 1A), and ΔK was maxim at K = 2, further validating the above subdivision (Figure 1B).
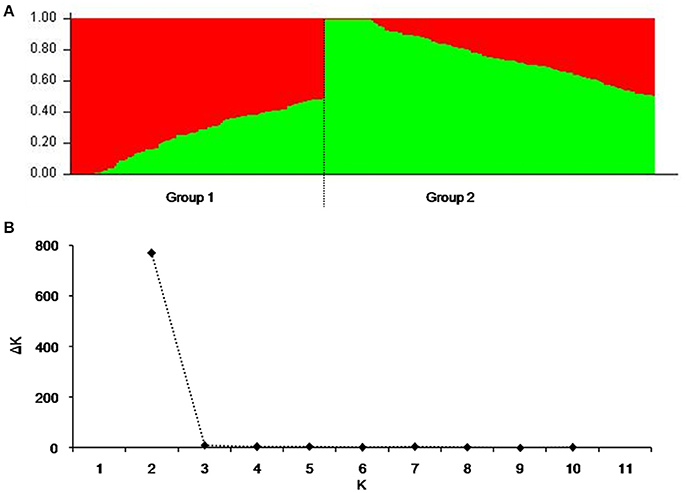
Figure 1. Population structure of 264 released cultivars based on 3,656 SNP markers with a whole-genome coverage. (A) Genetic structure produced by Structure V2.3.2, (B) Number of sub-populations estimated by ΔK at a range of K-values.
Among the 22,325 SNP markers 20,037 had frequencies above 0.05. Association analysis between KNPS and SNPs detected 62 significantly-associated signals at 47 loci (P < 4.99 × 10⁻⁵). The associated loci were distributed across all chromosomes except 1D and 4D, and the explained phenotypic variation (R2) ranging from 1.53–39.52% (Figure 2, Table 2). SNPs BS00022896_51 (2A), BobWhite_c10539_201 (2D), Excalibur_c73633_120 (3B), BS00063906_51 (6B), and GENE-4456_153 (7B) were significantly associated with KNPS in two or more environments (Table 2).
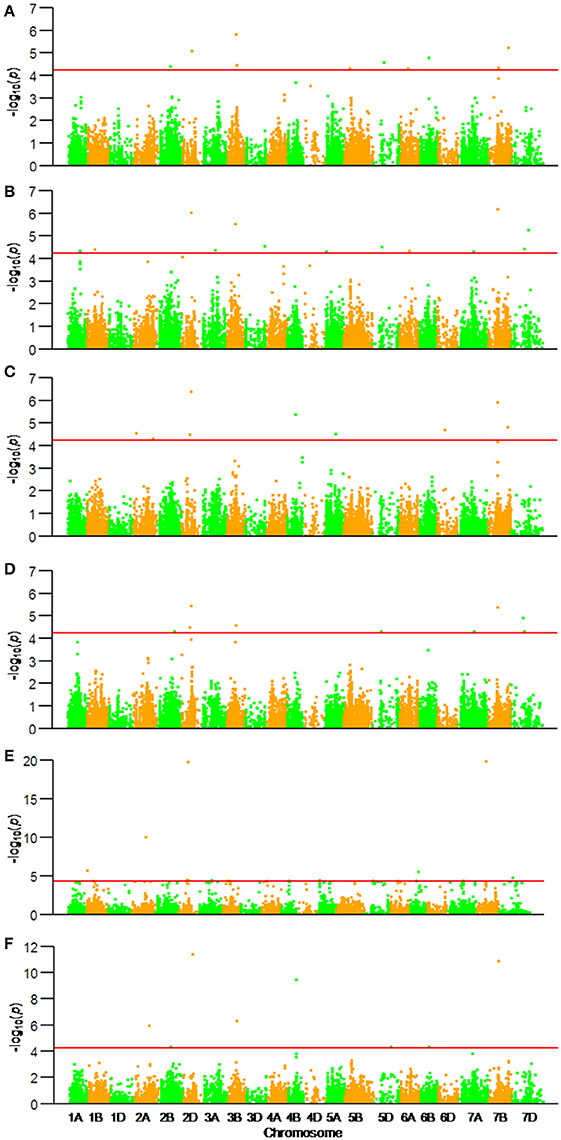
Figure 2. Associations of kernel number per spike with 20,037 genome-wide SNP markers illustrated as dotplots of compressed MLM at P < 4.99 × 10⁻⁵. Red dotted line indicates the threshold value for declaring a significant association. (A) 14JZ; (B) 14YZ; (C) 15JZ; (D) 15YZ; (E) 16XX; (F) BLUP.
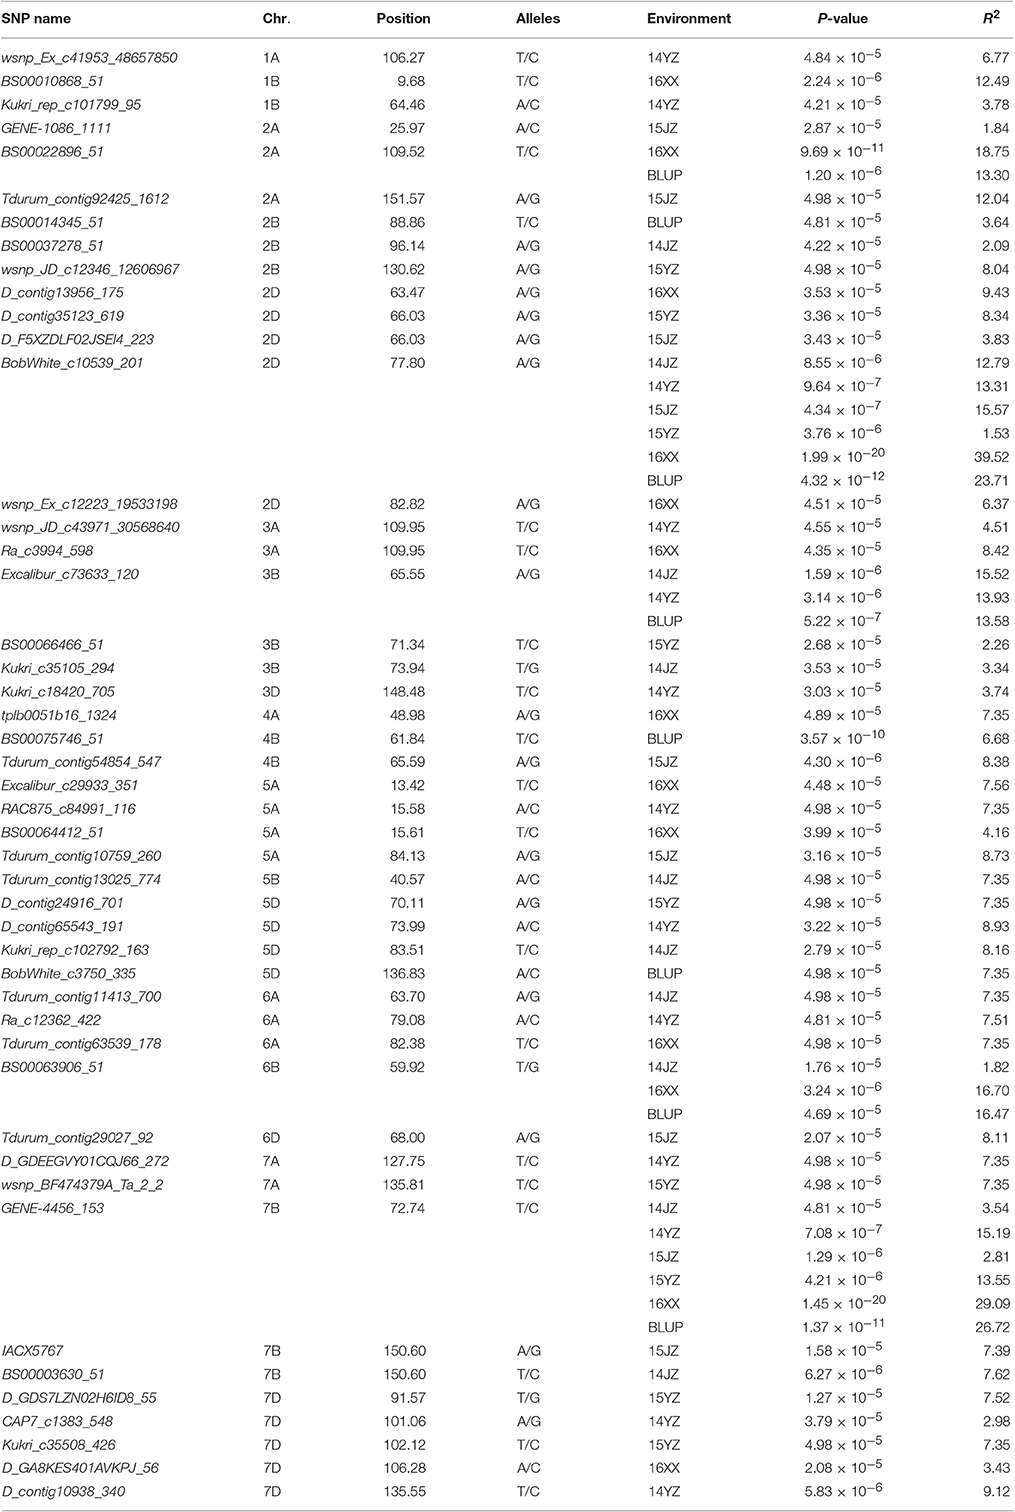
Table 2. Sixty-two significant association signals (P<4.99×10⁻⁵) involving 47 SNP markers.
The genetic effects of alleles at the 47 associated loci (Table 3) ranged from 0.45 to 3.68, indicating positive effects on KNPS. GENE-4456_153-7BTT has the largest effect (2.80 kernels per spikelet, 14JZ; 2.24 kernels, 14YZ; 3.25 kernels, 15JZ; 2.51 kernels, 15YZ; 3.68 kernels, 16XX) and was detected in all environments (Table 3). Moreover, the frequency of favorable alleles at associated loci varied from 8.33 to 92.82%. The frequencies of 19 favorable alleles exceeded 50% and were distributed in obviously skewed ways, indicative of prior strong selection in breeding programs.
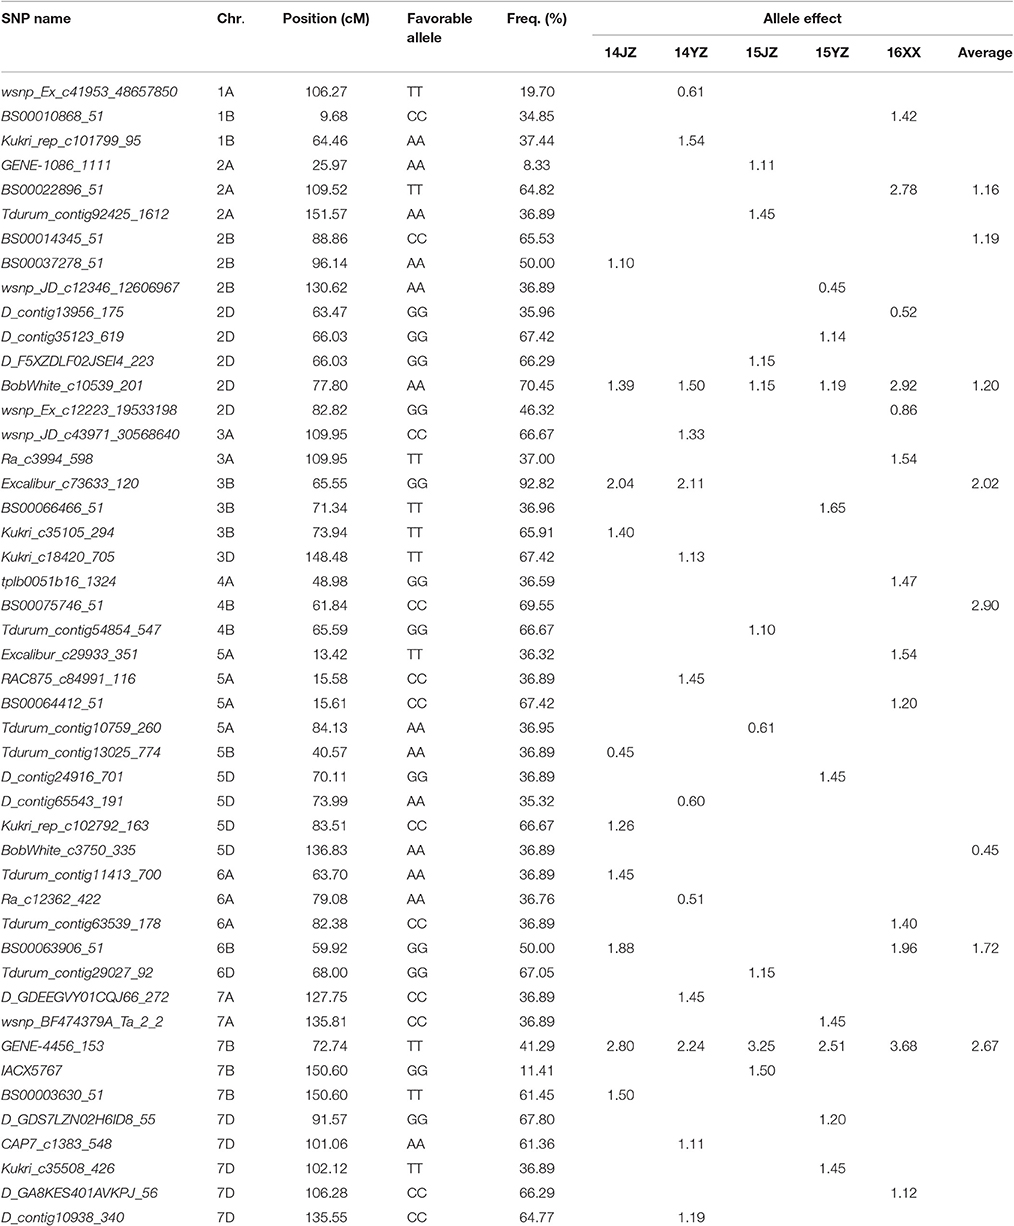
Table 3. Favorable alleles and effects of 47 SNP loci significantly (P < 4.99 × 10⁻⁵) associated with kernel number per spike in the germplasm set.
To validate the effectiveness of associated loci in the germplasm set, we used the same iSelect wheat 90K SNP chip to scan the RIL population. Among the 47 associated loci found earlier 16 (34.04%) were polymorphic between Yangmai 13 and C615. Furthermore, the genetic effects of the favorable alleles in the cultivar population were analyzed by ANOVA in the RIL population. Twelve loci (25.53% of all associated loci) were significantly correlated with KNPS in multiple environments (P < 0.05). In particular, four favorable alleles, BS00022896_51-2ATT, BobWhite_c10539_201-2DAA, Excalibur_c73633_120-3BGG, and Kukri_c35508_426-7DTT were significantly associated with KNPS in all environments. BS00022896_51-2ATT had a large genetic effect on KNPS (2.09 kernels, 15YZ; 1.05 kernels, 16JZ; 1.28 kernels, 16YZ; 1.22 kernels, BLUP; Table 4). Moreover, analysis of the 12 SNP loci showed that the favorable alleles at those loci were identical in both populations, indicating that these alleles had consistent effects in both populations.
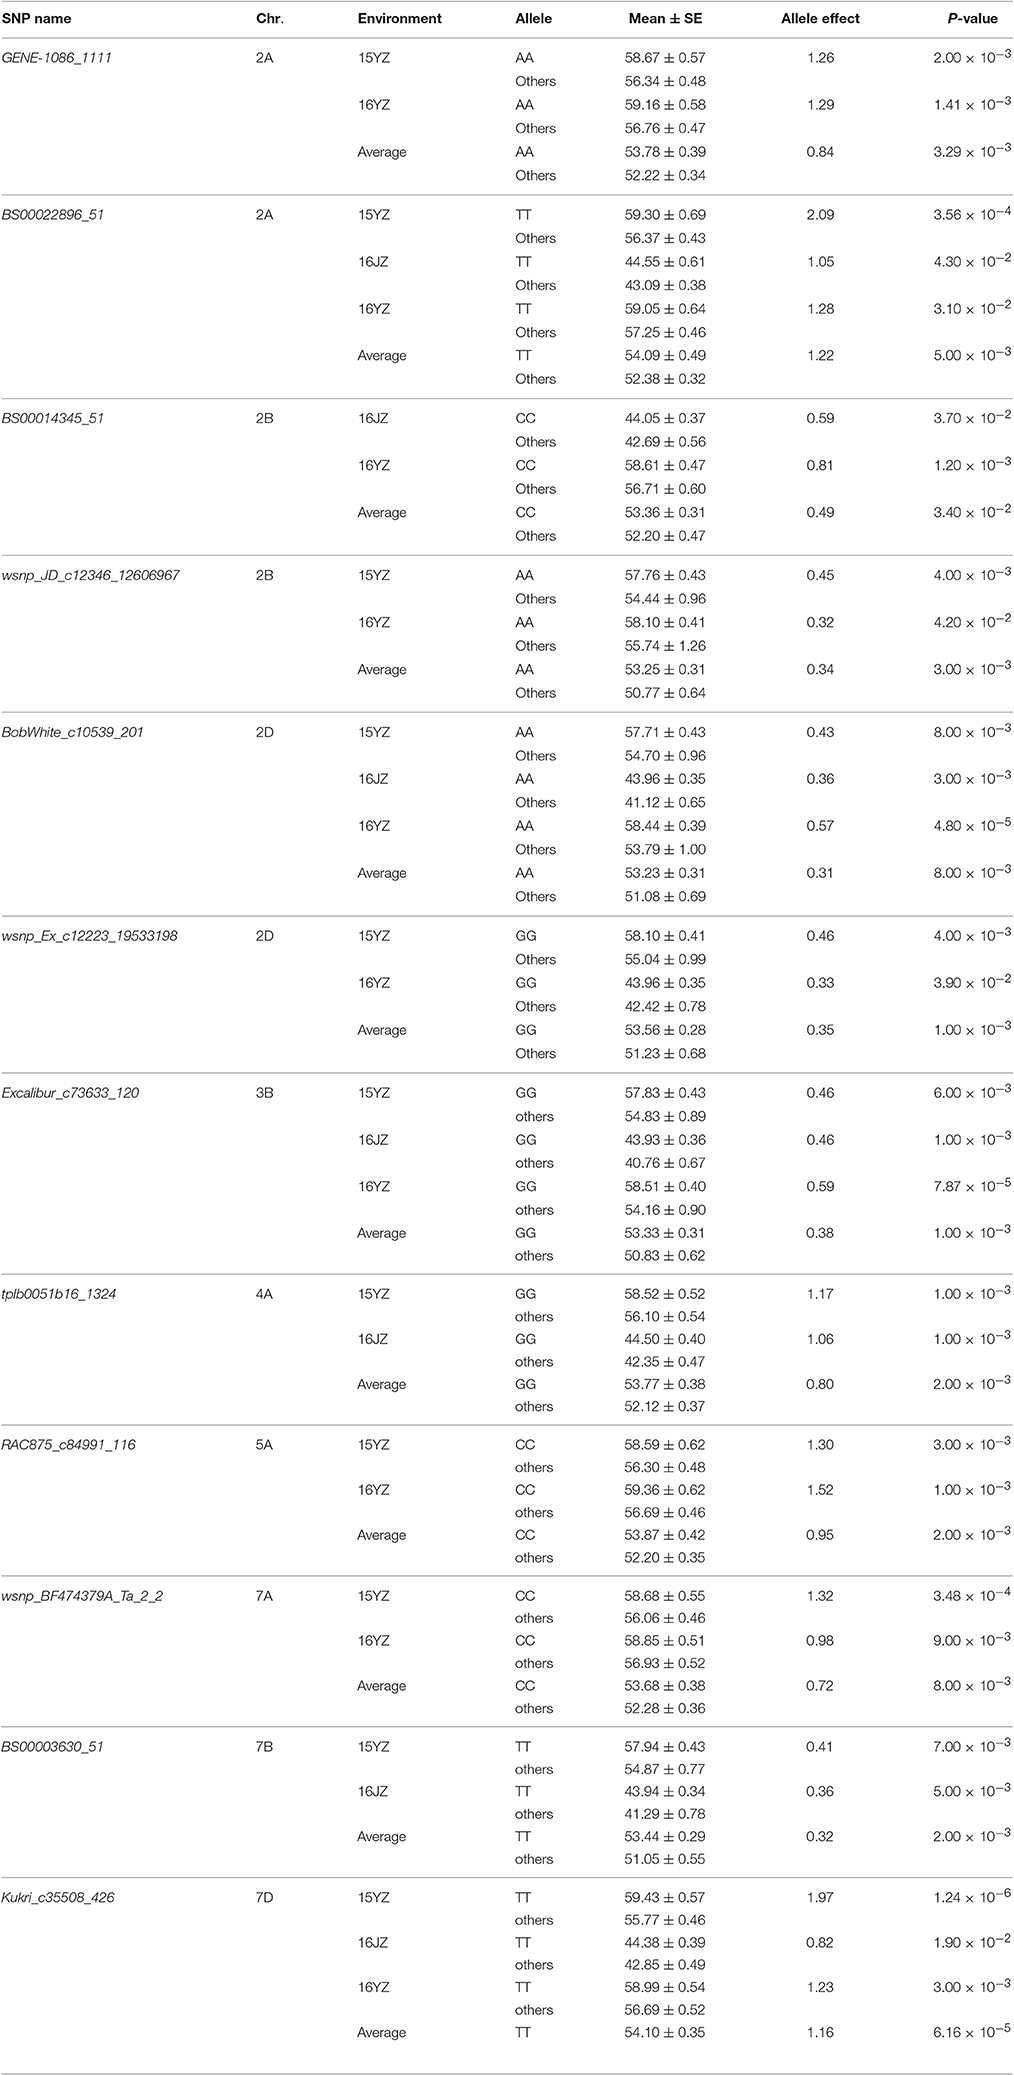
Table 4. Favorable alleles and effects of 12 SNP loci validated in the RIL population.
BobWhite_c10539_201 was associated with KNPS in all environments in the cultivar population (Figure 3A, Table 2), and the favorable allele was AA. The frequency of this allele was 70.45% in the cultivar population and was obviously skewed in a positive direction, indicating strong selection during modern breeding (Figure 3B). The KNPSs in the cultivar population in each environment (14JZ, 14YZ, 15JZ, 15YZ, 16XX, BLUP) increased by 1.39, 1.50, 1.15, 1.19, 2.92, and 1.20, respectively (Figure 3C). Moreover, the average KNPS of the lines carrying the AA allele in all environments for the RIL population were significantly higher than that for lines carrying other alleles (P < 0.01; Figure 3D).
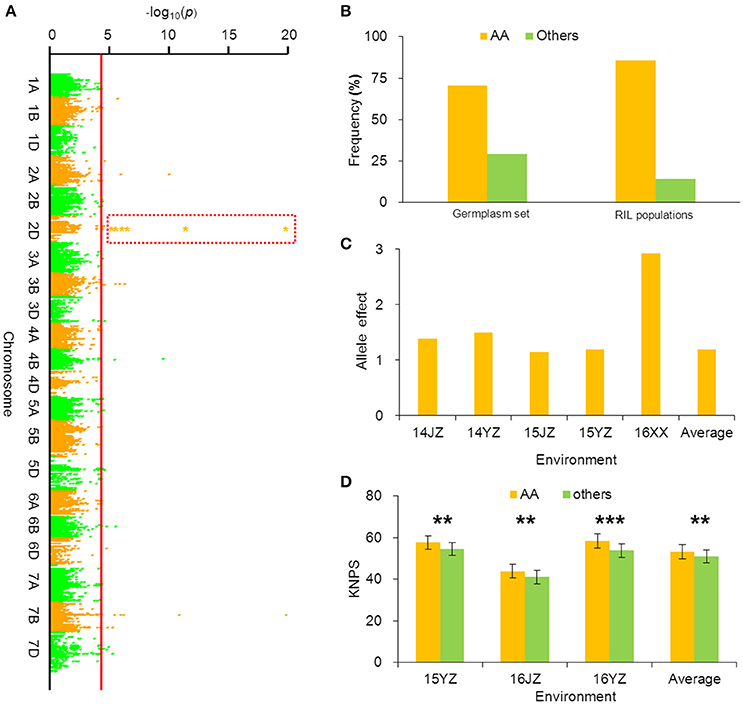
Figure 3. Favorable allele BobWhite_c10539_201-2DAA associated with KNPS and analysis of its effect. (A) Markers associated with KNPS were identified by a mixed linear model in the germplasm set. The orange dots in the red frame show the association signals across all environments (P < 4.99 × 10⁻⁵). (B) Allelic frequencies (AA vs. aa) in the germplasm set and RIL population. Orange histogram represents the favorable allele. (C) Genetic effect of BobWhite_c10539_201-2DAA in the germplasm set grown in different environments. (D) Genetic effects of BobWhite_c10539_201-2DAA in the RIL population grown in different environments. **P = 0.01; ***P = 0.001.
SNP markers are the richest and ultimate point mutations in genomes, and are representative of ancient and stable variation. Genotyping using SNPs can be standardized, and the differences can be as simple as a single base pair. Moreover, SNP chips are highly-integrated, and can be combined with analysis software and relevant breeding information (Wang et al., 2014; Maccaferri et al., 2015). Thus, SNP markers can be used in a molecular breeding platform. Currently, applications of SNP chips in studies on QTLs in wheat are still at a preliminary stage. For instance, Thompson et al. (2015) used 9 K SNP chips to scan a wheat RIL population derived from the cross Louise/IWA8608077, and located QTLs associated with resistance to root-lesion nematode and root architectural traits using an established genetic map. Wang et al. (2014) used 90K high-density gene chips to scan eight DH wheat populations and built a SNP-integrated genetic map with an average distance of 0.09 cM. Jin et al. (2016) built a genetic map for a Gaocheng 8901/Zhoumai 16 RIL population consisting of 46,961 SNPs using 90 and 660K high-density gene chips. The total chromosome length was 4,121 cM with an average marker distance of 0.09 cM.
The 90K wheat iSelect SNP chip used in this study consisted of 81,587 SNP markers and scanned 34,039 polymorphic markers in the cultivar population, with a polymorphism frequency of 41.72%. Finally, 7,320 polymorphic markers were scanned in the RIL population, with a polymorphism frequency of 8.97%. Since the marker sequences of this SNP chip were known, sequence alignment can be used in evaluating marker effectiveness. Future work will enable construction of a high-density genetic linkage map for the RIL population.
Association analysis and traditional linkage mapping can be used in a complementary manner for gene identification and validation (Nordborg and Weigel, 2008). Using germplasm and RIL populations of soybean, Korir et al. (2013) detected five loci associated with aluminum resistance in both populations. The combination of the two methods improved the efficiency of screening for aluminum resistance candidate genes in soybean. Li et al. (2014) detected 22 seed weight and silique length-related QTLs in rape using a bi-parental population. Loci uq.A09-1 and uq.A09-3 were significantly associated in a germplasm population grown in multiple environments. Maccaferri et al. (2016) identified three major QTL clusters controlling root length and mass, including RSA_QTL_cluster_5#, RSA_QTL_cluster_6#, and RSA_QTL_cluster_12#, in two RIL populations and a germplsm set of durum wheat. The sequences surrounding these QTL will permit functional marker development and gene cloning. To validate association loci detected in a cultivar set we used the same SNP markers to scan the Yangmai 13/C615 RIL population. Among the 47 associated loci, 12 (25.53%) were significantly associated (P < 0.05) with KNPS in the RIL population grown in a different set of environments. In particular, BS00022896_51-2ATT, BobWhite_c10539_201-2DAA, Excalibur_c73633_120-3BGG, and Kukri_c35508_426-7DTT were significantly associated with KNPS in all conditions (Table 4).
Among the 47 associated loci 35 (74.47%) were not validated in the RIL population. The main reason for this was the restricted bi-allelic polymorphism in a single segregating population. New strategies for combining linkage mapping and association analysis have been reported. For example, nested association mapping (NAM) is considered the most effective method to explain the genetic basis of quantitative traits for low-level LD species. NAM more effectively and economically scans at the genome-wide level, and helps to integrate molecular variation at the molecular level with that of complex phenotypic traits (Maurer et al., 2016; Saade et al., 2016).
In this study with the iSelect wheat 90K SNP chip we combined data from association mapping based on a germplasm set with linkage analysis of a RIL population to discover and validate QTLs for KNPS in wheat. Our findings theoretically permit cloning of candidate genes for KNPS. Moreover, the more important loci discovered here can be preferentially targeted in marker-assisted selection for high yield. Thus, the combination of association analysis and linkage mapping, development and application of powerful statistical models, and application of high-density SNP markers will promote research on the genetics of complex quantitative traits in crop species.
In this study, 12 of the 47 loci were validated to be correlated with KNPS in both populations. 9 of the 12 MTAs co-localizing with previous QTLs or loci were identified. They were located on chromosomes 2A (2), 2B (2), 2D, 3B, 4A, 7A, and 7B, respectively. The SNPs GENE-1086_1111-2A, BS00022896_51-2A, and BobWhite_c10539_201-2D on homologous group 2 were mapped to intervals of QChl-A.caas-2AS (wsnp_Ex_c322_624793-Tdurum_contig10785_103), QChl-A.caas-2AL.2 (Excalibur_c84687_162-BS00014251_51), and QChl-A.caas-2DS (BS00081578_51-tplb0021c10_951) affecting SPAD value of chlorophyll content at anthesis, respectively (Gao et al., 2015). Besides, Gao et al. (2015) detected a QTL QKNS.caas-2B.1 for KNPS on chromosome 2B in two environments in the bi-parental mapping population Zhou 8425B/Chinese Spring, and the authors assumed it to be the Ppd-B1 locus. It is possible that BS00014345_51 is tightly linked to the Ppd-B1 gene (Beales et al., 2007). Wsnp_JD_c12346_12606967 was mapped to QGy.ubo-2B in an interval of 97.4-150.0 cM, affecting grain yield in the RIL population (Milner et al., 2016). On chromosome 3B, SNP-marker Excalibur_c73633_120 was significantly associated with KNPS in two environments (Table 2). This marker co-segregated with BS00074688_ 51 that was related to days to heading by GWAS analysis in Pakistani historical wheat cultivars (Ain et al., 2015). Similarly, the SNPs tplb0051b16_1324-4A, wsnp_BF474379A_Ta_2_2-7A, and BS00003630_51-7B were also related to the corresponding QTLs, including QSL.caas-4AS (Kukri_c46057_646-RAC875_rep_c77874_269) coincided with spike length, QMd.ubo-7A.3 (IWB319-IWB23989) with days to maturity and QPh.ubo-7B (IWB10498-IWA7330) with plant height, respectively (Gao et al., 2015). In addition, the SNP Kukri_c35508_426 on chromosome 7D may close to the gene of TaGS-D1 regulating grain weight and grain length, but more work will be needed to confirm (Zhang et al., 2014).
Breeding is a process of combining favorable alleles (Ge et al., 2011; Wang et al., 2012). So far, there is limited research on discovery of wheat yield QTL using the iSelect wheat 90K SNP chip. Gao et al. (2015) used an F8 RIL population developed from Zhou 8425B/Chinese Spring and detected 11 KNPS QTLs distributed in chromosomes 1B, 2A, 2B, 2D, 3A, 3B, 4A, 4B, 6B, and 7B. Three loci, QKNS.caas-4AL (Kukri_rep_c106490_583-RAC875_c29282_566), QKNS.caas-3AL (RAC875_c61934_186-wsnp_Ex_c45877_51547406), and QKNS.caas-3B (RAC875_c10909_1180-BobWhite_c22016_155) were detected in multiple environments. In the present study five associated loci BS00022896_51 (2A), BobWhite_c10539_201 (2D), Excalibur_c73633_120 (3B), BS00063906_51 (6B), and GENE-4456_153 (7B) were significantly associated with KNPS in two or more environments (Table 2). The frequencies of BS00022896_51-2ATT, BobWhite_c10539_201-2DAA, Excalibur_c73633_120-3BGG, BS00063906_51-6BGG, and GENE-4456_153-7BTT in the analyzed population were 64.82, 70.45, 92.82, 50.00, and 41.29%, respectively (Table 3). The skewed values imply that these alleles might have undergone selection during breeding.
Conceived and designed the experiments: JG, PG, and SC. Performed the experiments: WS, YZ, and JC. Analyzed the data: JG and WS. Contributed reagents/materials/analysis tools: XY, JL, ZZ, XC, YX, DS, and XZ. Wrote the manuscript: JG, WS, and CH.
The authors declare that the research was conducted in the absence of any commercial or financial relationships that could be construed as a potential conflict of interest.
We gratefully acknowledge help from Professor Robert A. McIntosh, University of Sydney, with English editing. This work was supported by grants from the National Key R&D Program of China (2017YFD0101000), Technology Innovation Program of Higher Education of Shanxi province (2017142), Introduction of Doctoral Research Program of Shanxi Agricultural University (2016YJ05) and Large Scientific Instrument Operation-Sharing Subsidy Program of Shanxi province (2015).
The Supplementary Material for this article can be found online at: http://journal.frontiersin.org/article/10.3389/fpls.2017.01412/full#supplementary-material
Ain, Q., Rasheed, A., Anwar, A., Mahmood, T., Imtiaz, M., Mahmood, T., et al. (2015). Genome-wide association for grain yield under rainfed conditions in historical wheat cultivars from Pakistan. Front. Plant Sci. 6:743. doi: 10.3389/fpls.2015.00743
Akhunov, E., Nicolet, C., and Dvorak, J. (2009). Single nucleotide polymorphism genotyping in polyploid wheat with the Illumina goldengate assay. Theor. Appl. Genet. 119, 507–517. doi: 10.1007/s00122-009-1059-5
Allen, A. M., Barker, G. L., Berry, S. T., Coghill, J. A., Gwilliam, R., Kirby, S., et al. (2011). Transcript-specific, single-nucleotide polymorphism discovery and linkage analysis in hexaploid bread wheat (Triticum aestivum L.). Plant Biotechnol. J. 9, 1086–1099. doi: 10.1111/j.1467-7652.2011.00628.x
Atwell, S., Huang, Y. S., Vilhjálmsson, B. J., Willems, G., Horton, M., Li, Y., et al. (2010). Genome-wide association study of 107 phenotypes in Arabidopsis thaliana inbred lines. Nature 465, 627–631. doi: 10.1038/nature08800
Beales, J., Turner, A., Griffiths, S., Snape, J. W., and Laurie, D. A. (2007). A pseudo-response regulator is misexpressed in the photoperiod insensitive Ppd-D1a mutant of wheat (Triticum aestivum L.). Theor. Appl. Genet. 115, 721–733. doi: 10.1007/s00122-007-0603-4
Bernardo, R. (1996a). Test cross additive and dominance effects in best linear unbiased prediction of maize single-cross performance. Theor. Appl. Genet. 93, 1098–1102. doi: 10.1007/BF00230131
Bernardo, R. (1996b). Best linear unbiased prediction of maize single-cross performance. Crop Sci. 36, 50–56. doi: 10.2135/cropsci1996.0011183X003600010009x
Bernardo, R., Murigneux, A., and Karaman, Z. (1996). Marker-based estimates of identity by descent and alikeness in state among maize inbreds. Theor. Appl. Genet. 93, 262–267. doi: 10.1007/BF00225755
Börner, A., Schumann, E., Fürste, A., Cöter, H., Leithold, B., Röder, M. S., et al. (2002). Mapping of quantitative trait loci determin¬ing agronomic important characters in hexaploid wheat (Triticum aestivum L.). Theor. Appl. Genet. 105, 921–936. doi: 10.1007/s00122-002-0994-1
Bradbury, P. J., Zhang, Z. W., Kroon, D. E., Casstevens, T. M., Ramdoss, Y., and Buckler, E. S. (2007). TASSEL: software for association mapping of complex traits in diverse samples. Bioinformatics 23, 2633–2635. doi: 10.1093/bioinformatics/btm308
Breseghello, F., and Sorrells, M. E. (2006). Association analysis as a strategy for improvement of quantitative traits in plants. Crop Sci. 46, 1323–1330. doi: 10.2135/cropsci2005.09-0305
Cadic, E., Coque, M., Vear, F., Grezes-Besset, B., Pauquet, J., Piquemal, J., et al. (2013). Combined linkage and association mapping of flowering time in sunflower (Helianthus annuus L.). Theor. Appl. Genet. 126, 1337–1356. doi: 10.1007/s00122-013-2056-2
Cavanagh, C. R., Chao, S., Wang, S., Huang, B. E., Stephen, S., Kiani, S., et al. (2013). Genome-wide comparative diversity uncovers multiple targets of selection for improvement in hexaploid wheat landraces and cultivars. Proc. Natl. Acad. Sci. U.S.A. 110, 8057–8062. doi: 10.1073/pnas.1217133110
Cui, F., Ding, A. M., Li, J., Zhao, C. H., Wang, L., Wang, X. Q., et al. (2012). QTL detection of seven spike-related traits and their genetic correlations in wheat using two related RIL populations. Euphytica 186, 177–192. doi: 10.1007/s10681-011-0550-7
Cui, F., Zhao, C. H., Ding, A. M., Li, J., Wang, L., Li, X. F., et al. (2014). Construction of an integrative linkage map and QTL mapping of grain yield-related traits using three related wheat RIL populations. Theor. Appl. Genet. 127, 659–675. doi: 10.1007/s00122-013-2249-8
Deng, S., Wu, X., Wu, Y., Zhou, R., Wang, H., Jia, J., et al. (2011). Characterization and precise mapping of a QTL increasing spike number with pleiotropic effects in wheat. Theor. Appl. Genet. 122, 281–289. doi: 10.1007/s00122-010-1443-1
Devos, K. M., Millan, T., and Gale, M. D. (1993). Comparative RFLP maps of the homoeologous group-2 chromosomes of wheat, rye and barley. Theor. Appl. Genet. 85, 784–792. doi: 10.1007/BF00225020
Dobrovolskaya, O., Pont, C., Sibout, R., Martinek, P., Badaeva, E., Murat, F., et al. (2015). FRIZZY PANICLE drives supernumerary spikelets in bread wheat. Plant Physiol. 167, 189–199. doi: 10.1104/pp.114.250043
Evanno, G., Regnaut, S., and Goudet, J. (2005). Detecting the number of clusters of individuals using the software STRUCTURE: a simulation study. Mol. Ecol. 14, 2611–2620. doi: 10.1111/j.1365-294X.2005.02553.x
Fischer, R. A. (2008). The importance of grain or kernel number in wheat: a reply to Sinclair and Jamieson. Field Crops Res. 105, 15–21. doi: 10.1016/j.fcr.2007.04.002
Fischer, R. A. (2011). Wheat physiology: a review of recent developments. Crop Pasture Sci. 62, 95–114. doi: 10.1071/CP10344
Gao, F. M., Wen, W. E., Liu, J. D., Rasheed, A., Yin, G. H., Xia, X. C., et al. (2015). Genome-wide linkage mapping of QTL for yield components, plant height and yield-related physiological traits in the Chinese wheat cross Zhou 8425B/Chinese Spring. Front. Plant Sci. 6:1099. doi: 10.3389/fpls.2015.01099
Ge, H. M., You, G. X., Wang, L. F., Hao, C. Y., Dong, Y. C., Li, Z. S., et al. (2011). Genome selection sweep and association analysis shed light on future breeding by design in wheat. Crop Sci. 52, 1218–1228. doi: 10.2135/cropsci2010.12.0680
Guo, J., Hao, C. Y., Zhang, Y., Zhang, B. Q., Cheng, X. M., Qin, L., et al. (2015a). Association and validation of yield-favored alleles in Chinese cultivars of common wheat (Triticum aestivum L.). PLoS ONE 10:e130029. doi: 10.1371/journal.pone.0130029
Guo, J., Zhang, Y., Shi, W. P., Zhang, B. Q., Zhang, J. J., Xu, Y. H., et al. (2015b). Association analysis of grain-setting rate at the apical and basal spikelets in bread wheat (Triticum aestivum L.). Front. Plant Sci. 6:1029. doi: 10.3389/fpls.2015.01029
Heidari, B., Sayed-Tabatabaei, B. E., Saeidi, G., Kearsey, M., and Suenaga, K. (2011). Mapping QTL for grain yield, yield components, and spike features in a doubled haploid population of bread wheat. Genome 54, 517–527. doi: 10.1139/g11-017
Huang, X. Q., Cloutier, S., Lycar, L., Radovanovic, N., Humphreys, D. G., Noll, J. S., et al. (2006). Molecular detection of QTLs for agronomic and quality traits in a doubled haploid population derived from two Canadian wheats (Triticum aestivum L.). Theor. Appl. Genet. 113, 753–766. doi: 10.1007/s00122-006-0346-7
Huang, X. Q., Kempf, H., Canal, M. W., and Röder, M. S. (2004). Advanced backcross QTL analysis in progenies derived from a cross between a German elite winter wheat variety and a synthetic wheat (Triticum aestivum L.). Theor. Appl. Genet. 109, 933–943. doi: 10.1007/s00122-004-1708-7
Jia, H. Y., Wan, H. S., Yang, S. H., Zhang, Z. Z., Kong, Z. X., Xue, S. L., et al. (2013). Genetic dissection of yield-related traits in a recombinant inbred line population created using a key breeding parent in China's wheat breeding. Theor. Appl. Genet. 126, 2123–2139. doi: 10.1007/s00122-013-2123-8
Jin, H., Wen, W. E., Liu, J. D., Zhai, S. N., Zhang, Y., Yan, J., et al. (2016). Genome-wide QTL mapping for wheat processing quality parameters in a Gaocheng8901/Zhoumai16 recombinant inbred line population. Front. Plant. Sci. 7:1099. doi: 10.3389/fpls.2016.01032
Kirigwi, F. M., Ginkel, M. V., Brown-Guedira, G., Gill, B. S., Paulsen, G. M., and Fritz, A. K. (2007). Markers associated with a QTL for grain yield in wheat under drought. Mol. Breed. 20, 401–413. doi: 10.1007/s11032-007-9100-3
Korir, P. C., Zhang, J., Wu, K. J., Zhao, T. J., and Gai, J. Y. (2013). Association mapping combined with linkage analysis for aluminum tolerance among soybean cultivars released in Yellow and Changjiang river valleys in China. Theor. Appl. Genet. 126, 1659–1675. doi: 10.1007/s00122-013-2082-0
Lai, K., Duran, C., Berkman, P. J., Lorenc, M. T., Stiller, J., Manoli, S., et al. (2012). Single nucleotide polymorphism discovery from wheat next-generation sequence data. Plant Biotechnol. J. 10, 743–749. doi: 10.1111/j.1467-7652.2012.00718.x
Li, N., Shi, J. Q., Wang, X. F., Liu, G. H., and Wang, H. Z. (2014). A combined linkage and regional association mapping validation and fine mapping of two major pleiotropic QTLs for seed weight and silique length in rapeseed (Brassica napus L.). BMC Plant Biol. 14:114. doi: 10.1186/1471-2229-14-114
Liu, K. J., and Muse, S. V. (2005). Powermarker: an integrated analysis environment for genetic marker analysis. Bioinformatics 21, 2128–2129. doi: 10.1093/bioinformatics/bti282
Maccaferri, M., El-Feki, W., Nazemi, G., Salvi, S., Canè, M. A., Colalongo, M. C., et al. (2016). Prioritizing quantitative trait loci for root system architecture in tetraploid wheat. J. Exp. Bot. 67, 1161–1178. doi: 10.1093/jxb/erw039
Maccaferri, M., Ricci, A., Salvi, S., Milner, S. G., Noli, E., Martelli, P. L., et al. (2015). A high-density, SNP-based consensus map of tetraploid wheat as a bridge to integrate durum and bread wheat genomics and breeding. Plant Biotechnol. J. 13, 648–663. doi: 10.1111/pbi.12288
Mackay, I., and Powell, W. (2007). Methods for linkage disequilibrium mapping in crops. Trends Plant Sci. 12, 57–63. doi: 10.1016/j.tplants.2006.12.001
Maurer, A., Draba, V., and Pillen, K. (2016). Genomic dissection of plant development and its impact on thousand grain weight in barley through nested association mapping. J. Exp. Bot. 67, 2507–2518. doi: 10.1093/jxb/erw070
McCartney, C. A., Somers, D. J., Humphreys, D. G., Lukow, O., Ames, N., Noll, J., et al. (2005). Mapping quantitative trait loci controlling agronomic traits in the spring wheat cross RL4452 × ‘AC Domain’. Genome 48, 870–883. doi: 10.1139/g05-055
Milner, S. G., Maccaferri, M., Huang, B. E., Mantovani, P., Massi, A., Frascaroli, E., et al. (2016). A multiparental cross population for mapping QTL for agronomic traits in durum wheat (Triticum turgidum ssp. durum). Plant Biotechnol. J. 14, 735–748. doi: 10.1111/pbi.12424
Myles, S., Peiffer, J., Brown, P. J., Ersoz, E. S., Zhang, Z., Costich, D. E., et al. (2009). Association mapping: critical considerations shift from genotyping to experimental design. Plant Cell 21, 2194–2202. doi: 10.1105/tpc.109.068437
Narasimhamoorthy, B., Gill, B. S., Fritz, A. K., Nelson, J. C., and Brown-Guedira, G. L. (2006). Advanced backcross QTL analysis of a hard win¬ter wheat × synthetic wheat population. Theor. Appl. Genet. 112, 787–796. doi: 10.1007/s00122-005-0159-0
Nordborg, M., and Weigel, D. (2008). Next-generation genetics in plants. Nature 456, 720–723. doi: 10.1038/nature07629
Paterson, A. H., Lander, E. S., Hewitt, J. D., Peterson, S., Lincoln, S. E., and Tanksley, S. D. (1988). Resolution of quantitative traits into Mendelian factors by using a complete linkage map of restriction fragment length polymorphisms. Nature 335, 721–726. doi: 10.1038/335721a0
Pritchard, J. K., Stephens, M., Rosenberg, N. A., and Donnelly, P. (2000). Association mapping in structured populations. Am. J. Hum. Genet. 67, 170–181. doi: 10.1086/302959
Röder, M. S., Korzun, V., Wendehake, K., Plaschke, J., Tixier, M. H., Leroy, P., et al. (1998). A microsatellite map of wheat. Genetics 149, 2007–2023.
Saade, S., Maurer, A., Shahid, M., Oakey, H., Schmöckel, S. M., Negrão, S., et al. (2016). Yield-related salinity tolerance traits identified in a nested association mapping (NAM) population of wild barley. Sci. Rep. 6:32586. doi: 10.1038/srep32586
Sharp, P. J., Chao, S., Desai, S., and Gale, M. D. (1989). The isolation, characterization and application in the Triticeae of a set of wheat RFLP probes identifying each homoeologous chromosome arm. Theor. Appl. Genet. 78, 342–348. doi: 10.1007/BF00265294
Slafer, G. A., and Andrade, F. H. (1989). Genetic improvement in bread wheat (Triticum aestivum) yield in Argentina. Field Crops Res. 21, 289–296. doi: 10.1016/0378-4290(89)90010-5
Somers, D. J., Isaac, P., and Edwards, K. (2004). A high density microsatellite consensus map for bread wheat (Triticum aestivum L.). Theor. Appl. Genet. 109, 1105–1114. doi: 10.1007/s00122-004-1740-7
Thompson, A. L., Smiley, R. W., and Garland-Campbell, K. (2015). Registration of the LouAu (Louise/IWA8608077) wheat recombinant inbred line mapping population. J. Plant Regist. 9, 424–429. doi: 10.3198/jpr2015.01.0002crmp
Torada, A., Koike, M., Mochida, K., and Ogihara, Y. (2006). SSR-based linkage map with new markers using an intraspecific population of common wheat. Theor. Appl. Genet. 112, 1042–1051. doi: 10.1007/s00122-006-0206-5
Wang, J. S., Lin, W. H., Wang, H., Li, L. H., Wu, J., Yan, X. M., et al. (2011). QTL mapping of yield-related traits in the wheat germplasm 3228. Euphytica 177, 277–292. doi: 10.1007/s10681-010-0267-z
Wang, L. F., Ge, H. M., Hao, C. Y., Dong, Y. S., and Zhang, X. Y. (2012). Identifying loci influencing 1,000-kernel weight in wheat by microsatellite screening for evidence of selection during breeding. PLoS ONE 7:e29432. doi: 10.1371/journal.pone.0029432
Wang, S. C., Wong, D., Forrest, K., Allen, A., Chao, S., Huang, B. E., et al. (2014). Characterization of polyploid wheat genomic diversity using a high-density 90000 single nucleotide polymorphism array. Plant Biotechnol. J. 12, 787–796. doi: 10.1111/pbi.12183
Wu, X. S., Chang, X. P., and Jing, R. L. (2012). Genetic insight into yield-associated traits of wheat grown in multiple rain-fed environments. PLoS ONE 7:e31249. doi: 10.1371/journal.pone.0031249
Yu, J. M., Pressoir, G., Briggs, W. H., Bi, I. V., Yamasaki, M., Doebley, J. F., et al. (2005). A unified mixed-model method for association mapping that accounts for multiple levels of relatedness. Nat. Genet. 38, 203–208. doi: 10.1038/ng1702
Zanke, C. D., Ling, J., Plieske, J., Kollers, S., Ebmeyer, E., Korzun, V., et al. (2015). Analysis of main effect QTL for thousand grain weight in European winter wheat (Triticum aestivum L.) by genome-wide association mapping. Front. Plant Sci. 6:644. doi: 10.3389/fpls.2015.00644
Zhang, D. L., Hao, C. Y., Wang, L. F., and Zhang, X. Y. (2012). Identifying loci influencing grain number by microsatellite screening in bread wheat (Triticum aestivum L.). Planta 236, 1507–1517. doi: 10.1007/s00425-012-1708-9
Zhang, H., Chen, J. S., Li, R. Y., Deng, Z. Y., Zhang, K. P., Liu, B., et al. (2016). Conditional QTL mapping of three yield components in common wheat (Triticum aestivum L.). Crop J. 4, 220–228. doi: 10.1016/j.cj.2016.01.007
Zhang, J. N., Hao, C. Y., Ren, Q., Chang, X. P., Liu, G. R., and Jing, R. L. (2011). Association mapping of dynamic developmental plant height in common wheat. Planta 234, 891–902. doi: 10.1007/s00425-011-1434-8
Zhang, Y., Liu, J., Xia, X., and He, Z. (2014). TaGS-D1, an ortholog of rice OsGS3, is associated with grain weight and grain length in common wheat. Mol. Breed. 34, 1097–1107. doi: 10.1007/s11032-014-0102-7
Zhang, Z. W., Ersoz, E., Lai, C. Q., Todhunter, R. J., Tiwari, H. K., Gore, M. A., et al. (2010). Mixed linear model approach adapted for genome-wide association studies. Nat. Genet. 42, 355–360. doi: 10.1038/ng.546
Keywords: bi-parental population analysis, GWAS, iSelect wheat 90K SNP chip
Citation: Shi W, Hao C, Zhang Y, Cheng J, Zhang Z, Liu J, Yi X, Cheng X, Sun D, Xu Y, Zhang X, Cheng S, Guo P and Guo J (2017) A Combined Association Mapping and Linkage Analysis of Kernel Number Per Spike in Common Wheat (Triticum aestivum L.). Front. Plant Sci. 8:1412. doi: 10.3389/fpls.2017.01412
Received: 05 April 2017; Accepted: 31 July 2017;
Published: 18 August 2017.
Edited by:
Chengdao Li, Murdoch University, AustraliaReviewed by:
Toi J. Tsilo, Agricultural Research Council of South Africa (ARC-SA), South AfricaCopyright © 2017 Shi, Hao, Zhang, Cheng, Zhang, Liu, Yi, Cheng, Sun, Xu, Zhang, Cheng, Guo and Guo. This is an open-access article distributed under the terms of the Creative Commons Attribution License (CC BY). The use, distribution or reproduction in other forums is permitted, provided the original author(s) or licensor are credited and that the original publication in this journal is cited, in accordance with accepted academic practice. No use, distribution or reproduction is permitted which does not comply with these terms.
*Correspondence: Jie Guo, bnhnajExMTUzMjZAMTYzLmNvbQ==
Pingyi Guo, cHlndW8xMjZAMTI2LmNvbQ==
Shunhe Cheng, eXpjc2gxOTM5QDEyNi5jb20=
†These authors have contributed equally to this work.
Disclaimer: All claims expressed in this article are solely those of the authors and do not necessarily represent those of their affiliated organizations, or those of the publisher, the editors and the reviewers. Any product that may be evaluated in this article or claim that may be made by its manufacturer is not guaranteed or endorsed by the publisher.
Research integrity at Frontiers
Learn more about the work of our research integrity team to safeguard the quality of each article we publish.