 Hailin Liu
94% of researchers rate our articles as excellent or good
Learn more about the work of our research integrity team to safeguard the quality of each article we publish.
Find out more
ORIGINAL RESEARCH article
Front. Plant Sci. , 15 June 2017
Sec. Plant Genetics and Genomics
Volume 8 - 2017 | https://doi.org/10.3389/fpls.2017.01041
Ginkgo biloba L. is a well-known living gymnosperm fossil that has medicinal and ornamental value. In this study, a high density genetic map was constructed with megagametophytes of 94 seeds from a single Ginkgo tree by employing the specific-locus amplified fragment (SLAF) sequencing technique. The average sequencing depth was 11.20×, which yielded 538,031 high-quality SLAFs. Among these SLAFs, 204,361 were heterozygous in the maternal tree and segregated in the progeny. The established map contained 12,263 SLAFs that were assigned to 12 linkage groups (LGs). The number of LGs on this map equaled the number of chromosomes in Ginkgo. The total map length was 1,671.77 cM, with an average distance of 0.89 cM between adjacent marker bins. Map evaluation based on the haplotype map and the heat map validated the high quality of the established map. Because Ginkgo is an economically and biologically important tree, strenuous efforts have been exerted to sequence its genome. This new map, built using sequence-based markers, will serve in the future as a fundamental platform for anchoring sequence assemblies along Ginkgo chromosomes. This map also provides a desirable platform for various genetic studies of Ginkgo, including gene/quantitative trait locus mapping and marker-aided selection.
Ginkgo biloba L., or maidenhair tree, is one of the oldest “living fossils.” The first appearance of its crown was found approximately 280 million years ago in the early Permian period according to the fossil records (Zhou and Zheng, 2003; Gong et al., 2008). Ginkgo tree morphology has remained virtually unchanged for millions of years (Galián et al., 2012). In addition, G. biloba is the sole living member of the Ginkgoalean clade. This species is a precious link between primitive non-flowering plants and advanced seed plants (Hori et al., 2012). The Ginkgo tree, which originated in China (Gong et al., 2008), has been used in traditional Chinese medicine for thousands of years (Goh and Barlow, 2002). G. biloba has now been introduced to many areas of the world because of its high ornamental value, immense environmental adaptability and strong resistance to almost all plant pests and diseases (Major, 1967). Ginkgo leaf extracts are also widely used in herbal remedies in Europe and as a dietary supplement in the United States (Ahlemeyer and Krieglstein, 2003).
Serious efforts are currently being made to unravel the mystery of the Ginkgo genome (Guan et al., 2016), and one of the best platforms to achieve this goal is genetic map, as genetic mapping is a robust tool used in map-based cloning, QTL mapping and sequencing scaffold allocation (Collard et al., 2005; Heesch et al., 2010). Several types of markers have been previously developed for Ginkgo genetic studies. These include isozyme (Wu et al., 1992; Tsumura and Ohba, 1997), RAPD (Grattapaglia and Sederoff, 1994; Lynch and Milligan, 1994; Kuddus et al., 2002; Fan et al., 2004), ISSR (Prevost and Wilkinson, 1999; Joshi et al., 2000; Ge et al., 2002, 2003) and AFLP (Wang et al., 2008) markers. Lin et al. (2011) recently developed 204 EST – SSR markers in G. biloba using Roche 454 sequencing, while Han et al. (2015) generated more than 4,000 SSRs based on a Ginkgo cDNA library. With the availability of these marker resources, several genetic maps have been reported for Ginkgo. Tan (1997) constructed the first genetic linkage map of G. biloba containing 62 RAPD markers, with a total length of 829.10 cM. Gui (2004) build a genetic map of G. biloba covering 1742.20 cM based on RAPD and ISSR markers. However, the above maps were all constructed with anonymous markers. Until very recently, Tao (2014) developed a linkage map containing a limited number of non-anonymous markers. To facilitate genome sequencing of Ginkgo, a highly dense linkage map constructed with sequence-based markers is strongly needed.
In recent years, advances in next-generation sequencing technologies have enabled the simultaneous generation of an enormous number of sequence-based markers. These markers are highly desirable for genetic map construction because of their abundance, uniform distribution, and cost-effectiveness (Ganal et al., 2009). RAD-seq is one of several high-throughput techniques that have facilitated large-scale marker production. SLAF-seq, which is based on RAD-seq, was developed as a high-resolution strategy for de novo SNP discovery with good repeatability (Sun et al., 2013; Qi et al., 2014). This approach has been successfully applied for genetic map construction in many plant species, such as soybean, orchard grass and willow (Qi et al., 2014; Zhang et al., 2016; Zhao et al., 2016).
In this study, a high-density genetic map for G. biloba was constructed using SLAF-seq. To our knowledge, this is the densest genetic map generated for G. biloba with sequence-based markers. This platform is not only useful for locating sequence assemblies along the chromosomes of Ginkgo, but is also highly applicable to the identification of QTLs and genes underlying agronomic traits of this living fossil plant, including outstanding tolerance to abiotic stress, high resistance to plant diseases and pests, and biological synthesis of multiple medicinal ingredients.
Mature seeds were collected from a female Ginkgo tree on the campus of Nanjing Forestry University in October 2014. The megagametophyte tissues of 94 seeds were carefully isolated by removing the endotesta and embryo. Total DNA was extracted from each megagametophyte using a DNeasy Plant Mini kit (Qiagen, Hilden, Germany). DNA concentration was quantified by using NanoDrop 2000 (Thermo Scientific, Waltham, MA, United States) and stored at -80°C until use.
Specific-locus amplified fragment library preparation and sequencing were performed according to Sun et al. (2013) with minor modifications. First, 320 ng genomic DNA from each megagametophyte was digested with 5 U EcoRI and 5 U MseI (New England Biolabs, NEB) at 37°C for 6 h, then restriction-ligation reactions were heat-inactivated at 65°C for 20 min with T4 DNA ligase (NEB), ATP (NEB), EcoRI-adapter and MseI-adapter. The mixture was finally incubated at 20°C for 12 h. Preamplification reactions (40 μL) were performed with 5 μL of the diluted restriction-ligation mixture using a pair of primers with one selective nucleotide each (EcoRI+A; MseI+C). Thermocycling conditions, optimized to promote specificity, were as follows: 20 cycles of 94°C for 30 s, 56°C for 60 s, and 72°C for 60 s. The PCR products were purified by using E.Z.N.A. Cycle Pure kit (Omega), then pooled and incubated at 37°C with MseI, EcoRI, T4 DNA ligase, ATP and Solexa adapter (Illumina). After incubation, the pooled samples were purified using a Quick Spin column (Qiagen), and electrophoresed on a 2% agarose gel.
DNA fragments between 500 and 550 bp (SLAFs) were excised and isolated using a Gel Extraction kit (Qiagen). The isolated fragments were then subjected to PCR amplification with Phusion Master Mix (NEB) and Solexa amplification primer mix (Illumina) for barcoding according to the Illumina sample preparation guide. After gel purification, SLAFs between 114 and 464 bp were isolated and diluted for paired-end sequencing (2 × 125 bp) on an Illumina-HiSeq 2500 platform (Illumina) at Beijing Biomarker Technologies Corporation1. Raw reads were assigned to different samples according to the barcode sequences.
Single nucleotide polymorphism identification and genotyping were performed as described by Sun et al. (2013) with a few modifications. After filtering of low-quality reads (quality score <30, indicating a 0.10% chance of an error and thus 99.90% confidence), all paired-end reads with clear index information were grouped into clusters based on sequence similarity using BLAT (Kent, 2002). Nearly identical reads assigned in a single group were considered as one SLAF locus (Sun et al., 2013). Alleles at each locus were subsequently defined by MAF evaluation. SLAF tags with markedly lower MAF values were corrected to the most similar genotype to improve data accuracy.
Because the megagametophyte tissue of G. biloba is haploid, heterozygous SLAFs in the maternal tree were expected to contain two allelic tags, which could be recorded as an ‘hk × hk’ segregation matrix. For using in genetic map construction, we selected the identified ‘hk × hk’ SLAFs that had an average depth >2, contained fewer than five SNPs, and were present in at least 70% of progeny.
Specific-locus amplified fragments were assigned to different LGs based on the pairwise modified logarithm of odds (MLOD) score. Markers with MLOD score < 5 were abandoned prior to ordering. HighMap software was used to order the SLAF markers and to correct genotyping errors within LGs (Liu et al., 2014). Briefly, recombination frequencies and MLOD scores were calculated by two-point analysis. Then, a combination of enhanced Gibbs sampling, spatial sampling and simulated annealing algorithms was used to perform an iterative process of marker ordering. SMOOTH algorithm was adopted to correct the genotyping errors, and the k-nearest neighbor algorithm was applied to impute missing genotypes. Markers showing significant segregation distortion (P < 0.01) were excluded from map construction. Map distances were estimated using the Kosambi mapping function. Haplotype map and heat map were used to evaluate the quality of the genetic map (West et al., 2006).
We obtained approximately 120 Gb of data containing 929.43 M raw reads. The length of each read was 126 bp, with a Q30 ratio of 89.21% and a guanine-cytosine content of 42.60% (Table 1). After removing low-quality reads, 538,031 SLAFs were recovered, with the number of SLAFs varying from 87,476 to 538,031 among the different progeny (Figure 1). The average sequencing depth of these SLAFs was 11.20×, with coverage ranging from 6.52× to 28.01× (Figure 1). Among the identified SLAFs, 204,361 (37.98%) were heterozygous in the maternal tree (Table 2), and 201,667 (37.48%) segregated in a 1:1 ratio in the progeny. The raw data of SLAF-seq have been submitted to NCBI SRA database under the accession number SRP105402.
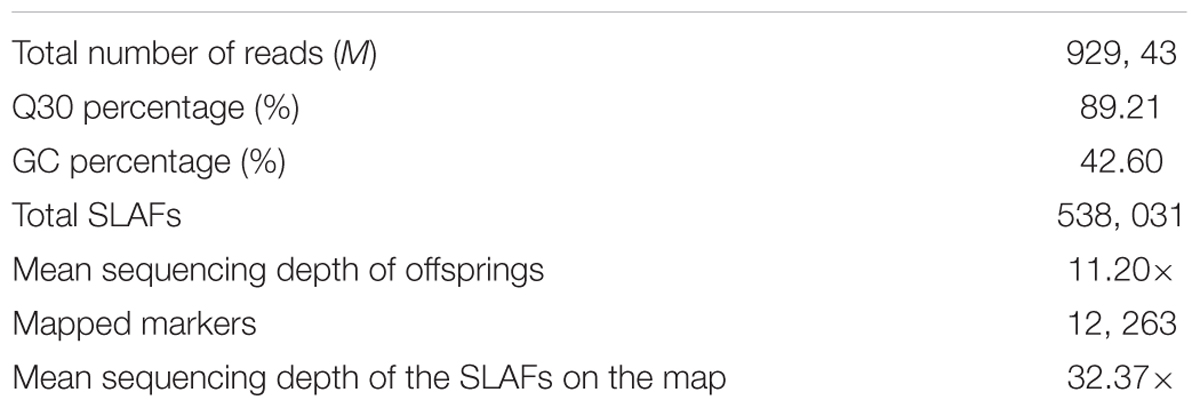
TABLE 1. Summary of SLAF-seq results obtained using megagametophytes of 94 seeds from a single Ginkgo biloba tree.
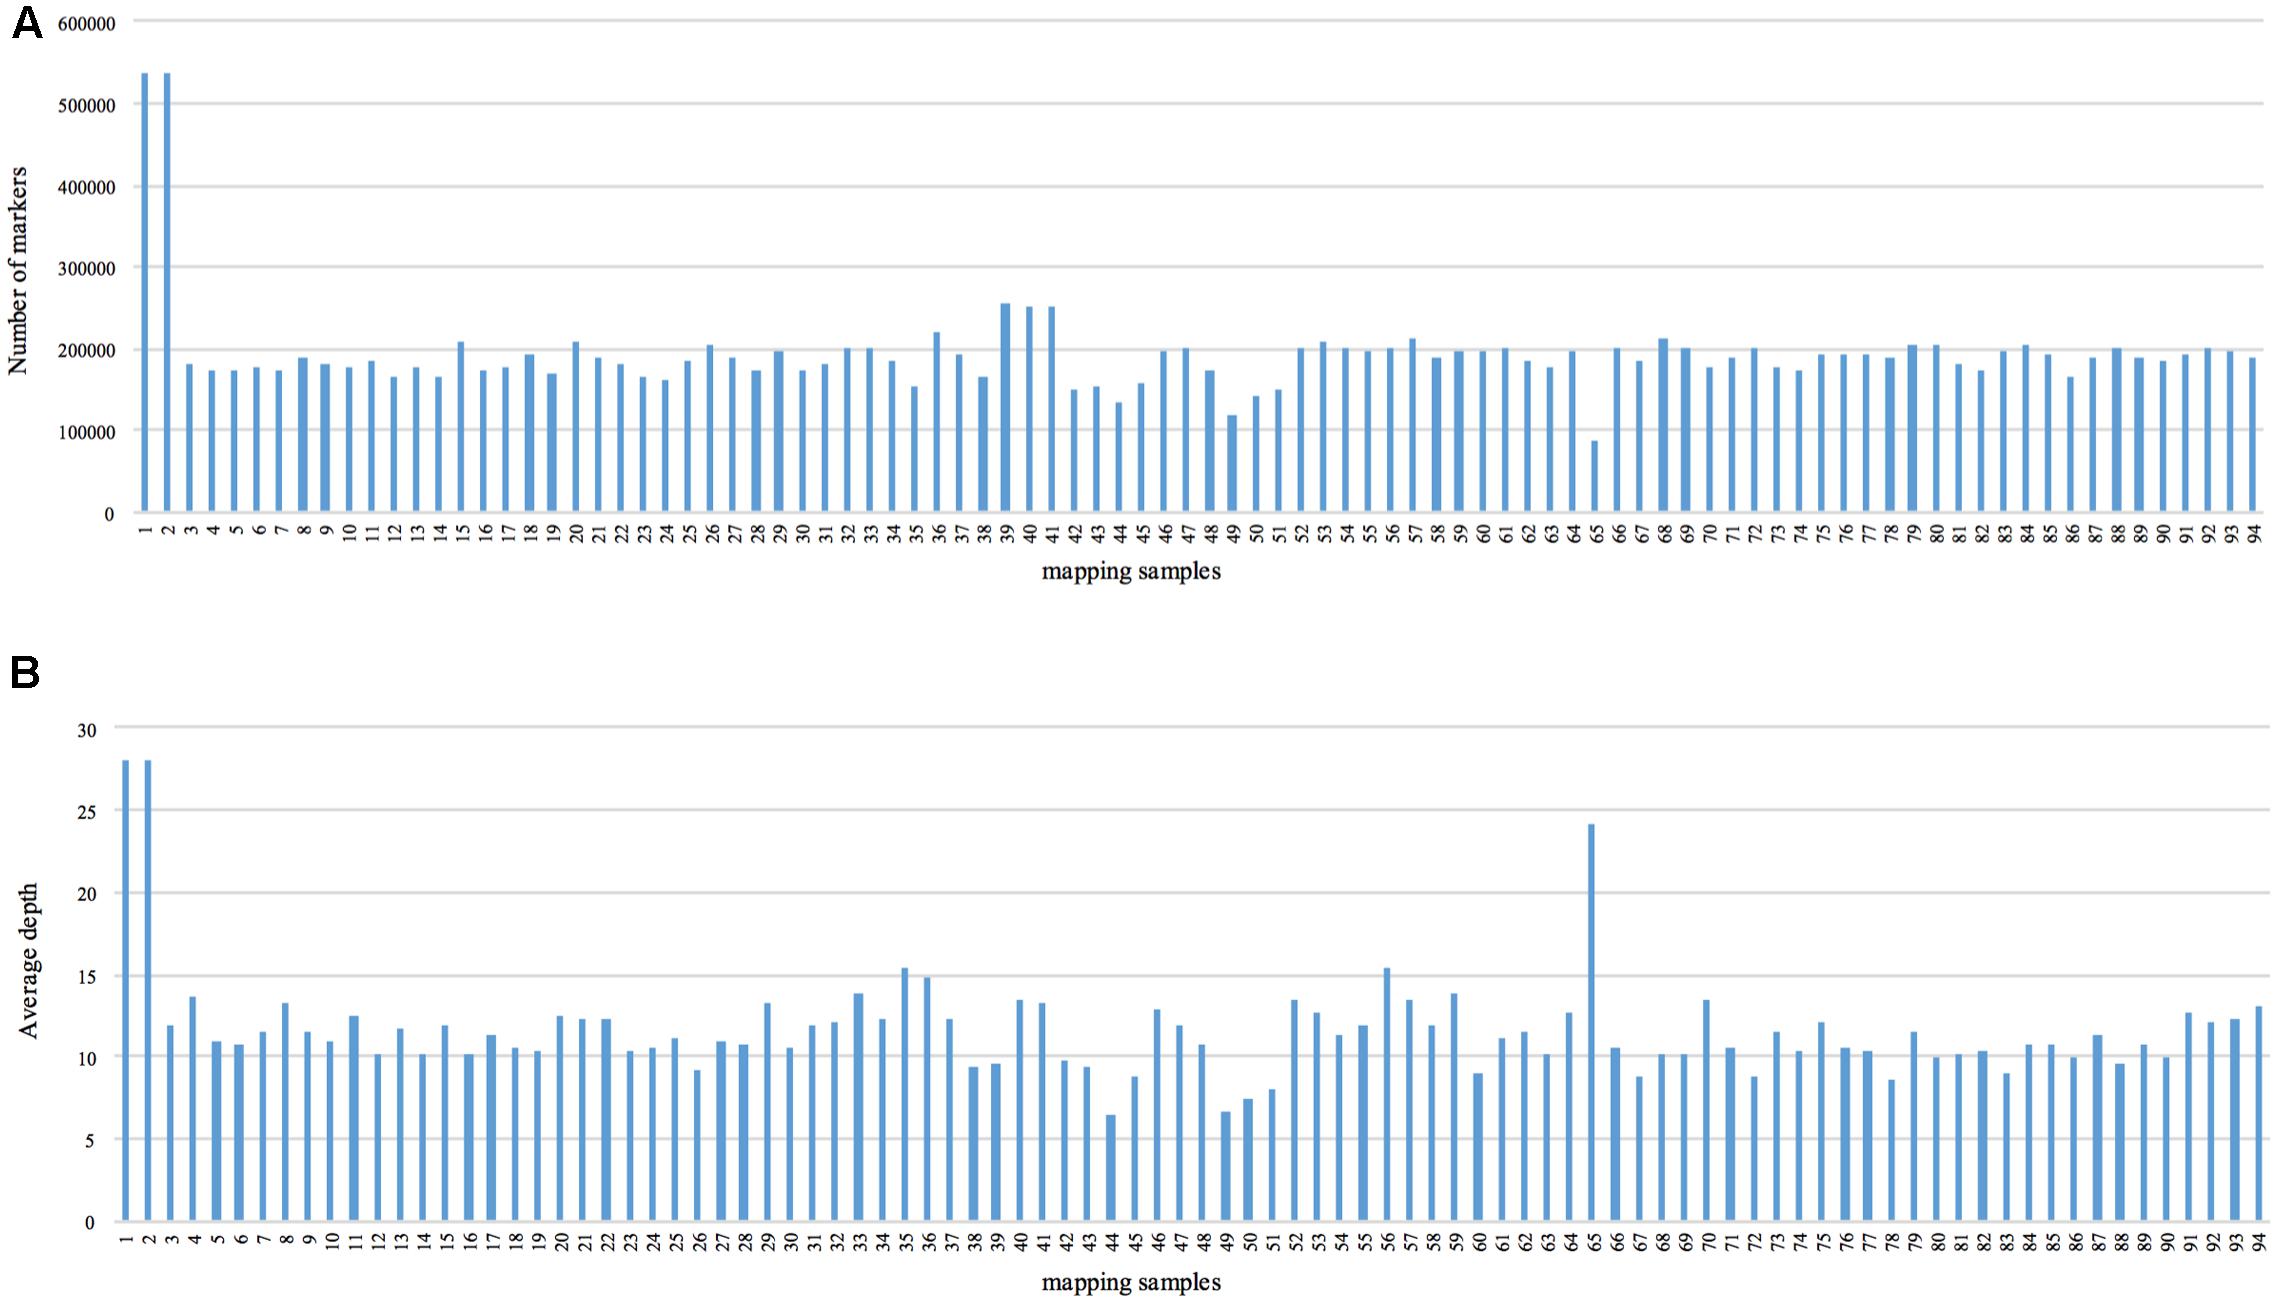
FIGURE 1. Number of markers and average sequencing depth of each progeny. The x-axes in (A,B) indicate the identity of the mapping samples, and the y-axes indicate the number of markers (A) and average depth (B).
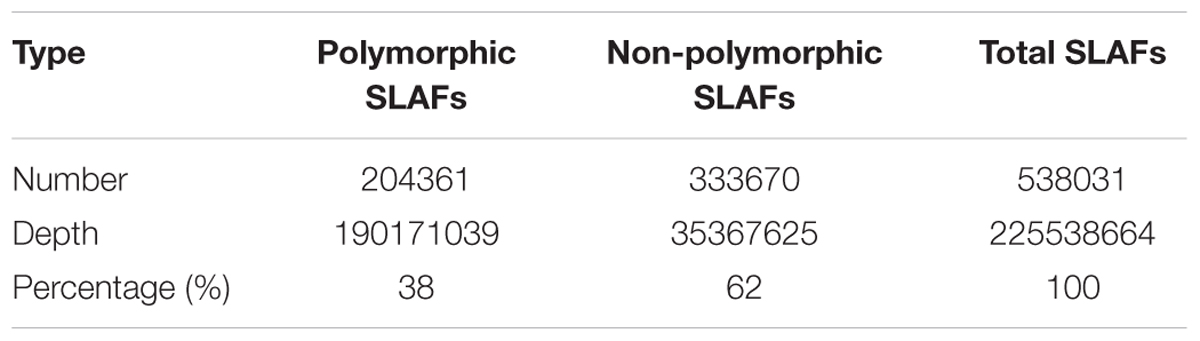
TABLE 2. Classification of SLAF markers.
To ensure the quality of the genetic map, SLAFs meeting any of the following criteria were excluded: (1) number of SNPs >5; (2) integrity <70%; (3) significantly distorted segregation (P < 0.01). A total of 13,180 SLAF markers were retained, of which 93.04% (12,263) were assigned to 12 LGs (Figure 2 and Supplementary Figure S1). The mean sequencing depth of the mapped SLAFs was 32.37× (Table 1), and the number of SLAFs in each LG ranged from 483 to 1,339 (Table 3). Overall, the mapped SLAFs included 20,297 SNP markers. The number of mapped SNPs per LG ranged from 802 to 2,169 (Figure 3). The established map consisted of 1,961 marker bins; it covered a genetic distance of 1671.77 cM, with LG sizes ranging from 86.1 to 183.80 cM. The average distance between marker bins was 0.89 cM (Table 3). LG6 and LG10 had the highest marker density, 0.70 cM between marker bins, whereas LG7 had the lowest density of 1.22 cM between marker bins on average.
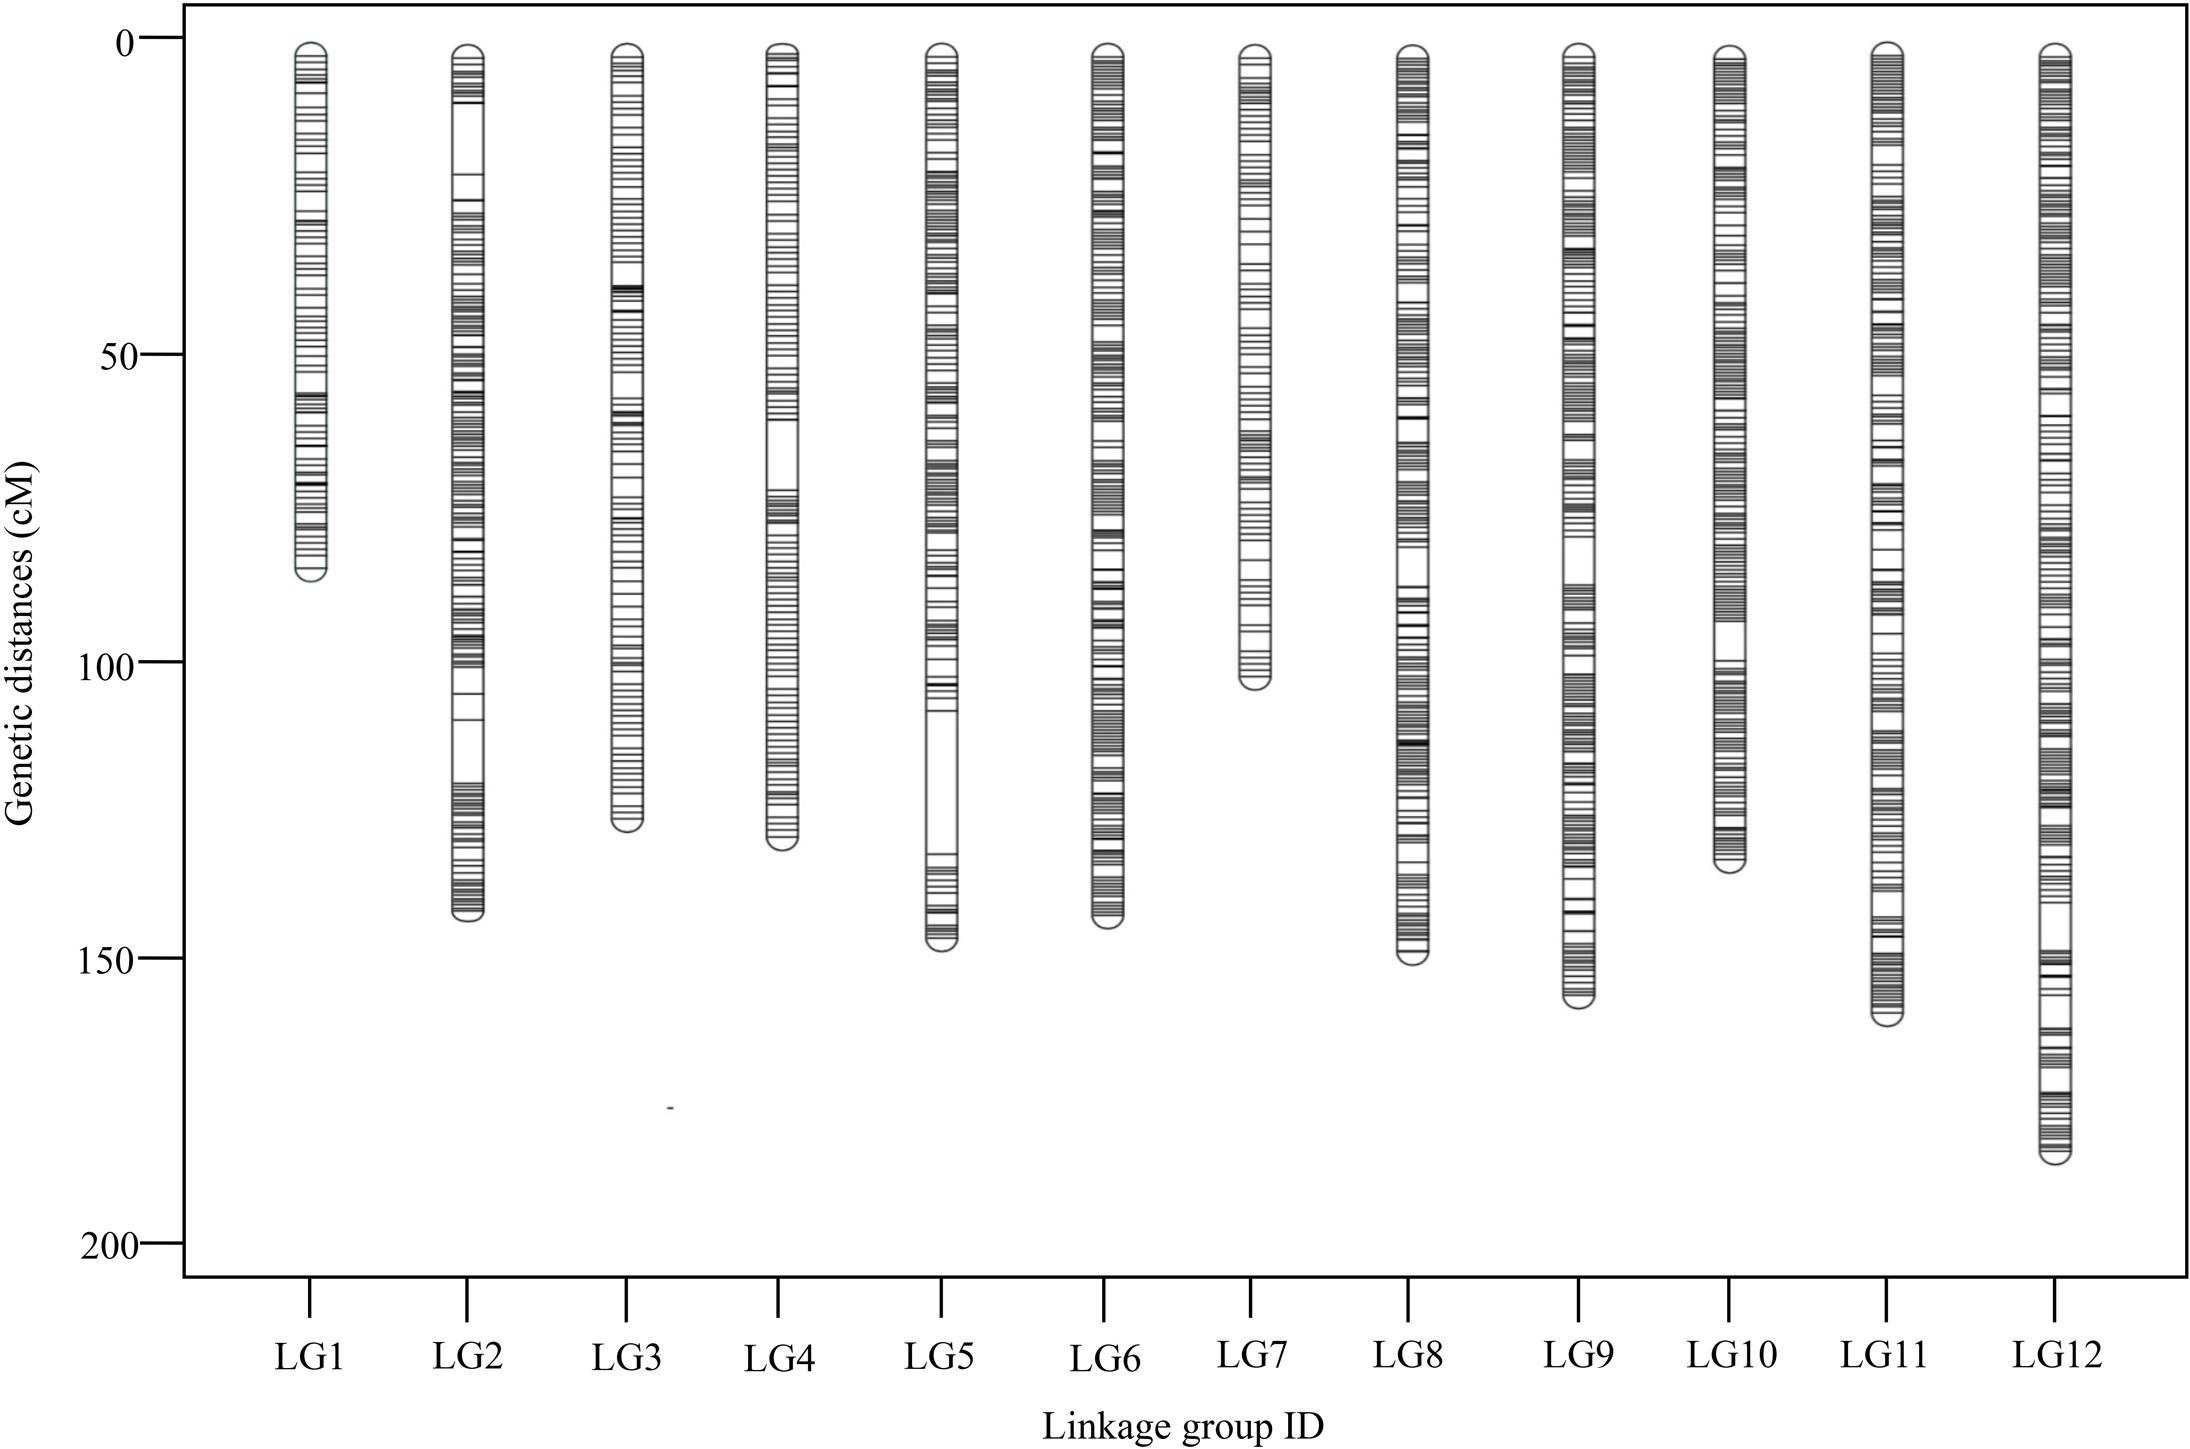
FIGURE 2. Distribution of SLAFs along each of the linkage group of G. biloba. A black line indicates a SLAF marker.
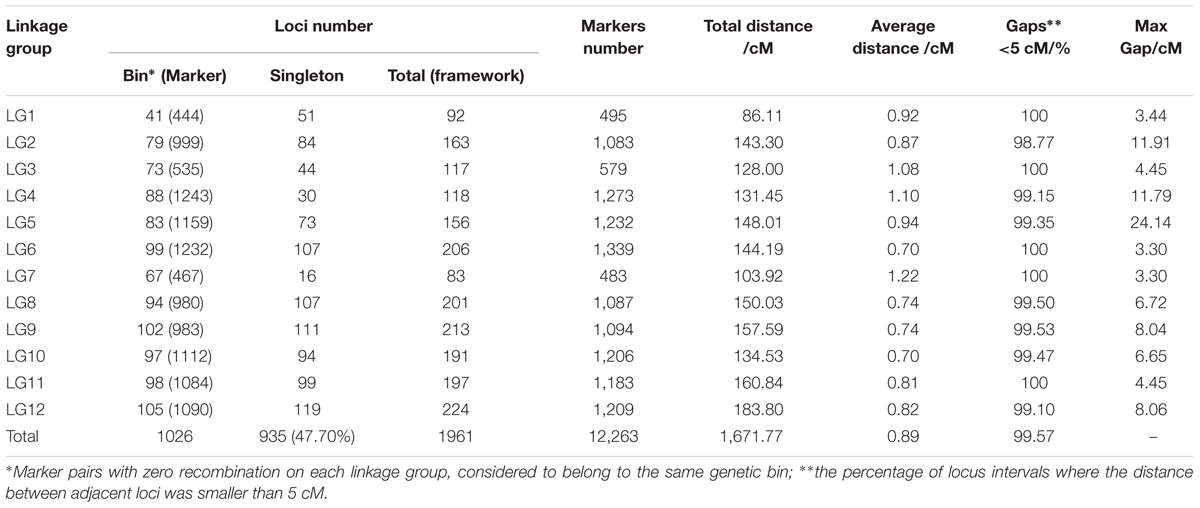
TABLE 3. Characteristics of the 12 linkage groups of G. biloba.
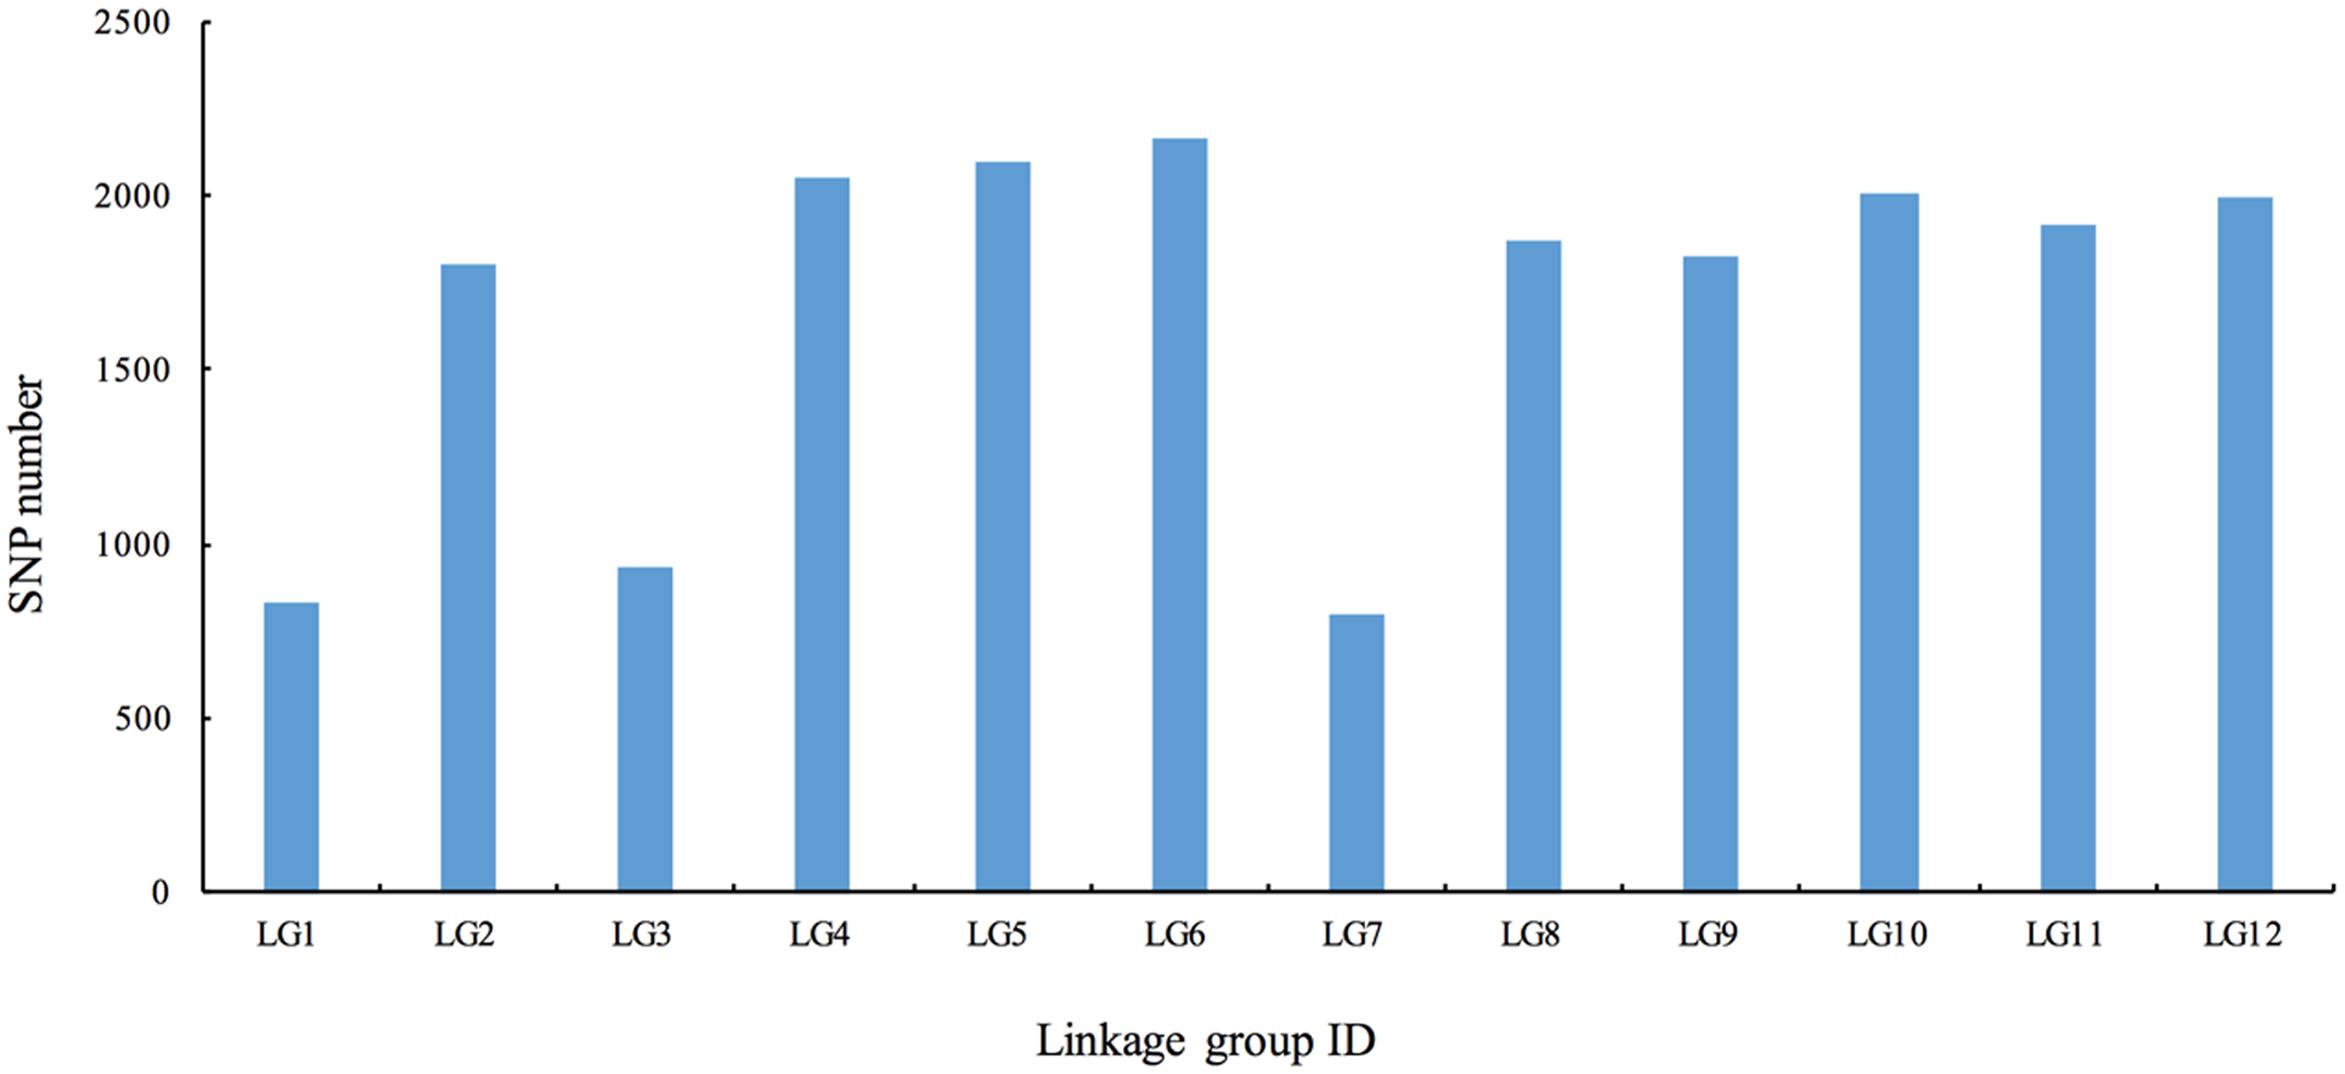
FIGURE 3. The number of single nucleotide polymorphism (SNP) markers on the each of the linkage group.
Marker distribution was analyzed by counting the number of loci and all mapped markers (including bins and singletons) by sliding 10-cM windows along each LG (Supplementary Table S1). According to this analysis, the mapped markers were distributed relatively uniformly along each LG. The ‘Gap < 5 cM’ value, which indicated the degree of linkage between adjacent loci among LGs, ranged from 98.77 to 100%, with an average of 99.57%. Only nine gaps >5 cM were detected on seven LGs. Notably, a large gap was present on LG5 spanning a genetic length of 24.14 cM (Figure 4). Possible explanations for this gap are that the corresponding region is a restriction desert for EcoRI/MseI or alternatively it may be associated with a recombination hotspot. The region with the highest marker density, on LG4, contained 243 SLAFs within a 10-cM interval. According to the 10-cM sliding window analysis, the average number of marker bins ranged from 8 to 14, with the average number of SLAFs varying from 44 to 91 (Supplementary Table S1).
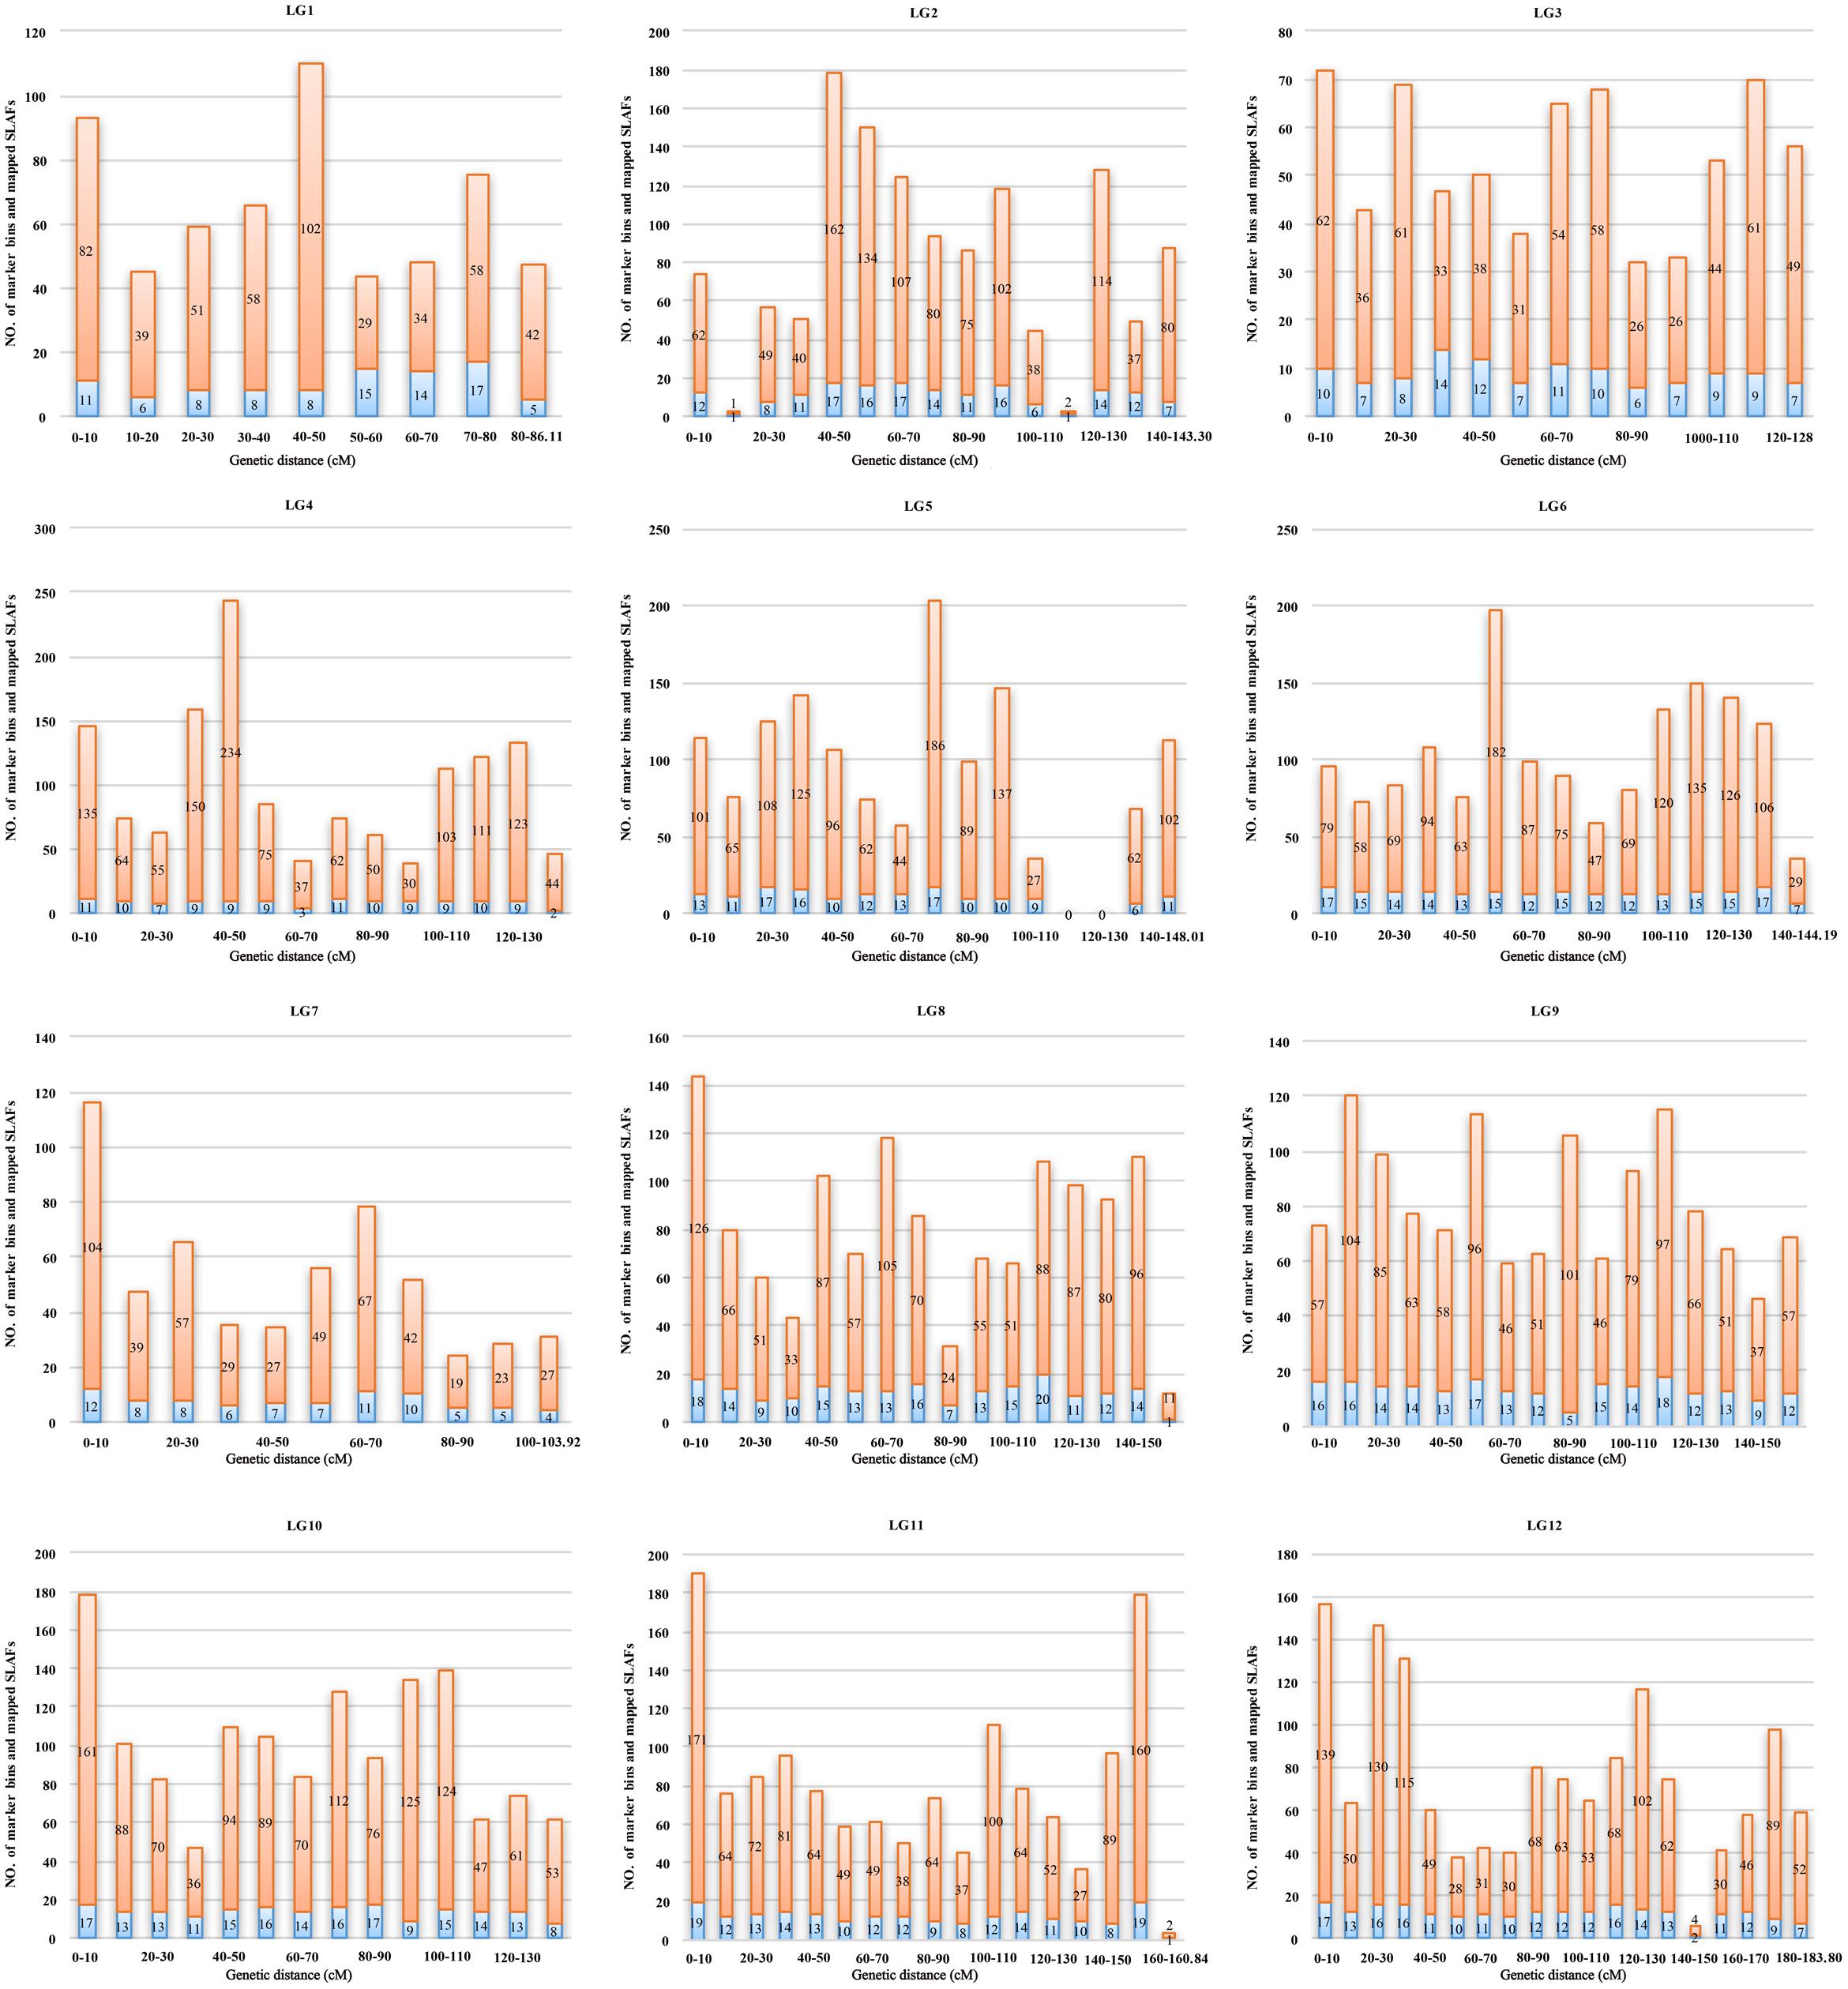
FIGURE 4. Distribution of marker bins and SLAFs in the 10 cM sliding windows among each linkage group. The number of marker bins and the number of mapped SLAFs were indicated with blue and orange bars, respectively.
Among the 12,263 mapped SLAFs, 168 showed segregation distortion at a significance level of P < 0.05 (Supplementary Table S2). Segregation-distorted markers were observed in clusters on LG1, LG5 and LG7, with 1 to 117 segregation-distorted SLAFs in each cluster (Table 4 and Supplementary Table S3). The largest segregation distortion cluster was observed on LG7 and contained 24.22% of the markers mapped to this LG (Table 4).
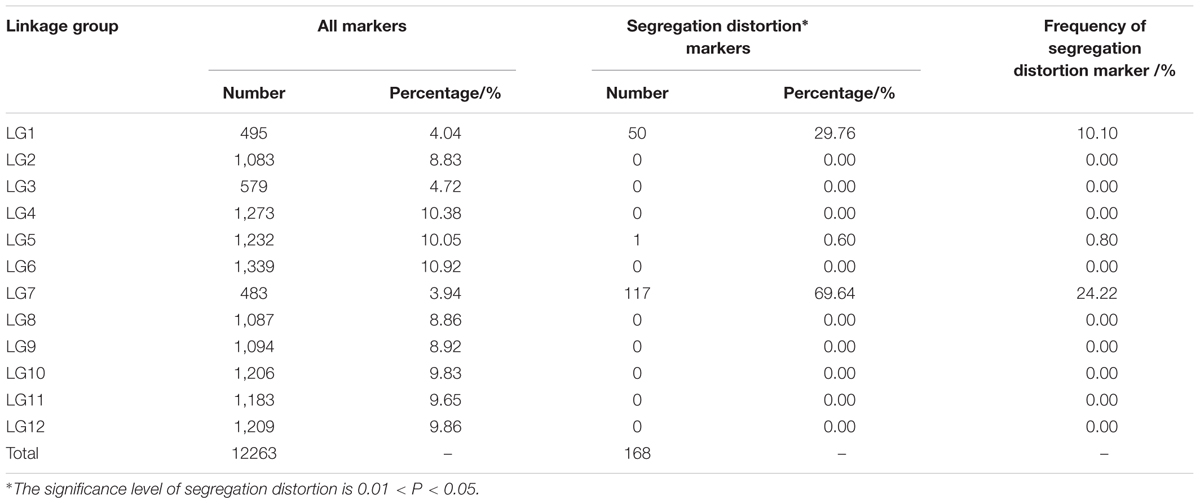
TABLE 4. Distribution of segregation distortion markers.
A haplotype map can reveal double crossovers within a short genetic distance, which are closely associated with genotyping errors (Qi et al., 2014). In this study, haplotype maps were generated for each of the 94 progeny using the 12,263 SLAF markers (Supplementary Figure S2). Recombination events and missing data for each individual could be clearly visualized with the haplotype maps. As inferred from these maps, the ratio of double crossovers was less than 0.20%, while the percentage of missing data on each LG was less than 0.27% (Table 5). The established map is thus of high quality and consequently reliable for future application to studies of different genetic aspects of Ginkgo.
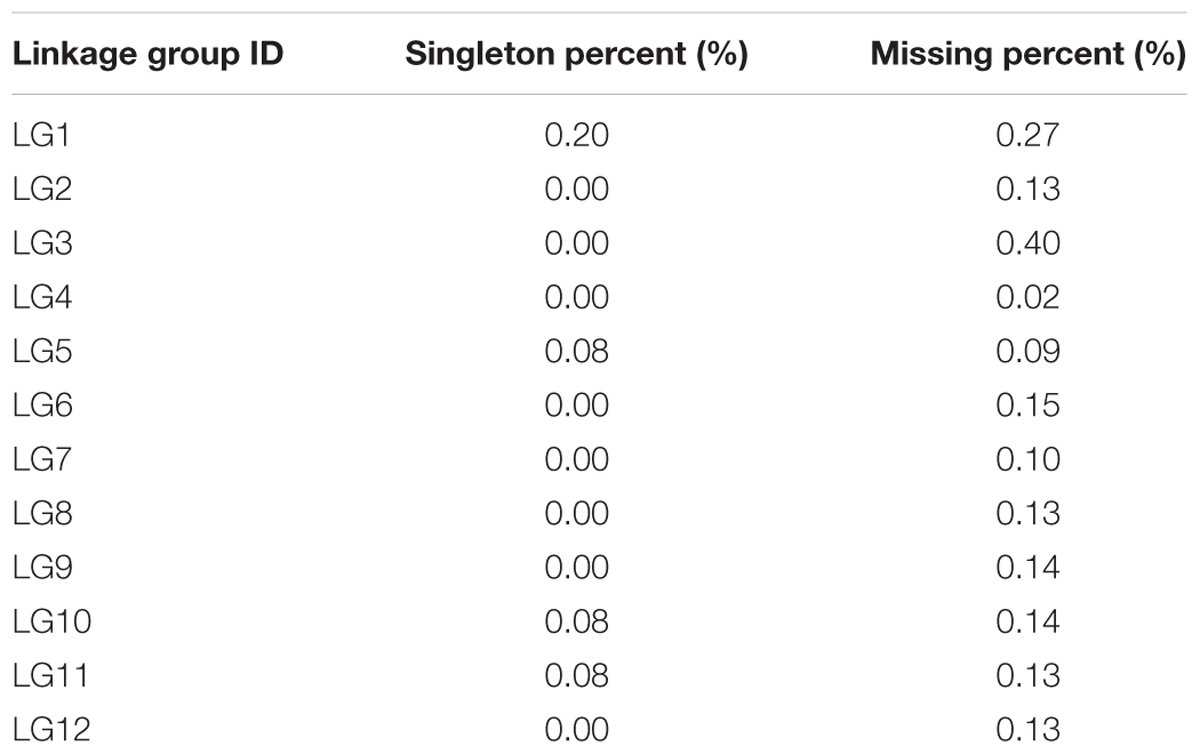
TABLE 5. Percentages of double crossovers and missing data in each linkage group.
Heat maps derived from pairwise recombination values of mapped SLAFs can also be used to evaluate the quality of an established map (Supplementary Figure S3), especially with respect to potential ordering errors. In the generated heat maps, an obvious trend was observed, with pairwise linkage generally weakening as genetic distance increased between mapped markers. This pattern indicated that the markers in each LG were well ordered.
Linkage map is one of the basic platforms for research on the genetics and genomics of focal organisms (Liu et al., 2014). Although mapping populations for higher plants should ideally be derived from crosses between inbred lines, such populations are impossible or very difficult to obtain for forest trees because of their high genetic load and time constraints. Seeds of gymnosperms carry maternally inherited haploid megagametophytes, which are as efficient as inbred lines in terms of map construction (Wu et al., 1999). Haploid megagametophytes have therefore been used to establish linkage maps for many coniferous species, such as Picea glauca (Tulsieram et al., 1992), Picea abies (Binelli and Bucci, 1994), Pinus pinaster (Plomion et al., 1995) and Pinus taeda (Wilcox et al., 1996). Gui (2004) built a linkage map for Ginkgo using megagametophytes from a single tree as a mapping population, but the map only contained a few anonymous markers.
Here, we have established a high-density genetic map for Ginkgo that comprises 12 LGs. The number of LGs is equivalent to the haploid chromosome number of Ginkgo (Ishikawa, 1910; Murray, 2013). Gui (2004) also build a Ginkgo genetic map with 12 LGs. However, the current genetic map contains a much larger number of markers (∼74.77-fold) than that developed by Gui (2004). It is noteworthy that the two maps span a similar genetic length, indicating the Ginkgo map established in this study is highly saturated. The density of this map is higher than that of any other maps reported for gymnosperms thus far. For instance, marker densities in the most recently reported gymnosperm genetic maps are 2.80 cM in P. abies (Lind et al., 2014) and 1.77 cM in Callitris glaucophylla (Sakaguchi et al., 2015). The haploid genome size of G. biloba has been estimated to be 10.61 Gb (Guan et al., 2016). Thus the average physical/genetic distance ratio is approximately 6.35 Mb/cM for the Ginkgo genome. This value is smaller than that of sequenced conifers such as P. abies (10.40 Mb/cM; Lind et al., 2014) and P. taeda (17.92 Mb/cM; Eckert et al., 2009; Zimin et al., 2014). The genome of Ginkgo has been sequenced (Guan et al., 2016) and continuing efforts are exerted on improving the genome assembly of Ginkgo with the PacBio sequences. Our map provides a desirable platform for reconstructing the Ginkgo chromosomes with the improved sequence assemblies in future.
Segregation distortion is a phenomenon frequently observed in mapping studies of different organisms (Ma et al., 2015). Segregation distortion might associate with some non-biological factors, such as finite sampling, sampling errors and genotyping errors (Kuang et al., 1999; Alheit et al., 2011), especially if the segregation distortion markers are randomly dispersed across the map and do not aggregate into clusters (Liu et al., 2011). It is noteworthy that the mapped segregation distorted markers are clustered on LG1and LG7 in this study. The observation of large clusters of segregation distorted markers suggested that their occurrence could not be explained by non-biological factors alone (Li et al., 2012), and biological factors were more likely to be the ultimate causes giving rise to segregation distortion observed in this study.
To our knowledge, this map is the first one conducted for Ginkgo using high-throughout sequencing technology. We used the recently developed SLAF-seq method to conduct de novo SNP discovery and large-scale genotyping. Despite the rapid development of sequencing technologies, population-scale whole-genome sequencing is still cost prohibitive (Sun et al., 2013). SLAF-seq combined with reduced genome amplicons provides a cost-effective alternative for population-level SNP recovery, especially for plants with gigantic genomes like Ginkgo. Furthermore, compared with RAD-seq data, the paired-end reads obtained by SLAF-seq can increase marker specificity, accuracy and efficiency with double barcode system (Shan et al., 2015). SLAF-seq methods have been applied in a variety of plant species, including sesame (Zhang et al., 2013), kiwifruit (Huang et al., 2013), soybean (Han et al., 2015), rice (Xu et al., 2015), tea plants (Ma et al., 2015) and Chinese fir (Su et al., 2016). In this study, the SLAF technique was successfully applied for Ginkgo genetic map construction, thereby providing a useful platform for various future genetic studies of this living fossil plant.
A total of 538,031 high-quality SLAF markers were developed. Among these, 204,361 polymorphic markers were identified, with a polymorphism rate of 37.98%. Among the generated SLAF markers, 12,263 met the requirements for constructing a genetic map. These SLAF markers were distributed uniformly on each LG. Finally, 20,297 SNP markers were ultimately integrated into the genetic linkage map. SLAF-seq can thus be successfully used for large-scale SNP identification and genotyping in G. biloba.
The genetic map developed in this study is the first SNP-based reference map of G. biloba and is also the densest map to date. This high-density map can serve as a valuable tool for QTL fine mapping and positional cloning of candidate genes for economically important traits of Ginkgo. The map should also aid molecular breeding and anchoring of scaffolds to facilitate whole-genome sequencing projects for this species.
HL conducted the experiments and prepared the manuscript. FC helped in the design of the study and the collection of plant materials. YC and TY participated in the design and helped to draft the manuscript. All authors read and approved the final manuscript.
This work was funded by the Key Forestry Public Welfare Project (201504105) and the Youth Elite Science Sponsorship Program by CAST (YESS). This work was also supported by the Priority Academic Program Development Program of Jiangsu Province and the Doctorate Fellowship Foundation of Nanjing Forestry University.
The Supplementary Material for this article can be found online at: http://journal.frontiersin.org/article/10.3389/fpls.2017.01041/full#supplementary-material
FIGURE S1 | Genetic map of G. biloba.
FIGURE S2 | Haplotype map for each linkage group by each individual. Different individuals in rows were spaced by blank line, markers on the right were listed coordinate to the order in the linkage map. The swift of green and blue colors indicates the recombination events. The gray color represents missing marker.
FIGURE S3 | Heat map of each linkage group by pair-wise markers. Each cell represents the recombination rate of pair-wise markers. Yellow color indicates strong linkage, and changes of colors from yellow to purple indicating weaker linkage.
TABLE S1 | The number of loci and all the mapped markers (including bins and singletons) by sliding 10 cM windows along each LG.
TABLE S2 | The list of segregation distorted SLAFs.
TABLE S3 | The distribution of the segregation distorted SLAFs in each LG.
The authors declare that the research was conducted in the absence of any commercial or financial relationships that could be construed as a potential conflict of interest.
AFLP, amplified fragment length polymorphism; EST, expressed sequence tag; ISSR, inter-simple sequence repeat; LG, linkage group; MAF, minor allele frequency; QTL, quantitative trait locus; RAD-seq, restriction site-associated DNA sequencing; RAPD, random amplified polymorphic DNA; SLAF-seq, specific-locus amplified fragment sequencing; SNP, single nucleotide polymorphism; SSR, simple sequence repeat.
Ahlemeyer, B., and Krieglstein, J. (2003). Neuroprotective effects of Ginkgo biloba extract. Cell. Mol. Life Sci. 60, 1779–1792. doi: 10.1007/s00018-003-3080-1
Alheit, K. V., Reif, J. C., Maurer, H. P., Hahn, V., Weissmann, E. A., and Miedaner, T. (2011). Detection of segregation distortion loci in triticale (x Triticosecale Wittmack) based on a high-density DArT marker consensus genetic linkage map. BMC Genomics 12:380. doi: 10.1186/1471-2164-12-380
Binelli, G., and Bucci, G. (1994). A genetic linkage map of Picea abies Karst., based on RAPD markers, as a tool in population genetics. Theor. Appl. Genet. 88, 283–288. doi: 10.1007/BF00223633
Collard, B. C. Y., Jahufer, M. Z. Z., Brouwer, J. B., and Pang, E. C. K. (2005). An introduction to markers, quantitative trait loci (QTL) mapping and marker-assisted selection for crop improvement: the basic concepts. Euphytica 142, 169–196. doi: 10.1007/s10681-005-1681-5
Eckert, A. J., Pande, B., Ersoz, E. S., Wright, M. H., Rashbrook, V. K., Nicolet, C. M., et al. (2009). High-throughput genotyping and mapping of single nucleotide polymorphisms in loblolly pine (Pinus taeda L.). Tree Genet. Genomes 5, 225–234. doi: 10.1007/s11295-008-0183-8
Fan, X. X., Shen, L., Zhang, X., Chen, X. Y., and Fu, C. X. (2004). Assessing genetic diversity of Ginkgo biloba L. (Ginkgoaceae) populations from China by RAPD markers. Biochem. Genet. 42, 269–278. doi: 10.1023/B:BIGI.0000034431.15308.57
Galián, J. A., Rosato, M., and Rosselló, J. A. (2012). Early evolutionary colocalization of the nuclear ribosomal 5S and 45S gene families in seed plants: evidence from the living fossil gymnosperm Ginkgo biloba. Heredity 108, 640–646. doi: 10.1038/hdy.2012.2
Ganal, M. W., Altmann, T., and Röder, M. S. (2009). SNP identification in crop plants. Curr. Opin. Plant Biol. 12, 211–217. doi: 10.1016/j.pbi.2008.12.009
Ge, Y. Q., Qiu, Y. M., Ding, B. Y., and Fu, C. X. (2002). An ISSR analysis on population genetic diversity of the relict plant Ginkgo biloba. Chin. Biodivers. 11, 276–287.
Ge, Y. Q., Qiu, Y. X., and Fu, C. X. (2003). Genetic diversity of the “living fossil” Ginkgo biloba based on ISSR marker. Biodivers. Sci. 11, 276–287.
Goh, L. M., and Barlow, P. J. (2002). Antioxidant capacity in Ginkgo biloba. Food Res. Int. 35, 815–820. doi: 10.1016/S0963-9969(02)00084-4
Gong, W., Chen, C., Dobeš, C., Fu, C. X., and Koch, M. A. (2008). Phylogeography of a living fossil: pleistocene glaciations forced Ginkgo biloba L. (Ginkgoaceae) into two refuge areas in China with limited subsequent postglacial expansion. Mol. Phylogenet. Evol. 48, 1094–1105. doi: 10.1016/j.ympev.2008.05.003
Grattapaglia, D., and Sederoff, R. (1994). Genetic linkage maps of Eucalyptus grandis and Eucalyptus urophylla using a pseudo-testcross: mapping strategy and RAPD markers. Genetics 137, 1121–1137.
Guan, R., Zhao, Y., Zhang, H., Fan, G., Liu, X., Zhou, W., et al. (2016). Draft genome of the living fossil Ginkgo biloba. GigaScience 5, 49. doi: 10.1186/s13742-016-0154-1
Gui, R. Y. (2004). The Construction of Fingerprint and Genetic Linkage Map of Several Cultivars of Ginkgo biloba. Master’s thesis, Nanjing Forestry University, Nanjing.
Han, Y., Zhao, X., Cao, G., Wang, Y., Li, Y., Liu, D., et al. (2015). Genetic characteristics of soybean resistance to HG type 0 and HG type 1.2.3.5.7 of the cyst nematode analyzed by genome-wide association mapping. BMC Genomics 16:598. doi: 10.1186/s12864-015-1800-1
Heesch, S., Cho, G. Y., Peters, A. F., Le Corguille, G., Falentin, C., Boutet, G., et al. (2010). A sequence-tagged genetic map for the brown alga Ectocarpus siliculosus provides large-scale assembly of the genome sequence. New Phytol. 188, 42–51. doi: 10.1111/j.1469-8137.2010.03273.x
Hori, T., Ridge, R. W., Tulecke, W., Tredici, P. D., Tremouillaux-Guiller, J., and Tobe, H. (2012). Ginkgo biloba, A Global Treasure: From Biology to Medicine. Berlin: Springer Science & Business Media.
Huang, S., Ding, J., Deng, D., Tang, W., Sun, H., Liu, D., et al. (2013). Draft genome of the kiwifruit Actinidia chinensis. Nat. Commun. 4, 2640. doi: 10.1038/ncomms3640
Ishikawa, M. (1910). Ueber die Zahl der Chromosomen von Ginkgo biloba L. Bot. Mag. 24, 225–226. doi: 10.15281/jplantres1887.24.285_225
Joshi, S. P., Gupta, V. S., Aggarwal, R. K., Ranjekar, P. K., and Brar, D. S. (2000). Genetic diversity and phylogenetic relationship as revealed by inter simple sequence repeat (ISSR) polymorphism in the genus Oryza. Theor. Appl. Genet. 100, 1311–1320. doi: 10.1007/s001220051440
Kent, W. J. (2002). BLAT—the BLAST-like alignment tool. Genome Res. 12, 656–664. doi: 10.1101/gr.229202
Kuang, H., Richardson, T., Carson, S., Wilcox, P., and Bongarten, B. (1999). Genetic analysis of inbreeding depression in plus tree 850.55 of Pinus radiata D. Don. I. Genetic map with distorted markers. Theor. Appl. Genet. 98, 697–703. doi: 10.1007/s001220051123
Kuddus, R. H., Kuddus, N. N., and Dvorchik, I. (2002). DNA polymorphism in the living fossil Ginkgo biloba from the eastern United States. Genome 45, 8–12. doi: 10.1139/g01-115
Li, S. X., Tang, Z. X., Zhang, D. F., Ye, N., Xu, C. W., and Yin, T. M. (2012). Genome-wide detection of genetic loci triggering uneven descending of gametes from a natural hybrid pine. Tree Genet. Genomes 8, 1371–1377. doi: 10.1007/s11295-012-0524-5
Lin, X. H., Zhang, J., Li, Y., Luo, H. M., Wu, Q., Sun, C., et al. (2011). Functional genomics of a living fossil tree, Ginkgo, based on next-generation sequencing technology. Physiol. Plant. 143, 207–218. doi: 10.1111/j.1399-3054.2011.01500.x
Lind, M., Källman, T., Chen, J., Ma, X. F., Bousquet, J., Morgante, M., et al. (2014). A Picea abies linkage map based on SNP markers identifies QTLs for four aspects of resistance to Heterobasidion parviporum infection. PLoS ONE 9:e101049. doi: 10.1371/journal.pone.0101049
Liu, D., Ma, C., Hong, W., Huang, L., Liu, M., Liu, H., et al. (2014). Construction and analysis of high-density linkage map using high-throughput sequencing data. PLoS ONE 9:e98855. doi: 10.1371/journal.pone.0098855
Liu, X., You, J., Guo, L., Liu, X., He, Y., Yuan, J., et al. (2011). Genetic analysis of segregation distortion of SSR markers in F2 population of barley. J. Agric. Sci. 3:172. doi: 10.5539/jas.v3n2p172
Lynch, M., and Milligan, B. G. (1994). Analysis of population genetic structure with RAPD markers. Mol. Ecol. 3, 91–99. doi: 10.1111/j.1365-294X.1994.tb00109.x
Ma, J. Q., Huang, L., Ma, C. L., Jin, J. Q., Li, C. F., Wang, R. K., et al. (2015). Large-scale SNP discovery and genotyping for constructing a high-density genetic map of tea plant using specific-locus amplified fragment sequencing (SLAF-seq). PLoS ONE 10:e0128798. doi: 10.1371/journal.pone.0128798
Major, R. T. (1967). The Ginkgo, the most ancient living tree–the resistance of Ginkgo biloba L. to pests accounts in part for the longevity of this species. Science 157, 1270–1273. doi: 10.1126/science.157.3794.1270
Murray, B. G. (2013). “Karyotype variation and evolution in gymnosperms,” in Plant Genome Diversity, Vol. 2, ed. J. Greilhuber (Vienna: Springer), 231–243. doi: 10.1007/978-3-7091-1160-4_14
Plomion, C., Bahrman, N., Durel, C. E., and O’Malley, D. M. (1995). Genomic mapping in Pinus pinaster (maritime pine) using RAPD and protein markers. Heredity 74, 661–668. doi: 10.1038/hdy.1995.90
Prevost, A., and Wilkinson, M. J. (1999). A new system of comparing PCR primers applied to ISSR fingerprinting of potato cultivars. Theor. Appl. Genet. 98, 107–112. doi: 10.1007/s001220051046
Qi, Z., Huang, L., Zhu, R., Xin, D. W., Liu, C. Y., Han, X., et al. (2014). A high-density genetic map for soybean based on specific length amplified fragment sequencing. PLoS ONE 9:e104871. doi: 10.1371/journal.pone.0104871
Sakaguchi, S., Sugino, T., Tsumura, Y., Ito, M., Crisp, M. D., Bowman, D. M. J. S., et al. (2015). High-throughput linkage mapping of Australian white cypress pine (Callitris glaucophylla) and map transferability to related species. Tree Genet. Genomes 11, 112. doi: 10.1007/s11295-015-0944-0
Shan, T., Pang, S., Li, J., Li, X., and Su, L. (2015). Construction of a high-density genetic map and mapping of a sex-linked locus for the brown alga Undaria pinnatifida (Phaeophyceae) based on large scale marker development by specific length amplified fragment (SLAF) sequencing. BMC Genomics 16:902. doi: 10.1186/s12864-015-2184-y
Su, Y., Hu, D., and Zheng, H. (2016). Detection of SNPs based on DNA specific-locus amplified fragment sequencing in Chinese fir (Cunninghamia lanceolata (Lamb.) Hook). Dendrobiology 76, 73–79. doi: 10.12657/denbio.076.007
Sun, X., Liu, D., Zhang, X., Li, W., Liu, H., Hong, W., et al. (2013). SLAF-seq: an efficient method of large-scale de novo SNP discovery and genotyping using high-throughput sequencing. PLoS ONE 8:e58700. doi: 10.1371/journal.pone.0058700
Tan, X. F. (1997). Construction of Genetic Linkage Map and Molecular Identification of Main Varieties and Male and Female of Ginkgo biloba by RAPD. Ph.D. thesis, Central-South Forestry College, Changsha.
Tao, Y. Y. (2014). Constructing a Linkage Map of Ginkgo biloba using an Intraspecific F1 Population. Ph.D. thesis, Nanjing Forestry University, Nanjing Forestry University.
Tsumura, Y., and Ohba, K. (1997). “The genetic diversity of isozymes and the possible dissemination of Ginkgo biloba in ancient times in Japan,” in Ginkgo biloba A Global Treasure, eds T. Hori, R. W. Ridge, W. Tulecke, P. Del Tredici, J. Tremouillaux-Guiller, and H. Tobe (Tokyo: Springer-Verlag), 159–172. doi: 10.1007/978-4-431-68416-9_13
Tulsieram, L. K., Glaubitz, J. C., Kiss, G., and Carlson, J. E. (1992). Single tree genetic linkage mapping in conifers using haploid DNA from megagametophytes. Nat. Biotechnol. 10, 686–690. doi: 10.1038/nbt0692-686
Wang, L., Xing, S. Y., Wang, F., and Han, K. J. (2008). AFLP analysis on genetic relationship of Ginkgo biloba female germplasms. Sci. Silvae Sin. 47, 91–96.
West, M. A., van Leeuwen, H., Kozik, A., Kliebenstein, D. J., Doerge, R., Clair, D. A. S., et al. (2006). High-density haplotyping with microarray-based expression and single feature polymorphism markers in Arabidopsis. Genome Res. 16, 787–795. doi: 10.1101/gr.5011206
Wilcox, P. L., Amerson, H. V., Kuhlman, E. G., Liu, B. H., O’Malley, D. M., and Sederoff, R. R. (1996). Detection of a major gene for resistance to fusiform rust disease in loblolly pine by genomic mapping. Proc. Natl. Acad. Sci. U.S.A. 93, 3859–3864. doi: 10.1073/pnas.93.9.3859
Wu, J. Y., Chen, P. L., and Tang, S. J. (1992). Isozyme analysis of the genetic variation of Ginkgo biloba L. population in Tian-Mu Mountain. J. Plant Resour. Environ. 1, 20–23.
Wu, R. L., O’Malley, D. M., and McKeand, S. E. (1999). Understanding the genetic architecture of a quantitative trait in gymnosperms by genotyping haploid megagametophytes. Theor. Appl. Genet. 99, 1031–1038. doi: 10.1007/s001220051411
Xu, F., Sun, X., Chen, Y., Huang, Y., Tong, C., and Bao, J. (2015). Rapid identification of major QTLs associated with rice grain weight and their utilization. PLoS ONE 10:e0122206. doi: 10.1371/journal.pone.0122206
Zhang, J., Yuan, H., Li, M., Li, Y. J., Wang, Y., Ma, X. J., et al. (2016). A high-density genetic map of tetraploid Salix matsudana using specific length amplified fragment sequencing (SLAF-seq). PLoS ONE 11:e0157777. doi: 10.1371/journal.pone.0157777
Zhang, Y., Wang, L., Xin, H., Li, D. H., Ma, C. X., Ding, X., et al. (2013). Construction of a high-density genetic map for sesame based on large scale marker development by specific length amplified fragment (SLAF) sequencing. BMC Plant Boil. 13:141. doi: 10.1186/1471-2229-13-141
Zhao, X., Huang, L., Zhang, X., Wang, J. P., Yan, D. F., Li, J., et al. (2016). Construction of high-density genetic linkage map and identification of flowering-time QTLs in orchardgrass using SSRs and SLAF-seq. Sci. Rep. 6:29345. doi: 10.1038/srep29345
Zhou, Z., and Zheng, S. (2003). Palaeobiology: the missing link in Ginkgo evolution. Nature 423, 821–822. doi: 10.1038/423821a
Keywords: Ginkgo biloba, specific-locus amplified fragment sequencing, megagametophyte, high density, linkage map
Citation: Liu H, Cao F, Yin T and Chen Y (2017) A Highly Dense Genetic Map for Ginkgo biloba Constructed Using Sequence-Based Markers. Front. Plant Sci. 8:1041. doi: 10.3389/fpls.2017.01041
Received: 01 March 2017; Accepted: 30 May 2017;
Published: 15 June 2017.
Edited by:
Changbin Chen, University of Minnesota, United StatesReviewed by:
Xiting Zhao, Henan Normal University, ChinaCopyright © 2017 Liu, Cao, Yin and Chen. This is an open-access article distributed under the terms of the Creative Commons Attribution License (CC BY). The use, distribution or reproduction in other forums is permitted, provided the original author(s) or licensor are credited and that the original publication in this journal is cited, in accordance with accepted academic practice. No use, distribution or reproduction is permitted which does not comply with these terms.
*Correspondence: Yingnan Chen, chenyingnan@njfu.edu.cn
Disclaimer: All claims expressed in this article are solely those of the authors and do not necessarily represent those of their affiliated organizations, or those of the publisher, the editors and the reviewers. Any product that may be evaluated in this article or claim that may be made by its manufacturer is not guaranteed or endorsed by the publisher.
Research integrity at Frontiers
Learn more about the work of our research integrity team to safeguard the quality of each article we publish.