- 1State Key Laboratory for Agrobiotechnology, Key Laboratory of Crop Heterosis and Utilization, Beijing Key Laboratory of Crop Genetic Improvement, China Agricultural University, Beijing, China
- 2National Plant Gene Research Centre, Beijing, China
- 3Institute of Crop Science, Chinese Academy of Agricultural Sciences, Beijing, China
Wheat yield can be enhanced by modifying the spike morphology and the plant height. In this study, a population of 191 F9 recombinant inbred lines (RILs) was developed from a cross between two winter cultivars Yumai 8679 and Jing 411. A dense genetic linkage map with 10,816 markers was constructed by incorporating single nucleotide polymorphism (SNP) and simple sequence repeat (SSR) marker information. Five spike morphological traits and plant height were evaluated under nine environments for the RILs and parental lines, and the number of detected environmentally stable QTLs were 18 and three, respectively. The 1RS/1BL (rye) translocation increased both spike length and spikelet number with constant spikelet compactness. The QPht.cau-2D.1 was identical to gene Rht8, which decreased spike length without modifying spikelet number. Notably, four novel QTLs locating on chromosomes 1AS (QSc.cau-1A.1), 2DS (QSc.cau-2D.1), and 7BS (QSl.cau-7B.1 and QSl.cau-7B.2) were firstly identified in this study, which provide further insights into the genetic factors that shaped the spike morphology in wheat. Moreover, SNP markers tightly linked to previously reported QTLs will eventually facilitate future studies including their positional cloning or marker-assisted selection.
Introduction
Wheat is the leading food crop produced, consumed, and traded worldwide today, and China is the largest wheat producer and consumer in the world (Wang et al., 2009). Since wheat spike is an important reproductive organ, a number of studies have demonstrated that spike morphological traits (e.g., spike length, SL) are positively correlated with grain yield (Kumar et al., 2007) and yield components (e.g., thousand grain weight; Wu et al., 2012; Gao et al., 2015). Therefore, genes or quantitative trait loci (QTLs) associated with spike morphological traits are of interest for breeding purposes.
Q, C, and S are three well-known loci that have been recruited for the domestication of wheat spike morphological traits (Faris et al., 2014b). The Q locus pleiotropically affects a wide range of traits, including plant height, spike length, and rachis fragility (Simons et al., 2006). The C locus affects spike morphology, grain size, shape, and number, while the S locus determines whether a spike has round seeds and glumes (Salina et al., 2000; Johnson et al., 2008). However, various spike morphological traits among modern cultivars are unlikely contributed by these three major genes, because all common wheat accessions have the universal genotype (QcS; Faris et al., 2014b).
Three groups of genes, vernalization (Vrn), photoperiod (Ppd), and earliness per-se (Eps), controlling the life-cycle duration in wheat are important for freezing resistance, heading time, and yield component generation (Wang L. et al., 2015). The vernalization insensitive alleles of Vrn-1 (Vrn-A1, Vrn-B1, and Vrn-D1) shorten both the vegetative and the reproductive stages (Snape et al., 2001) and have considerable impact on spike morphological traits (Kato et al., 2000). Photoperiod insensitive alleles of Ppd-1 (Ppd-A1a, Ppd-B1a, and Ppd-D1a) bring forward the time of terminal spikelet, and hence reduce the spikelet number (Snape et al., 2001). Compared with Vrn and Ppd genes, Eps genes have less evident effects on life-cycle duration but are also involved in spike development. For example, the Eps-Am1 gene from diploid wheat Triticum monococcum affects heading time, spike development, and spikelet number (Faricelli et al., 2010).
By conferring insensitivity to specific kind of plant hormones, reduced height (Rht) or dwarfing genes can increase grain yield and are always involved in manipulation of spike morphology in wheat. Rht-B1, Rht-D1, and Rht8 are three most commonly adopted dwarfing genes worldwide. Rht-B1 and Rht-D1 are two gibberellins (GAs) insensitive dwarfing genes, and have a profound impact on stem elongation and vegetative dry-matter accumulation (Youssefian et al., 1992). Compared with tall plants, semi-dwarfed plants have a greater portion of assimilate allocated to the developing spikes, which results in improved spikelet fertility and increased grain number per spike (Youssefian et al., 1992; Flintham et al., 1997). Rht8 is a brassinosteroids (BRs) insensitive dwarfing gene located on chromosome 2DS (Korzun et al., 1998; Gasperini et al., 2012). Introgression lines carrying the semi-dwarfing allele (Rht8c) have shortened spikes with constant spikelet number, resulting in semi-compacted spike morphology (Kowalski et al., 2016). Moreover, coincidence of QTLs between traits obtained by means of QTL analysis can also provide a clear understanding of the genetic relationship between plant height (PHT) and spike morphological traits.
Over the past two decades, the successful application of quantitative-genetic methodology has facilitated identification of numerous QTLs for spike morphological traits and plant height on all 21 wheat chromosomes (Cui et al., 2012). Notably, consistent QTLs across multiple genetic backgrounds have been identified on chromosomes 1B, 2D, 4B, 5A, and 7A (Jantasuriyarat et al., 2004; Kumar et al., 2007; Cui et al., 2012; Xu et al., 2014). However, to our knowledge, most studies mapping QTLs for spike morphological traits and plant height used low-density genetic maps and mapped QTLs within relatively large confidence intervals, hence hindering their possible applications in wheat breeding programs. Here, we report the construction of high-density genetic linkage map using SNP and SSR markers, and the identification of environmentally stable QTLs associated with spike morphology and plant height using the Yumai 8679 (Y8679)/Jing 411 (J411) recombinant inbred line (RIL) population. The results provide further insights into the genetic factors that shaped the spike morphology in wheat.
Materials and Methods
Plant Materials and Field Trials
A population comprising of 191 RILs was developed by crossing two winter cultivars (Y8679 and J411) and advanced to the F9 generation by single seed descent method. Y8679 has higher spike length and J411 has higher spikelet number per spike (Figure 1). Generations F9 to F12 of the RIL population were included in this study (Table S1). The RIL population and the two parents were grown at four locations (Beijing, Anhui, Shaanxi, and Hebei) during four growing seasons from 2010–2011 to 2014–2015, providing data for nine environments (Table S1). These four locations are representative areas of two main wheat production zones (Northern Winter Wheat Zone and Yellow and Huai River Valleys Facultative Wheat Zone; Figure S1), which produce 68% of total wheat production in China (Wang et al., 2009). Location-year information and climate data across the whole life cycle are presented in Figure S1 and Table S1. Weather conditions for the same locations across years were generally similar. Environments at lower latitudes had higher monthly average maximum and minimum temperatures prior to anthesis.
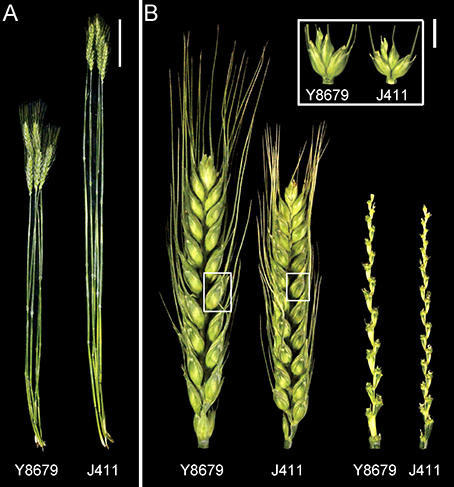
Figure 1. Culm and spike morphology of the parental lines grown in Beijing (2015–2016 growing season). (A) Main tillers of Y8679 (left) and J411 (right). The bar represents 10 cm. (B) Spikes, spikelets, and rachises of parent Y8679 (left) and parent J411 (right). The bar represents 1 cm.
In each environment, the 191 RILs and the two parents were planted in a randomized complete block design with three replicates. Each plot contained two rows that were 2 m long and 0.3 m apart with a sowing rate at 30 seeds per row. All fields were well-watered by both rainfall and broad irrigation. Other management of field trials was in accordance with local standard practices.
Phenotypic Evaluation and Statistical Analysis
At maturity, 10 representative plants from each genotype were used for phenotypic evaluation. All data were collected from the main tillers. PHT was determined by measuring from the ground to the tip of the spike excluding awns. Spike length (SL) was measured from the base of the rachis to the tip of the terminal spikelet excluding the awns. Fertile spikelet number per spike (FSN) and sterile spikelet number per spike (SSN) were determined by counting the number of fertile and sterile spikelets. Total spikelet number per spike (TSN) was calculated by summing the values of FSN and SSN. Spikelet compactness (SC) was calculated by dividing the SL by the TSN.
The statistical and correlation analyses were performed with SPSS version 20.0 (SPSS, Chicago, USA). The Shapiro-Wilk test was performed with R software (V. 3.2.2) to test for departures from normality. The adjusted mean (Best Linear Unbiased Prediction, BLUP) values across evaluated environments were calculated using the PROC MIXED procedure in SAS (SAS Institute Inc., North Carolina, USA). Broad sense heritability () based on a family mean basis was calculated using the PROC GLM procedure in SAS (SAS Institute Inc., North Carolina, USA) based on the following formula: , in which is the genotypic effect, σge2 is the genotype by environmental effect, σ2 is the residual error, n is the number of environments and r is the number of replicates.
Genotyping and Linkage Analyses
The Y8679/J411 RIL population along with the two parents was genotyped using the iSelect 90K array containing 90,000 wheat SNP markers (Wang et al., 2014). Twenty seeds from each genotype were germinated, and young leaves were used for DNA extraction at the seedling stage. SNP genotyping analysis was performed at the Genome Center of the University of California at Davis according to the manufacturer's protocols (Illumina). SNP clustering and genotype calling were performed using GenomeStudio version 2011.1 software (Illumina).
In addition, 215 SSR markers with known chromosome locations were used to help anchor linkage groups into specific chromosomes. Most SSR primers are publicly available at http://wheat.pw.usda.gov/GG2/index.shtml. Several SSR primers designed by our lab can be accessed in Zhai et al. (2015). Parental polymorphism survey and validation of polymorphic SSR markers were conducted using the PCR conditions described by Zhai et al. (2015).
Two 1RS specific markers, pSaD15 and pSc20H (Liu et al., 2008), were used for identification of the RILs with a 1RS/1BL translocation. The primer sequences for the pSaD15 set are 5′-CCGGCGTGTCGACACCCTGATA-3′ and 5′-CATCCGTGCTCCGTGTGCATC-3′ and an annealing temperature of 60°C was used. The primer sequences for the pSc20H set are 5′-GTTGGAAGGGAGCTCGAGCTG-3′ and 5′-GTTGGGCAGAAAGGTCGACATC-3′ and an annealing temperature of 60°C was used.
Genetic linkage maps were constructed with programs RECORD 2.0 (Van Os et al., 2005) and JoinMap 4.0 (Van Ooijen, 2006). Redundant markers with identical segregations were firstly identified and removed using RECORD 2.0. Unique markers were further organized into linkage groups using JoinMap 4.0 with LOD thresholds ranged from 5 to 10. The order of markers within a linkage group was established based on a regression-mapping algorithm (Stam, 1993). Map distances were calculated from recombination frequencies using the Kosambi mapping function (Kosambi, 1943). Removed redundant markers were finally placed beside their kept representatives into the map. The identity, polarity, and centromere positions of linkage groups were determined based on the best blastn hits of the nucleotide sequence flanking the SNP against the Chromosome Survey Sequence (CSS) contigs (Wang et al., 2014).
Bioinformatics Analysis
Mapped SNPs were annotated by comparing flanking sequences with the wheat unigene database (158,028 unigenes) from NCBI (http://www.ncbi.nlm.nih.gov) using the BLASTN program (e-value cutoff ≤ 1e−10). Only the best hits were kept. For functional annotation, attached wheat unigenes were selected and compared against the protein sequences (BLASTX e-value cutoff ≤ 1e−10) predicted in the rice and Brachypodium genomes (International Rice Genome Sequencing Project, 2005; Vogel et al., 2010). Only the best hits were retained.
QTL Analysis
The trait values of three replicates under each environment were averaged and used for QTL analysis. The adjusted mean (BLUP) values for the PHT, SL, FSN, SSN, TSN, and SC of each genotype across the nine environments were used for the combined analysis. The QTLs were scanned with QTL Cartographer version 2.5 (Wang et al., 2012) through composite interval mapping (CIM). In this method, model 6 with forward and backward regression, five markers as cofactors and a 10-cM scanning window was used for the detection of QTLs. Empirical threshold LOD scores for CIM were calculated with 1000 permutations at P ≤ 0.05. Confidence intervals were acquired based on positions ± 2 LOD away from the peaks of the likelihood ratios (LRs). The QTLs with overlapping confidence intervals were treated as equivalent. The QTLs were denoted according to McIntosh et al. (2011).
Results
Phenotypic Evaluation
Parental and population means and ranges for the six traits are listed in Table 1. J411 had higher PHT, FSN, TSN, and SC across environments (Figure 1; Table 1; Appendix C). Conversely, Y8679 had an average SL that was 1.33 cm longer than that of J411 (Table 1). Shapiro-Wilk test for normality and estimation of broad sense heritability based on a family mean basis were conducted for the six investigated traits. SL, FSN, and TSN showed normal distribution, whereas PHT, SSN, and SC departed significantly from normality at the 0.01 significance level (Figure 2). PHT, SL, FSN, TSN, and SC had high heritabilities ( > 0.90), and SSN had a relatively lower heritability ( = 0.84). Phenotypic values in the 191 RILs showed bi-directional transgressive segregation for all traits (Figure 2), suggesting that both parents contributed increasing alleles to these traits. Estimated correlation coefficients among the six traits are listed in Table 2. SL had strong positive correlations with FSN, SSN, TSN, and PHT, and a stronger negative correlation with SC. SC had a strong positive correlation with FSN, and stronger negative correlations with SL and SSN. In addition to a strong positive correlation with SL and SSN, PHT had a weak negative correlation with FSN and a strong negative correlation with SC.
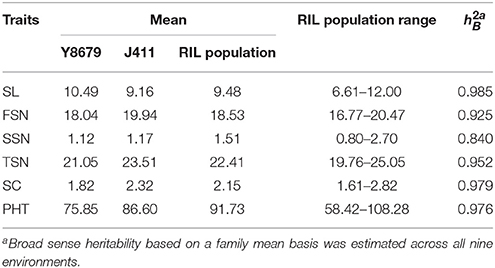
Table 1. Parental and population means, ranges, and broad sense heritabilities for spike length (SL), fertile spikelet number per spike (FSN), sterile spikelet number per spike (SSN), total spikelet number per spike (TSN), spikelet compactness (SC), and plant height (PHT).
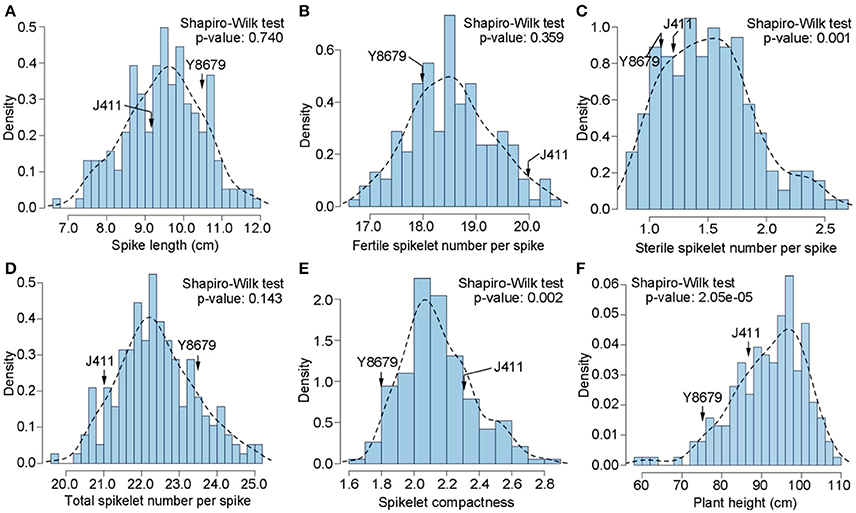
Figure 2. Histograms of the Y8679/J411 recombinant inbred population for (A) spike length (SL), (B) fertile spikelet number per spike (FSN), (C) sterile spikelet number per spike (SSN), (D) total spikelet number per spike (TSN), (E) spikelet compactness (SC), and (F) plant height (PHT).
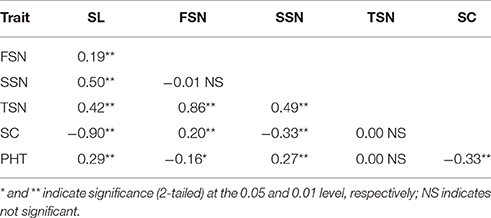
Table 2. Correlation coefficients among the adjusted mean (BLUP) values of the traits spike length (SL), fertile spikelet number per spike (FSN), sterile spikelet number per spike (SSN), total spikelet number per spike (TSN), spikelet compactness (SC), and plant height (PHT).
Linkage Map Construction
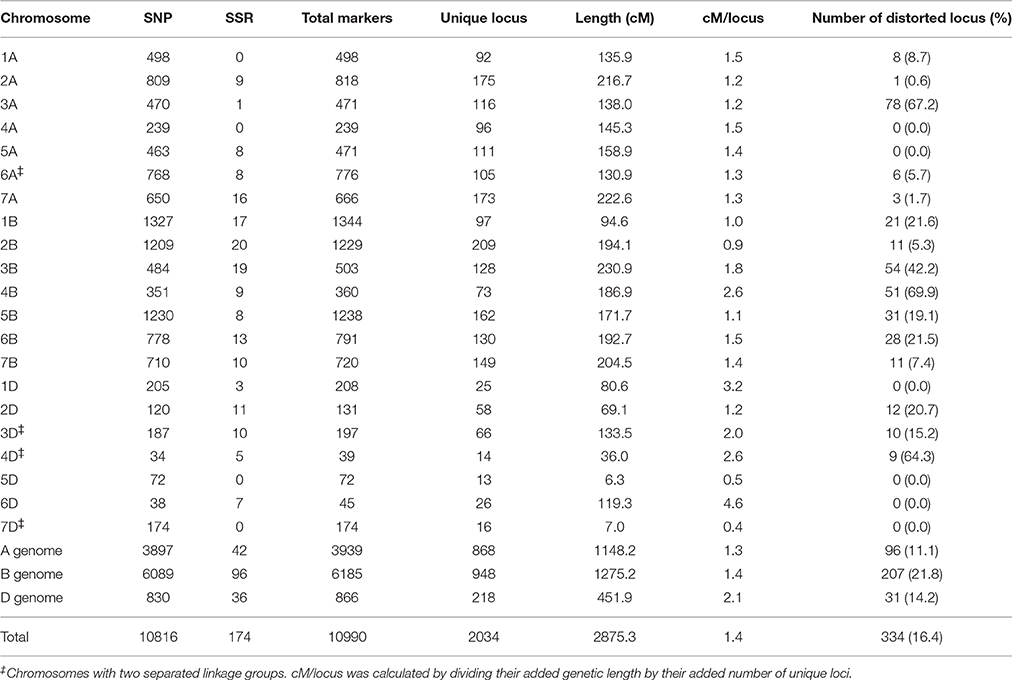
Genotyping of the Y8679/J411 RIL population with the wheat 90K SNP array resulted in 11,646 polymorphic markers that were used for the linkage analysis. In addition to the SNP markers, 215 SSR markers were utilized to genotype the Y8679/J411 population. After removing unlinked markers, the resulted map consisted of 10,990 markers (10,816 SNP markers and 174 SSR markers) mapped within 2034 unique loci, spanning 2875.3 cM in length with an average density of 1.4 cM/locus (Table 3). Of the 2034 unique loci, 334 (16.4%) had segregation ratios that deviated significantly (P < 0.05) from the expected 1:1 ratio (Table 3; Appendix B). Loci segregation distortion usually occurred in large contiguous blocks and chromosomes 3A, 4B, and 4D possessed large clusters of the most severely distorted loci (P < 0.00001). The 10,990 markers distributed unevenly on the 21 chromosomes, and the number ranged from 39 for chromosome 4D to 1344 for chromosome 1B. Eleven gaps (>20 cM) were observed on chromosomes 1A, 1D, 2A, 2D, 3B, 4A, 4B, 5A, 6A, and 7B (Figure S2).
Of 10,816 SNP-flanking sequences, the vast majority (87.82%) could be uniquely matched to wheat unigenes (Appendix A). Alignments between two or more neighboring SNPs to a single unigene were frequently observed. After removing duplicates, 5527 unigenes (with an average length of 1648.0 bp) were attached to the genetic linkage map. By comparing the sequences of 5527 unigenes, 3675 and 3685 orthologous genes from the Brachypodium and the rice genomes were uniquely tagged onto the genetic linkage map, respectively (Appendix A), providing an ideal resource for comparative analysis of targeted genomic regions.
QTL Mapping Analysis
The QTLs that could be detected in four or more environments and in the combined analysis (BLUP) were regarded as “environmentally stable QTLs.” Among the detected 168 QTLs for spike morphological traits and PHT, 21 were environmentally stable QTLs. These 21 QTLs were located on nine chromosomes (1A, 1B, 2B, 2D, 3A, 4D, 5A, 7A, and 7B) (Appendix D). The rest 147 putative QTLs could only be detected in limited number of environments and are listed in Appendix E.
Thirty QTLs associated with SL were detected (Appendixes D, E). Six environmentally stable QTLs for SL were identified on chromosomes 1B, 2B, 2D, 5A, and 7B, and they were designated QSl.cau-1B.2, QSl.cau-2B.2, QSl.cau-2D.2, QSl.cau-5A.4, QSl.cau-7B.1, and QSl.cau-7B.2, respectively (Appendix D). Y8679 contributed effects for increased SL of the 1B, 2B, and 7B QTLs, which explained 4.88–7.96% of the SL variation for the combined analysis. J411 contributed effects for increased SL of the 2D and 5A QTLs, which explained as much as 35.55 and 15.25% of the SL variation for the combined analysis, respectively.
Among 31 QTLs associated with FSN, three environmentally stable QTLs were mapped on chromosomes 1A, 1B, and 3A, and they were designated QFsn.cau-1A.4, QFsn.cau-1B.2, and QFsn.cau-3A.2, respectively (Appendixes D, E). J411 contributed effects for increased FSN at the 1A and 3A loci. The 1A and 3A QTLs had LOD values of 7.50 and 3.38, and they explained 9.85 and 3.88% of the FSN variation for the combined analysis, respectively. Y8679 contributed effect for an increased FSN at the 1B locus, which explained as much as 28.78% of the FSN variation for the combined analysis.
Thirty QTLs were associated with SSN, most (21, 70.0%) of which were significant in one single environment (Appendixes D, E). The only two environmentally stable QTLs were identified on chromosomes 1B and 2D, and they were designated QSsn.cau-1B.1 and QSsn.cau-2D.2, respectively. J411 contributed effect for a decreased SSN at the 1B locus, which had a LOD value of 8.22 and explained 18.22% of the SSN variation for the combined analysis. Y8679 contributed effect for a decreased SSN at the 2D locus. The 2D QTL was significant in all nine environments evaluated, and it had a LOD value of 12.63 and explained 17.13% of the SSN variation for the combined analysis.
Thirty-three significant QTLs were associated with TSN (Appendixes D, E), but the only two environmentally stable QTLs were identified on chromosomes 1B (QTsn.cau-1B.2) and 7A (QTsn.cau-7A.3). The LOD values of these loci ranged from 6.36 to 21.17, and they explained from 5.63 to 36.69% of the TSN variation for the combined analysis.
Thirty-three QTLs were found to be associated significantly with SC, five of which were environmentally stable QTLs (Appendixes D, E). These included one single QTL on chromosome 1A (QSc.cau-1A.1) and two QTLs each on chromosomes 2D (QSc.cau-2D.1 and QSc.cau-2D.2) and 5A (QSc.cau-5A.2 and QSc.cau-5A.4). J411 conferred effect for an increased SC at the 1A locus, and Y8679 contributed increasing alleles at the 2D and 5A loci. QSc.cau-2D.2 was significant in all nine environments evaluated, and it had a LOD value of 20.34 and explained 26.27% of the SC variation for the combined analysis. Unlike those four loci on 2D and 5A, no coincidence of QTLs for SL, FSN, SSN, or TSN was detected at the 1A locus, suggesting that QSc.cau-1A.1 controlled SC through a different mechanism.
Twelve QTLs associated with PHT were identified (Appendixes D, E). Three environmentally stable QTLs for PHT were detected on chromosomes 2D and 4D, and designated QPht.cau-2D.1, QPht.cau-2D.2, and QPht.cau-4D.1, respectively (Appendix D). Y8679 contributed effects for decreased PHT at all three loci, which explained 4.30–10.25% of the PHT variation for the combined analysis. QPht.cau-2D.1 peaked at markers Xcfd53 and Xgwm261 (diagnostic marker for Rht8) on 2D indicating that the effects for decreased PHT for this locus was conferred by the dwarfing allele of Rht8 from Y8679. QPht.cau-4D.1 peaked at marker Xgwm165, which is closely linked with the centromere of chromosome 4D. Since no linkage group was mapped for the short arm of chromosome 4D, it is necessary to further clarify the relationship between QPht.cau-4D.1 and Rht-D1.
Comparative Analysis of Genomic Regions Harboring Stable QTLs for Spike Morphological Traits
Ten genomic regions covering 18 stable QTLs for spike morphological traits are listed in Table 4 and are shown in Figure 3. In addition, putative QTLs for SL, FSN, SSN, TSN, and SC mapped within these 10 genomic regions were also shown in Figure 3. Regions 1A.1 and 2B mapped a single QTL for SC (QSc.cau-1A.1) and SL (QSl.cau-2B.2), respectively. The rest eight genomic regions contained 32 co-localized QTLs (16 stable QTLs and 16 putative QTLs) with individual genomic region harboring QTLs for two to four traits. These co-localized QTLs shared confidence intervals and had tightly linked QTL peak positions (usually within 10 cM), which are indicative of potential pleiotropy among the traits.
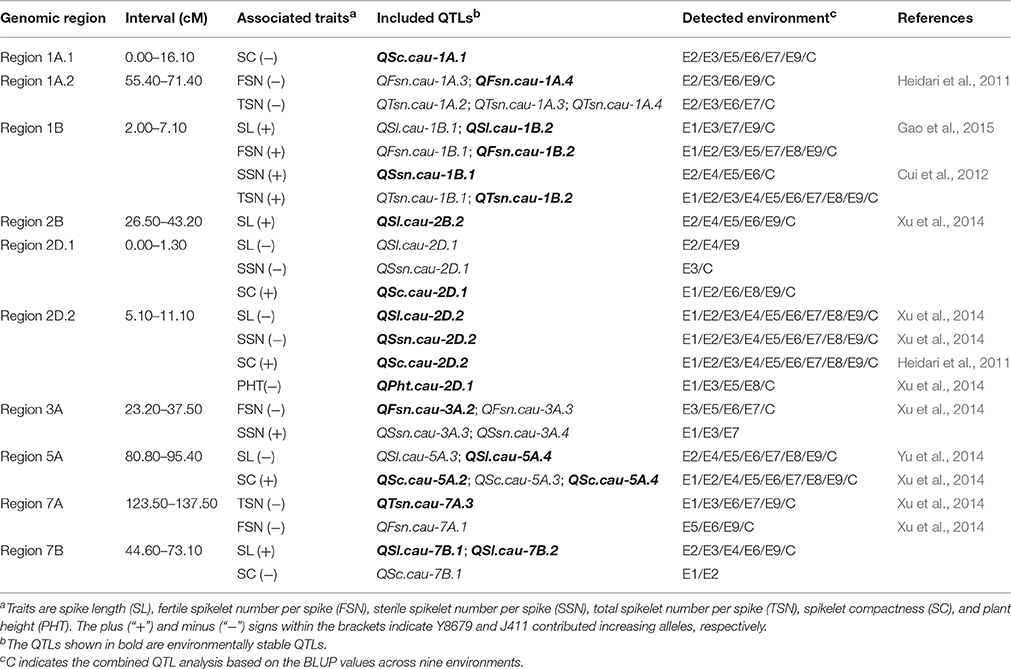
Table 4. The 10 genomic regions harboring environmentally stable QTLs for spike morphological traits in the Y8679/J411 RIL population.
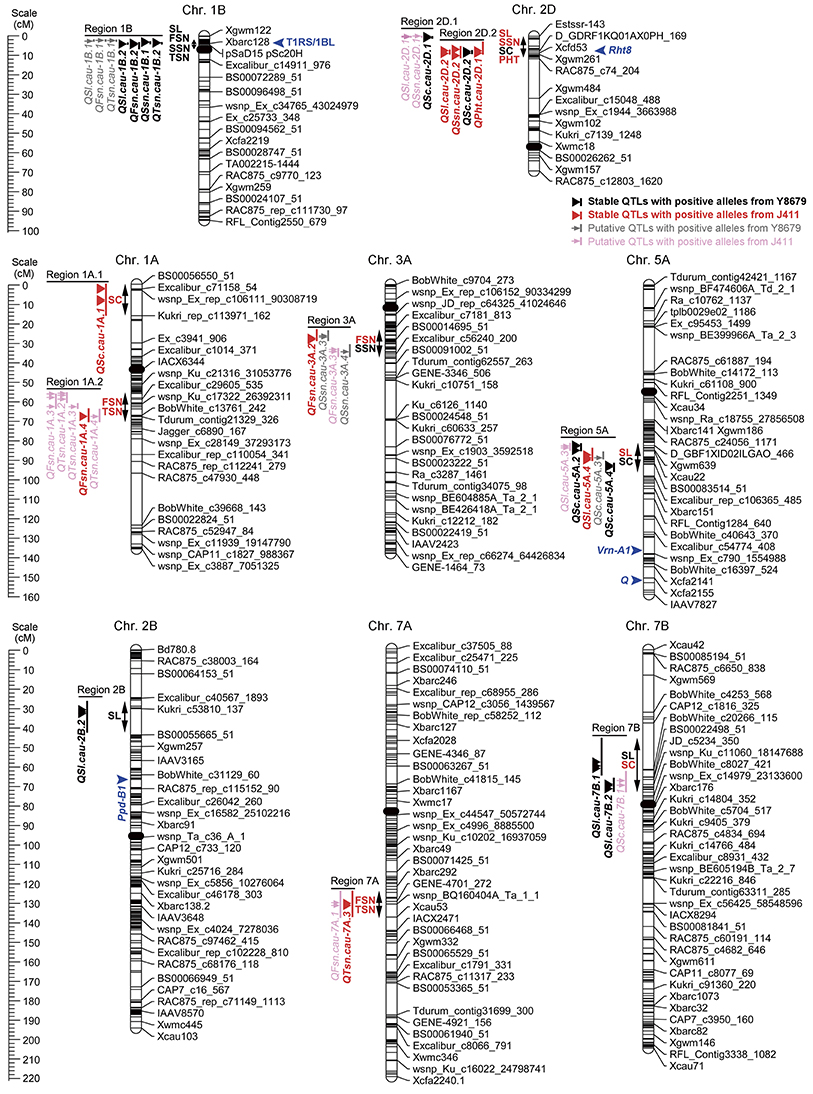
Figure 3. Chromosomal locations of 10 genomic regions associated with spike morphological traits. Only environmentally stable QTLs and their tightly-linked putative QTLs are shown. A centiMorgan (cM) scale is shown on the left. Black ellipses represent the approximate locations of the centromeres. Vertical bars represent the LOD-2 confidence interval for the location of each QTL. Black and red triangles indicate environmentally stable QTLs with positive alleles from parent Y8679 and parent J411, respectively. Gray and pink arrows indicate putative QTLs with positive alleles from parent Y8679 and parent J411, respectively. Double headed arrows indicate the genomic regions characterized by QTLs or QTL clusters. Traits alongside the double headed arrows are spike length (SL), fertile spikelet number per spike (FSN), sterile spikelet number per spike (SSN), total spikelet number per spike (TSN), spikelet compactness (SC), and plant height (PHT). The known positions of the 1RS/1BL translocation (T1RS/1BL), Rht8, Ppd-B1, Vrn-A1, and Q loci are presented in blue arrows (Korzun et al., 1998; Liu et al., 2008; Cavanagh et al., 2013; Wang et al., 2014; Faris et al., 2014a).
The protein sequences of rice and Brachypodium showing best hits to SNP markers mapped within nine genomic regions (excluding Region 1B, T1RS/1BL) were further analyzed for a comparative mapping purpose. Functional predictions of these rice and Brachypodium proteins were obtained from PGSB database (http://pgsb.helmholtz-muenchen.de/plant/index.jsp, verified 7 September 2016) and are listed in Appendix F. Regions 1A.1, 2B, 2D.1, 2D.2, and 7A exhibit indeterminate collinearities with rice and Brachypodium genomes (Table S2). Regions 1A.2, 3A, 5A, and 7B are highly syntenic to rice chromosomes 5 (25.00–26.58 Mb), 1 (33.21–39.69 Mb), 9 (19.87–21.70 Mb), and 6 (3.20–8.33 Mb), respectively, and to Brachypodium chromosomes 2 (16.58–18.01 Mb), 2 (51.46–56.26 Mb), 4 (40.47–42.31 Mb), and 1 (42.12–47.08 Mb), respectively (Figure 4; Table S2).
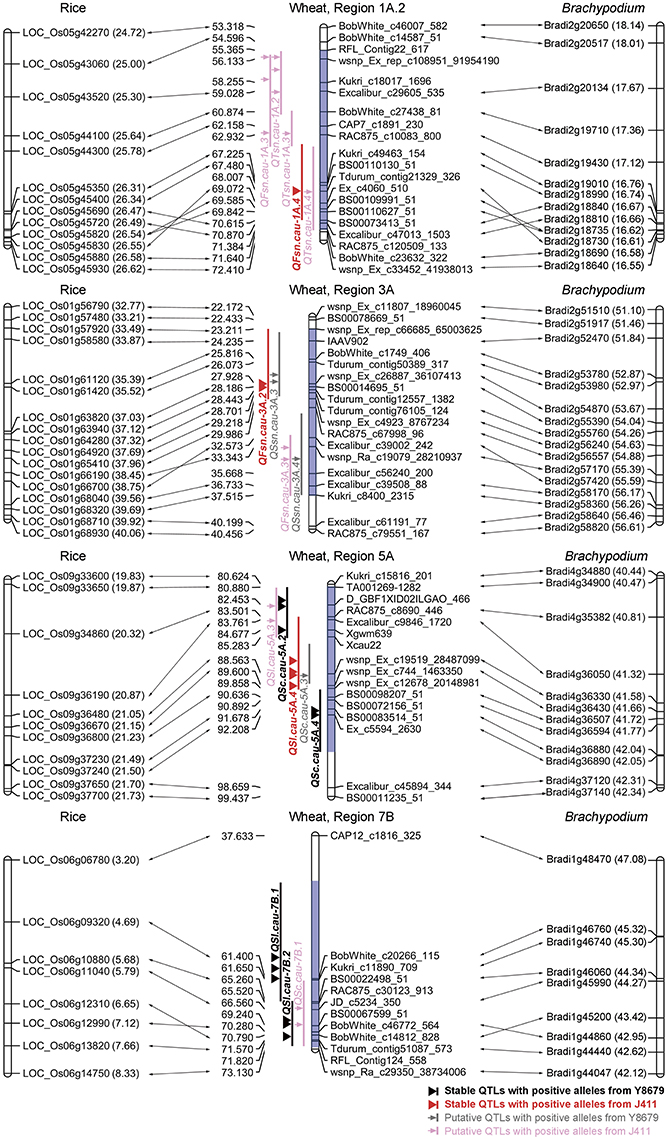
Figure 4. Comparative mapping results of four genomic regions harboring stable QTLs for spike morphological traits. The number in brackets indicates the physical position (Mb) of rice and Brachypodium genes. Blue shadow indicates the range of the targeted genomic region.
Validation of the Consequences of 1RS/1BL Translocation and Rht8
The 5.5 cM interval on chromosome 1BS mapped 1031 SNP markers and 13 SSR markers, and hence we deduced that one of the parents might carry the 1RS/1BL translocation. Thus, two 1RS specific markers (pSaD15 and pSc20H; Liu et al., 2008) were used for analysis (Figure S3). The results showed that 75 RILs carried the 1RS/1BL translocation donated by parent Y8679, which exhibited significant (P < 0.05) segregation distortion with approximately 61% J411 alleles. Similar segregation ratios have also been reported in other studies in RIL lines from crosses between 1B and 1RS/1BL parents, suggesting biased transmission against gametes carrying the translocation (Mathews et al., 2008; McIntyre et al., 2010). Adjusted mean (BLUP) values across nine environments were used to determine differences between 1RS/1BL and 1B lines in SL, FSN, SSN, TSN, and SC (Table 5). No significant variation was detected between 1RS/1BL and 1B lines for SC. Compared with 1B lines, the 1RS/1BL lines had higher SL (7.2%), FSN (4.2%), SSN (24.8%), and TSN (5.9%). Consequently, four major and environmentally stable QTLs were detected at the pSaD15 locus, and they had LOD values from 3.33 to 21.17 and explained from 6.74 to 36.69% of the variations for the combined analysis (Figures 3; Figure S4; Appendix D). The 1RS/1BL translocation from Y8679 was associated with increased SL, FSN, SSN, and TSN.
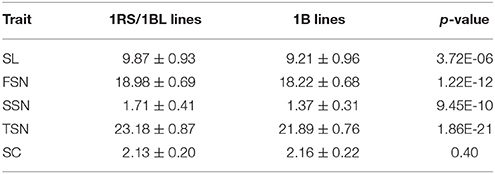
Table 5. Variations between 1RS/1BL and 1B lines for spike length (SL), fertile spikelet number per spike (FSN), sterile spikelet number per spike (SSN), total spikelet number per spike (TSN), and spikelet compactness (SC).
Four co-localized stable QTLs for SL, SSN, SC, and PHT overlapped with the semi-dwarfing gene Rht8, which raises the possibility that Rht8 conferred pleiotropic effects on these traits. Therefore, one commonly used diagnostic marker for Rht8, Xgwm261, was selected for investigation (Korzun et al., 1998). Of the 191 RILs, 96 and 90 RILs amplified the 192 bp (Rht8c allele from parent Y8679) and 174 bp (Rht8b allele from parent J411) fragments, respectively (Figure S5). In addition, five RILs amplified smeared or fuzzy products when visualized with silver staining. Adjusted mean (BLUP) values across nine environments were used to identify differences between Rht8c and Rht8b lines in SL, FSN, SSN, TSN, SC, and PHT (Table 6). The Rht8c allele was associated with significant reductions (P < 0.05) in SL (11.1%), SSN (20.7%), TSN (2.2%), and PHT (3.3%), and with a remarkable increase in SC (10.3%). Since no significant effect was detected for the Rht8c allele on FSN (0.0%, p = 0.97), the slight reduction in TSN was probably due to reduction in SSN.
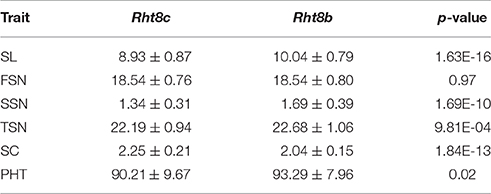
Table 6. Variations between Rht8c and Rht8b lines for spike length (SL), fertile spikelet number per spike (FSN), sterile spikelet number per spike (SSN), total spikelet number per spike (TSN), spikelet compactness (SC), and plant height (PHT).
Discussion
Comparison between Genetic Linkage Maps Constructed with the iSelect 9K and 90K SNP Arrays
The prerequisite of genetic studies is constructing a high-quality, saturated genetic map. The recently developed iSelect 9K and 90K arrays (Cavanagh et al., 2013; Wang et al., 2014) designed to characterize genetic variation in hexaploid wheat populations have extensive applications in QTL mapping (Wu et al., 2015b), genome-wide association studies (GWAS) (Gao et al., 2016), genomic selection (He et al., 2016), and establishment of heterotic groups (Zhao et al., 2015). In the present study, we constructed a dense genetic linkage map for the Y8679/J411 RIL population, using 10,816 polymorphic SNP markers from an iSelect 90K array and 174 polymorphic SSR markers. Of the 10,816 SNP markers, 9564 (88.4%) were mapped by Wang et al. (2014) and Gao et al. (2015). Remarkably, 1,252 (11.6%) SNP markers were newly mapped in this study (Appendix A). The order of SNP markers along the chromosomes was basically consistent with Wang et al. (2014). The genetic length of this map was 2875.3 cM, similar to reported maps in hexaploid wheat (Somers et al., 2004; Wu et al., 2015b). Notably, the high number (11,646) of polymorphic SNP markers between Y8679 and J411 is comparable to Jin et al. (2016) and Perez-Lara et al. (2016), who detected 12,205 and 10,342 polymorphic SNPs between two parental lines, respectively. Collectively, these data suggest that the iSelect 90K array is a powerful tool for genotyping analysis in hexaploid wheat.
In our previous study, we genotyped the Y8679/J411 RIL population using the iSelect 9K array and constructed a SNP-based genetic linkage map (Zhai et al., 2015). Regrettably, 10 huge gaps over 20 cM existed on six chromosomes and the genetic coverage of D genome was gravely inadequate. For example, chromosomes 4D and 7D covered only 2.9 and 2.6 cM in length, respectively, while chromosome 5D mapped no linkage group. Hence, the iSelect 90K array used in the present study was anticipated to fill the gaps and enlarge the genetic coverage of the D genome. As compared with map constructed with iSelect 9K array, the genetic coverage, the total number of SNP markers and unique loci in the present study increased by 73.2, 469.0, and 103.4%, respectively, and the average intervals between unique loci (loci/cM) decreased by 17.6% (Table S3). Notably, although some huge gaps (>20 cM) persisted, 5 of the 10 gaps were successfully narrowed. However, no substantial improvement was observed for the D genome, especially for chromosomes 5D (6.3 cM) and 7D (7 cM), which may hinder the detection of possible QTLs on these chromosomes. Collectively, these data indicated that both the iSelect 9K and 90K arrays have considerable limitations when dealing with the D genome. Therefore, studies focusing on chromosomes from the D genome are recommended to use much larger genotyping platforms, such as the recently developed 660K SNP chip (Jin et al., 2016).
Novel QTLs Identified for Wheat Spike Morphology on Chromosomes 1AS, 2DS, and 7BS
In order to enhance the yield potential of wheat, breeders have tried to alter the sink capacity through modifying the spike morphology of wheat (Reynolds et al., 1999). The present study identified 10 genomic regions on eight chromosomes, which harbor 18 environmentally stable QTLs for five spike morphological traits (SL, FSN, SSN, TSN, and SC). Seven genomic regions on chromosomes 1AL, 1BS, 2BS, 2DS, 3AL, 5AL, and 7AS coincide with previously reported QTLs/genes. For example, Region 1A.2 (QFsn.cau-1A.4) corresponds to reported QTLs for spikelet number (Heidari et al., 2011; Wang et al., 2011). Regions 2B (QSl.cau-2B.2), 3A (QFsn.cau-3A.2), and 7A (QTsn.cau-7A.3) have been detected by Xu et al. (2014) using the Xiaoyan 54/Jing 411 RIL population, which shared one common parental line (Jing 411) with our population. Region 7A (QTsn.cau-7A.3) locates in a region similar to gene TaMOC1-7A, which was associated with spikelet number per spike in common wheat (Zhang et al., 2015). Besides, three novel genomic regions including Regions 1A.1 (QSc.cau-1A.1), 2D.1 (QSc.cau-2D.1), and 7B (QSl.cau-7B.1 and QSl.cau-7B.2) are firstly presented in this study.
A QTL on chromosome 1AS controlling SC (QSc.cau-1A.1) has not been reported previously, indicating that this novel QTL could be due to specific genetic materials used in the present study. Nevertheless, previous studies have mapped QTLs for spikelet number or spike length at the same chromosomal region (Kumar et al., 2007; Ma et al., 2007). However, no association of the QSc.cau-1A.1 locus with spike length or spikelet number was detected under all environments in this study, suggesting that QSc.cau-1A.1 is most likely different from reported QTLs for spike length or spikelet number on chromosome 1AS. Two neighboring QTLs on chromosome 7BS, QSl.cau-7B.1, and QSl.cau-7B.2, were detected in 4–5 environments. To the best of our knowledge, no QTL for spike length has been detected on the short arm of chromosome 7B. Therefore, these two QTLs detected in our RIL population represent two novel loci controlling spike length in wheat.
A novel locus, QSc.cau-2D.1, distal to Rht8 on the short arm of chromosome 2D has not been reported in previous studies. Co-localized QTLs for SL and SSN at the QSc.cau-2D.1 locus were also detected in our RIL population, explaining 13.77–18.45 and 7.88–8.90% of the phenotypic variation, respectively (Figure 3; Appendix E). Since QSc.cau-2D.1 is only 8.7 cM away from QSc.cau-2D.2, a major QTL for SC with the strongest effect, it is difficult to conclude whether QSc.cau-2D.1 is a shadow or genuine QTL for SC. Fortunately, a RIL line (YJ-171) from our population exhibited residual heterozygosity at both the QSc.cau-2D.1 and QSc.cau-2D.2 loci (data not shown). A mapping population deriving from YJ-171 has been developed for dissection of these two QTLs, and preliminary result supports that QSc.cau-2D.1 is a genuine QTL controlling spike length and spikelet compactness (unpublished data). Therefore, it seems that the QSc.cau-2D.1 locus identified in our population represents a novel locus for spike length and spikelet compactness in wheat.
Pleiotropic QTLs on Chromosomes 2DS and 5AL
The QPht.cau-2D.1 locus on the short arm of chromosome 2D was identical to gene Rht8 (Korzun et al., 1998). This locus has been associated with QTLs for plant height, spike length, spikelet number, spikelet compactness, thousand grain weight, and grain yield (Ma et al., 2007; Cui et al., 2012; Xu et al., 2014; Wang Y. S. et al., 2015). In this study, The QPht.cau-2D.1 locus was detected to have pleiotropic effects for SL, SSN, SC, and PHT. The Y8679 derived allele decreased SL and SSN, but increased SC under all evaluated environments. Our results support the recent findings that the Rht8c introgression decreased spike length with constant spikelet number, resulting in a semi-compacted spike morphology (Wu et al., 2014; Kowalski et al., 2016), but contrasting with other recent studies showing that the Rht8c allele has no significant effect on spike length (Gasperini et al., 2012; Rebetzke et al., 2012).
The QSl.cau-5A.4 locus co-localized with two neighboring QTLs for SC (QSc.cau-5A.2 and QSc.cau-5A.4) in this study. The QSl.cau-5A.4 locus has been associated with QTLs for spike length (Kumar et al., 2007; Cui et al., 2012; Yu et al., 2014; Wu et al., 2015a), spikelet number (Kumar et al., 2007; Ding et al., 2011; Cui et al., 2012) and spikelet compactness (Jantasuriyarat et al., 2004; Katkout et al., 2014; Xu et al., 2014) in many studies. Moreover, the QSl.cau-5A.4 locus was different from Vrn-A1 and Q (Figure 3), which deserves for further investigation.
Genotype-Dependent Effects of the 1RS/1BL Translocation on Spike Morphology in Wheat
To date, a number of studies have shown that the higher yield potential of the 1RS/1BL lines is caused by the higher kernel number per spike, which can be attributed to the higher spikelet number per spike (Schlegel and Meinel, 1994; Villareal et al., 1998; Zhao et al., 2012). Consistent with these data, our results showed that the 1RS/1BL translocation increased the FSN and TSN in nearly all environments (Appendix D). We also found that the 1RS/1BL translocation had a considerable positive effect on the SSN and SL, which is consistent with the results of previous studies (Cui et al., 2012; Gao et al., 2015). QTLs were not detected for SC in any of the nine individual environments, suggesting that the 1RS/1BL translocation has no significant influence on spikelet compactness, which is inconsistent with the results of Tahmasebi et al. (2015). Moreover, other studies have also shown a loose connection between the 1RS/1BL translocation and spike morphological traits (Villareal et al., 1995; Griffiths et al., 2015). Collectively, these data demonstrate that the impact of the 1RS/1BL translocation on performance is highly linked to the plant's genetic background and environmental conditions, which limit the use of 1RS/1BL translocation lines as a source of genetic variation. Thus, it will be necessary to explore and utilize novel genetic diversity for super high-yield wheat breeding.
Candidate Genes Controlling Wheat Spike Morphology
The primary utility of gene-based linkage maps is for comparative mapping, which has become a tool for comparing gene order and content across related grass species (Somyong et al., 2011). A number of successful studies have reported the fine mapping of QTLs for agronomically important traits based on orthologous regions across several grass species (Chen et al., 2007; Handa et al., 2008; Somyong et al., 2011). In the present study, we report integration of the SNP-based genetic linkage map with 3,675 Brachypodium genes and 3,685 rice genes, which is anticipated to assist the comparative mapping of detected QTLs. Of 10 genomic regions harboring stable QTLs, Region 1B was not considered for comparative analysis because of the 1RS/1BL translocation. Five genomic regions have indeterminate collinearities with model genomes owing to two reasons, i.e., limited density of polymorphic SNP markers (Regions 2D.1, 2D.2, and 7A) and chaotic collinearity with multiple chromosomes from model genomes (Regions 1A.1 and 2B). Remarkably, four genomic regions harboring stable QTLs for SL (Regions 5A and 7B), FSN (Regions 1A.2 and 3A) and SC (Region 5A) exhibit good collinearity with model genomes (Figure 4). Region 3A contains two neighboring QTLs for FSN, i.e., one environmentally stable QTL (QFsn.cau-3A.2) and one putative QTL (QFsn.cau-3A.3). Comparative analysis demonstrated that the peak regions of QFsn.cau-3A.2 and QFsn.cau-3A.3 are syntenic to rice chromosome 1 at 35.52–37.12 and 38.45–39.56 Mb, respectively (Figure 4). Interestingly, rice chromosome 1 harbors the two cloned genes LAX1 (LOC_Os01g61480) and EG1 (LOC_Os01g67430) governing the spikelet development, which are located at 35.56 and 39.18 Mb, respectively (Komatsu et al., 2001; Li et al., 2009). These results suggest that the two QTLs for FSN identified on Region 3A could be orthologous to LAX1 or EG1, which deserve further investigation.
Author Contributions
ZN and QS conceived the project; SX developed the Yumai 8679/Jing 411 RIL population; HZ, ZF, and JL carried out experiments; XL performed bioinformatics analysis; HZ analyzed experimental results; HZ, ZN, and QS wrote the manuscript.
Conflict of Interest Statement
The authors declare that the research was conducted in the absence of any commercial or financial relationships that could be construed as a potential conflict of interest.
Acknowledgments
This work was financially supported by the National Natural Science Foundation of China (Grant No. 91435204), the National Key Research and Development Program of China (Grant No. 2016YFD0100801), and China Agriculture Research System (Grant No. CARS-3-1-10).
Supplementary Material
The Supplementary Material for this article can be found online at: http://journal.frontiersin.org/article/10.3389/fpls.2016.01617/full#supplementary-material
Abbreviations
FSN, Fertile spikelet number per spike; PHT, Plant height; QTL, Quantitative trait locus; RIL, Recombinant inbred line; SC, Spikelet compactness; SL, Spike length; SNP, Single nucleotide polymorphism; SSN, Sterile spikelet number per spike; SSR, Simple sequence repeat; TSN, Total spikelet number per spike.
References
Cavanagh, C. R., Chao, S. M., Wang, S. C., Huang, B. E., Stephen, S., Kiani, S., et al. (2013). Genome-wide comparative diversity uncovers multiple targets of selection for improvement in hexaploid wheat landraces and cultivars. Proc. Natl. Acad. Sci. U.S.A. 110, 8057–8062. doi: 10.1073/pnas.1217133110
Chen, X. F., Faris, J. D., Hu, J. G., Stack, R. W., Adhikari, T., Elias, E. M., et al. (2007). Saturation and comparative mapping of a major Fusarium head blight resistance QTL in tetraploid wheat. Mol. Breed. 19, 113–124. doi: 10.1007/s11032-006-9049-7
Cui, F., Ding, A., Li, J., Zhao, C., Wang, L., Wang, X., et al. (2012). QTL detection of seven spike-related traits and their genetic correlations in wheat using two related RIL populations. Euphytica 186, 177–192. doi: 10.1007/s10681-011-0550-7
Ding, A., Li, J., Cui, F., Zhao, H., Ma, Y., and Wang, H. (2011). Mapping QTLs for yield related traits using two associated RIL populations of wheat. Acta Agron. Sin. 37, 1511–1524. doi: 10.3724/SP.J.1006.2011.01511
Faricelli, M. E., Valárik, M., and Dubcovsky, J. (2010). Control of flowering time and spike development in cereals: the earliness per se Eps-1 region in wheat, rice, and Brachypodium. Funct. Integr. Genomics 10, 293–306. doi: 10.1007/s10142-009-0146-7
Faris, J. D., Zhang, Q., Chao, S., Zhang, Z., and Xu, S. S. (2014a). Analysis of agronomic and domestication traits in a durum × cultivated emmer wheat population using a high-density single nucleotide polymorphism-based linkage map. Theor. Appl. Genet. 127, 2333–2348. doi: 10.1007/s00122-014-2380-1
Faris, J. D., Zhang, Z., Garvin, D. F., and Xu, S. S. (2014b). Molecular and comparative mapping of genes governing spike compactness from wild emmer wheat. Mol. Genet. Genomics 289, 641–651. doi: 10.1007/s00438-014-0836-2
Flintham, J. E., Borner, A., Worland, A. J., and Gale, M. D. (1997). Optimizing wheat grain yield: effects of Rht (gibberellin-insensitive) dwarfing genes. J. Agr. Sci. 128, 11–25 doi: 10.1017/s0021859696003942
Gao, F. M., Wen, W. E., Liu, J. D., Rasheed, A., Yin, G. H., Xia, X. C., et al. (2015). Genome-wide linkage mapping of QTL for yield components, plant height and yield-related physiological traits in the Chinese wheat cross Zhou 8425B/Chinese Spring. Front. Plant Sci. 6:1099. doi: 10.3389/fpls.2015.01099
Gao, L. L., Turner, M. K., Chao, S. M., Kolmer, J., and Anderson, J. A. (2016). Genome wide association study of seedling and adult plant leaf rust resistance in elite spring wheat breeding lines. Euphytica 11:e0148671. doi: 10.1371/journal.pone.0148671
Gasperini, D., Greenland, A., Hedden, P., Dreos, R., Harwood, W., and Griffiths, S. (2012). Genetic and physiological analysis of Rht8 in bread wheat: an alternative source of semi-dwarfism with a reduced sensitivity to brassinosteroids. J. Exp. Bot. 63, 4419–4436. doi: 10.1093/jxb/ers138
Griffiths, S., Wingen, L., Pietragalla, J., Garcia, G., Hasan, A., Miralles, D., et al. (2015). Genetic dissection of grain size and grain number trade-offs in CIMMYT wheat germplasm. PLoS ONE 10:e0118847. doi: 10.1371/journal.pone.0118847
Handa, H., Namiki, N., Xu, D., and Ban, T. (2008). Dissecting of the FHB resistance QTL on the short arm of wheat chromosome 2D using a comparative genomic approach: from QTL to candidate gene. Mol. Breed. 22, 71–84. doi: 10.1007/s11032-008-9157-7
He, S., Schulthess, A. W., Mirdita, V., Zhao, Y. S., Korzun, V., Bothe, R., et al. (2016). Genomic selection in a commercial winter wheat population. Theor. Appl. Genet. 129, 641–651. doi: 10.1007/s00122-015-2655-1
Heidari, B., Sayed-Tabatabaei, B. E., Saeidi, G., Kearsey, M., and Suenaga, K. (2011). Mapping QTL for grain yield, yield components, and spike features in a doubled haploid population of bread wheat. Genome 54, 517–527. doi: 10.1139/g11-017
International Rice Genome Sequencing Project (2005). The map-based sequence of the rice genome. Nature 436, 793–800. doi: 10.1038/nature03895
Jantasuriyarat, C., Vales, M. I., Watson, C. J. W., and Riera-Lizarazu, O. (2004). Identification and mapping of genetic loci affecting the free-threshing habit and spike compactness in wheat (Triticum aestivum L.). Theor. Appl. Genet. 108, 261–273. doi: 10.1007/s00122-003-1432-8
Jin, H., Wen, W., Liu, J. D., Zhai, S. N., Zhang, Y., Yan, J., et al. (2016). Genome-wide QTL mapping for wheat processing quality parameters in a Gaocheng 8901/Zhoumai 16 recombinant inbred line population. Front. Plant Sci. 7:1032. doi: 10.3389/fpls.2016.01032
Johnson, E. B., Nalam, V. J., Zemetra, R. S., and Riera-Lizarazu, O. (2008). Mapping the compactum locus in wheat (Triticum aestivum L.) and its relationship to other spike morphology genes of the Triticeae. Euphytica 163, 193–201. doi: 10.1007/s10681-007-9628-7
Katkout, M., Kishii, M., Kawaura, K., Mishina, K., Sakuma, S., Umeda, K., et al. (2014). QTL analysis of genetic loci affecting domestication-related spike characters in common wheat. Genes Genet. Syst. 89, 121–131. doi: 10.1266/ggs.89.121
Kato, K., Miura, H., and Sawada, S. (2000). Mapping QTLs controlling grain yield and its components on chromosome 5A of wheat. Theor. Appl. Genet. 101, 1114–1121. doi: 10.1007/s001220051587
Komatsu, M., Maekawa, M., Shimamoto, K., and Kyozuka, J. (2001). The LAX1 and FRIZZY PANICLE 2 genes determine the inflorescence architecture of rice by controlling rachis-branch and spikelet development. Dev. Biol. 231, 364–373. doi: 10.1006/dbio.2000.9988
Korzun, V., Röder, M. S., Ganal, M. W., Worland, A. J., and Law, C. N. (1998). Genetic analysis of the dwarfing gene (Rht8) in wheat. Part I. Molecular mapping of Rht8 on the short arm of chromosome 2D of bread wheat (Triticum aestivum L.). Theor. Appl. Genet. 96, 1104–1109. doi: 10.1007/s001220050845
Kosambi, D. D. (1943). The estimation of map distances from recombination values. Ann. Eugen. 12, 172–175. doi: 10.1111/j.1469-1809.1943.tb02321.x
Kowalski, A. M., Gooding, M., Ferrante, A., Slafer, G. A., Orford, S., Gasperini, D., et al. (2016). Agronomic assessment of the wheat semi-dwarfing gene Rht8 in contrasting nitrogen treatments and water regimes. Field Crops Res. 191, 150–160. doi: 10.1016/j.fcr.2016.02.026
Kumar, N., Kulwal, P. L., Balyan, H. S., and Gupta, P. K. (2007). QTL mapping for yield and yield contributing traits in two mapping populations of bread wheat. Mol. Breed. 19, 163–177. doi: 10.1007/s11032-006-9056-8
Li, H. G., Xue, D. W., Gao, Z. Y., Yan, M. X., Xu, W. Y., Xing, Z., et al. (2009). A putative lipase gene EXTRA GLUME1 regulates both empty-glume fate and spikelet development in rice. Plant J. 57, 593–605. doi: 10.1111/j.1365-313XX.2008.03710.x
Liu, C., Yang, Z. J., Li, G. R., Zeng, Z. X., Zhang, Y., Zhou, J. P., et al. (2008). Isolation of a new repetitive DNA sequence from Secale africanum enables targeting of Secale chromatin in wheat background. Euphytica 159, 249–258. doi: 10.1007/s10681-007-9484-5
Ma, Z., Zhao, D., Zhang, C., Zhang, Z., Xue, S., Lin, F., et al. (2007). Molecular genetic analysis of five spike-related traits in wheat using RIL and immortalized F2 populations. Mol. Genet. Genomics 277, 31–42. doi: 10.1007/s00438-006-0166-0
Mathews, K. L., Malosetti, M., Chapman, S., McIntyre, L., Reynolds, M., Shorter, R., et al. (2008). Multi-environment QTL mixed models for drought stress adaptation in wheat. Theor. Appl. Genet. 117, 1077–1091. doi: 10.1007/s00122-008-0846-8
McIntosh, R. A., Dubcovsky, J., Rogers, W. J., Morris, C., Appels, R., and Xia, X. C. (2011). Catalogue of Gene Symbols for Wheat: 2011 Supplement. Available online at: https://shigen.nig.ac.jp/wheat/komugi/genes/macgene/supplement2011.pdf
McIntyre, C. L., Mathews, K. L., Rattey, A., Chapman, S. C., Drenth, J., Ghaderi, M., et al. (2010). Molecular detection of genomic regions associated with grain yield and yield-related components in an elite bread wheat cross evaluated under irrigated and rainfed conditions. Theor. Appl. Genet. 120, 527–541. doi: 10.1007/s00122-009-1173-4
Perez-Lara, E., Semagn, K., Chen, H., Iqbal, M., N'Diaye, A., Kamran, A., et al. (2016). QTLs associated with agronomic traits in the Cutler × AC Barrie spring wheat mapping population using single nucleotide polymorphic markers. PLoS ONE 11:e0160623. doi: 10.1371/journal.pone.0160623
Rebetzke, G. J., Bonnett, D. G., and Ellis, M. H. (2012). Combining gibberellic acid-sensitive and insensitive dwarfing genes in breeding of higher-yielding, sesqui-dwarf wheats. Field Crops Res. 127, 17–25. doi: 10.1016/j.fcr.2011.11.003
Reynolds, M. P., Rajaram, S., and Sayre, K. D. (1999). Physiological and genetic changes of irrigated wheat in the post-green revolution period and approaches for meeting projected global demand. Crop Sci. 39, 1611–1621. doi: 10.2135/cropsci1999.3961611x
Salina, E., Börner, A., Leonova, I., Korzun, V., Laikova, L., Maystrenko, O., et al. (2000). Microsatellite mapping of the induced sphaerococcoid mutation genes in Triticum aestivum. Theor. Appl. Genet. 100, 686–689. doi: 10.1007/s001220051340
Schlegel, R., and Meinel, A. (1994). A quantitative trait locus (QTL) on chromosome arm 1RS of rye and its effect on yield performance of hexaploid wheat. Cereal Res. Commun. 22, 7–13.
Simons, K. J., Fellers, J. P., Trick, H. N., Zhang, Z. C., Tai, Y. S., Gill, B. S., et al. (2006). Molecular characterization of the major wheat domestication gene Q. Genetics 172, 547–555. doi: 10.1534/genetics.105.044727
Snape, J. W., Butterworth, K., Whitechurch, E., and Worland, A. J. (2001). Waiting for fine times: genetics of flowering time in wheat. Euphytica 119, 185–190. doi: 10.1023/A:1017594422176
Somers, D. J., Isaac, P., and Edwards, K. (2004). A high-density microsatellite consensus map for bread wheat (Triticum aestivum L.). Theor. Appl. Genet. 109, 1105–1114. doi: 10.1007/s00122-004-1740-7
Somyong, S., Munkvold, J. D., Tanaka, J., Benscher, D., and Sorrells, M. E. (2011). Comparative genetic analysis of a wheat seed dormancy QTL with rice and Brachypodium identifies candidate genes for ABA perception and calcium signaling. Funct. Integr. Genomics 11, 479–490. doi: 10.1007/s10142-011-0219-2
Stam, P. (1993). Construction of integrated genetic linkage maps by means of a new computer package: Join Map. Plant J. 3, 739–744. doi: 10.1111/j.1365-313XX.1993.00739.x
Tahmasebi, S., Heidari, B., Pakniyat, H., and Dadkhodaie, A. (2015). Consequences of 1RS/1BL translocation on agronomic and physiological traits in wheat. Cereal Res. Commun. 43, 554–566. doi: 10.1556/0806.43.2015.016
Van Ooijen, J. W. (2006). JoinMap® 4, Software for the Calculation of Genetic Linkage Maps in Experimental Populations. Wageningen: Kyazma B.V.
Van Os, H., Stam, P., Visser, R. G. F., and Van Eck, H. J. (2005). RECORD: a novel method for ordering loci on a genetic linkage map. Theor. Appl. Genet. 112, 30–40. doi: 10.1007/s00122-005-0097-x
Villareal, R. L., Banuelos, O., Mujeeb-Kazi, A., and Rajaram, S. (1998). Agronomic performance of chromosomes 1B and T1BL.1RS near-isolines in the spring bread wheat Seri M82. Euphytica 103, 195–202. doi: 10.1023/A:1018392002909
Villareal, R. L., DelToro, E., MujeebKazi, A., and Rajaram, S. (1995). The 1BL/1RS chromosome translocation effect on yield characteristics in a Triticum aestivum L cross. Plant Breed. 114, 497–500. doi: 10.1111/j.1439-0523.1995.tb00843.x
Vogel, J. P., Garvin, D. F., Mockler, T. C., Schmutz, J., Rokhsar, D., Bevan, M. W., et al. (2010). Genome sequencing and analysis of the model grass Brachypodium distachyon. Nature 463, 763–768. doi: 10.1038/nature08747
Wang, F. H., He, Z. H., Sayre, K., Li, S. D., Si, J. S., Feng, B., et al. (2009). Wheat cropping systems and technologies in China. Field Crops Res. 111, 181–188. doi: 10.1016/j.fcr.2008.12.004
Wang, J., Liu, W., Wang, H., Li, L., Wu, J., Yang, X., et al. (2011). QTL mapping of yield-related traits in the wheat germplasm 3228. Euphytica 177, 277–292. doi: 10.1007/s10681-010-0267-z
Wang, L., Niu, J. S., Li, Q. Y., Qin, Z., Ni, Y. J., and Xu, H. X. (2015). Allelic variance at the vernalization gene locus Vrn-D1 in a group of sister wheat (Triticum aestivum) lines and its effects on development. J. Agric. Sci. 153, 588–601. doi: 10.1017/S0021859614000409
Wang, S., Basten, C. J., and Zeng, Z. B. (2012). Windows QTL Cartographer 2.5. Department of Statistics, North Carolina State University, Raleigh, NC.
Wang, S. C., Wong, D. B., Forrest, K., Allen, A., Chao, S. M., Huang, B. E., et al. (2014). Characterization of polyploid wheat genomic diversity using a high-density 90 000 single nucleotide polymorphism array. Plant Biotechnol. J. 12, 787–796. doi: 10.1111/pbi.12183
Wang, Y. S., Du, Y. Y., Yang, Z. Y., Chen, L., Condon, A. G., and Hu, Y. G. (2015). Comparing the effects of GA-responsive dwarfing genes Rht13 and Rht8 on plant height and some agronomic traits in common wheat. Field Crops Res. 179, 35–43. doi: 10.1016/j.fcr.2015.04.010
Wu, Q. H., Chen, J. J., Chen, Y. X., Zhou, S. H., Fu, L., Zhang, D. Y., et al. (2015a). Mapping quantitative trait loci related to spike traits using a RIL population of Yanda 1817 × Beinong6 in wheat (Triticum aestivum L.). Acta Agron. Sin. 41, 349–358. doi: 10.3724/SP.J.1006.2015.00349
Wu, Q. H., Chen, Y. X., Zhou, S. H., Fu, L., Chen, J. J., Xiao, Y., et al. (2015b). High-density genetic linkage map construction and QTL mapping of grain shape and size in the wheat population Yanda1817 × Beinong6. PLoS ONE 10:e0118144. doi: 10.1371/journal.pone.0118144
Wu, X., Chang, X., and Jing, R. (2012). Genetic insight into yield-associated traits of wheat grown in multiple rain-fed environments. PLoS ONE 7:e31249. doi: 10.1371/journal.pone.0031249
Wu, X., Cheng, R., Xue, S., Kong, Z., Wan, H., Li, G., et al. (2014). Precise mapping of a quantitative trait locus interval for spike length and grain weight in bread wheat (Triticum aestivum L.). Mol. Breed. 33, 129–138. doi: 10.1007/s11032-013-9939-4
Xu, Y., Wang, R., Tong, Y., Zhao, H., Xie, Q., Liu, D., et al. (2014). Mapping QTLs for yield and nitrogen-related traits in wheat: influence of nitrogen and phosphorus fertilization on QTL expression. Theor. Appl. Genet. 127, 59–72. doi: 10.1007/s00122-013-2201-y
Youssefian, S., Kirby, E. J. M., and Gale, M. D. (1992). Pleiotropic effects of the GA-insensitive Rht dwarfing genes in wheat. 2. Effects on leaf, stem, ear and floret growth. Field Crops Res. 28, 191–210. doi: 10.1016/0378-4290(92)90040-G
Yu, M., Mao, S. L., Chen, G. Y., Pu, Z. E., Wei, Y. M., and Zheng, Y. L. (2014). QTLs for uppermost internode and spike length in two wheat RIL populations and their affect upon plant height at an individual QTL level. Euphytica 200, 95–108. doi: 10.1007/s10681-014-1156-7
Zhai, H. J., Feng, Z. Y., Liu, X. Y., Cheng, X. J., Peng, H. R., Yao, Y. Y., et al. (2015). A genetic linkage map with 178 SSR and 1 901 SNP markers constructed using a RIL population in wheat (Triticum aestivum L.). J. Integr. Agric. 14, 1697–1705. doi: 10.1016/S2095-3119(14)60902-3
Zhang, B., Liu, X., Xu, W. N., Chang, J. Z., Li, A., Mao, X. G., et al. (2015). Novel function of a putative MOC1 ortholog associated with spikelet number per spike in common wheat. Sci. Rep. 5, 13. doi: 10.1038/srep12211
Zhao, C. H., Cui, F., Wang, X. Q., Shan, S. C., Li, X. F., Bao, Y. G., et al. (2012). Effects of 1RS/1BL translocation in wheat on agronomic performance and quality characteristics. Field Crops Res. 127, 79–84. doi: 10.1016/j.fcr.2011.11.008
Keywords: SNP, SSR, QTL, spike morphology, plant height, wheat
Citation: Zhai H, Feng Z, Li J, Liu X, Xiao S, Ni Z and Sun Q (2016) QTL Analysis of Spike Morphological Traits and Plant Height in Winter Wheat (Triticum aestivum L.) Using a High-Density SNP and SSR-Based Linkage Map. Front. Plant Sci. 7:1617. doi: 10.3389/fpls.2016.01617
Received: 17 July 2016; Accepted: 12 October 2016;
Published: 07 November 2016.
Edited by:
Anna Maria Mastrangelo, Centro di Ricerca per l'Orticoltura (CRA), ItalyReviewed by:
Xiaoquan Qi, Institute of Botany (CAS), ChinaPeter Hedden, Rothamsted Research (BBSRC), UK
Soren K. Rasmussen, University of Copenhagen, Denmark
Marco Maccaferri, Decision Research, Italy
Copyright © 2016 Zhai, Feng, Li, Liu, Xiao, Ni and Sun. This is an open-access article distributed under the terms of the Creative Commons Attribution License (CC BY). The use, distribution or reproduction in other forums is permitted, provided the original author(s) or licensor are credited and that the original publication in this journal is cited, in accordance with accepted academic practice. No use, distribution or reproduction is permitted which does not comply with these terms.
*Correspondence: Zhongfu Ni, bml6ZkBjYXUuZWR1LmNu
Qixin Sun, cXhzdW5AY2F1LmVkdS5jbg==
 Huijie Zhai1,2
 Zhongfu Ni