 Bjoern O. Hansen
 Neha Vaid
 Magdalena Musialak-Lange
 Marcin Janowski
 Marek Mutwil
94% of researchers rate our articles as excellent or good
Learn more about the work of our research integrity team to safeguard the quality of each article we publish.
Find out more
FOCUSED REVIEW article
Front. Plant Sci., 19 August 2014
Volume 5 - 2014 | https://doi.org/10.3389/fpls.2014.00394
The analysis of gene expression data has shown that transcriptionally coordinated (co-expressed) genes are often functionally related, enabling scientists to use expression data in gene function prediction. This Focused Review discusses our original paper (Large-scale co-expression approach to dissect secondary cell wall formation across plant species, Frontiers in Plant Science 2:23). In this paper we applied cross-species analysis to co-expression networks of genes involved in cellulose biosynthesis. We showed that the co-expression networks from different species are highly similar, indicating that whole biological pathways are conserved across species. This finding has two important implications. First, the analysis can transfer gene function annotation from well-studied plants, such as Arabidopsis, to other, uncharacterized plant species. As the analysis finds genes that have similar sequence and similar expression pattern across different organisms, functionally equivalent genes can be identified. Second, since co-expression analyses are often noisy, a comparative analysis should have higher performance, as parts of co-expression networks that are conserved are more likely to be functionally relevant. In this Focused Review, we outline the comparative analysis done in the original paper and comment on the recent advances and approaches that allow comparative analyses of co-function networks. We hypothesize that in comparison to simple co-expression analysis, comparative analysis would yield more accurate gene function predictions. Finally, by combining comparative analysis with genomic information of green plants, we propose a possible composition of cellulose biosynthesis machinery during earlier stages of plant evolution.
The functional annotation of genes is essential for understanding how biological processes are formed, organized, and how they operate. As gene function can mean different things to different people, it is crucial to use controlled vocabulary to define it. To this end, Gene Ontology consortium defined three domains needed to fully describe gene function: Cellular Component (CC—location of gene's activity: e.g., chloroplast lumen, nucleus, small subunit of ribosome), Molecular Function (MF—activity of the gene: e.g., protein binding, protein kinase, carboxylase) and Biological Process (BP—what context is the gene active in: e.g., photosynthesis, protein synthesis, apoptosis) (Ashburner et al., 2000). For example, Arabidopsis thaliana cellulose synthase AtCESA1 is active in plasma membrane (Ilic et al., 2007), during cell wall formation (BP), where it has β-(1→4)-glucan synthase activity (MF) (http://www.geneontology.org/). Other popular ontologies include Plant Ontology (anatomy and developmental stages) and Mapman Ontology (visualization of metabolic pathways and other processes) (Thimm et al., 2004; Ilic et al., 2007). While over 40% of the genes in Arabidopsis thaliana have at least one of the three domains experimentally revealed, less than 10% of the genes have all three domains verified (reviewed in Rhee and Mutwil, 2014). Therefore, the elucidation of gene function is still one of major hurdles that plant biologists need to overcome.
As the experimental elucidation of function for every gene in Arabidopsis is progressing slowly at current pace, researchers have been turning to in silico approaches for assistance in predicting gene function. While a prediction cannot replace experimental proof of gene function, it can be very helpful in suggesting MF, BP, and CC domains of the cryptic gene. Consequently, this can narrow down experiments necessary to verify function. This makes gene function prediction one of the most active areas of bioinformatics, with many different flavors of analyses being constantly developed (Radivojac et al., 2013; Rhee and Mutwil, 2014).
KEY CONCEPT 1. Gene function prediction
Bioinformatical method than can estimate function of uncharacterized genes by associating them with genes with known function (for a review see, Rhee and Mutwil, 2014).
In this review, we briefly introduce different gene function prediction methods with special focus on comparative co-expression analysis, and its applications in gene function prediction and function evolution.
Prediction methods are based on the guilt by association principle, where genes are linked by some shared characteristics, such as DNA sequence similarity, similar RNA expression levels or protein 3-D structure (Eisen et al., 1998). If an uncharacterized gene is very similar to a characterized gene, the guilt by association principle states that they are likely to have same function. Different approaches are applicable to elucidate different domains of gene function (Rhee and Mutwil, 2014). For example, genomic analyses use DNA or protein sequences to annotate genes based on sequence similarity (useful to elucidate MF), or by investigating which families co-evolve through evolution (BP). Protein-protein interaction data can indicate which proteins are likely to be involved in same BP or cellular compartment (BP, CC). It is important to keep in mind that different methods are applicable to elucidate only one domain of gene function. For example, sequence similarity analysis might reveal that a gene has MF of protein kinase, but it does not reveal the targets of the kinase or which BP or CC the kinase is active in. On the other hand, protein-protein interaction data might imply that a gene is a subunit of proteasome (i.e., BP: protein degradation), but it does not reveal the MF of the gene. Consequently, current prediction methods combine various data sources in attempt to simultaneously elucidate multiple domains of gene function (Lee et al., 2010; Kourmpetis et al., 2011).
KEY CONCEPT 2. Guilt by association
In gene function prediction, this principle states that the more characteristics (such as sequence, structure, expression, etc.) two genes have in common, the more likely are they to have same function.
Co-expression analysis is a popular method in gene function prediction that uses transcriptomic data (in form of microarrays or RNA sequencing data) to group genes according to the similarity of their expression profiles (Usadel et al., 2009). While the analysis is not suitable to reveal MF of a gene, it has been shown that genes involved in same BP and Cellular Compartment tend to have similar expression profiles (Persson et al., 2005; Ryngajllo et al., 2011). Co-expression relationships between genes can be represented as networks, where nodes represent genes and edges (also called vertices or links) represent significant co-expression relationships between genes (Usadel et al., 2009). The network representation provides a convenient, human-readable representation of the many-to-many relationships between genes and is being used by numerous online tools (Usadel et al., 2009). In addition, availability of many mathematical and heuristic methods in network theory can be applied to estimate the properties and quality of the networks (reviewed in Handl et al., 2005). Finally, network-centric methods, such as estimation of enriched (statistically overrepresented) functions of network neighbors or genes within a cluster can be applied (Sharan et al., 2007; Janga et al., 2011).
KEY CONCEPT 3. Co-expression analysis
Guilt by association based approach, where genes that have similar mRNA expression profiles across various tissues are assumed to be functionally related.
The caveats of co-expression analysis include large amount of false negatives, as most abundant microarrays for plants are missing ~40% of genes (Mutwil et al., 2011). In addition, the analysis might return erroneous results if a tissue or perturbation relevant for studied BP is missing. For example, if microarrays comprising flower tissues are absent, any query with flower specific genes will return either none or erroneous results. Furthermore, the resolution of observations captured by microarrays is also important. For instance, if the microarray compendia contains microarrays for whole flowers, but not for different organs of flowers (e.g., sepals, petals, carpels, and stamens), performing a query with a petal-specific gene will likely return flower-specific genes instead. Finally, intuitively, the analysis works best for genes under strong transcriptional control, but a priori knowledge if this is the case for the gene of interest is often missing. Recent study has shown that predictions involving primary and secondary metabolism pathways perform much better than predictions in hormonal regulation or cell wall biosynthesis (Kleessen et al., 2013). Nonetheless, the analysis has been successfully applied numerous times to elucidate new members of biological processes, including cell walls (Persson et al., 2005; Maeda et al., 2011; Han et al., 2012).
Shortcomings of co-expression analysis can be partially remedied by extracting analogous co-expression network from multiple species. The principle behind such analysis is that biologically relevant associations are likely to be independently observed in the different species, whereas false associations are less likely to be repeatedly observed. Indeed, sets of genes that are conserved at both sequence and expression levels among multiple species are expected to play a key role in biological responses (Stuart et al., 2003). Therefore, comparative analysis can be thought as biologically meaningful approach to remove false positives (present due to noise in the data) and false negatives (due to missing data in one of the species).
Comparative co-expression analysis is beneficial for several reasons. First, biologically irrelevant relationships generated by noise in the data are not likely to reappear multiple times in the co-expression networks in different species. Hence, the number of false positives should be decreased by inclusion of more analogous networks in the analysis. Second, high-quality co-expression networks might help improve poor co-expression networks, decreasing number of false positives. For example, a co-expression network representing detailed atlas of tissues (e.g., sepals, petals, carpels, and stamens) might help resolve a less detailed network (e.g., consisting of whole flowers only). Third, the comparative analysis provides a more powerful method to transfer functional information from a model organism (such as Arabidopsis), to other species. Since comparative co-expression analysis combines co-expression (capable to elucidate BP and CC) with sequence similarity analysis (capable of elucidating MF), all three domains of gene function are interrogated simultaneously. Comparative co-expression analysis can therefore suggest a gene that has the same sequence and the same co-expression profile between species, producing a much stronger prediction than the individual analyses. It is important to keep in mind that the species that are being compared should contain the studied BP. Obviously, comparison of co-expression networks representing photosynthesis is feasible between Arabidopsis and rice but not between Arabidopsis and E. coli.
KEY CONCEPT 4. Comparative co-expression analysis
A method to extract relevant prediction by emphasizing co-expression relationships found independently in multiple species.
There are now numerous tools that allow comparative co-expression analyses (reviewed in Movahedi et al., 2012). Examples include Co-expressed biological Processes (CoP) (Ogata et al., 2010), expression context conservation (ECC) (Movahedi et al., 2011), Gene Co-Expression Analysis Toolbox (GeneCAT) (Mutwil et al., 2008), Plant Network (PlaNet) (Mutwil et al., 2011), STARNET2 (Jupiter et al., 2009), and Expressolog Tree Viewer (Patel et al., 2012). The tools, with exception of PlaNet, compare the co-expression networks between species in a pairwise manner. PlaNet has an additional feature of being able to combine and display information about conserved networks in multiple species. While the original paper that this review is addressing was based on output of PlaNet, in here we are performing a manual analysis. The script to make the analyses is available from http://aranet.mpimp-golm.mpg.de/download/frontiers2014.zip.
Biosynthesis of plant cell walls has received much attention from bioinformatics (Brown et al., 2005; Persson et al., 2005; Mutwil et al., 2008; Ruprecht et al., 2011). Plant cell walls function as a cellular exoskeleton that defines cell shape and functions as a barrier against environmental threats (Somerville, 2006; Liepman et al., 2010). The cell wall is composed mainly of carbohydrate-based polysaccharides, such as cellulose, hemicelluloses, and pectins, along with polyphenolic lignins, and various glycosylated proteins. Cell walls have been classified into primary cell walls (PCW) and secondary cell walls (SCW), largely depending on the wall function and composition (Carpita et al., 1997). While the PCW in higher plants consists of cellulose, hemicelluloses, and pectins, SCW mainly contains cellulose, xylans, and lignin.
The polysaccharides and glycoproteins, with the exception of cellulose, are synthesized as oligomeric structures in the Golgi, and are subsequently transported to the cell surface where they are incorporated into the cell wall (Geisler et al., 2008). These oligomers are assembled by various glycosyltransferases, potentially working as larger protein complexes during synthesis (Lerouxel et al., 2006; Scheller and Ulvskov, 2010). Cellulose is synthesized at the plasma membrane by multimeric cellulose synthase (CESA) complexes (Somerville, 2006). The CESA complexes consist of three different CESA proteins. Consequently, the CESA-complex that is active during PCW formation consists of the CESA-1, -3, and -6-related proteins (Desprez et al., 2007), while the SCW complex consists of three CESA-4, -7, and -8 (Turner and Somerville, 1997). PCW CESAs, and consequently new cellulose microfibrils co-align with microtubules (Paredez et al., 2006), due to POM2 mediating interaction between CESAs and microtubules (Gu et al., 2010; Bringmann et al., 2012). While many proteins important for PCW and SCW formation are already known, new players are being constantly discovered (McFarlane et al., 2014).
In addition, it has been shown that both PCW and SCW CESAs, can be used as baits to find other genes associated with cell wall production via co-expression analysis (Brown et al., 2005; Persson et al., 2005). These studies revealed genes involved in xylan and lignin synthesis were transcriptionally coordinated with the SCW CESAs. Similar approaches have been applied to synthesis of the PCW hemicellulose xyloglucan (Cocuron et al., 2007). Cocuron et al. (2007) showed that the Arabidopsis AtCSLC4 gene, which is presumably involved and synthesizing glucan backbone for the xyloglucan, was co-expressed with other genes associated with xyloglucan synthesis (Liepman and Cavalier, 2012). Furthermore, an analysis of transcriptional coordination of cell wall-related gene families in Arabidopsis revealed that members of some of the gene families tend to be co-expressed, e.g., different chitinase family members tend to be transcriptionally associated with different CESA members (Mutwil et al., 2009). In total, identification of at least eight new genes associated with the cell wall growth is credited to the co-expression analysis (Brown et al., 2005; Persson et al., 2005; Ruprecht et al., 2011).
To illustrate how to manually perform comparative co-expression analysis, we have downloaded co-expression networks of Arabidopsis and rice from PlaNet (http://aranet.mpimp-golm.mpg.de/download/). The networks comprise 21,159 and 39,109 genes for Arabidopsis and rice, respectively. To isolate co-expression networks involved in PCW and SCW biosynthesis, AtCESA-1,-3-6, AtCESA-4,-7,-8, and corresponding PCW and SCW CESAs from rice were used as queries for the networks (Ruprecht et al., 2011). Next, to extract genes associated with cell wall biosynthesis, all nodes (genes) within two steps of the CESAs were collected. In total, 362 and 261 PCW genes and 111 and 122 SCW genes were found from Arabidopsis and rice, respectively. The PCW networks are larger, due to more ubiquitous expression profiles of the genes. This is in contrast to SCW-related genes, which are mostly expressed in stems and roots (Mutwil et al., 2008). These networks were used for the following analysis.
To compare Arabidopsis and rice PCW and SCW co-expression networks in terms of similarity, occurrence of gene families defined by PLAZA (http://bioinformatics.psb.ugent.be/plaza/), was measured (Figure 1). It is important to note that in original paper we have used PFAM domains to classify genes into gene families, but we have recently found that PLAZA classifiers perform better (Mutwil et al., submitted). The comparison was carried out by counting the number of networks a given family was present in. For example, since each of the four networks contains CESA family, the family should be counted four times. The result of the analysis can be seen on Figure 1 and Table 1.
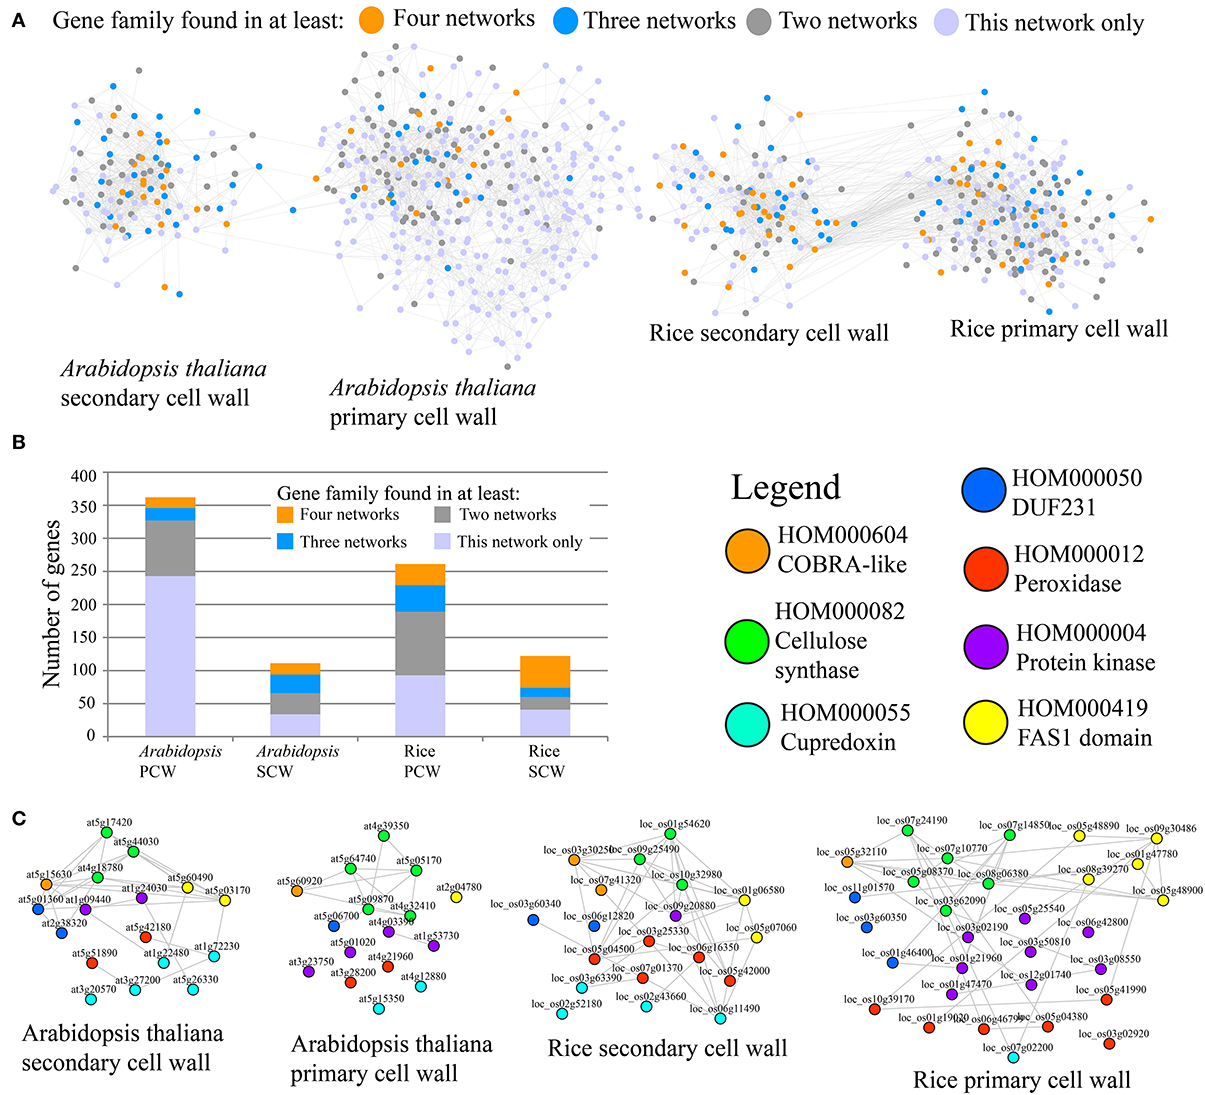
Figure 1. Comparative co-expression networks of cellulose biosynthesis. (A) Co-expression networks of Arabidopsis and rice primary secondary cell walls. Nodes and edges represent genes and co-expression relationships between genes, respectively. Node colors indicate degree of conservation of families present in the four networks (legend). (B) Distribution of conservation classes in the four networks. The y-axis represents total number of genes, while the x-axis represents the four analyzed cell wall networks. Color of the bars depict degree of conservation. (C) Filtered PCW and SCW networks where genes that belong to families present in all four networks are shown. Nodes are color-coded according to the family they belong to.
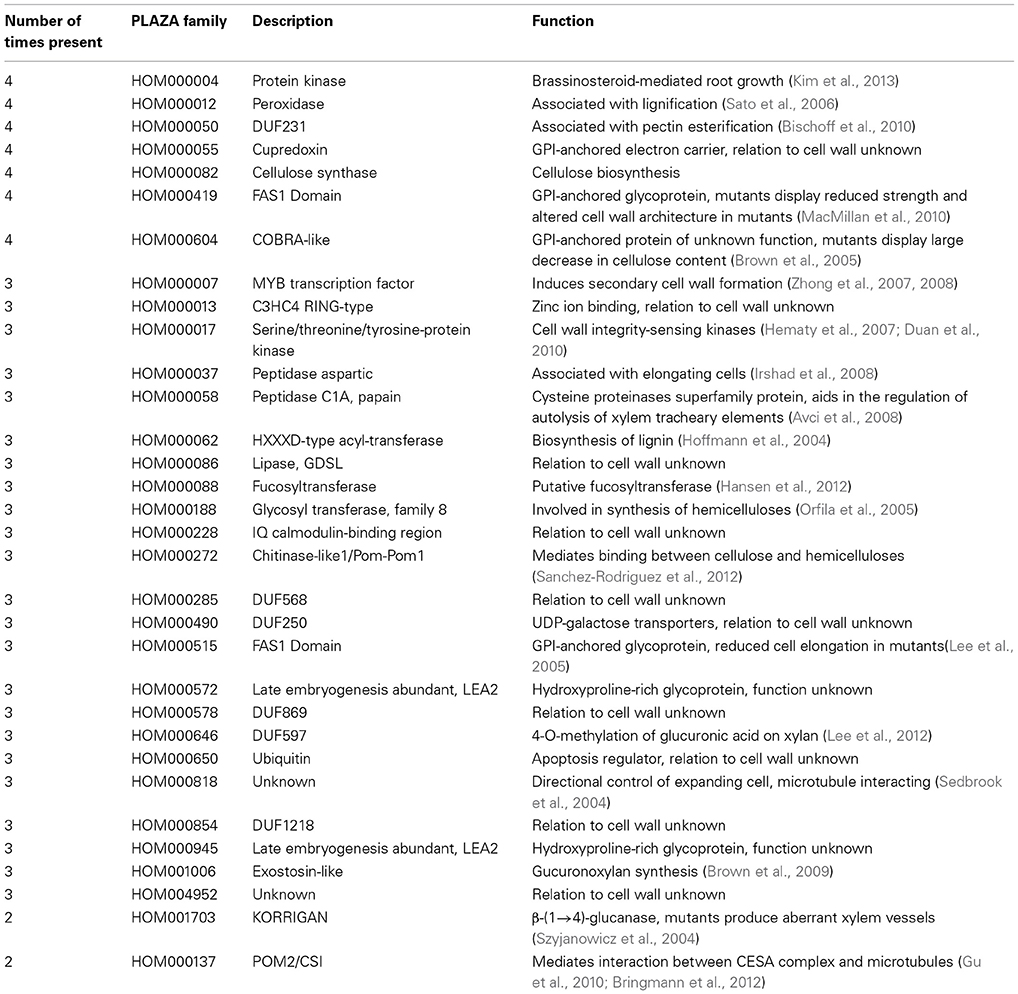
Table 1. Annotation of the families enriched in the four networks.
A representation of the four co-expression networks is show in Figure 1A. The nodes (genes) are labeled according to the frequency of the gene family it belongs to. A large number of gene families were present in two, three, or four of the networks (Figure 1A). Apart from Arabidopsis PCW network, more than half of genes belong to conserved families, with SCW networks being especially conserved (Figure 1B). Though many of the highly conserved families have been implicated in cell wall biosynthesis, several of the families at the moment have no known function, and are good candidates for functional characterization (Table 1). A highly conserved core of genes belonging to families present in the four networks is shown in Figure 1C. Interestingly, many of the genes in conserved networks are potentially redundant, due to high similarity of gene sequence and expression profiles. For example, each network contains more than one gene belonging to peroxidase family. Uncovering a knock-out phenotype of the peroxidases might necessitate generation of multiple peroxidase knock-outs (Figure 1C).
It is important to note that while many of the highly conserved families are important for cell wall formation, known complex members of the CESA complex are not among the most highly conserved (Table 1). Known complex members include POM2/CSI and KORRIGAN (McFarlane et al., 2014). POM2 (HOM001703) mediates interaction of PCW CESA complex with the microtubules (Gu et al., 2010; Bringmann et al., 2012) and is found to be associated with PCW networks only (Table 1). KORRIGAN (HOM000137), a putative β-(1→4)-glucanase, is similarly found to be associated with PCW networks exclusively (Table 1). Whether or not SCW CESA complex too is interacting with POM2 and KORRIGAN (or their equivalents) is currently unknown and not revealed by the analysis. Furthermore, many of the top conserved families are not directly involved in cellulose biosynthesis, but rather represent various processes that together are important for PCW and SCW formation (e.g., production of hemicelluloses and lignins).
To test how conservation of gene families in networks corresponds to their relevance, we have counted the amount of cell wall relevant genes present in the conserved families. This was done by counting number of genes annotated with Mapman ontology term 10 (“cell wall”) and 35 (“unknown”). The results show that when the degree of family conservation decreases from four to one, the number of genes that are not relevant for cell wall biosynthesis dramatically increases (Figure 2, denoted by white bar). Therefore, we conclude that that highly conserved families are more functionally relevant, which is in line with studies carried out in humans, flies, worms, and yeast (Stuart et al., 2003).
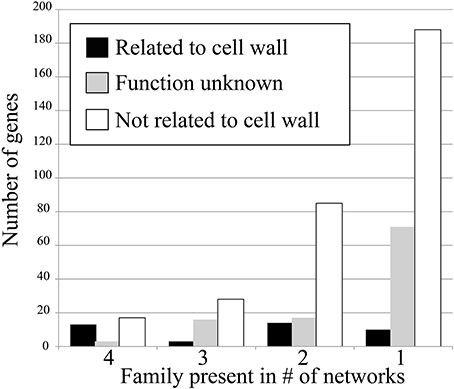
Figure 2. Number of cell wall-related genes in the four conservation classes. Genes that are cell wall related (Mapman ontology term 10) are shown in black, genes with unknown function (term 35) are shown in gray, and genes not related to cell wall (any term but 10 and 35) are shown in white.
As more plant genomes are becoming available, comparative genomics are increasingly being used by researches to address some of the major questions in developmental plant biology. Whole plant kingdom has descended from a eukaryotic ancestor that acquired a photosynthetic cyanobacterium as an endosymbiot (reviewed in Bowman et al., 2007 and Banks, 2009). Plants consist of three distinct groups: rhodophytes (red algae), the glaucophytes (little-known freshwater algae), and the green plants (green algae and land plants). The rhodophytes are marine algae that comprise reef-building coralline algae, and provide a source of agar and billion-dollar nori industry in Japan. The highly diverse green plants make up two major clades: the chlorophytes (freshwater and marine algae) and the streptophytes (land plants and paraphyletic charophycean freshwater algae). The land plants pioneered and dominated the land and provided a platform for subsequent colonization of the land surface.
Plants underwent multiple revolutionary changes since the endosymbiosis of the cyanobacterium some 1.6 billion years ago (Bowman et al., 2007) (Figure 3A). These include, among others, multicellularity (King, 2004; Ruiz-Trillo et al., 2007), move to land, apical growth (Ueda and Laux, 2012), development of vasculature (Banks, 2009) and flowers (Adams, 2013). Current comparative genomic analyses can indicate which morphological features of plants are associated with emergence or loss of gene families. However, the analyses are based on static genomic data and are investigating functional association of individual genes. It would be therefore beneficial to combine comparative genomic data with comparative transcriptomic data, to elucidate evolution of biological pathways.
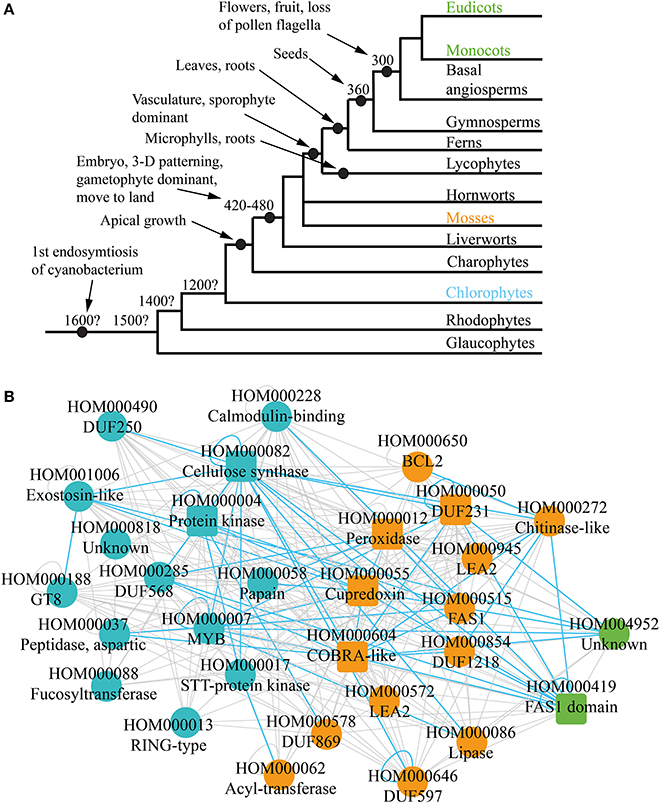
Figure 3. Phylogenetic analysis of the co-expression networks. (A) Depicted are relationships among the lineages of plants. Estimated dates for some nodes are shown in millions of years before the present date. Major events are demarcated by black nodes and arrows. (B) Gene family consensus network depicting first appearance of the conserved families. Blue, orange, and green represent appearance in charophytes, mosses, and monocots and eudicots, respectively. Square and round nodes represent families present in four and three of the networks, respectively.
While cellulose biosynthesis co-expression networks have been studied extensively in angiosperms (Brown et al., 2005; Persson et al., 2005; Mutwil et al., 2008; Ruprecht et al., 2011), not much is known about the networks in older lineages of green plants, as transcriptomic data for non-angiosperms is scarce. However, it is possible to suggest an ancestral network by combining the four cell wall networks, and retaining only conserved relationships. Apart from indicating conserved gene families, such “consensus” network can show conservation of associations between families. For example, CESA genes are present in all four networks and are always co-expressed with each other (green nodes on Figure 1C). This re-occuring transcriptional association is represented with conserved self-loop (Figure 3B, demarcated by blue loop). Conserved transcriptional associations are also observed between CESA, COBRA, MYB, and other families (Figure 3B, depicted by blue edges). Since the consensus network is obtained by comparing transcriptomic and genomic data from monocots and dicots, we hypothesize that it approximates cellulose synthase network as it was present in one of the ancestors of angiosperms.
Comparative genomic analyses observe presence and absence of gene families in the major lineages of plants (Van Bel et al., 2012). For example, if a family is not present in chlorophytes, but can be found in mosses and angiosperms, one can assume that the family arose somewhere between chlorophytes and mosses (Figure 3A). This information can be readily mapped onto the ancestral network, to elucidate which parts of the network lack the potential to be found in chlorophytes, mosses, and angiosperms (Figure 3B). Around half of the families are found in chlorophytes (blue nodes), and contain many relevant families, such as CESAS, GT8, Exostosin-like, and others (Table 1, Figure 3B). Another half of the network can only be found from mosses on (orange nodes) and also contain many relevant families, such as DUF231, COBRA-like, and FAS1. Surprisingly, very few changes regarding cellulosic wall biosynthesis seem to have happened between mosses and angiosperms, as only two new families have appeared in this period (green nodes). While chlorophytes do produce a cellulose-like polymer mannan by a family similar to cellulose synthases, their cell walls consists mainly of hydroxylproline-rich proteins (Voigt and Frank, 2003; Yin et al., 2009). Since moss cell walls resemble those of higher plants (Roberts et al., 2012), one can speculate that the moss-specific families are associated with biosynthesis of cellulose-rich cell walls found in land plants (Figure 3B).
Comparative transcriptomic analyses have great potential to elucidate gene function, mediate functional annotation, and study evolution of biological pathways. With steadily increasing amount of transcriptomic and genomic data for non-angiosperms, the conclusions taken from such analyses will improve. Furthermore, the analyses presented here are not limited to transcriptomic data, but can easily be fitted to other co-function gene networks. We envision that future analyses will employ co-function networks based on transcriptomic and protein-protein interaction data, spanning from glaucophytes to angiosperms.
The authors declare that the research was conducted in the absence of any commercial or financial relationships that could be construed as a potential conflict of interest.
We thank Dr. Staffan Persson for useful discussions and MPIMP for funding.

Adams, K. (2013). Genomics. Genomic clues to the ancestral flowering plant. Science 342, 1456–1457. doi: 10.1126/science.1248709
Ashburner, M., Ball, C. A., Blake, J. A., Botstein, D., Butler, H., Cherry, J. M., et al. (2000). Gene ontology: tool for the unification of biology. The Gene Ontology Consortium. Nat. Genet. 25, 25–29. doi: 10.1038/75556
Avci, U., Petzold, H. E., Ismail, I. O., Beers, E. P., and Haigler, C. H. (2008). Cysteine proteases XCP1 and XCP2 aid micro-autolysis within the intact central vacuole during xylogenesis in Arabidopsis roots. Plant J. 56, 303–315. doi: 10.1111/j.1365-313X.2008.03592.x
Banks, J. A. (2009). Selaginella and 400 million years of separation. Annu. Rev. Plant Biol. 60, 223–238. doi: 10.1146/annurev.arplant.59.032607.092851
Bischoff, V., Selbig, J., and Scheible, W. R. (2010). Involvement of TBL/DUF231 proteins into cell wall biology. Plant Signal. Behav. 5, 1057–1059. doi: 10.4161/psb.5.8.12414
Bowman, J. L., Floyd, S. K., and Sakakibara, K. (2007). Green genes-comparative genomics of the green branch of life. Cell 129, 229–234. doi: 10.1016/j.cell.2007.04.004
Bringmann, M., Li, E., Sampathkumar, A., Kocabek, T., Hauser, M. T., and Persson, S. (2012). POM-POM2/cellulose synthase interacting1 is essential for the functional association of cellulose synthase and microtubules in Arabidopsis. Plant Cell 24, 163–177. doi: 10.1105/tpc.111.093575
Brown, D. M., Zeef, L. A., Ellis, J., Goodacre, R., and Turner, S. R. (2005). Identification of novel genes in Arabidopsis involved in secondary cell wall formation using expression profiling and reverse genetics. Plant Cell 17, 2281–2295. doi: 10.1105/tpc.105.031542
Brown, D. M., Zhang, Z., Stephens, E., Dupree, P., and Turner, S. R. (2009). Characterization of IRX10 and IRX10-like reveals an essential role in glucuronoxylan biosynthesis in Arabidopsis. Plant J. 57, 732–746. doi: 10.1111/j.1365-313X.2008.03729.x
Carpita, N., McCann, M., and Griffing, L. R. (1997). Back to the walls. Plant Cell 9, 281–282. doi: 10.1105/tpc.9.3.281
Cocuron, J. C., Lerouxel, O., Drakakaki, G., Alonso, A. P., Liepman, A. H., Keegstra, K., et al. (2007). A gene from the cellulose synthase-like C family encodes a beta-1,4 glucan synthase. Proc. Natl. Acad. Sci. U.S.A. 104, 8550–8555. doi: 10.1073/pnas.0703133104
Desprez, T., Juraniec, M., Crowell, E. F., Jouy, H., Pochylova, Z., Parcy, F., et al. (2007). Organization of cellulose synthase complexes involved in primary cell wall synthesis in Arabidopsis thaliana. Proc. Natl. Acad. Sci. U.S.A. 104, 15572–15577. doi: 10.1073/pnas.0706569104
Duan, Q., Kita, D., Li, C., Cheung, A. Y., and Wu, H. M. (2010). FERONIA receptor-like kinase regulates RHO GTPase signaling of root hair development. Proc. Natl. Acad. Sci. U.S.A. 107, 17821–17826. doi: 10.1073/pnas.1005366107
Eisen, M. B., Spellman, P. T., Brown, P. O., and Botstein, D. (1998). Cluster analysis and display of genome-wide expression patterns. Proc. Natl. Acad. Sci. U.S.A. 95, 14863–14868. doi: 10.1073/pnas.95.25.14863
Geisler, D. A., Sampathkumar, A., Mutwil, M., and Persson, S. (2008). Laying down the bricks: logistic aspects of cell wall biosynthesis. Curr. Opin. Plant Biol. 11, 647–652. doi: 10.1016/j.pbi.2008.08.003
Gu, Y., Kaplinsky, N., Bringmann, M., Cobb, A., Carroll, A., Sampathkumar, A., et al. (2010). Identification of a cellulose synthase-associated protein required for cellulose biosynthesis. Proc. Natl. Acad. Sci. U.S.A. 107, 12866–12871. doi: 10.1073/pnas.1007092107
Han, X., Yin, L., and Xue, H. (2012). Co-expression analysis identifies CRC and AP1 the regulator of Arabidopsis fatty acid biosynthesis. J. Integr. Plant Biol. 54, 486–499. doi: 10.1111/j.1744-7909.2012.01132.x
Handl, J., Knowles, J., and Kell, D. B. (2005). Computational cluster validation in post-genomic data analysis. Bioinformatics 21, 3201–3212. doi: 10.1093/bioinformatics/bti517
Hansen, S. F., Harholt, J., Oikawa, A., and Scheller, H. V. (2012). Plant glycosyltransferases beyond CAZy: a perspective on DUF families. Front. Plant Sci. 3:59. doi: 10.3389/fpls.2012.00059
Hematy, K., Sado, P. E., Van Tuinen, A., Rochange, S., Desnos, T., Balzergue, S., et al. (2007). A receptor-like kinase mediates the response of Arabidopsis cells to the inhibition of cellulose synthesis. Curr. Biol. 17, 922–931. doi: 10.1016/j.cub.2007.05.018
Hoffmann, L., Besseau, S., Geoffroy, P., Ritzenthaler, C., Meyer, D., Lapierre, C., et al. (2004). Silencing of hydroxycinnamoyl-coenzyme A shikimate/quinate hydroxycinnamoyltransferase affects phenylpropanoid biosynthesis. Plant Cell 16, 1446–1465. doi: 10.1105/tpc.020297
Ilic, K., Kellogg, E. A., Jaiswal, P., Zapata, F., Stevens, P. F., Vincent, L. P., et al. (2007). The plant structure ontology, a unified vocabulary of anatomy and morphology of a flowering plant. Plant Physiol. 143, 587–599. doi: 10.1104/pp.106.092825
Irshad, M., Canut, H., Borderies, G., Pont-Lezica, R., and Jamet, E. (2008). A new picture of cell wall protein dynamics in elongating cells of Arabidopsis thaliana: confirmed actors and newcomers. BMC Plant Biol. 8:94. doi: 10.1186/1471-2229-8-94
Janga, S. C., Diaz-Mejia, J. J., and Moreno-Hagelsieb, G. (2011). Network-based function prediction and interactomics: the case for metabolic enzymes. Metab. Eng. 13, 1–10. doi: 10.1016/j.ymben.2010.07.001
Jupiter, D., Chen, H., and Vanburen, V. (2009). STARNET 2: a web-based tool for accelerating discovery of gene regulatory networks using microarray co-expression data. BMC Bioinformatics 10:332. doi: 10.1186/1471-2105-10-332
Kim, M. H., Kim, Y., Kim, J. W., Lee, H. S., Lee, W. S., Kim, S. K., et al. (2013). Identification of Arabidopsis BAK1-associating receptor-like kinase 1 (BARK1) and characterization of its gene expression and brassinosteroid-regulated root phenotypes. Plant Cell Physiol. 54, 1620–1634. doi: 10.1093/pcp/pct106
King, N. (2004). The unicellular ancestry of animal development. Dev. Cell 7, 313–325. doi: 10.1016/j.devcel.2004.08.010
Kleessen, S., Klie, S., and Nikoloski, Z. (2013). Data integration through proximity-based networks provides biological principles of organization across scales. Plant Cell 25, 1917–1927. doi: 10.1105/tpc.113.111039
Kourmpetis, Y. A., Van Dijk, A. D., Van Ham, R. C., and Ter Braak, C. J. (2011). Genome-wide computational function prediction of Arabidopsis proteins by integration of multiple data sources. Plant Physiol. 155, 271–281. doi: 10.1104/pp.110.162164
Lee, C., Teng, Q., Zhong, R., Yuan, Y., Haghighat, M., and Ye, Z. H. (2012). Three Arabidopsis DUF579 domain-containing GXM proteins are methyltransferases catalyzing 4-o-methylation of glucuronic acid on xylan. Plant Cell Physiol. 53, 1934–1949. doi: 10.1093/pcp/pcs138
Lee, I., Ambaru, B., Thakkar, P., Marcotte, E. M., and Rhee, S. Y. (2010). Rational association of genes with traits using a genome-scale gene network for Arabidopsis thaliana. Nat. Biotechnol. 28, 149–156. doi: 10.1038/nbt.1603
Lee, K. J., Sakata, Y., Mau, S. L., Pettolino, F., Bacic, A., Quatrano, R. S., et al. (2005). Arabinogalactan proteins are required for apical cell extension in the moss Physcomitrella patens. Plant Cell 17, 3051–3065. doi: 10.1105/tpc.105.034413
Lerouxel, O., Cavalier, D. M., Liepman, A. H., and Keegstra, K. (2006). Biosynthesis of plant cell wall polysaccharides - a complex process. Curr. Opin. Plant Biol. 9, 621–630. doi: 10.1016/j.pbi.2006.09.009
Liepman, A. H., and Cavalier, D. M. (2012). The CELLULOSE SYNTHASE-LIKE A and CELLULOSE SYNTHASE-LIKE C families: recent advances and future perspectives. Front. Plant Sci. 3:109. doi: 10.3389/fpls.2012.00109
Liepman, A. H., Wightman, R., Geshi, N., Turner, S. R., and Scheller, H. V. (2010). Arabidopsis - a powerful model system for plant cell wall research. Plant J. 61, 1107–1121. doi: 10.1111/j.1365-313X.2010.04161.x
MacMillan, C. P., Mansfield, S. D., Stachurski, Z. H., Evans, R., and Southerton, S. G. (2010). Fasciclin-like arabinogalactan proteins: specialization for stem biomechanics and cell wall architecture in Arabidopsis and Eucalyptus. Plant J. 62, 689–703. doi: 10.1111/j.1365-313X.2010.04181.x
Maeda, H., Yoo, H., and Dudareva, N. (2011). Prephenate aminotransferase directs plant phenylalanine biosynthesis via arogenate. Nat. Chem. Biol. 7, 19–21. doi: 10.1038/nchembio.485
McFarlane, H. E., Doring, A., and Persson, S. (2014). The cell biology of cellulose synthesis. Annu. Rev. Plant Biol. 65, 69–94. doi: 10.1146/annurev-arplant-050213-040240
Movahedi, S., Van Bel, M., Heyndrickx, K. S., and Vandepoele, K. (2012). Comparative co-expression analysis in plant biology. Plant Cell Environ. 35, 1787–1798. doi: 10.1111/j.1365-3040.2012.02517.x
Movahedi, S., Van De Peer, Y., and Vandepoele, K. (2011). Comparative network analysis reveals that tissue specificity and gene function are important factors influencing the mode of expression evolution in Arabidopsis and rice. Plant Physiol. 156, 1316–1330. doi: 10.1104/pp.111.177865
Mutwil, M., Klie, S., Tohge, T., Giorgi, F. M., Wilkins, O., Campbell, M. M., et al. (2011). PlaNet: combined sequence and expression comparisons across plant networks derived from seven species. Plant Cell 23, 895–910. doi: 10.1105/tpc.111.083667
Mutwil, M., Obro, J., Willats, W. G., and Persson, S. (2008). GeneCAT–novel webtools that combine BLAST and co-expression analyses. Nucleic Acids Res. 36, W320–W326. doi: 10.1093/nar/gkn292
Mutwil, M., Ruprecht, C., Giorgi, F. M., Bringmann, M., Usadel, B., and Persson, S. (2009). Transcriptional wiring of cell wall-related genes in Arabidopsis. Mol. Plant 2, 1015–1024. doi: 10.1093/mp/ssp055
Ogata, Y., Suzuki, H., Sakurai, N., and Shibata, D. (2010). CoP: a database for characterizing co-expressed gene modules with biological information in plants. Bioinformatics 26, 1267–1268. doi: 10.1093/bioinformatics/btq121
Orfila, C., Sorensen, S. O., Harholt, J., Geshi, N., Crombie, H., Truong, H. N., et al. (2005). QUASIMODO1 is expressed in vascular tissue of Arabidopsis thaliana inflorescence stems, and affects homogalacturonan and xylan biosynthesis. Planta 222, 613–622. doi: 10.1007/s00425-005-0008-z
Paredez, A. R., Somerville, C. R., and Ehrhardt, D. W. (2006). Visualization of cellulose synthase demonstrates functional association with microtubules. Science 312, 1491–1495. doi: 10.1126/science.1126551
Patel, R., Nahal, H., Breit, R., and Provart, N. (2012). BAR expressolog identification: expression profile similarity ranking of homologous genes in plant species. Plant J. 71, 1038. doi: 10.1111/j.1365-313X.2012.05055.x
Persson, S., Wei, H., Milne, J., Page, G. P., and Somerville, C. R. (2005). Identification of genes required for cellulose synthesis by regression analysis of public microarray data sets. Proc. Natl. Acad. Sci. U.S.A. 102, 8633–8638. doi: 10.1073/pnas.0503392102
Radivojac, P., Clark, W. T., Oron, T. R., Schnoes, A. M., Wittkop, T., Sokolov, A., et al. (2013). A large-scale evaluation of computational protein function prediction. Nat. Methods 10, 221–227. doi: 10.1038/nmeth.2340
Rhee, S. Y., and Mutwil, M. (2014). Towards revealing the functions of all genes in plants. Trends Plant Sci. 19, 212–221. doi: 10.1016/j.tplants.2013.10.006
Roberts, A. W., Roberts, E. M., and Haigler, C. H. (2012). Moss cell walls: structure and biosynthesis. Front. Plant Sci. 3:166. doi: 10.3389/fpls.2012.00166
Ruiz-Trillo, I., Burger, G., Holland, P. W., King, N., Lang, B. F., Roger, A. J., et al. (2007). The origins of multicellularity: a multi-taxon genome initiative. Trends Genet. 23, 113–118. doi: 10.1016/j.tig.2007.01.005
Ruprecht, C., Mutwil, M., Saxe, F., Eder, M., Nikoloski, Z., and Persson, S. (2011). Large-scale co-expression approach to dissect secondary cell wall formation across plant species. Front. Plant Sci. 2:23. doi: 10.3389/fpls.2011.00023
Ryngajllo, M., Childs, L., Lohse, M., Giorgi, F. M., Lude, A., Selbig, J., et al. (2011). SLocX: predicting subcellular localization of Arabidopsis proteins leveraging gene expression data. Front. Plant Sci. 2:43. doi: 10.3389/fpls.2011.00043
Sanchez-Rodriguez, C., Bauer, S., Hematy, K., Saxe, F., Ibanez, A. B., Vodermaier, V., et al. (2012). Chitinase-like1/pom-pom1 and its homolog CTL2 are glucan-interacting proteins important for cellulose biosynthesis in Arabidopsis. Plant Cell 24, 589–607. doi: 10.1105/tpc.111.094672
Sato, Y., Demura, T., Yamawaki, K., Inoue, Y., Sato, S., Sugiyama, M., et al. (2006). Isolation and characterization of a novel peroxidase gene ZPO-C whose expression and function are closely associated with lignification during tracheary element differentiation. Plant Cell Physiol. 47, 493–503. doi: 10.1093/pcp/pcj016
Scheller, H. V., and Ulvskov, P. (2010). Hemicelluloses. Annu. Rev. Plant Biol. 61, 263–289. doi: 10.1146/annurev-arplant-042809-112315
Sedbrook, J. C., Ehrhardt, D. W., Fisher, S. E., Scheible, W. R., and Somerville, C. R. (2004). The Arabidopsis sku6/spiral1 gene encodes a plus end-localized microtubule-interacting protein involved in directional cell expansion. Plant Cell 16, 1506–1520. doi: 10.1105/tpc.020644
Sharan, R., Ulitsky, I., and Shamir, R. (2007). Network-based prediction of protein function. Mol. Syst. Biol. 3, 88. doi: 10.1038/msb4100129
Somerville, C. (2006). Cellulose synthesis in higher plants. Annu. Rev. Cell Dev. Biol. 22, 53–78. doi: 10.1146/annurev.cellbio.22.022206.160206
Stuart, J. M., Segal, E., Koller, D., and Kim, S. K. (2003). A gene-coexpression network for global discovery of conserved genetic modules. Science 302, 249–255. doi: 10.1126/science.1087447
Szyjanowicz, P. M., McKinnon, I., Taylor, N. G., Gardiner, J., Jarvis, M. C., and Turner, S. R. (2004). The irregular xylem 2 mutant is an allele of korrigan that affects the secondary cell wall of Arabidopsis thaliana. Plant J. 37, 730–740. doi: 10.1111/j.1365-313X.2003.02000.x
Thimm, O., Blasing, O., Gibon, Y., Nagel, A., Meyer, S., Kruger, P., et al. (2004). MAPMAN: a user-driven tool to display genomics data sets onto diagrams of metabolic pathways and other biological processes. Plant J. 37, 914–939. doi: 10.1111/j.1365-313X.2004.02016.x
Turner, S. R., and Somerville, C. R. (1997). Collapsed xylem phenotype of Arabidopsis identifies mutants deficient in cellulose deposition in the secondary cell wall. Plant Cell 9, 689–701. doi: 10.1105/tpc.9.5.689
Ueda, M., and Laux, T. (2012). The origin of the plant body axis. Curr. Opin. Plant Biol. 15, 578–584. doi: 10.1016/j.pbi.2012.08.001
Usadel, B., Obayashi, T., Mutwil, M., Giorgi, F. M., Bassel, G. W., Tanimoto, M., et al. (2009). Co-expression tools for plant biology: opportunities for hypothesis generation and caveats. Plant Cell Environ. 32, 1633–1651. doi: 10.1111/j.1365-3040.2009.02040.x
Van Bel, M., Proost, S., Wischnitzki, E., Movahedi, S., Scheerlinck, C., Van De Peer, Y., et al. (2012). Dissecting plant genomes with the PLAZA comparative genomics platform. Plant Physiol. 158, 590–600. doi: 10.1104/pp.111.189514
Voigt, J., and Frank, R. (2003). 14-3-3 proteins are constituents of the insoluble glycoprotein framework of the chlamydomonas cell wall. Plant Cell 15, 1399–1413. doi: 10.1105/tpc.010611
Yin, Y., Huang, J., and Xu, Y. (2009). The cellulose synthase superfamily in fully sequenced plants and algae. BMC Plant Biol. 9:99. doi: 10.1186/1471-2229-9-99
Zhong, R., Lee, C., Zhou, J., McCarthy, R. L., and Ye, Z. H. (2008). A battery of transcription factors involved in the regulation of secondary cell wall biosynthesis in Arabidopsis. Plant Cell 20, 2763–2782. doi: 10.1105/tpc.108.061325
Keywords: comparative transcriptomics, gene function, evolution of function
Citation: Hansen BO, Vaid N, Musialak-Lange M, Janowski M and Mutwil M (2014) Elucidating gene function and function evolution through comparison of co-expression networks of plants. Front. Plant Sci. 5:394. doi: 10.3389/fpls.2014.00394
Received: 01 April 2014; Accepted: 23 July 2014;
Published online: 19 August 2014.
Edited by:
Andreas P. M. Weber, Heinrich-Heine-Universität, GermanyReviewed by:
Jianlin Cheng, University of Missouri, Columbia, USACopyright © 2014 Hansen, Vaid, Musialak-Lange, Janowski and Mutwil. This is an open-access article distributed under the terms of the Creative Commons Attribution License (CC BY). The use, distribution or reproduction in other forums is permitted, provided the original author(s) or licensor are credited and that the original publication in this journal is cited, in accordance with accepted academic practice. No use, distribution or reproduction is permitted which does not comply with these terms.
*Correspondence:bXV0d2lsQG1waW1wLWdvbG0ubXBnLmRl
Disclaimer: All claims expressed in this article are solely those of the authors and do not necessarily represent those of their affiliated organizations, or those of the publisher, the editors and the reviewers. Any product that may be evaluated in this article or claim that may be made by its manufacturer is not guaranteed or endorsed by the publisher.
Research integrity at Frontiers
Learn more about the work of our research integrity team to safeguard the quality of each article we publish.