- Department of Biochemistry, Virginia Tech, Blacksburg, VA, USA
myo-Inositol is a precursor for cell wall components, is used as a backbone of myo-inositol trisphosphate (Ins(1,4,5)P3) and phosphatidylinositol phosphate signaling molecules, and is debated about whether it is also a precursor in an alternate ascorbic acid synthesis pathway. Plants control inositol homeostasis by regulation of key enzymes involved in myo-inositol synthesis and catabolism. Recent transcriptional profiling data indicate up-regulation of the myo-inositol oxygenase (MIOX) genes under conditions in which energy or nutrients are limited. To test whether the MIOX genes are required for responses to low energy, we first examined MIOX2 and MIOX4 gene expression regulation by energy/nutrient conditions. We found that both MIOX2 and MIOX4 expression are suppressed by exogenous glucose addition in the shoot, but not in the root. Both genes were abundantly expressed during low energy/nutrient conditions. Loss-of-function mutants in MIOX genes contain alterations in myo-inositol levels and growth changes in the root. Miox2 mutants can be complemented with a MIOX2:green fluorescent protein fusion. Further we show here that MIOX2 is a cytoplasmic protein, while MIOX4 is present mostly in the cytoplasm, but also occasionally in the nucleus. Together, these data suggest that MIOX catabolism in the shoot may influence root growth responses during low energy/nutrient conditions.
Introduction
myo-Inositol (inositol) is a cyclic polyol that is synthesized by both eukaryotes and prokaryotes (Michell, 2007, 2008), and is used in signaling transduction pathways, hormone regulation, stress tolerance, phosphorus storage, and for metabolic purposes (Loewus and Loewus, 1983; Loewus and Murthy, 2000; Gillaspy et al., 2004; Gillaspy, 2011). Inositol levels are maintained in the plant cell through a combination of regulatory controls on inositol synthesis and oxidation. The rate-limiting step in inositol synthesis is catalyzed by the inositol phosphate synthase (MIPS) enzyme (Donahue et al., 2010), while oxidation of inositol is catalyzed by the inositol oxygenases (MIOXs; EC 1.13.99.1; Koller and Hoffmann-Ostenhof, 1979; Reddy et al., 1981; Arner et al., 2001). Intriguing data shows a correlation between the transcription of one MIPS gene family member, AtMIPS1 (At4g43980) and rosette biomass, underscoring the importance of inositol and its metabolites in plant growth (Sulpice et al., 2009).
Besides synthesis, another potential regulatory point of inositol homeostasis is the oxidation of inositol to D-glucuronic acid (DGlcA), which is catalyzed by the MIOX enzyme. MIOX action involves the incorporation of a single oxygen atom from molecular oxygen, which breaks open the inositol ring structure (Moskala et al., 1981). MIOX is encoded by a well-conserved, four member gene family in Arabidopsis (At1g14520, At2g19800, At4g26260, and At5g56640; Lorence et al., 2004; Kanter et al., 2005; Endres and Tenhaken, 2009). The four MIOX genes are differentially regulated during development with MIOX2 (At2g19800) being the predominantly expressed gene, while MIOX4 (At4g26260) and MIOX5 (At5g56640) are expressed mostly during reproductive stages (Kanter et al., 2005). Disruption of MIOX genes can diminish the amount of inositol incorporated into the cell wall fraction, thus these genes have been shown to actively impact the production of cell wall compounds (Kanter et al., 2005; Endres and Tenhaken, 2009, 2011).
Expression of the MIOX2 gene from Arabidopsis has previously been correlated with energy sensing and/or sugar status (Baena-Gonzalez et al., 2007). It was shown that overexpression of the Sucrose Non-fermenting 1-related kinase (SnRK1.1) energy/low nutrient sensor upregulates expression of a suite of genes, including MIOX2, that may allow for growth adaptation to low energy conditions (Baena-Gonzalez et al., 2007). SnRK1.1 mutants and overexpressors are altered in growth under low energy/nutrient conditions and also have alterations in lifespan, suggesting that SnRK1.1 controls plant responses to low energy/nutrients and/or stress (Baena-Gonzalez et al., 2007). In a separate study, thorough transcriptional profiling and metabolite analyses of Arabidopsis exposed to extended dark conditions revealed that both MIOX2 and MIOX4 expression were induced by extended darkness, and this induction was followed by a decrease in inositol levels (Gibon et al., 2006). Thus energy status appears to regulate MIOX expression, and specific MIOX isoforms may function in controlling inositol levels in plants. These data indicate that control of MIOX expression and oxidation of inositol may be an important adaptation to low energy/nutrient status and stress in plants.
To test this hypothesis, we examined the spatial patterns of MIOX2 and MIOX4 gene expression in different nutrient conditions, finding that glucose regulates MIOX2 and MIOX4 differently in the shoot versus the root. We also tested whether miox mutant plants were altered in inositol levels and nutrient growth responses. We report here that MIOX2 and MIOX4 gene expression is negatively regulated by exogenous glucose application in the shoot, but not the root. In addition, both miox2 and miox4 mutants contain growth alterations, time to flowering differences, and metabolite alterations consistent with a role for these genes in energy/nutrient sensing.
Materials and Methods
Plant Growth and Germination Experiments
Arabidopsis thaliana ecotype Columbia plants were used for all experiments. For seed germination experiments, age-matched wildtype (WT) and mutant seeds were harvested on the same day from plants grown in parallel on the same shelf of a growth rack and were stored at 23°C in the dark for at least 30 days before germination. For root growth experiments, seeds were surface-sterilized and plated on 0.8% agar medium, 0.5× Murishige and Skoog (MS) salts + 0.8% agar medium and 0.5× MS + 0.8% agar medium + 3% glucose. Each agar plate was divided into sections, and >10 seeds of WT or mutant type were plated per section. Plates were wrapped in foil and placed at 4°C for 3 days before moving to room temperature. Root length was recorded every 2 days and experiments were performed in triplicate or more. For gas chromatography (GC) analysis of seedlings, seeds were grown on pre-wetted sterile filter paper for 5 days under continuous light. For flowering time and GC analyses of older tissues, seeds were grown on soil under l6 h of light/day at 22°C/24°C and watered every other day with measured amounts. Regular-light conditions of 100–200 μE for 16 h days and low-light conditions of 40 μE for 16 h days were provided by a mixture of fluorescent and incandescent lamps or fluorescent lamps only.
Promoter Analysis
General conditions have been described (Styer et al., 2004). WT, MIOX2p:GUS, and MIOX4p:GUS seeds were surface-sterilized, grown on soil or on no nutrients (agar), low nutrients (agar + 0.5× MS salts), and optimal nutrients (agar + 0.5× MS salts + 3% glucose). Seedlings were removed at 5–7 days from the plates and GUS stained. Stained samples were photographed with an Olympus SZX16 stereoscope and attached Olympus DP71 camera with DP Controller software (Olympus Corp., Japan).
Mutant Isolation
Potential MIOX2 (At2g19800) and MIOX4 (At4g26260) mutants were identified from the Salk T-DNA lines (Alonso et al., 2003) through the analysis of the SiGnAL database (http://www.signal.salk.edu/cgi-bin/tbnaexpress). Seeds for miox2-1 (Salk_002569), miox2-2 (Salk_040608), and miox4-1 (Salk_018395) mutants were obtained from the Ohio State University Arabidopsis Biological Resource Center. To map the T-DNA insertion sites, genomic DNA was isolated from leaves of the mutant lines using a DNeasy kit (QIAGEN, Inc., Valencia, CA, USA) according to the manufacturer’s instructions. DNA from segregating plants was screened with PCR using the SALK LB primers and the MIOX gene-specific primers. To analyze the miox2-1 line, annealing at 59°C was performed with the LB primer and the following forward and reverse primers: 2-1for, 5′-AACCATGATATCAACAACCC-3′ and 2-1rev, 5′-TGCTGGCCAAAAAGTATGGC-3′. To analyze the miox2-2 line, annealing at 60°C was performed with the LB primer and the following forward and reverse primers: 2-2for, 5′-ATTATGAGAATGGTGAAAGC-3′ and 2-2rev, 5′-GGCTCCTGCCTTGTGCAATG-3′. To analyze the miox4-1 line, annealing at 55°C was performed with the LB primer and the following forward and reverse primers: 4-1for, 5′-ATGACGATCTCTGTTGAGAAGC-3′ and 4-1rev, 5′-TCACCACCTCAAGTTTTCCGGG-3′. The resulting PCR fragments were sequenced and compared to the genomic sequence for each gene to map the T-DNA insertion.
RT-PCR
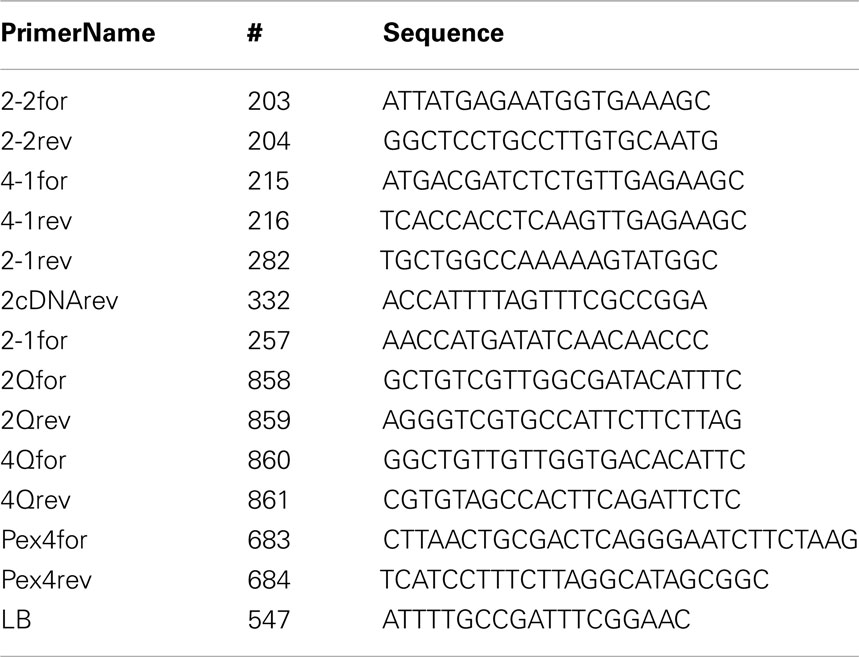
Total RNA was extracted from 6-week-old leaves and open flowers from WT and mutant plants using an RNeasy kit (QIAGEN, Inc., Valencia, CA, USA) and quantified using a NanoDrop ND-1000 Spectrophotometer (Thermo Scientific NanoDrop Technologies, LLC, Wilmington, DE, USA). cDNA was synthesized using an iScript cDNA Synthesis Kit (Bio-Rad Laboratories, Hercules, CA, USA). For MIOX2 semi-quantitative PCR, the 2-2for primer and 2cDNArev primers were used in 30 cycles of PCR amplification (1 min 95°C, 1 min 54°C, 1.5 min 72°C) resulting in a 780 bp product. For MIOX4 semi-quantitative PCR, the 4-1for primer and 4-1rev primer were used in 30 cycles of PCR amplification (1 min 95°C, 1 min 56°C, 2 min 72°C) resulting in a 954 bp product. Actin amplification has been described and generated a 425-bp product (Berdy et al., 2001). For quantitative PCR RNA was purified from 10-day-old seedlings grown on low nutrients conditions and cDNA was synthesized from equal amounts of RNA. Samples were loaded into 96-well plates containing Sybr Green PCR MasterMix (Applied Biosystems) and primers for MIOX2, MIOX4, or PEX4 housekeeping genes (as described in Donahue et al., 2010; Endres and Tenhaken, 2011). For each primer set one primer was constructed to span an intron, limiting amplification from genomic DNA. Reactions in triplicate were monitored with an Applied Biosystems 7300 Real-Time PCR instrumentation outfitted with SDS software version 1.3.1. Relative expression of MIOX2 and MIOX4 were normalized to that of PEX4. Primer sequences can be found in the Table A1 in Appendix.
Flowering Time Assays
Wildtype and mutant plants were grown as described previously under long-day (16 h) or short-day (8 h) conditions. Careful attention was given to growing plants side-by-side or in the same pot for comparison. Plants were examined at the point of inflorescence emergence. Plants were removed from soil, inverted, and rosette leaves were removed in developmental order to facilitate counting. Fifteen or more plants per variant were examined.
GC and GC/mass Spectrometry Analyses
Gas chromatography was used to quantify inositol and DGlcA levels. For sample preparation, frozen seedlings and tissues were ground into a powder, and 1 ml of 60% methanol was mixed with the powder. D-chiro-inositol (2 μg) was added to the mixture as an internal standard. The mixture was incubated at 70°C for approximately 1.5 h. The insoluble portion was removed by centrifugation at 13200 rpm for 10 min. The supernatant was dried and reconstituted in 200 ml of water, filtered through a 0.2-μM Tuffryn® syringe filter (Pall Gelman Laboratory, Ann Arbor, MI, USA), and dried again. The dried sample was reduced by mixing with 100 μl of 10 mM dithiothreitol for 10 min and dried again. Two hundred fifty microliters of freshly prepared derivatization reagent (1:1 mixture of pyridine and bis (trimethyl-silyl) trifluoro-acetamide + 1% trimethylchlorosilane; Alltech, State College, PA, USA) was added, and the sample was sonicated and heated at 80°C for at least 45 min until the entire sample was in solution. The sample was transferred to an autosample vial, and 250 μl of hexanes were added. Samples were injected with a split of 10 ml/min and separated by a Clarus 500 GC (Perkin Elmer Instruments, Shelton, CT, USA) on a Rtx®-5 fused capillary column 30 m × 0.32 mm i.d. (Restek, Bellefonte, PA, USA) with helium as the carrier gas and pressure-controlled flow set at 6.5 psi with a linear velocity of 1 ml/min. The injection port was set at 225°C, the oven was set on a gradient from 75 to 274°C at 6.5°C/min, and the flame ionization detector was set at 280°C. For compound identification, retention times of peaks were compared to those of known metabolite standards. Standard curves displaying peak area versus microgram per milliliter were generated for inositol and DGlcA and peak area was quantified by Totalchrom software (Perkin Elmer, Shelton, CT, USA), adjusted based on recovery of the known internal standard, and converted to microgram per milliliter based on the standard curves. Values were converted to microgram per gram fresh weight based on the original sample weight. At least three to five independent replicates were averaged together to determine the presented means.
We confirmed the identity of inositol and DGlcA peaks using a GC/mass spectrometry (MS) system (6890/5975; Agilent Technologies, Santa Clara, CA, USA) operating in selected ion monitoring mode (50–550). Plant samples and standards were separated by a 6890-N GC on an HP-5MS capillary column 30 m × 0.25 mm i.d. (Agilent Technologies, Inc., Santa Clara, CA, USA) with helium as the carrier gas with pressure-controlled flow set at 9.1 psi. The injection port was set at 250°C, the oven was set on a gradient from 75 to 274°C at 6.5°C/min, and compounds were submitted to electrospray ionization and detected by a 5975 MS (Aglient Technologies, Inc., Santa Clara, CA, USA). The mass spectrum for each peak of interest was compared with a library, from Agilent Data Analysis software, of known spectral data for compound identification (Aglient Technologies, Inc., Santa Clara, CA, USA). SIM mode detected inositol target ions at a mass:charge ratio of 217, 305, and 432, and DGlcA ions at 204, 217, and 305, respectively.
Western Blotting
Conditions have been previously reported (Burnette et al., 2003). Briefly, tissues were ground in liquid nitrogen, homogenized and resuspended with a pestle in SDS-bromophenol blue loading dye, boiled, and the supernatant was loaded onto a polyacrylamide gel for separation. SDS-PAGE was followed by Western blotting with a 1:20000 dilution of rabbit anti-MIOX4 antibody (provided by the Nessler lab from Cocalico Biologicals, Inc., Reamstown, PA, USA) or blotting with a 1:1000 dilution of rabbit anti- green fluorescent protein (GFP) antibody (Invitrogen Molecular Probes, Eugene, OR, USA). A secondary goat, anti-rabbit horse radish peroxidase antibody (Bio-Rad Laboratories, Hercules, CA, USA) was used at a 1:2000 dilution. Immunoreactive bands were detected using an ECL Plus Western Blotting Detection System (Amersham, Buckinghamshire, UK) and imaged with a Bio-Rad Gel-Doc system with Quantity One Software (Bio-Rad). Ponceau S staining of blots prior to antibody incubation was performed to ensure that equal amounts of extracts were analyzed.
GFP Fusion Construction and GFP Imaging
The 2255-bp genomic region of MIOX2, minus the stop codon, and the 948-bp coding region of MIOX4, minus the last two codons, were amplified by high-fidelity PCR using Phusion polymerase (New England BioLabs, Ipswich, MA, USA), confirmed by sequencing, cloned into the pENTR/D-TOPO vector (Invitrogen), and recombined via the Gateway system (Invitrogen) using the manufacturer’s instructions into pK7FWG2. The resulting 35S cauliflower mosaic virus (35SCaMV) promoter:MIOX2:GFP and 35S CaMV promoter:MIOX4:GFP constructs were transformed into Agrobacterium tumefaciens by cold shock and were used in the transformation of miox2-2 and WT plants as described (Bechtold et al., 1993). MIOX2:GFP, MIOX2:GFP/miox2-2, and MIOX4:GFP seedlings were identified on 50 μg/mL kanamycin plates and by screening for GFP production using an Olympus SZX16 stereoscope equipped with fluorescence optics with an attached Olympus DP71 camera with DP Controller software (Olympus Corp., Japan). Two independent, complemented lines (MIOX2:GFP/miox2-2 C14 and MIOX2:GFP/miox2-2 F2), two independent WT background lines (MIOX2:GFP M4 and MIOX2:GFP C9), and one WT background line (MIOX4:GFP) with detectable GFP expression were used for subcellular localization. Imaging experiments and DAPI staining (Ananieva et al., 2008) and plasmolysis experiments (Ercetin et al., 2008) have been described previously.
Results
MIOX2 and MIOX4 Expression is Regulated by Nutrients
To examine the spatial and temporal expression of MIOX2 and MIOX4 within tissues, we examined previously characterized MIOX2p:GUS and MIOX4p:GUS lines (Kanter et al., 2005). We focused on the MIOX2 and MIOX4 genes as published work has indicated a role for these genes in seedlings (Gibon et al., 2006; Baena-Gonzalez et al., 2007), while MIOX1 is not abundantly expressed at any stage and MIOX5 is restricted to flowers (Kanter et al., 2005). Multiple lines of MIOX2p:GUS and MIOX4p:GUS seedlings were grown on no nutrients (agar), low nutrients (agar + 0.5× MS salts), and optimal nutrients (agar + 0.5× MS salts + 3% glucose) in low-light (40 μE) for 7 days. We found that MIOX2 is abundantly expressed under the no nutrient conditions with intense staining found in the cotyledons, hypocotyl, and root (Figure 1). In contrast, with no nutrients present, there is no obvious staining in the MIOX4p:GUS seedlings (Figure 1). Under the low nutrient condition, the intensity of MIOX2p:GUS staining decreases, with moderate expression present in the cotyledons and root (Figure 1). MIOX4 expression is also present in cotyledons and roots in the low nutrient condition, although, overall there is less MIOX4 expression as compared to MIOX2 expression in low nutrients (Figure 1). As expected from previous microarray profiling (Gibon et al., 2006), both MIOX2 and MIOX4 expression are greatly reduced when seedlings are grown with exogenous 3% glucose (Figure 1). Our use of the GUS reporter, however, reveals that repression of MIOX2 and MIOX4 expression by sugar is restricted to shoot tissues, with portions of the roots still expressing both genes (Figure 1). Specifically, in glucose-treated seedlings large areas of both lateral and the primary roots, including the root tip (Figure 1) retain expression of MIOX2. In contrast, MIOX4 becomes restricted to the primary root tip in glucose-treated seedlings (Figure 1). We conclude that glucose represses MIOX2 and MIOX4 expression in shoot tissues of seedlings, while areas of root tissues maintain MIOX expression. These results are intriguing given that it has been speculated by others that myo-inositol translocation from the shoot to the root via the phloem provides information on the shoot photosynthetic status to the root (Nelson et al., 1998).
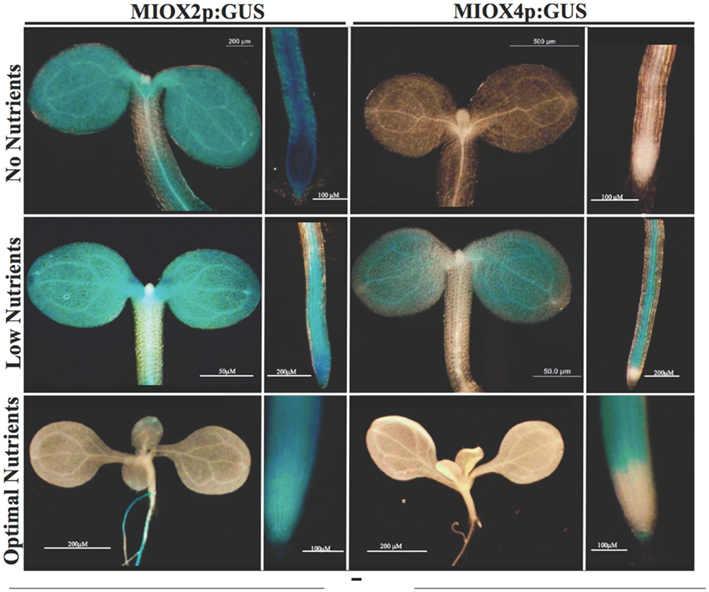
Figure 1. MIOX2 and MIOX4 expression varies with nutrient conditions. WT, MIOX2p:GUS, and MIOX4p:GUS 5- to 7-day seedlings were grown on no nutrient (upper), low nutrient (lower), or optimal nutrient conditions and GUS activity was examined. Pictures are representative of staining patterns observed in 5–10 seedlings for each condition. WT samples showed no staining.
Identification of miox2 and miox4 Mutant Lines
To test whether MIOX2 and MIOX4 impact sugar sensing, we isolated T-DNA insertion mutants for these genes from the Salk collection (Alonso et al., 2003) obtained from the Arabidopsis Biological Resource Center. The T-DNA insertions in miox2-2 (SALK_040608) and miox4-1 (SALK_01839) were confirmed by PCR using a T-DNA left border (LB) primer and gene-specific primers (2-2for and 2-1rev for MIOX2 and 4-1for and 4-1rev for MIOX4). This resulted resulting in the amplification of an 873 bp fragment in miox2-2 mutants (Figure 2A). Sequencing of the amplified fragment showed that the T-DNA insertion is at the border of the fifth intron and sixth exon (Figure 2A). The T-DNA insertion in miox4-1 was confirmed by PCR using a T-DNA LB primer and MIOX4 gene-specific primers (4-1for and 4-1rev), resulting in the amplification of a 635-bp fragment in miox4-1 mutants (Figure 2B). Sequencing of the amplified fragment showed that the T-DNA insertion was in the third intron for miox4-1 (Figure 2B).
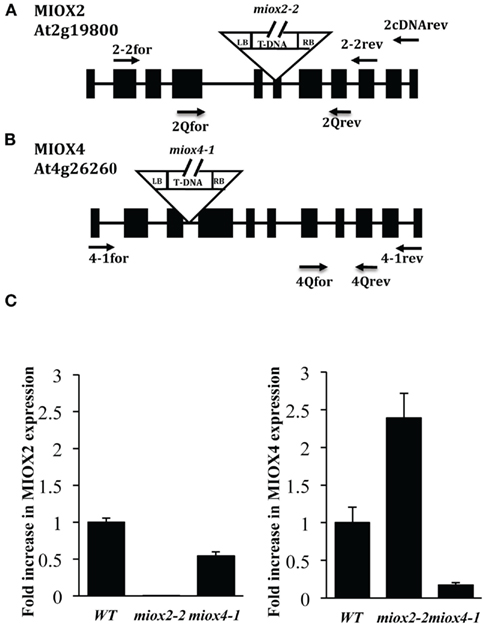
Figure 2. Characterization of MIOX2 and MIOX4 T-DNA Insertion Mutants. (A). MIOX2 (A) and MIOX4 (B) gene maps showing locations of T-DNA insertions. Black boxes represent exons, black lines represent introns. LB: T-DNA left border, RB: T-DNA right border. Arrows indicate primers. (C) Relative transcript levels of MIOX2 (left) and MIOX4 (right) in WT, miox2-2 and miox4-1 mutant seedlings as determined by quantitative PCR. Primer sequences can be found in the Table A1 in Appendix.
To examine whether expression of MIOX2 and MIOX4 is altered in miox2 and miox4 homozygous mutant lines, we examined RNA levels using quantitative PCR. We used RNA isolated from seedlings grown under low nutrient conditions, and MIOX2 and MIOX4 gene-specific primers to determine relative levels of expression of MIOX2 and MIOX4 (Figure 2C). Under these conditions, MIOX2 expression is ∼3000-fold higher than MIOX4 in WT seedlings. We found almost no detectable expression of MIOX2 in miox2-2 mutants. In addition, miox2-2 mutants had elevated MIOX4 gene expression (2.4-fold), indicating the possibility that miox2-2 mutants up-regulate MIOX4 expression to compensate for loss of MIOX2 expression. In contrast, miox4-1 mutants have a large (>5-fold) reduction in MIOX4 gene expression, and a smaller reduction in MIOX2 expression (Figure 2C). We also used semi-quantitative PCR to examine expression of both genes in leaves and flowers of miox2-2 and miox4-1 mutants (data not shown). Using this approach, we found no detectable MIOX2 expression in miox2-2 leaves, and reduced amounts of MIOX4 in miox4-1 flowers, as compared to WT. A second miox2 allele named miox2-1 (SALK_002569), containing a 3′UTR T-DNA insertion, was also examined in our studies. As this mutant line had no reduction in MIOX2 expression in seedlings, we do not include data for this mutant here. From these analyses, we conclude that the miox2-2 and miox4-1 mutants are suitable for examining the consequences of eliminating or reducing MIOX2 or MIOX4 expression, respectively.
miox Mutants are Altered in Nutrient Responses
To determine whether MIOX2 or MIOX4 are required for growth under various nutrient conditions, we measured root lengths of WT, miox2-2, and miox4-1 seedlings grown with no, low and optimal nutrients over a period of 8–9 days (Figure 3). We also included a miox2-2 mutant expressing a 35S CaMV promoter:MIOX2:GFP transgene as a control for complementation (MIOX2/miox2-2). MIOX2/miox2-2 plants accumulated MIOX2:GFP protein as measured by western blotting with an anti-GFP antibody (Figure 4).
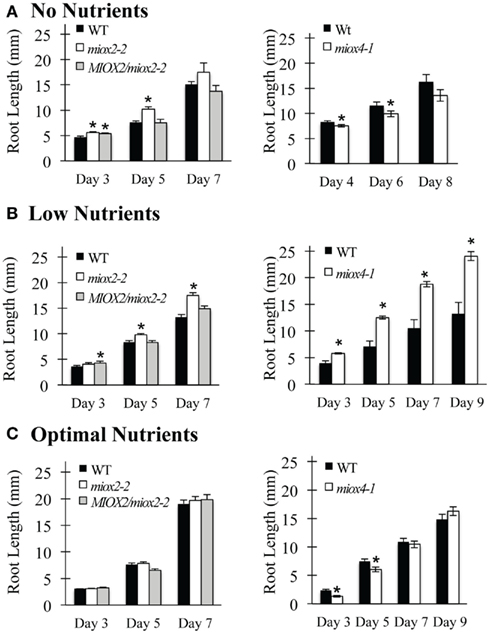
Figure 3. Root growth in different nutrient conditions. WT and mutant seeds were surface-sterilized, placed on agar with different nutrients, stratified for 3 days at 4°C, then placed at room temperature under long-day conditions. Root length was measured every other day. (A) No nutrients. (B) Low nutrients. (C) Optimal nutrients. Bars represent the mean ± SE where n = 3–5, with each replicate containing 10–15 seedlings. *Indicates p-value ≤0.05 as compared to WT.
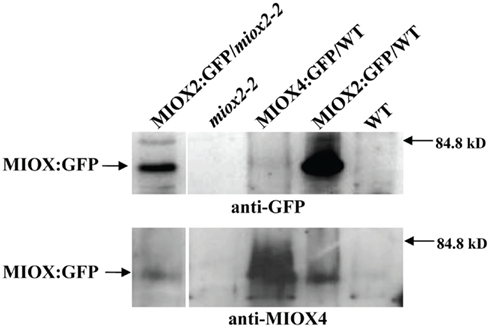
Figure 4. Expression of MIOX4: and MIOX2:GFP in transgenic seedlings. Denatured protein extracts from seedlings were separated by SDS-PAGE, transferred to nitrocellulose, and blotted with either an anti-GFP or anti-MIOX4 antibody.
Recall that MIOX2 expression is highest in shoots and roots of seedlings grown with no nutrients (Figure 1). Under these no nutrient conditions, a trend for increased miox2-2 mutant root growth as compared to WT over 3–7 days is apparent (Figure 3A, left). The increase in root growth of miox2-2 mutants is statistically significant at day 3 and at day 5 (Figure 3A, left). MIOX2/miox2-2 root growth is similar to miox2-2 root growth on day 3, but does not differ from WT on day 5 and day 7 (Figure 3A, left). This suggests that the MIOX2:GFP construct complements the miox2-2 mutant under these conditions. When grown under the low nutrients condition for 5–7 days, miox2-2 roots grow longer than WT roots, while MIOX2/miox2-2 root growth appears to be more like WT root growth (Figure 3B, left). In contrast, when miox2-2 mutants are grown on optimal nutrients, a condition in which MIOX2 expression becomes restricted to roots alone (Figure 1), there are no differences in root growth between miox2-2 mutants, WT, and MIOX2/miox2-2 (Figure 3C, left). These data suggest that MIOX2 expression is required for proper control of root growth in varying nutrient conditions. Further, these data suggest that under no or low nutrients, MIOX2 expression in the shoot is required to limit root growth.
The data from miox4 mutants also reveal a role for MIOX4 in regulating root growth (Figure 3). We observed a trend for decreased root growth in miox4-1 mutants as compared to WT roots grown with no nutrients (Figure 3A, right). The decrease in root growth in miox4-1 mutants was statistically significant at day 4 and day 6. In contrast, when grown on low nutrients, miox4 root growth was increased as compared to WT roots at all measured time points (Figure 3B, right). This shift in growth suppression with no nutrients versus growth stimulation with low nutrients correlates with the absence or presence of MIOX4 expression in WT seedlings grown in these conditions (Figure 1). Under optimal nutrient conditions, miox4-1 mutants have reduced root growth as compared to WT roots at day 3 and day 5, but no changes in root growth at later time points (Figure 3C, right). We conclude that the MIOX4 gene is also required for proper control of root growth in varying nutrient conditions, and that MIOX4 may play a similar role as MIOX2 in limiting root growth under low nutrient conditions. Further, the growth limiting role of MIOX2 and MIOX4 in low nutrient conditions is correlated with MIOX expression in the shoot, suggesting that shoot MIOX oxidation of myo-inositol may provide a signal for root growth regulation.
miox Mutants are Altered in Flowering Time
Alterations in nutrient status are known to impact time to flowering. While under standard laboratory conditions we noted no differences in miox2 and miox4 mutant growth and development, we did find alterations in time to flowering (Figure 5). Examination of MIOX2 and MIOX4 expression in rosette leaves prior to inflorescence emergence indicated that both MIOX2 and MIOX4 are expressed in soil-grown plants at this stage. In particular, MIOX2 is expressed in younger leaves, hydathodes, and stipules (Figure 5A), while MIOX4 is expressed only in leaf stipules (Figure 5C). Overall, the amount of MIOX2 and MIOX4 expression at this stage is much less than at the seedling stage, and neither MIOX2 nor MIOX4 was abundant in fully expanded rosette leaves (Figures 5B,D). Remarkably, the small amount of MIOX2 and MIOX4 expression in shoot apices at this stage impacts time to flowering in opposite ways. Under long-day conditions, miox2-2 mutants flower late (Figure 5E) with an average of 1.5 more leaves required to initiate flowering (Figure 5G). In contrast, miox4-1 mutants flower early (Figure 5F) with an average of 1.5 to 2 less leaves upon flowering (Figure 5G). We conclude that both MIOX2 and MIOX4 genes are required to maintain time to flowering, and the genes have opposing roles that correspond to different patterns of expression at this stage.
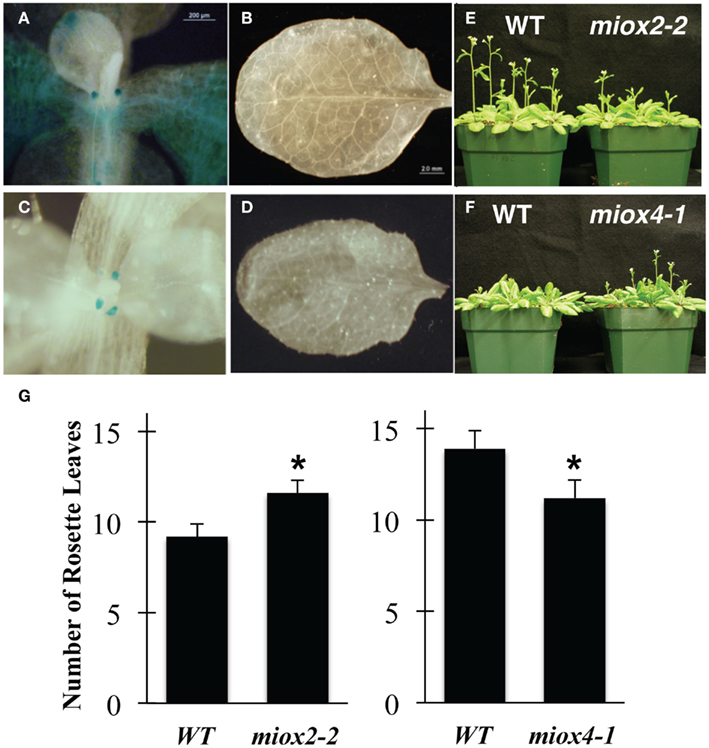
Figure 5. Comparison of miox mutants in flowering time. WT, MIOX2p:GUS (A,B), and MIOX4p:GUS (C,D) tissues were examined for GUS activity. Pictures are representative of staining patterns observed in 5–10 samples. WT samples showed no staining (not shown). (E,F) WT, miox2-2, and miox4-1 mutant seeds were sown on pre-wetted soil, stratified at 4°C for 3 days, and then placed in a growth chamber under long-day conditions. (G) The number of rosette leaves prior to flowering were counted. Values represent the mean ± SE where n = 15–38 plants. *Indicates p-value ≤0.05 as compared to WT.
Both MIOX2 and MIOX4 are also expressed in developing and mature flowers (data not shown). Both genes are expressed in male and female organs, however, MIOX4 is expressed in all whorls (sepals, petals, stamens, and carpels), while MIOX2 is only detectable in the inner two whorls.
miox Mutants have Altered Inositol Levels
To determine how inositol metabolism is affected in the miox2 and miox4 mutants, we quantified the MIOX substrate, inositol, and its product, DGlcA, in various tissues from miox2-2, MIOX2/miox2-2 and miox4-1 plants. As controls for this work we included transgenic plants expressing a WT copy of MIOX2 or MIOX4 fused to the GFP gene driven by the 35S CaMV promoter. Both MIOX2:GFP and MIOX4:GFP plants accumulated MIOX:GFP protein as measured by western blotting with an anti-GFP antibody and an anti-MIOX4 antibody (Figure 4). Reactivity with the anti-MIOX4 antibody made against a recombinant Arabidopsis MIOX4 protein was stronger for MIOX4 than MIOX2 (Figure 4).
To measure inositol and DGlcA, we grew WT, miox2-2, MIOX2/miox2-2, MIOX2:GFP, miox4-1, and MIOX4:GFP plants in soil and harvested leaves, flowers, and siliques. In addition, we grew seedlings from these lines on low nutrients and harvested tissues from these samples. Tissues were prepared for GC analyses using both conventional GC and GC–mass spectrometry (GC–MS). Standard curves for each metabolite were generated using commercially available standards. Peaks within chromatograms were identified by comparison to the retention times of standards and by parallel GC–MS analysis. Peak areas were quantified from chromatograms and normalized to the amount of sample material and internal standards. We found that miox2-2 mutants contain significantly elevated inositol levels in seedlings, leaves, and flowers (Figure 6). In contrast, MIOX2/miox2-2 and MIOX2:GFP seedlings, leaves, flowers, and siliques all contain significantly reduced inositol levels, suggesting that MIOX2:GFP/miox2-2 plants are metabolically similar to a gain-of-function in MIOX2. Overall, these data are consistent with reduced inositol oxidation in miox2-2 mutant seedlings, leaves and flowers, and increased inositol oxidation in all tissues from MIOX2/miox2-2 and MIOX2:GFP plants.
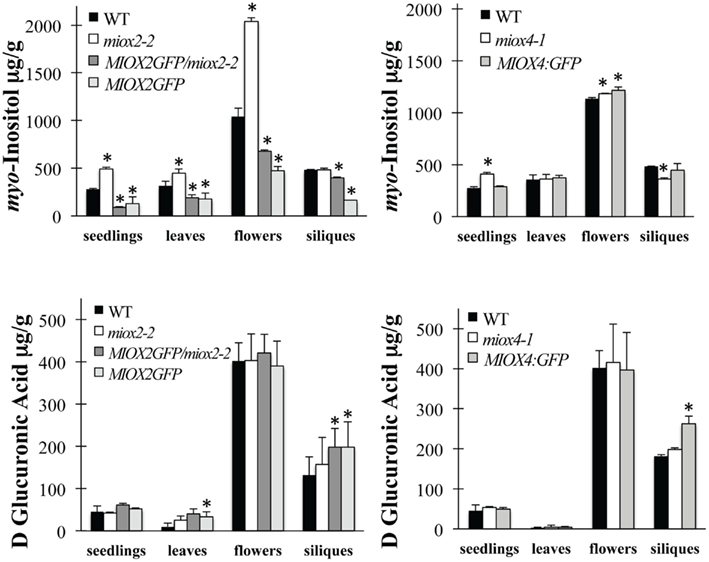
Figure 6. Metabolite Levels in WT, miox Mutant, and MIOX:GFP Tissues. Seedlings were grown under low nutrient conditions, while leaves, flowers, and siliques were harvested from soil-grown plants. Tissues were harvested, ground in liquid nitrogen, extracted, reduced, derivatized, and analyzed by GC. Amounts are given in microgram per gram fresh tissue. Top panels are myo-inositol; bottom panels are DGlcA. Bars represent the mean ± SD where n = 3–5 independent, biological replicates, with each seedling replicate containing hundreds of 5-day-old low nutrient-grown seedlings, each leaf replicate containing three to five 6-week-old leaves, each flower replicate containing 50–100 open flowers, and each silique replicate containing 30–50 green, elongated siliques. *Indicates p-value ≤0.05 as compared to WT.
Despite the changes seen in inositol in most miox2-2 tissues, there are no changes in DGlcA levels in any miox2-2 tissues examined (Figure 6). In addition, MIOX2/miox2-2 and MIOX2:GFP tissues only have alterations in DGlcA levels in siliques where both MIOX2/miox2-2 and MIOX2:GFP plants have statistically significant elevations (Figure 6). We conclude that the growth increase in miox2-2 mutant roots in the low nutrients condition is accompanied by elevated inositol levels, suggesting that MIOX2 oxidation of inositol plays a role in regulating seedling root growth when energy is limited.
The loss of the MIOX4 gene impacts inositol levels less dramatically than does loss of MIOX2 (Figure 6). miox4-1 seedlings and flowers have a small increase in inositol, while miox4-1 siliques have a small decrease in inositol (Figure 6). The only MIOX4:GFP tissue with altered inositol is flowers, with a small elevation in inositol apparent (Figure 6). There are no changes in DGlcA in miox4-1 tissues (Figure 6). MIOX4:GFP siliques contain elevated DGlcA, with other tissues from these plants having no changes in DGlcA (Figure 6).
Subcellular Localization of MIOX2:GFP and MIOX4:GFP Fusion Proteins
To determine the site of inositol oxidation by MIOX2 and MIOX4, we examined the localization of the MIOX2:GFP fusion protein in MIOX2:GFP/miox2-2 seedlings grown in the low nutrients condition (Figure 7). As these plants have decreased inositol levels (Figure 6), this indicates that the MIOX2:GFP fusion protein is catalytically active, thus it is likely that this fusion protein undergoes the same post-translational modifications and subcellular localization as the native MIOX2 protein. We analyzed T2 progeny from two independent MIOX2:GFP/miox2-2 lines with fluorescence deconvolution microscopy, and found a similar pattern of location in both lines. GFP fluorescence was associated with the cytoplasm in all cells within the cotyledon epidermis (Figure 7A), hypocotyls (Figure 7B), seedling roots (Figure 7D). To confirm the cytoplasmic localization, we treated the seedlings with 0.8 M NaCl to plasmolyze the cells, causing the cytoplasm to retract from the cell wall (Figures 7C,D). We conclude that MIOX2:GFP fluorescence is located in the cytoplasm in seedlings.
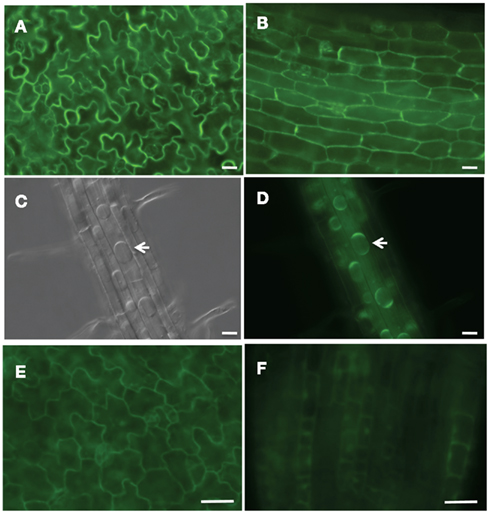
Figure 7. Subcellular localization of GFP-tagged MIOX in Arabidopsis seedlings. GFP-tagged MIOX2 and 4 were expressed in miox2-2 and WT backgrounds, respectively, and imaged with fluorescent deconvolution microscopy. MIOX2:GFP/miox2-2 seedling expression in (A) cotyledon epidermis, (B) hypocotyl, (C,D) plasmolyzed roots treated with 0.8 M NaCl; arrows denote plasmolyed cells. (C) Was taken with DIC optics. MIOX4:GFP expression in (E) cotyledon epidermis and (F) root tips. Bar = 20 μm.
To investigate the subcellular location of MIOX4:GFP fusion protein, we examined the localization of the MIOX4:GFP fusion protein in transgenic seedlings grown in the low nutrients condition (Figure 7). GFP fluorescence was associated with the cytoplasm in cells in the cotyledon epidermis (Figure 7E), and root tips (Figure 7F). To confirm the cytoplasmic localization, we plasmolyzed cells with 0.8 M NaCl and found GFP fluorescence in the cytoplasm (data not shown). In addition to its cytoplasmic location, however, small amounts of MIOX4:GFP was also located in nuclei from some, but not all, root tip cells (Figure 7F). To confirm the nuclear localization of MIOX4:GFP, we stained MIOX4:GFP seedlings with the nuclear dye 4′,6-diamidino-2-phenylindole (DAPI) and imaged GFP and DAPI fluorescence simultaneously (data not shown). In the region examined, approximately 50% of root nuclei exhibiting DAPI fluorescence also had GFP fluorescence indicating that the MIOX4 protein is localized in the cytoplasm and also within some root nuclei in MIOX4:GFP seedlings.
Discussion
Inositol plays a crucial role in plant cells and its oxidation can provide substrates for synthesis of many downstream products (Loewus and Murthy, 2000). Our work on the MIOX enzymes suggests that both MIOX2 and MIOX4 play important roles in regulating inositol levels in plant cells and that loss of inositol catabolism impacts growth responses to low energy/nutrient conditions. Specifically, our data show that MIOX2 and MIOX4 spatial expression patterns are regulated by energy status/nutrients. We have shown that both MIOX2 and MIOX4 genes are expressed at high levels in seedlings grown in low energy/nutrient conditions, and that expression of both genes is suppressed by exogenous glucose (Figure 1). Previously it was shown by others that MIOX 2 and 4 expression is up-regulated in Arabidopsis during extended night conditions (Gibon et al., 2006) and during carbon starvation (Osuna et al., 2007). In addition, overexpression of the SnRK1.1 low energy/stress sensor elevates MIOX2 gene expression (Baena-Gonzalez et al., 2007). Lastly, it has been shown that the expression of all four MIOX genes is induced in syncytia stimulated by the cyst nematode Heterodera schachtii (Siddique et al., 2009). These cysts are known to be strong sink tissues that the parasites use to withdraw nutrients from the host plant, and formation of this structure may require adjustment of metabolism to meet the high demand for new cell wall synthesis. Thus the induction of MIOX genes during low energy conditions and syncytia development may provide alternative substrates for new cell wall synthesis. It is interesting to note that a decrease in inositol in soybean is associated with resistance to soybean cyst nematode (Heterodera glycine; Afzal et al., 2009), suggesting that inositol is required for nematode-induced cyst development in this plant.
Our data also suggest that changes in MIOX expression result in changes in inositol catabolism. Previously it was shown that MIOX4-overexpressing lines have a more than 30-fold up-regulated transcript level and increased incorporation of 3H-inositol into cell wall polymers (Endres and Tenhaken, 2009). In addition, we show here that plants overexpressing MIOX2 also contain reduced inositol levels in seedlings, leaves, flowers, and siliques, suggesting an important role for the degradation pathway in controlling the cellular inositol concentration (Figure 6). Previous metabolite data from Arabidopsis plants grown in extended night also support a correlation between elevated MIOX2 and MIOX4 transcription with lower inositol levels (Gibon et al., 2006). Our data on miox mutants supports the idea that changes in MIOX expression lead to changes in inositol oxidation. Specifically, we have shown that miox2-2 mutants have elevated inositol in seedlings, leaves and flowers. Previously it was shown that a miox1,2,4,5 quadruple mutant incorporates less 3H-inositol into cell wall molecules, and has higher inositol, galactinol, and raffinose levels (Endres and Tenhaken, 2011). Taken together, these data provide a link between changes in MIOX transcription with alterations in tissue inositol levels.
Considering our metabolite measurements from both miox mutants and MIOX:GFP gain-of-function lines (Figure 6), it seems likely that MIOX2 plays a greater role in inositol oxidation in plants as compared to MIOX4. We noted larger alterations in inositol levels in miox2-2 mutants as compared to miox4-1 mutants, and much greater decreases in inositol in MIOX2:GFP plants as compared to MIOX4:GFP plants (Figure 6). It is interesting to note that there were very little differences in DGlcA levels suggesting that MIOX-induced alterations in inositol do not greatly impact the DGlcA pool. One possible explanation for this lack of DGlcA alteration in miox2-2 and MIOX2:GFP plants is that DGlcA may be rapidly utilized for synthesis of other molecules in the plant.
The changes in MIOX expression and inositol levels we document in this work are accompanied by changes in root growth. Specifically, we measured small increases in root growth in miox2-2 and miox4-1 mutants when energy/nutrient conditions were low (Figure 3B). These small differences were dependent on energy/nutrient status as seen by the fact that they were reversed or not apparent when glucose was added (Figure 3C). Since MIOX2 and MIOX4 are induced by this same low energy/nutrient condition, we speculate that the decreased inositol oxidation in miox2-2 and miox4-1 shoots results in a signal for continued root growth during low energy/nutrient conditions. Nelson et al. (1998) have previously suggested that inositol is transported in the phloem and serves to signal the photosynthetic capacity of the shoot to the root. This shoot-to-root signaling could impact growth processes in the root, relaying information on the photosynthetic capacity of the shoot. Thus, the increase in inositol in miox2-2 and miox4-1 seedlings we measured could provide an aberrant signal to the roots that the photosynthetic capacity has been met for increased cell growth. Under optimal energy/nutrient conditions, however, MIOX2 is normally suppressed in WT seedling shoots, but maintained in seedling roots. The overall outcome for a WT seedling in optimal nutrient conditions is that more inositol might be available for shoot-to-root transport, and stimulation of root growth.
An alternative explanation for our data is that MIOX2 and MIOX4 expression in low energy/nutrient conditions provides alternative substrates needed for cell wall synthesis and growth under these conditions. In the case of miox2-2 and miox4-1 mutants, the lack of MIOX2 or MIOX4 expression and subsequent increase in seedling inositol levels in low energy/nutrient conditions could limit the synthesis of these substrates. In this case the changes in root growth we measured could be indicative of a stress response due to lack of these substrates. We are currently seeking ways to delineate between these possibilities and are limited by the lack of good experimental conditions to test the impact of low energy/nutrients when miox mutants and MIOX:GFP plants are grown in soil.
In conclusion, the data reported here support the hypothesis that MIOX enzymes are encoded by multiple genes that are required for responses to low energy/nutrient conditions. It appears that MIOX2 has a more prominent role in providing inositol catabolism for the needs of the plant in many different tissues. MIOX4 likely plays a supplementary role in some tissues. Furthermore, the potential nuclear localization of MIOX4 (Figure 7) indicates that it might also have a specialized role in inositol catabolism that remains to be characterized.
Conflict of Interest Statement
The authors declare that the research was conducted in the absence of any commercial or financial relationships that could be construed as a potential conflict of interest.
Acknowledgments
The authors also acknowledge Raimund Tenhaken for sharing MIOXpromoter:GUS lines. The authors also acknowledge David Schmale for help with GC–MS, Janet Donahue for assistance in PCR and western blotting, and Blair Lyons for help with GUS staining. The authors acknowledge the NSF for funding (MCB#1051646 to Glenda E. Gillaspy).
References
Afzal, A. J., Natarajan, A., Saini, N., Iqbal, M. J., Geisler, M., El Shemy, H. A., Mungur, R., Willmitzer, L., and Lightfoot, D. A. (2009). The nematode resistance allele at the rhg1 locus alters the proteome and primary metabolism of soybean roots. Plant Physiol. 151, 1264–1280.
Alonso, J. M., Stepanova, A. N., Leisse, T. J., Kim, C. J., Chen, H., Shinn, P., Stevenson, D. K., Zimmerman, J., Barajas, P., Cheuk, R., Gadrinab, C., Heller, C., Jeske, A., Koesema, E., Meyers, C. C., Parker, H., Prednis, L., Ansari, Y., Choy, N., Deen, H., Geralt, M., Hazari, N., Hom, E., Karnes, M., Mulholland, C., Ndubaku, R., Schmidt, I., Guzman, P., Aguilar-Henonin, L., Schmid, M., Weigel, D., Carter, D. E., Marchand, T., Risseeuw, E., Brogden, D., Zeko, A., Crosby, W. L., Berry, C. C., and Ecker, J. R. (2003). Genome-wide insertional mutagenesis of Arabidopsis thaliana. Science 301, 653–657.
Ananieva, E., Gillaspy, G., Ely, A., Burnette, R., and Erickson, F. L. (2008). Myo-inositol polyphosphate 5-phosphatase 13 functions in glucose and ABA responses. Plant Physiol. 148, 1868–1882.
Arner, R. J., Prabhu, K. S., Thompson, J. T., Hildenbrandt, G. R., Liken, A. D., and Reddy, C. C. (2001). myo-Inositol oxygenase: molecular cloning and expression of a unique enzyme that oxidizes myo-inositol and D-chiro-inositol. Biochem. J. 360, 313–320.
Baena-Gonzalez, E., Rolland, F., Thevelein, J. M., and Sheen, J. (2007). A central integrator of transcription networks in plant stress and energy signalling. Nature 448, 938–942.
Bechtold, N., Ellis, J., and Pelletier, G. (1993). In planta Agrobacterium mediated gene transfer by infiltration of adult Arabidopsis thaliana plants. J. Acad. Sci. Life Sci. 316, 1194–1199.
Berdy, S., Kudla, J., Gruissem, W., and Gillaspy, G. (2001). Molecular characterization of At5PTase1, an inositol phosphatase capable of terminating IP3 signaling. Plant Physiol. 126, 801–810.
Burnette, R. N., Gunesekera, B. M., and Gillaspy, G. E. (2003). An Arabidopsis inositol 5-phosphatase gain-of-function alters abscisic acid signaling. Plant Physiol. 132, 1011–1019.
Donahue, J. L., Alford, S. R., Torabinejad, J., Kerwin, R. E., Nourbakhsh, A., Ray, W. K., Hernick, M., Huang, X., Lyons, B. M., Hein, P. P., and Gillaspy, G. E. (2010). The Arabidopsis thaliana myo-inositol 1-phosphate synthase1 gene is required for myo-inositol synthesis and suppression of cell death. Plant Cell 22, 888–903.
Endres, S., and Tenhaken, R. (2009). Myo-inositol oxygenase controls the level of myo-inositol in Arabidopsis, but does not increase ascorbic acid. Plant Physiol. 149, 1042–1049.
Endres, S., and Tenhaken, R. (2011). Down-regulation of the myo-inositol oxygenase gene family has no effect on cell wall composition in Arabidopsis. Planta 234, 157–169.
Ercetin, M., Ananieva, E. A., Safaee, N. M., Torabinejad, J., Robinson, J., and Gillaspy, G. E. (2008). A phosphotidylinositol phosphate-specific myo-inositol polyphosphate 5-phosphatase required for seedling growth. Plant Mol. Biol. 67, 375–388.
Gibon, Y., Usadel, B., Blaesing, O. E., Kamlage, B., Hoehne, M., Trethewey, R., and Stitt, M. (2006). Integration of metabolite with transcript and enzyme activity profiling during diurnal cycles in Arabidopsis rosettes. Genome Biol. 7, R76.
Gillaspy, G. E., Ercetin, M. E., and Burnette, R. N. (2004). “Inositol metabolism in plant cells: a genomics perspective,” in Advances in Plant Physiology, ed. A. Hemantaranjan (Jodhpur: Indian Periodical), 145–158.
Kanter, U., Usadel, B., Guerineau, F., Li, Y., Pauly, M., and Tenhaken, R. (2005). The inositol oxygenase gene family of Arabidopsis is involved in the biosynthesis of nucleotide sugar precursors for cell-wall matrix polysaccharides. Planta 221, 243–254.
Koller, F., and Hoffmann-Ostenhof, O. (1979). myo-Inositol oxygenase from rat kidneys. I: purification by affinity chromatography; physical and catalytic properties. Hoppe-Seyler’s Z. Physiol. Chem. 360, 507–513.
Loewus, F. A., and Loewus, M. W. (1983). Myo-inositol: its biosynthesis and metabolism. Annu. Rev. Plant Physiol. 34, 137–161.
Loewus, F. A., and Murthy, P. P. N. (2000). Myo-inositol metabolism in plants. Plant Sci. 150, 1–19.
Lorence, A., Chevone, B. I., Mendes, P., and Nessler, C. L. (2004). myo-inositol oxygenase offers a possible entry point into plant ascorbate biosynthesis. Plant Physiol. 134, 1200–1205.
Michell, R. H. (2007). Evolution of the diverse biological roles of inositols. Biochem. Soc. Symp. 74, 223–246.
Michell, R. H. (2008). Inositol derivatives: evolution and functions. Nat. Rev. Mol. Cell Biol. 9, 151–161.
Moskala, R., Reddy, C. C., Minard, R. D., and Hamilton, G. A. (1981). An oxygen-18 tracer investigation of the mechanism of myo-inositol oxygenase. Biochem. Biophys. Res. Commun. 99, 107–113.
Nelson, D. E., Rammesmayer, G., and Bohnert, H. (1998). Regulation of cell specific inositol metabolism and transport in plant salinity tolerance. Plant Cell 10, 753–764.
Osuna, D., Usadel, B., Morcuende, R., Gibon, Y., Blasing, O. E., Hohne, M., Gunter, M., Kamlage, B., Trethewey, R., Scheible, W. R., and Stitt, M. (2007). Temporal responses of transcripts, enzyme activities and metabolites after adding sucrose to carbon-deprived Arabidopsis seedlings. Plant J. 49, 463–491.
Reddy, C. C., Swan, J. S., and Hamilton, G. A. (1981). myo-Inositol oxygenase from hog kidney. I. Purification and characterization of the oxygenase and of an enzyme complex containing the oxygenase and D-glucuronate reductase. J. Biol. Chem. 256, 8510–8518.
Siddique, S., Endres, S., Atkins, J. M., Szakasits, D., Wieczorek, K., Hofmann, J., Blaukopf, C., Urwin, P. E., Tenhaken, R., Grundler, F. M., Kreil, D. P., and Bohlmann, H. (2009). Myo-inositol oxygenase genes are involved in the development of syncytia induced by Heterodera schachtii in Arabidopsis roots. New Phytol. 184, 457–472.
Styer, J. C., Keddie, J., Spence, J., and Gillaspy, G. E. (2004). Genomic organization and regulation of the leimp-1 and leimp-2 genes encoding myo-inositol monophosphatase in tomato. Gene 326, 35–41.
Sulpice, R., Pyl, E. T., Ishihara, H., Trenkamp, S., Steinfath, M., Witucka-Wall, H., Gibon, Y., Usadel, B., Poree, F., Piques, M. C., Von Korff, M., Steinhauser, M. C., Keurentjes, J. J., Guenther, M., Hoehne, M., Selbig, J., Fernie, A. R., Altmann, T., and Stitt, M. (2009). Starch as a major integrator in the regulation of plant growth. Proc. Natl. Acad. Sci. U.S.A. 106, 10348–10353.
Appendix
Keywords: myo-inositol, ascorbic acid, nutrient response, energy
Citation: Alford SR, Rangarajan P, Williams P and Gillaspy GE (2012) myo-Inositol oxygenase is required for responses to low energy conditions in Arabidopsis thaliana. Front. Plant Sci. 3:69. doi: 10.3389/fpls.2012.00069
Received: 21 December 2011; Accepted: 22 March 2012;
Published online: 19 April 2012.
Edited by:
Xuemin Wang, University of Missouri-St Louis and Donald Danforth Plant Science Center, USAReviewed by:
Miyako Kusano, RIKEN Plant Science Center, JapanUener Kolukisaoglu, University of Tuebingen, Germany
Copyright: © 2012 Alford, Rangarajan, Williams and Gillaspy. This is an open-access article distributed under the terms of the Creative Commons Attribution Non Commercial License, which permits non-commercial use, distribution, and reproduction in other forums, provided the original authors and source are credited.
*Correspondence: Glenda E. Gillaspy, Department of Biochemistry, Virginia Tech, Blacksburg, VA 24061, USA. e-mail:Z2lsbGFzcHlAdnQuZWR1
†Padma Rangarajan and Phoebe Williams should be considered co-authors.

 Padma Rangarajan†
