 Hayato Hiraki1
 Matsuo Uemura
 Yukio Kawamura
- 1The United Graduate School of Agricultural Sciences, Iwate University, Morioka, Japan
- 2Department of Plant-bioscience, Faculty of Agriculture, Iwate University, Morioka, Japan
Molecular and physiological processes during cold acclimation (CA) have been investigated using plants incubated under constant low-temperature conditions. However, to comprehensively characterize CA in the field, the effects of day–night temperature cycles and minute-scale random temperature fluctuations must be clarified. Thus, we developed an experimental system that can maintain diurnal cycles and random temperature fluctuations during CA treatments. On the basis of the temperature changes in the field, three CA conditions were applied: conventional CA at 2°C (con-CA), CA with a 10°C day/2°C night cycle (C-CA), and C-CA with random temperature fluctuations only during the day (FC-CA). Because cold-induced Ca2+ signals help regulate CA, the effects of Ca2+ signals during the three CA treatments were examined using Ca2+ channel blockers (LaCl3 and ruthenium red). The freezing tolerance of Arabidopsis thaliana was similar after the C-CA and con-CA treatments, but it decreased following the FC-CA treatment. The analysis of transcription factors regulating CA processes indicated CBF/DREB1 expression levels tended to be highest for the con-CA treatment, followed by the FC-CA and C-CA treatments. Moreover, the Ca2+ signals substantially contributed to the freezing tolerance of the plants that underwent the FC-CA and C-CA treatments, while also considerably modulating gene expression in the FC-CA-treated plants. Furthermore, the Ca2+ signals enhanced CBF/DREB1 expression during the FC-CA treatment, but the Ca2+ signals derived from intracellular organelles suppressed the expression of CBF2/DREB1C and CBF3/DREB1A during the C-CA treatment. Thus, diurnal temperature cycles and random temperature fluctuations affect CA through different calcium signals, implying that plants regulate CA by precisely sensing temperature changes in the field.
1 Introduction
Cold acclimation (CA) refers to the phenomenon in which the freezing tolerance of temperate plants is enhanced by an exposure to low non-freezing temperatures (Levitt, 1980). Over the last several decades, studies have been conducted to clarify the molecular mechanisms underlying CA and the accompanying increase in freezing tolerance. Consequently, a number of cold-inducible genes have been identified, including those encoding proteins associated with freezing tolerance and transcription factors that regulate CA (Steponkus et al., 1998; Fowler and Thomashow, 2002; Chinnusamy et al., 2007; Yamazaki et al., 2008; Thalhammer et al., 2014; Takahashi et al., 2016; Watanabe et al., 2022). The regulated expression of these cold-inducible genes is reportedly influenced by calcium signaling.
In plants, calcium ions (Ca2+) function as second messengers during stress responses (McAinsh and Pittman, 2009; Martí et al., 2013). More specifically, the transient cytosolic Ca2+ concentration (i.e., Ca2+ signal) is closely associated with the perception of cooling (Plieth et al., 1999; Kiegle et al., 2000; Knight and Knight, 2000; Krebs et al., 2012; Hiraki et al., 2019). Several studies showed that the expression of cold-inducible genes, including transcription factor genes and genes related to enhanced freezing tolerance, may be regulated by Ca2+ in response to cold shock or low-temperature stress (Knight et al., 1996; Knight et al., 1996; Tähtiharju et al., 1997; Chinnusamy et al., 2007; McAinsh and Pittman, 2009). The Ca2+ signal has been proposed as the inducer of CA, which involves the following process: i) Ca2+ is perceived by calmodulin, which binds to calmodulin-binding transcription activator 3 (CAMTA3) and CAMTA5; ii) these complexes induce the expression of the CBF/DREB1 transcription factor genes (Doherty et al., 2009; Kidokoro et al., 2017); iii) CBF/DREB1 transcription factors induce the expression of the cold-responsive COR genes, thereby directly or indirectly increasing the tolerance to freezing conditions (Fowler and Thomashow, 2002; Wang and Hua, 2009).
To better understand the role of calcium signals in the CA process, we constructed a system in which the temperature can be precisely controlled and the cellular calcium signal level can be measured in intact plants. This system, which is useful for thoroughly investigating cold-induced calcium properties, revealed that in intact plants, the cold-induced generation of calcium signals occurs only in response to cooling (i.e., not following a constant low-temperature treatment) (Hiraki et al., 2019). In earlier studies involving artificial CA treatments, plants were grown at approximately 20°C prior to a constant low-temperature treatment. Under low temperature and light conditions, the CA process is initiated in plants, but calcium signals are expected to be generated only when the plants are transferred from an environment with a normal growth temperature to an environment with a lower temperature. In fact, only one calcium signal was detected in our earlier continuous measurement of calcium signals within a 72-h period (Hiraki et al., 2019). It is still unclear whether this one-time signal triggers the CA process. However, unlike under controlled experimental conditions, the air temperature is never constant under natural conditions. Interestingly, when Arabidopsis thaliana is acclimated to the cold in a field, CBF gene expression becomes increasingly dependent on calcium signaling as the frequency of temperature changes increases (Hiraki et al., 2019).
Under field conditions, the temperature can change at any time. For example, in addition to diurnal temperature changes, minute-scale random temperature fluctuations may occur in a single day. Plants likely sense seasonal temperature changes in such an environment and are acclimated to the cold from fall to winter, but it is unclear how CA proceeds in plants exposed to fluctuating temperatures. Recent research on temperature changes and low-temperature acclimation showed that in A. thaliana, cold-inducible gene expression does not occur in darkness even at low temperatures (Tominaga et al., 2021) and there is no increase in freezing tolerance (Wanner and Junttila, 1999). However, freezing tolerance reportedly increases when the temperature changes from 23°C during the day to 1°C at night (Wanner and Junttila, 1999). The reason for this unexpected finding is unknown, but it is possible that the temperature change induces the production of calcium signals that promote CA.
Based on the previous findings described above, we developed the working hypothesis that cold-induced Ca2+ signals enable the CA process to proceed stably in a field with diurnal and random temperature fluctuations. In this study, as a first step to test our working hypothesis, features of temperature changes in the field were extracted, a model system was constructed in chamber experiments, and the involvement of calcium signals in the model system was tested. In the model system, we especially focused on the relationship between cold-induced Ca2+ signals and temperature changes during CA, especially the cyclical day–night temperature changes and the temperature fluctuations over relatively short periods (i.e., minutes). While both conditions were expected to cause cold-induced Ca2+ signals, the day–night changes have a longer period and is accompanied by a change in light conditions, whereas the temperature fluctuations have a shorter period and no change in light conditions. Therefore, we investigated the possibility that the cold-induced Ca2+ signals in these both conditions are different in quality, and that subsequent gene regulation may be different.
2 Materials and methods
2.1 Plant materials
Arabidopsis thaliana (Col-0) plants were grown in Petri plates containing modified Hoagland’s nutrient solution solidified with 1% agar (Minami et al., 2015). Seeds of Arabidopsis thaliana ecotype Columbia (Col-0) were surface sterilized and placed on Hoagland medium containing 1% sucrose and 1% agar in 96 × 96 × 15-mm Petri plates (Minami et al., 2015). After stratification at 4°C in the dark, plants were grown at 23°C with a 16-h photoperiod (photon flux: 80 µmol m−2 s−1) for 2 weeks, and then CA treatment was done.
2.2 Cold acclimation treatments
The plants underwent one of the following three artificial CA treatments: (a) constant low temperature (2°C; con-CA), (b) day (10°C)–night (2°C) temperature cycle (C-CA), and (c) C-CA with random temperature fluctuations only during the day (FC-CA). For the FC-CA treatment, the following special experimental system was developed using a polystyrene foam box (Figure 1A). A copper plate was laid on the bottom of the box (Figure 1B). A silicone belt heater (Sakaguchi E.H. VOC Co., Japan) was attached to the underside of the plate (Figure 1C). The heater was connected to a temperature controller (KT4R; Panasonic Co., Japan) (Figure 1D) and a power supply. Using the on/off mode of the temperature controller, the temperature was kept at 10°C during the day and 2°C at night. Normally, growth chamber temperatures are maintained via proportional-integral-differential control to avoid overshooting the set temperature and fluctuating temperatures. In our system, the on/off mode was adopted to facilitate temperature fluctuations. Because this system lacked a cooling mechanism or lights, it was placed in a growth chamber set at 1°C (Figure 1E).
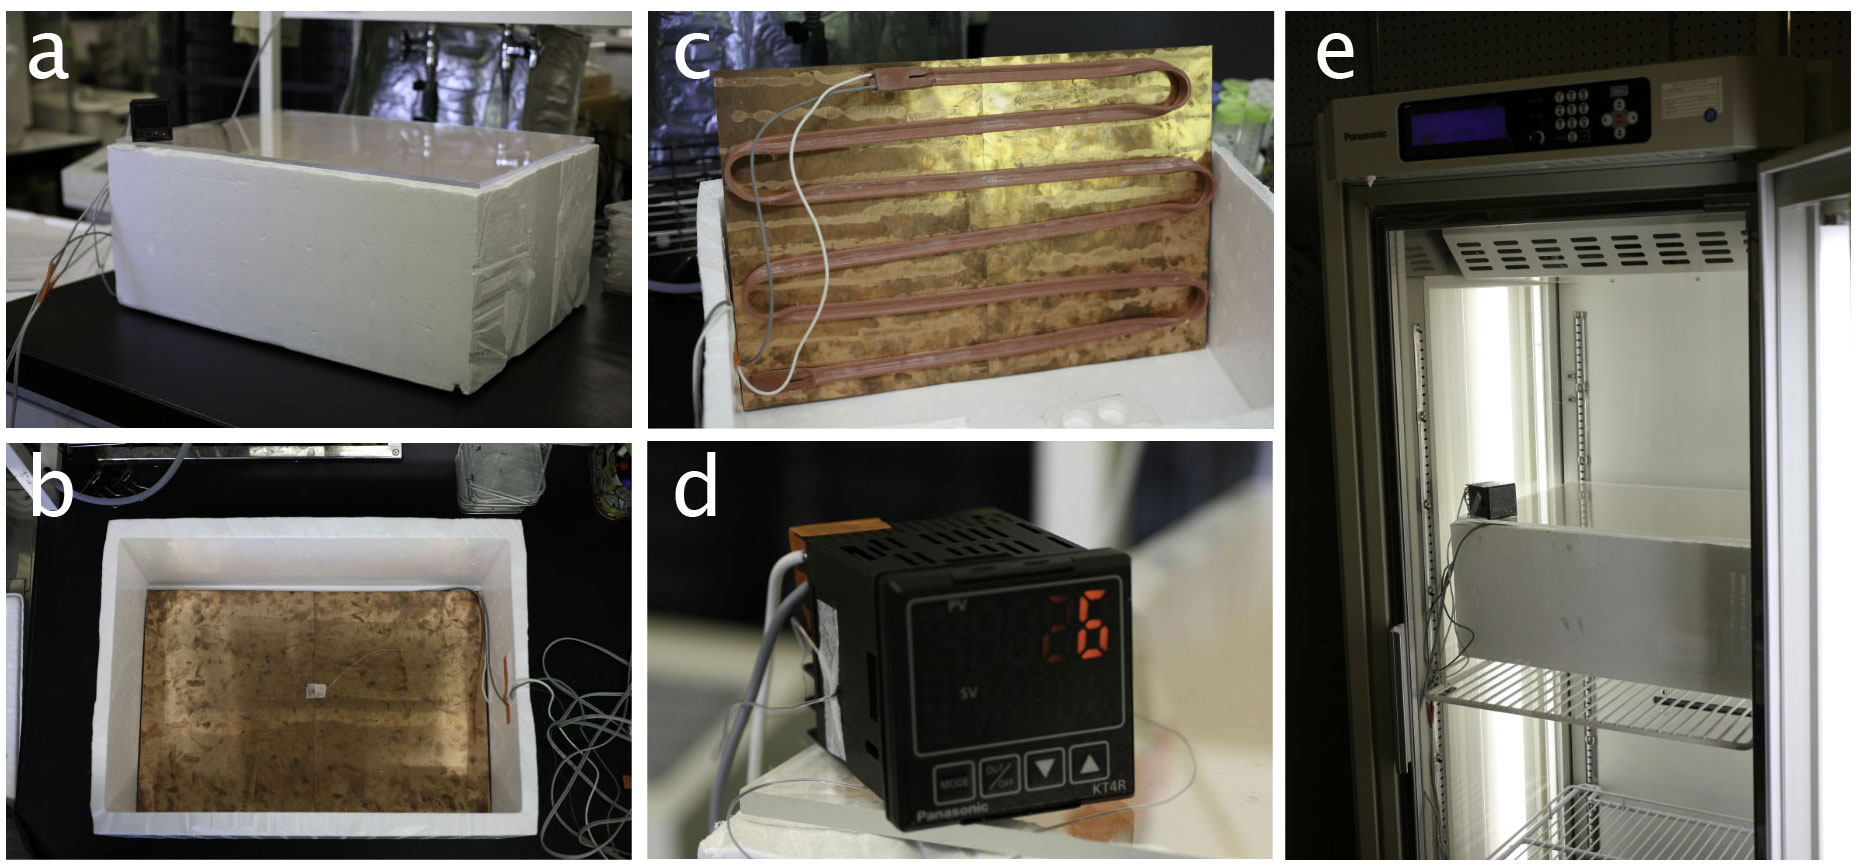
Figure 1 Setting of the chamber for the cold acclimation with random temperature fluctuations only during the day. To prepare the FC-CA conditions, a special chamber was constructed to generate temperature fluctuations: (A) the appearance of the chamber, (B) copper plate installed at the bottom of the chamber, (C) silicone belt heater (Sakaguchi E.H. VOC Co., Japan) attached to the back of the copper plate, and (D) temperature controller (KT4R; Panasonic Co., Japan). Finally, the FC-CA treatment was completed using this special chamber in a cold growth chamber (E).
The three CA treatments under a 12-h photoperiod (photon flux rate: 80 µmol m−2 s−1) were completed in a cold chamber (MLR-352-PJ; PHCbi, Japan), which was periodically warmed to 10°C for 10 min at 3:00 and 15:00 (i.e., defrosted).
2.3 Air temperature analysis
Air temperature data were collected at 1 min intervals using a thermocouple data logger (TR-55i; T&D Corporation, Japan). From 2018 to 2022, temperatures were recorded in a field that was not exposed to direct light on the Iwate University campus (latitude 39°42’53” N and longitude 141°08’08” E). The field temperature data were analyzed using the built-in functions in MATHEMATICA (version 13; Wolfram Research).
2.4 Chemical treatment
To investigate the role of Ca2+ signals during the plant responses to the con-CA, C-CA, and FC-CA treatments, the plants were treated with 50 µM ruthenium red (RR) and 1 mM LaCl3, which are Ca2+ channel blockers. Specifically, the plants were sprayed with solutions comprising these chemicals and 0.05% Triton X-100. Triton X-100 was used to enhance the penetration of the plant tissue by the chemicals. The control plants were sprayed with a 0.05% Triton X-100 solution. The chemical treatment was performed 1 h before and 45 h after starting the CA treatments. According to earlier research, LaCl3 blocks the influx of extracellular Ca2+ (Knight and Knight, 2000) and RR inhibits the release of Ca2+ from intracellular organelles (Knight et al., 1992; Monroy et al., 1995).
2.5 Freezing tolerance test and measurement of electrolyte leakage
After the chemical treatment, the freezing tolerance tests were performed before and after the CA treatment at 73 or 169 h (i.e., plants acclimated for 3 or 7 days). Freezing tolerance of each plant was evaluated on the basis of electrolyte leakage (EL) according to the slightly modified method of Minami et al. (2015). The third and fourth leaves were harvested and placed in a test tube with 0.2 ml distilled water. The samples were incubated at −2°C for 15 min and then small pieces of ice were added. After incubation for 2 h at −2°C, the samples were cooled at a rate of 2°C h−1 to a specified temperature in an ethanol bath (NCB-3400; EYELA, Tokyo, Japan). When they reached the specified temperature, the samples were removed from the bath. Unfrozen (uf) and liquid nitrogen-frozen (LN) samples were also prepared, and together these were thawed at 4°C overnight and incubated with 3 ml distilled water for 2 h at room temperature. Then, electrolyte leakage from the samples was measured with a conductivity meter (Twin Cond Conductivity Meter, B-173; Horiba Ltd., Tokyo, Japan). Subsequently, the samples were boiled for 30 min and shaken for 2 h at room temperature and electrolyte leakage of the samples was measured again to obtain the total electrolyte leakage from the cells (ELboil). Normalized values were calculated using the following formula.
Freezing tolerance of Arabidopsis thaliana reaches a maximum after about one week of CA treatment (Uemura et al., 1995; Miki et al., 2019), but the process is not uniform over the week; e.g., changes in the composition of the plasma membrane proteins are different around 3 days of CA (Miki et al., 2019; Watanabe et al., 2022). Therefore, days 3 and 7 of the CA treatment were chosen. In addition, while the temperatures at which 50% survival occurred after freezing tests range from −9°C to −12°C at 3 to 7 days of CA (Uemura et al., 1995; Miki et al., 2019), to compare the difference with the inhibitor treatment, the freezing treatment temperatures were chosen at −4°C and −6°C. After 3 or 7 days of the CA treatments, freezing tolerance was evaluated on the basis of EL. Because increases in the EL values are positively associated with increases in the plasma membrane damage, they have traditionally been used as an indicator of freezing injury (Nagao et al., 2008).
2.6 Measurement of mRNA levels
Total RNA was extracted from the aerial part of A. thaliana (Col-0) plants using ISOSPIN Plant RNA (Nippon Gene Co., Ltd., Japan) and then cDNA was synthesized using the ReverTra Ace qPCR RT Master Mix (TOYOBO Co., Tokyo, Japan). The real-time PCR analysis was performed using the cDNA synthesized for each sample, with PDF2 (At1g13320) selected as the reference gene. The real-time PCR primers are listed in Supplementary Table S1.
2.7 Statistical analysis
The number of repeats in each experiment is noted in the legend of each figure. All statistical analyses were performed using the built-in functions in MATHEMATICA (version 13; Wolfram Research).
The contribution of the Ca2+ signals was calculated by subtracting the EL value of the control from that of the inhibitor treatment, and the standard error was calculated by the propagation of error shown in the following equation (Figure S1).
On the other hand, because the repetition numbers cannot be defined for the values after subtraction, in this case, statistical tests that require the repetition numbers in the calculation process could not be performed.
2.8 Construction of a model system for field temperature changes
2.8.1 Air temperature changes in winter
To characterize the average diurnal temperature cycle for each month in winter, the moving averages of 1-h periods were calculated and then the monthly average and the 4-year average were calculated to eliminate random temperature fluctuations. The average temperature difference between day and night was within 8°C (Figure 2A).
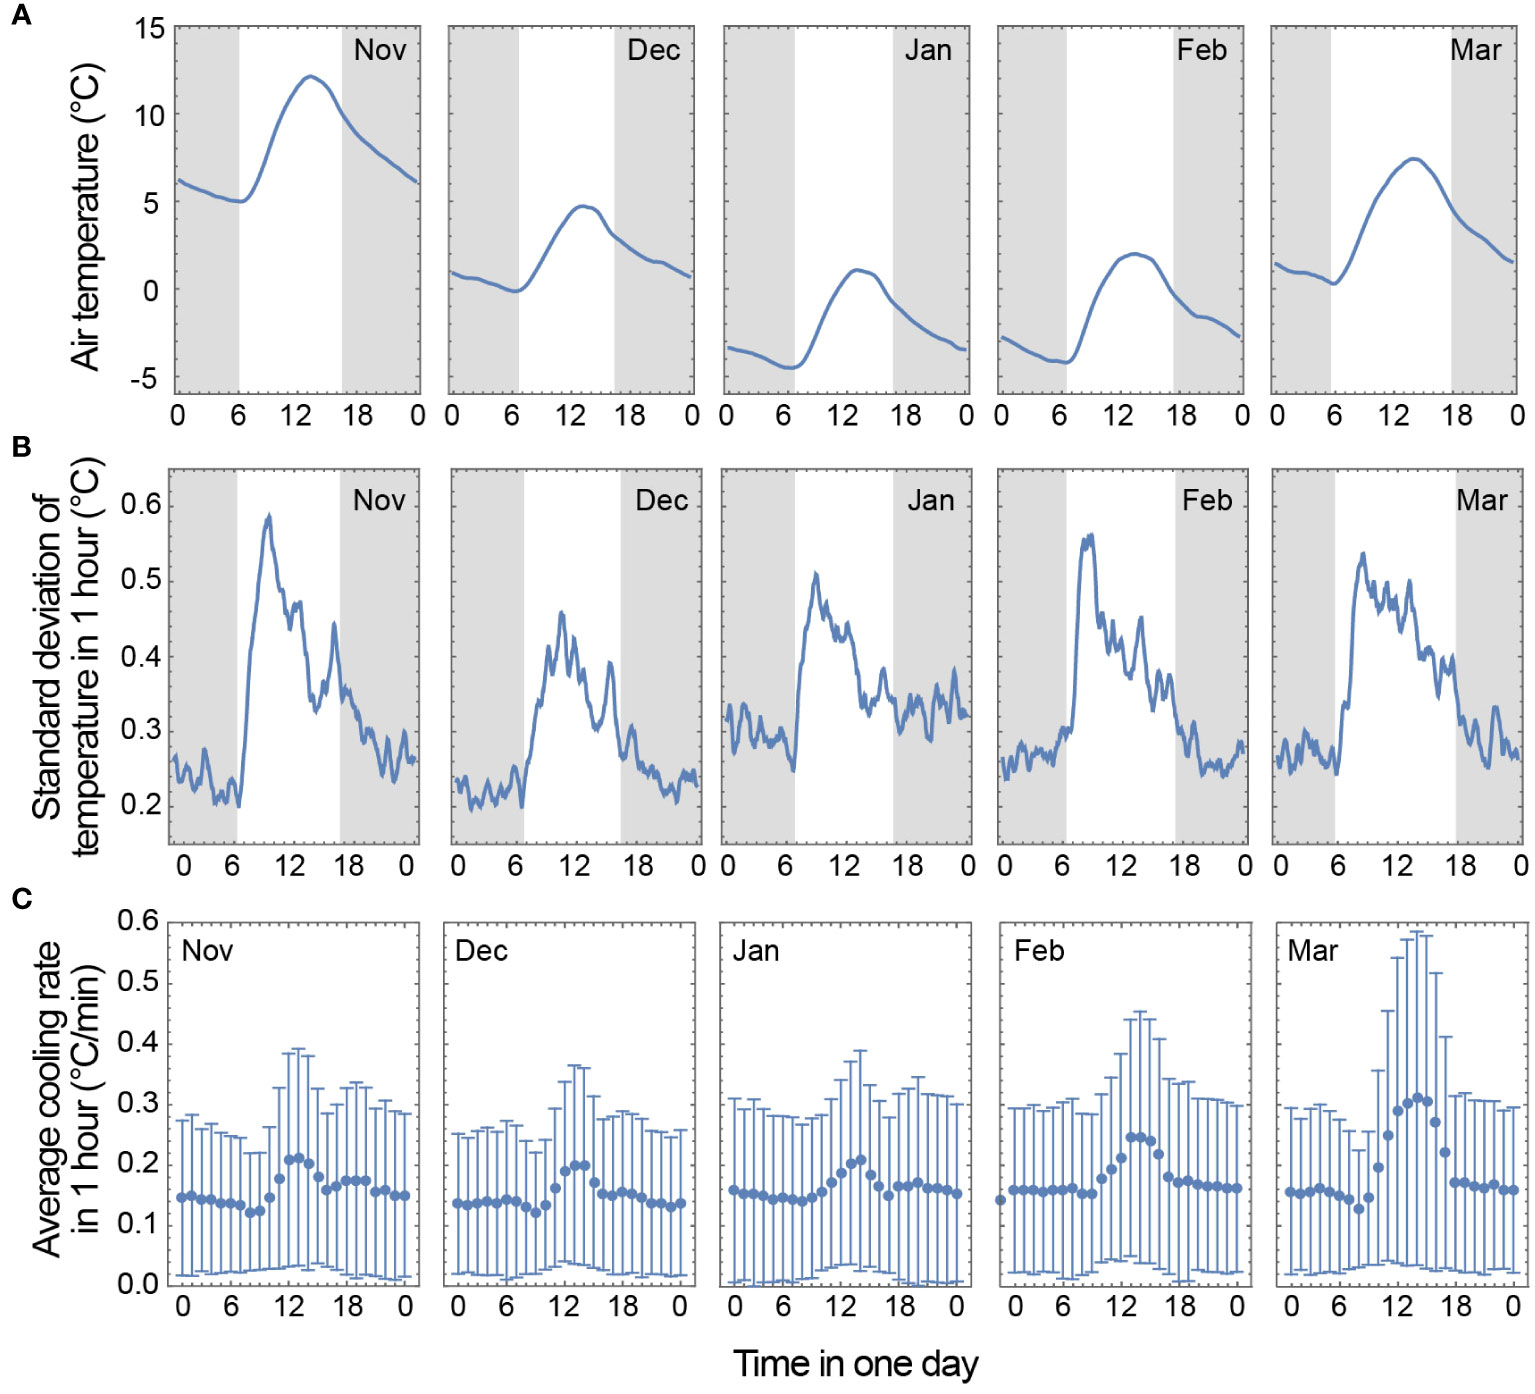
Figure 2 Air temperature changes under field conditions. The air temperature in a field that was not exposed to direct light at Iwate University was measured at 1 min intervals from 2018 to 2022. (A) The average diurnal temperature cycle for each month in winter was calculated according to the following procedure: i) moving averages of 1-h periods were calculated and ii) the monthly average and 4-year average were calculated for each month. (B) The random temperature fluctuations over 1 day were estimated according to the following procedure: i) moving standard deviations of 1-h periods were calculated and ii) the monthly average and the 4-year average were calculated for each month. (C) The cooling rate per hour per day was calculated for each month according to the following procedure: i) temperature changes per minute were calculated and ii) the hourly mean and standard deviation per day were calculated for each month using the data collected over 4 years.
Next, to characterize the random temperature fluctuations over 1 day, moving standard deviations of 1-h periods were calculated and then the monthly average and the 4-year average were calculated. For all months, the temperature fluctuations increased rapidly after sunrise, peaked in the morning, decreased toward sunset, and were relatively low at night (Figure 2B). Random temperature fluctuations are created by frequent increases and decreases in the air temperature. Because cold-induced calcium signals can be triggered by even low cooling rates in the field (Hiraki et al., 2019), the cooling rate per hour per day was calculated for each month. The cooling rate increased immediately after sunrise, decreased in the afternoon, and was almost constant at night (Figure 2C). From November to February, the maximum average cooling rate was approximately 0.2°C/min, which occurred at approximately 14:00.
Finally, the average periodicity of the random temperature fluctuations was estimated. Using the 2018 data, the daily random temperature fluctuations were calculated by subtracting the moving average of a 1-h period from the temperature data. A discrete Fourier analysis was performed using this data and the average was calculated for each month. Because there were no seasonal characteristics in the periodicity, the average for the data from November to March was calculated, resulting in a periodicity of 25 min.
2.8.2 Temperature changes for the three cold acclimation treatments of Col-0
To study the relationship between temperature fluctuations and calcium signals during the CA process, the following three artificial CA conditions were set on the basis of the information obtained from the temperature analysis: i) con-CA (Figure 3A), ii) C-CA (Figure 3B), and iii) FC-CA (Figure 3C). Because the focus of this study was on temperature conditions, a 12-h daylength was used for all three CA conditions. In addition, the temperature for the con-CA treatment (i.e., the control in this experiment) was 2°C, which was consistent with our earlier experiments (Uemura et al., 1995; Tominaga et al., 2021).
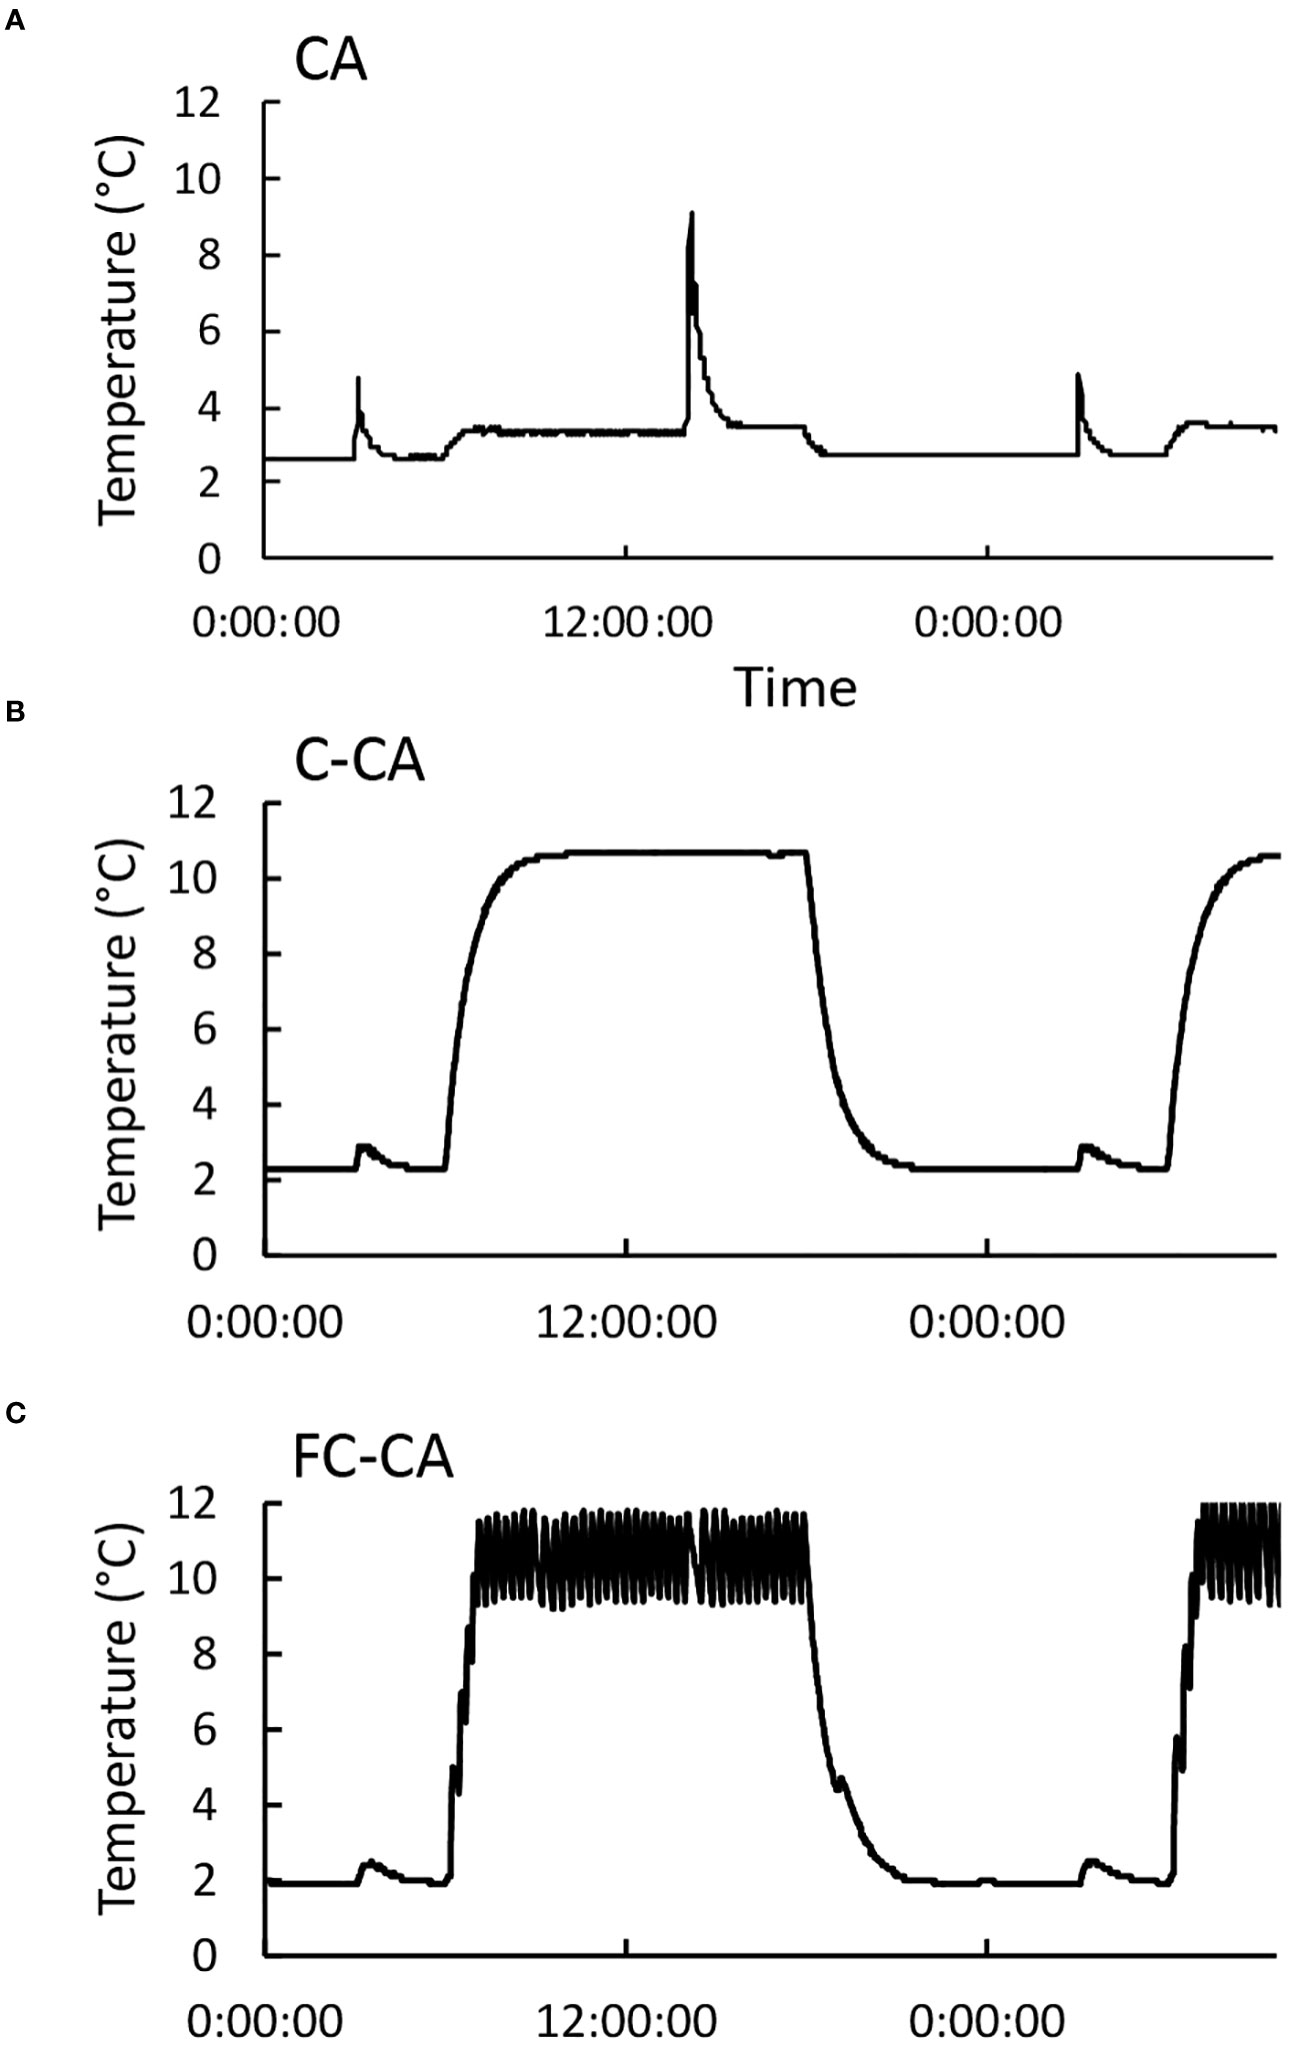
Figure 3 Temperature changes during three acclimation treatments. On the basis of the temperature data, the following three artificial CA conditions were prepared: (A) constant low temperature (con-CA), (B) day–night temperature cycle (C-CA), and (C) C-CA with random temperature fluctuations only during the day (FC-CA). All temperature data were collected using a temperature data logger (TR-55i; T&D Co., Japan).
The temperature fluctuations for the C-CA and FC-CA treatments, which were based on the information derived from the analysis of field temperatures, were implemented relatively simply in the experimental system. The C-CA conditions were set at 10°C (day)/2°C (night) so the day–night temperature difference was 8°C (Figure 1A) and the minimum temperature was 2°C (i.e., same as the temperature for the con-CA treatment). For the FC-CA treatment, a device that generates temperature fluctuations was placed in the low-temperature chamber (Figures 1A–E). Random temperature fluctuations occurred exclusively during the day (according to Figure 1B). Although fine-tuning the random temperature fluctuations was difficult, the temperature fluctuated between approximately 9°C and 12°C, with 12–18 min per fluctuation. The cooling rate during the random temperature fluctuations was approximately 0.14–0.2°C min−1. These random temperature fluctuations were similar to those detected in the field (Figure 1). Finally, the temperatures in the Petri dishes during the three CA treatments were measured using thermocouples (Figure 3). We confirmed that the plants in each Petri dish were exposed to the expected air temperature conditions.
3 Results
3.1 Effect of the temperature cycle and fluctuation on electrolyte leakage
To study how Ca2+ signals are affected by the three CA treatments (i.e., FC-CA, C-CA, and con-CA), plants were treated with the Ca2+ channel blockers LaCl3 and RR before undergoing the CA treatments. First, we confirmed that the EL values for the control plants that were not acclimated to the cold were 50.4 ± 8.8% (mean ± SE) at −4°C and 79.7 ± 5.4% at −6°C (data not graphed). In contrast, the EL values for the plants exposed to the FC-CA, C-CA, and con-CA conditions were respectively 19.7 ± 4.5%, 7.2 ± 1.1%, and 14.3 ± 4.3% at −4°C and 37.8 ± 4.4%, 35.7 ± 4.4%, and 32.5 ± 3.2% at −6°C after 3 days of the CA treatments (Figures 3A, C) and were respectively 18.5 ± 2.4%, 3.8 ± 0.9%, and -0.8 ± 7.4% at −4°C and 41.5 ± 4.5%, 19.0 ± 5.0%, and 25.4 ± 6.8% at −6°C after 7 days of the CA treatments (Figures 3B, D), indicative of an increase in freezing tolerance for all CA treatments.
There tended to be a significant difference in the EL value between the control and chemical-treated plants following the FC-CA and C-CA treatments, but not after the con-CA treatment (Figure 4). In the FC-CA-treated plants, the EL values for the control plants hardly changed from days 3 to day 7 (Figure 4). For the C-CA and con-CA treatments, the EL values for the control plants tended to be higher on day 3 than on day 7 (Figure 4). Among the three CA treatments, FC-CA resulted in the weakest freezing tolerance as evidenced by the highest EL values (Figure 4D).
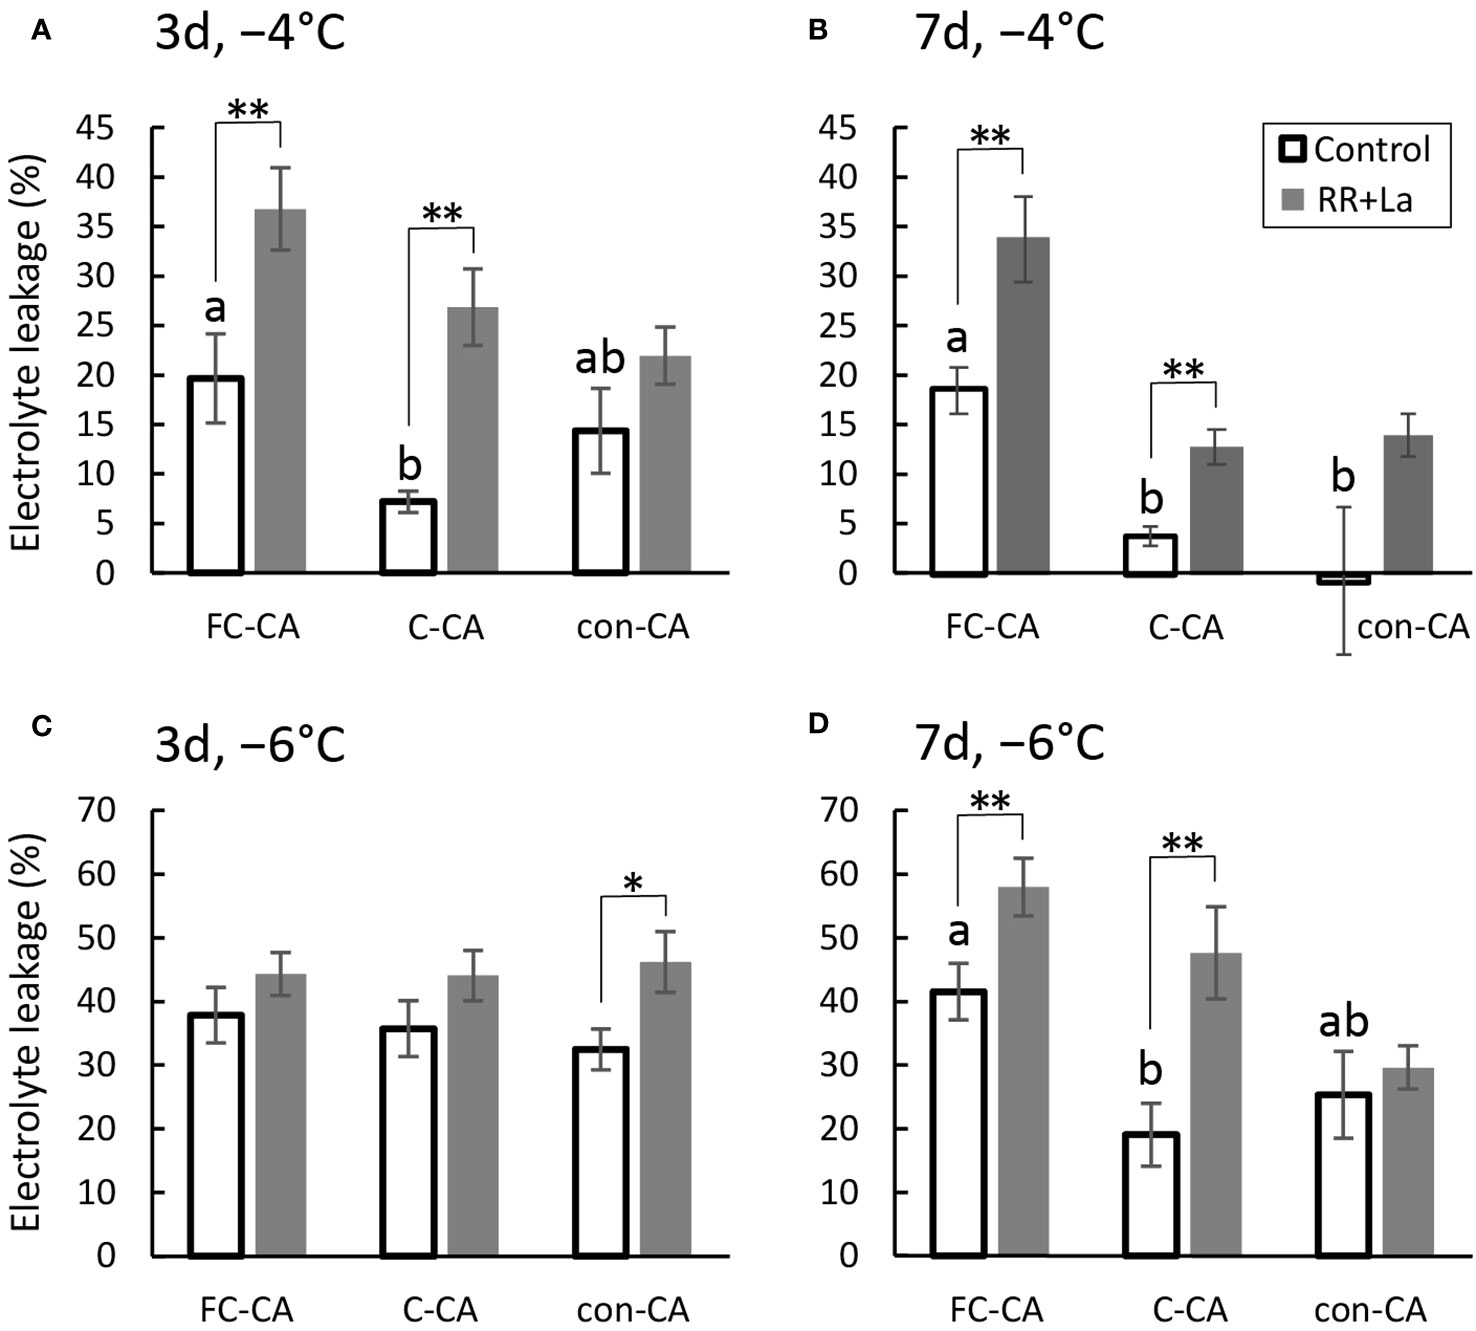
Figure 4 Electrolyte leakage (EL) during the three acclimation treatments with Ca2+ channel blockers. (A) EL at −4°C after a 3-day acclimation in each condition. (B) EL at −6°C after a 3-day acclimation in each condition. (C) EL at −4°C after a 7-day acclimation in each condition. (D) EL at −6°C after a 7-day acclimation in each condition. Significant differences between the control and chemical-treated samples were analyzed using the t-test (**p< 0.01, *p< 0.05) (n = 12–24). Significant differences among controls were analyzed by the Tukey-Kramer test, with different letters indicating significant differences (p< 0.05) (n = 12–24). The bars indicate the SE.
To quantitatively analyze the contribution of the Ca2+ signal to the increase in freezing tolerance, the EL value of the control plants was subtracted from the EL value of the plants treated with LaCl3 and RR (Figure S1). In terms of the enhanced freezing tolerance at −4°C, the contribution of the Ca2+ signal was similar for the FC-CA and C-CA treatments at the 3-day time-point, but the contribution of the Ca2+ signal for the con-CA treatment was less than half of that for the FC-CA and C-CA treatments (Figure 5A). On day 7 of the FC-CA treatment, the contribution of the Ca2+ signal was almost the same as that on day 3. However, for the C-CA treatment, the contribution of the Ca2+ signal on day 7 was approximately half of that on day 3. For the con-CA treatment, the effect of the Ca2+ signal on days 3 and 7 were similarly low (Figure 5A). For the enhanced freezing tolerance at −6°C, the contribution of the Ca2+ signal for the FC-CA and C-CA treatments was approximately 3-times higher on day 7 than on day 3 (Figure 5B). Conversely, the contribution of the Ca2+ signal for the con-CA treatment was lower on day 7 than on day 3 (Figure 5B).
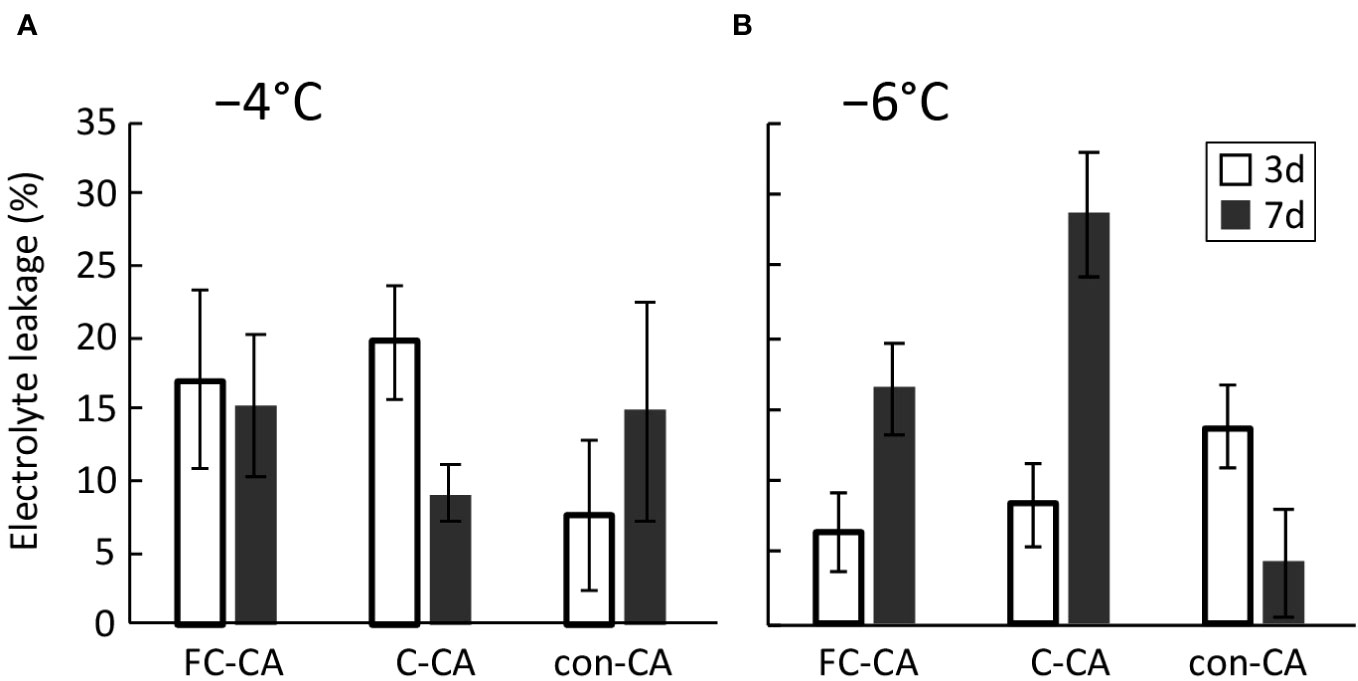
Figure 5 Contribution of the Ca2+ signals to the increase in freezing tolerance during the three acclimation treatments. The contribution was calculated by subtracting the EL value for the chemical-treated plants from the EL value for the control plants. (A) Contribution of the Ca2+ signals according to the EL values at −4°C after 3- and 7-day acclimation treatments. (B) Contribution of the Ca2+ signals according to the EL values at −6°C after 3- and 7-day acclimation treatments.
3.2 Gene expression induced by the three CA treatments
The CBF1/DREB1B, CBF2/DREB1C, and CBF3/DREB1A expression levels at 0, 8, 22, 32, and 46 h after starting the CA treatments were analyzed by real-time PCR, which revealed differences among the gene expression changes induced by the FC-CA, C-CA, and con-CA treatments. The CBF1/DREB1B expression levels peaked at 8 and 32 h after initiating the CA treatments. For the con-CA treatment, the first CBF1/DREB1B expression peak was larger than the second expression peak, whereas the CBF1/DREB1B expression peaks were similar for the FC-CA and C-CA treatments (Figure 6A). The CBF1/DREB1B expression levels after the FC-CA and C-CA treatments were one half to one tenth of those following the con-CA treatment (Figure 6A). In response to the con-CA treatment, CBF2/DREB1C expression peaked once at 8 h (Figure 6B). Of the three CA treatments, con-CA resulted in the highest CBF2/DREB1C expression level. There was almost no increase in CBF2/DREB1C expression following the C-CA treatment (Figure 6B), whereas CBF2/DREB1C expression peaked twice (8 and 32 h) after the FC-CA treatment (Figure 6B). Similar to the expression of CBF2/DREB1C, the CBF3/DREB1A expression level peaked at 8 h after starting the con-CA treatment. The C-CA and FC-CA treatments resulted in two CBF3/DREB1A expression peaks (8 and 32 h) (Figure 6C), but the first and second CBF3/DREB1A expression peaks were 2- to 3-times higher after the FC-CA treatment than after the C-CA treatment (Figure 6C). The expression of COR15A, which is a cold-responsive gene regulated by CBF/DREB1, at two time-points (32 and 46 h) did not differ significantly among the three CA treatments (Figures 6D, E).
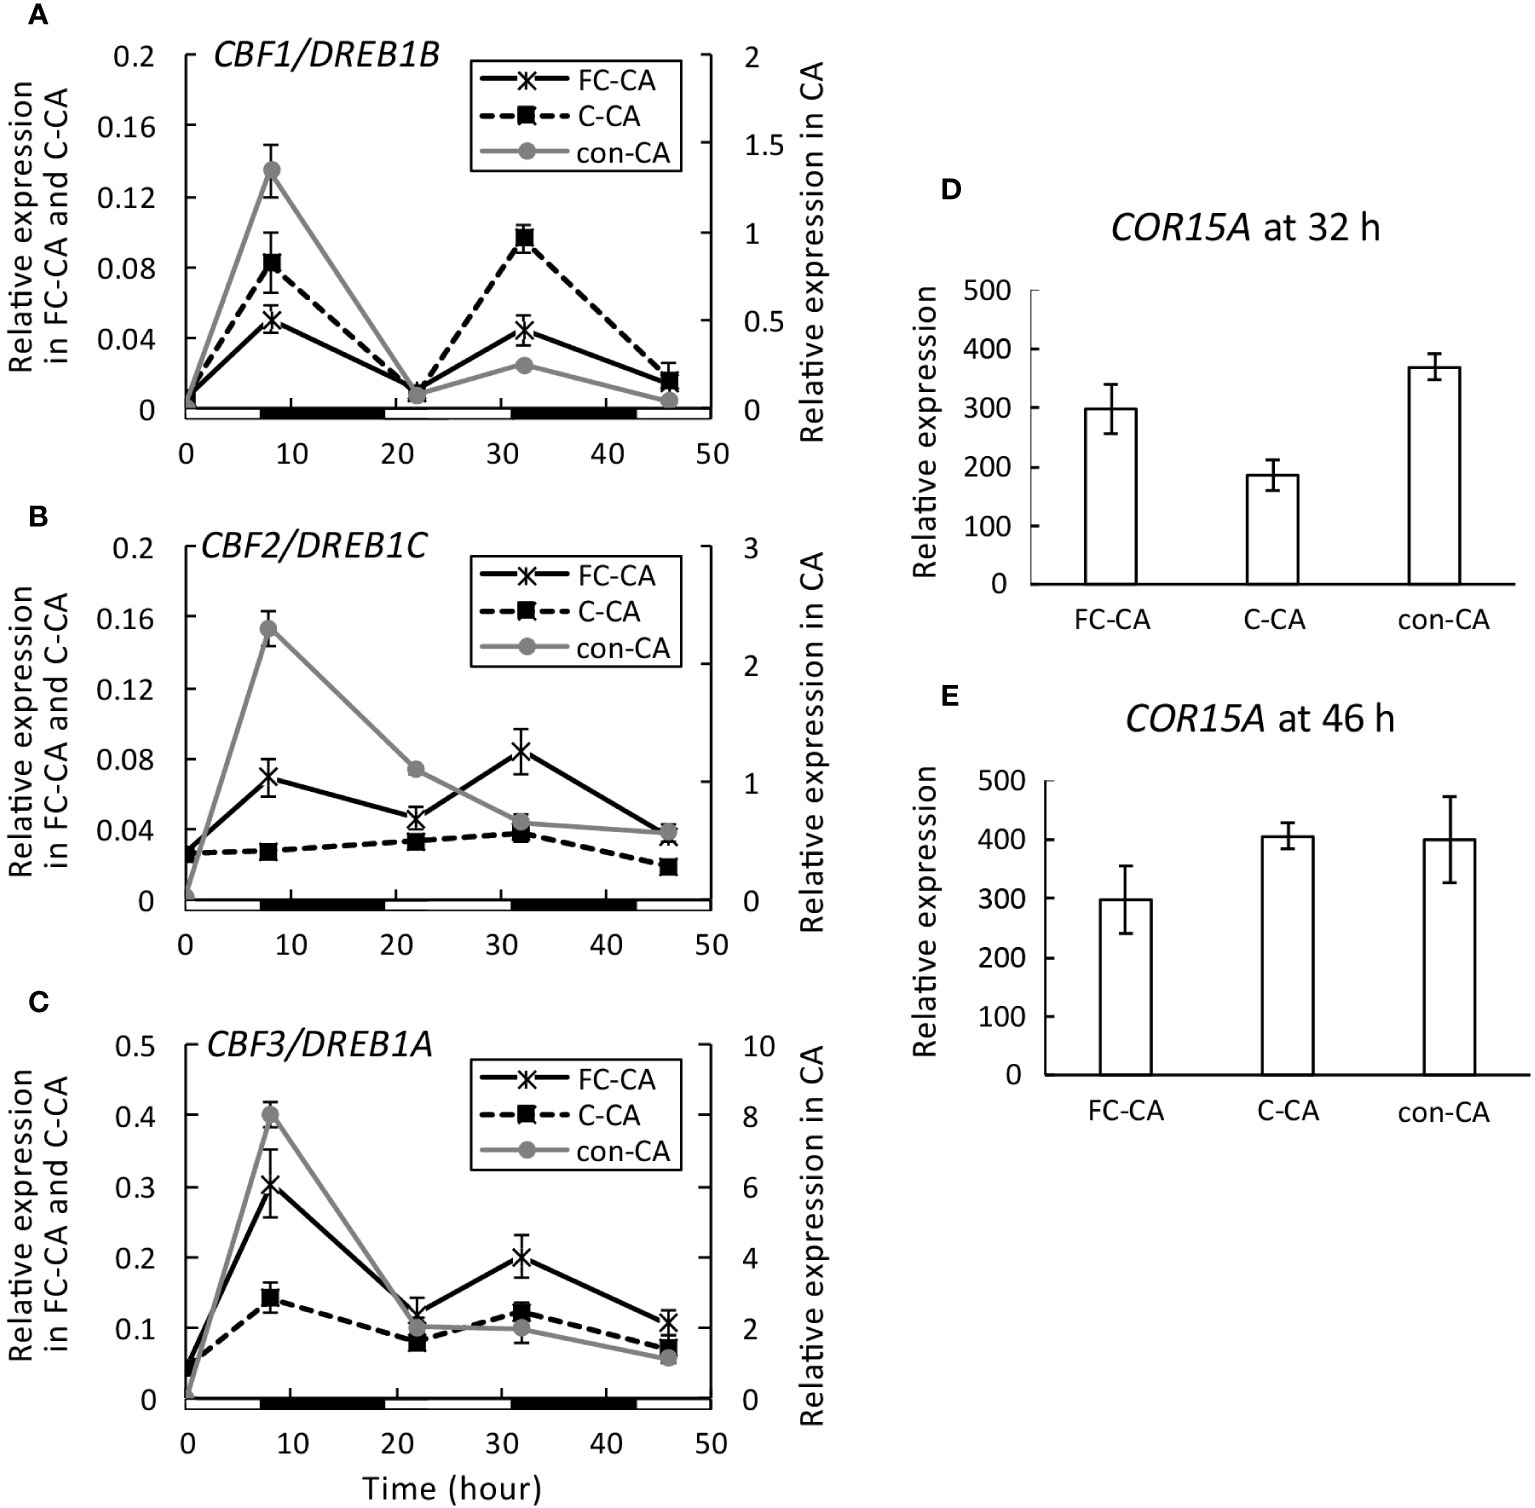
Figure 6 CBF/DREB1 expression levels during three acclimation treatments. (A) Changes in CBF1/DREB1B expression at 0, 8, 22, 32, and 46 h after starting the acclimation treatments were determined by real-time PCR (n = 3–6). (B) Changes in CBF2/DREB1C expression (n = 3–6). (C) Changes in CBF3/DREB1A expression (n = 3–6). (D, E) COR15A expression levels at 32 and 46 h after starting the acclimation treatment (n = 3–6). PDF2 was used as the reference gene. Day and night are respectively indicated by white and black bars under the graph. Error bars indicate the SE.
3.3 Inhibitory effects of Ca2+ channel blockers on gene expression during three cold acclimation treatments
Gene expression may be suppressed by Ca2+ channel blockers. The effects of Ca2+ signals on gene expression were examined using LaCl3, RR, and a solution comprising both chemicals (i.e., mixed solution). The 32 h time-point, which corresponds to the second CBF/DREB1 expression peak, was selected for the subsequent analysis to avoid the initial effect of the temperature decrease (i.e., room temperature to the temperature for each CA treatment).
First, CBF1/DREB1B expression was significantly inhibited by LaCl3 during the FC-CA, C-CA, and con-CA treatments (Figure 7A). Because the mixed solution contained LaCl3, it also tended to inhibit gene expression (Figure 7A). Ruthenium red tended to decrease CBF1/DREB1B expression only during the FC-CA treatment (p< 0.07) (Figure 7A). Second, CBF2/DREB1C expression during the FC-CA treatment was inhibited by all chemical treatments (Figure 7B). Interestingly, RR upregulated the expression of CBF2/DREB1C in the C-CA-treated plants (Figure 7B). For the plants that underwent the con-CA treatment, only LaCl3 decreased the expression of CBF2/DREB1C (Figure 7B). Third, CBF3/DREB1A expression in the plants exposed to the FC-CA conditions was inhibited by all chemical treatments (Figure 7C). Both LaCl3 and the mixed solution inhibited the expression of CBF3/DREB1A, whereas RR had the opposite effect (Figure 7C). There was no significant difference among the CBF3/DREB1A expression levels in the con-CA-treated plants (Figure 7C). The effects of the Ca2+ channel blockers on COR15A expression were also assessed. The expression of COR15A was suppressed by all chemical treatments during the FC-CA treatment. Although LaCl3 and the mixed solution also inhibited COR15A expression during the C-CA and con-CA treatments, RR alone did not (Figure 7D). Accordingly, LaCl3 inhibited the expression of almost all genes in all conditions. In contrast, RR inhibited gene expression only during the FC-CA treatment, while also upregulating CBF2/DREB1C and CBF3/DREB1A expression, but only during the C-CA treatment.
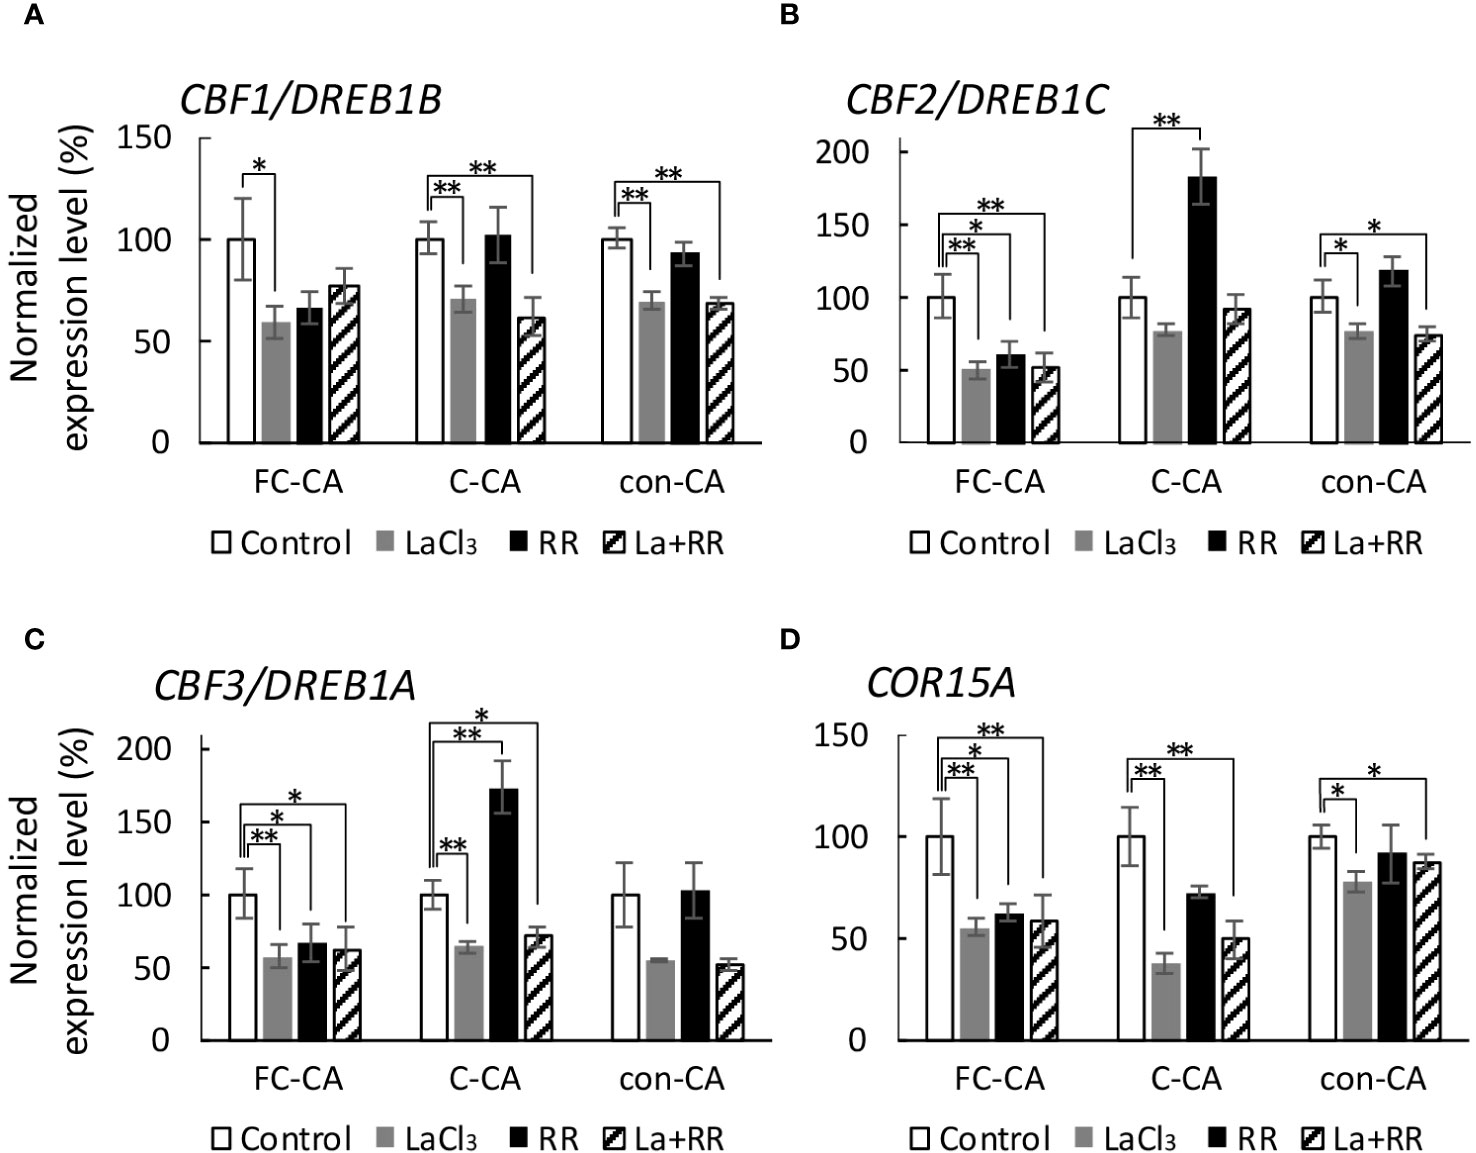
Figure 7 Effect of Ca2+ channel blockers on gene expression at 32 h during three acclimation treatments. The gene expression level in the chemical-treated plants was normalized against the corresponding control level. (A) Inhibitory effects of the Ca2+ channel blockers on CBF1/DREB1B expression. (B) Inhibitory effects of the Ca2+ channel blockers on CBF2/DREB1C expression. (C) Inhibitory effects of the Ca2+ channel blockers on CBF3/DREB1A expression. (D) Inhibitory effects of the Ca2+ channel blockers on COR15A expression. Significant differences between the control and chemical-treated samples were analyzed using the t-test (**p< 0.01, *p< 0.05). Error bars indicate the SE.
4 Discussion
4.1 Effect of the temperature cycle and temperature fluctuations on the CA process
In this study, new CA conditions were established by analyzing the characteristics of the following two temperature fluctuations that occurred in the experimental field (Figure 2): C-CA (Figure 3B) and FC-CA (Figure 3C). Due to the requirement for routine defrosting in the cold chamber, even under con-CA conditions with a constant 2°C setting, a slight temperature increase occurs twice a day (Figure 3A). However, unlike the C-CA and FC-CA treatments, the con-CA treatment typically did not lead to a Ca2+ signal-dependent increase in freezing tolerance (Figure 4), suggesting that this transient temperature increase may not significantly affect the regulation of CA via Ca2+ signals.
In A. thaliana, the transient expression of COR15A, even during an incubation at 11°C under light, does not increase freezing tolerance (Tominaga et al., 2021). Additionally, in darkness, COR15A is hardly expressed, even at 2°C, and there is no increase in freezing tolerance (Wanner and Junttila, 1999, Tominaga et al., 2021). Thus, if there is no interaction between the daytime and nighttime phenomena, there should be no increase in freezing tolerance under the C-CA condition of 10°C at day and 2°C at night. However, in fact, a similar level of freezing tolerance was observed in C-CA as in con-CA, indicating that there is an interaction between the daytime and nighttime phenomena. Although this phenomenon has not been re-examined since Wanner and Junttila (1999) reported it, it must be elucidated to characterize CA in the field. Interestingly, according to the results of our experiments involving inhibitors, Ca2+ signals help increase the freezing tolerance under C-CA and FC-CA conditions with diurnal temperature cycles (Figure 4).
Cold-induced Ca2+ signals are generated only during cooling, although they are also affected by the absolute temperature (Knight et al., 1996; Plieth et al., 1999; Knight and Knight, 2000; Nagel-Volkmann et al., 2009; Hiraki et al., 2019). For the con-CA treatment, while there were periodic and small transient temperature changes (Figure 3A), the only major temperature change was the decrease from 23°C to 2°C, only in which the production of major Ca2+ signals is caused (Hiraki et al., 2019). This signal is probably the reason for the detection of the slight Ca2+ signal-dependent freezing tolerance only on day 3 of the CA treatment (Figure 4C). In contrast, for the C-CA and FC-CA treatments, significant Ca2+ signal-dependent freezing tolerance was detected even on day 7 of the CA treatment (Figure 4), suggestive of the importance of the frequent cold-induced production of Ca2+ signals during CA.
The freezing tolerance increased during the C-CA treatment, even from day 3 to day 7, whereas the freezing tolerance during the FC-CA treatment peaked on day 3 and was lower than that for the C-CA treatment (Figure 4). Because the average temperature was highly similar between the FC-CA and C-CA treatments, this result implies that the random temperature fluctuations in this experiment inhibited the increase in freezing tolerance. However, a thorough analysis of the FC-CA data indicated that the freezing tolerance of the control was unchanged from day 3 to day 7 of the CA treatment, but the Ca2+ signal-dependent freezing tolerance increased (Figures 4C, D). For CA under artificial conditions, freezing tolerance gradually decreases after a certain period of CA, although the reason for this decrease is unknown (Tominaga et al., 2021). It is likely that the freezing tolerance during the FC-CA treatment also started to decrease after day 3, but this decrease was suppressed by Ca2+ signals.
4.2 Effect of the temperature cycle and temperature fluctuations on gene expression
The three CA treatments differentially induced the expression of cold-responsive transcription factor genes and other genes. The CBF/DREB1 expression levels were higher in the con-CA-treated plants than in the plants that underwent the FC-CA and C-CA treatments (Figure 6A), reflecting the temperature-dependent induction of gene expression (Zarka et al., 2003). The con-CA treatment rapidly cooled the plants from room temperature to 2°C, which was the lowest temperature among the three CA treatments. There are two potential explanations for the lack of a significant difference in the expression of COR15A at 32 and 46 h among the CA treatments (Figures 6D, E). Specifically, low CBF/DREB1 expression levels are sufficient for inducing COR15A expression. Alternatively, COR15A expression may be induced by another mechanism during the FC-CA and C-CA treatments.
The con-CA treatment resulted in a single CBF/DREB1 expression peak at 8 h (Figure 6), whereas a second expression peak was detected for the FC-CA and C-CA treatments, possibly because of the day–night temperature cycle. Circadian rhythms and diurnal changes regulate CBF/DREB1 expression (Dong et al., 2011). Moreover, Millar (2004) reported that circadian rhythms can be entrained by warm–cold cycles. Likewise, the circadian rhythms in the temperature changes during the FC-CA and C-CA treatments may modulate CBF/DREB1 expression.
The CBF/DREB1 expression levels were higher in the FC-CA-treated plants than in the C-CA-treated plants (Figure 6), whereas the opposite trend was observed for the freezing tolerance (Figure 4). This suggests that freezing tolerance may be increased by a pathway unrelated to Ca2+-CBF/DREB1 under C-CA conditions. The factors associated with the perception of temperature fluctuations and the subsequent signaling and inhibition of the CA process during the FC-CA treatment remain to be determined. The effects of the slight increase in the peak temperature (i.e., 1 to 2°C increase) due to the temperature fluctuations and signal transduction pathways that do not involve Ca2+ should be explored.
The influx of extracellular Ca2+ and the release of Ca2+ from intracellular pools (e.g., vacuoles) generate Ca2+ signals (Knight et al., 1996; Knight and Knight 2009). In the current study, LaCl3 was used as the Ca2+ channel blocker to restrict the influx of extracellular Ca2+ (Knight and Knight, 2000). Ruthenium red was used because it reportedly blocks Ca2+ channels in organelles (Knight et al., 1992; Monroy et al., 1995) and inhibits the production of Ca2+ signals caused by cooling. We previously confirmed these Ca2+ channel blockers affect the generation of Ca2+ signals during cooling (Hiraki et al., 2019). More specifically, LaCl3 substantially decreases the first Ca2+ signal peak (Knight and Knight, 2000; Hiraki et al., 2019), while RR decreases the three Ca2+ signal peaks by more than half (Hiraki et al., 2019). However, there is no clear evidence of the individual effects of Ca2+ influx or efflux.
The temperature fluctuation-induced Ca2+ signals increased CBF/DREB1 expression, especially during the FC-CA treatment (Figure 7). In addition, RR upregulated gene expression only during the C-CA treatment, indicating that the release of Ca2+ from intracellular pools due to the day–night temperature change suppressed the expression of CBF2/DREB1C and CBF3/DREB1A during the C-CA treatment, but not during the FC-CA treatment (Figure 7). The temperature fluctuation originally inhibited the increase in freezing tolerance during CA (Figure 4), but the Ca2+ signals produced because of the temperature fluctuation induced the expression of CBF1/DREB1B, CBF2/DREB1C, and CBF3/DREB1A (Figure 7). In an earlier study involving CA treatments in the field, we observed that RR tends to inhibit the expression of CBF1/DREB1B and CBF2/DREB1C when the amplitude of the temperature fluctuation is high, while it decreases CBF/DREB1 expression levels when the amplitude of the temperature fluctuation is low (Hiraki et al., 2019). The results of the present study and our previous research support the hypothesis that Ca2+ signals, especially the signals derived from intracellular organelles, positively or negatively regulate CBF/DREB1 expression depending on the amplitude of the temperature fluctuation. Our findings also imply the effects of Ca2+ influx and Ca2+ efflux vary depending on the temperature fluctuation. Because the effect of only Ca2+ efflux changed (i.e., positive or negative regulator of gene expression), the gradation or the balance in the cellular Ca2+ concentration may influence the regulation of gene expression. Because these Ca2+ signals cannot be explained by only the Ca2+-CAMTA3 or -CAMTA5 pathway, there may be an additional Ca2+-CBF/DREB1 pathway.
Another possibility is that the Ca2+ signal produced in response to rapid cooling during the day may not suppress gene expression. The cold-induced Ca2+ signal peak is reportedly relatively high during the day (Dodd et al., 2006). Moreover, photoreceptors help reset the internal clock (Devlin, 2002). Some photoreceptors, such as phototropin and phytochrome, are mediated by Ca2+ signals (Bowler et al., 1994; Briggs and Olney, 2001; Zhao et al., 2013). Therefore, the varying effects of Ca2+ signals over time might be associated with the crosstalk between circadian- and photoreceptor-related factors.
5 Conclusions
In this study, we revealed that day–night temperature cycles and random temperature fluctuations that occur during CA in the field induce different types of calcium signals. Because the formation of Ca2+ signals is considerably affected by the cooling rate, the duration of the cooling period, and the absolute temperature (Plieth et al., 1999; Nagel-Volkmann et al., 2009; Hiraki et al., 2019), there may be qualitative and quantitative differences in the Ca2+ signals produced by cooling (e.g., day–night temperature change) and temperature fluctuations (Hiraki et al., 2019). Notably, although the C-CA and FC-CA treatments resulted in similar calcium signal-dependent freezing tolerance, there were clear differences in the calcium signal-related regulation of cold-inducible gene expression. In future, to further clarify the role of Ca2+ signals in CA in the field, it is necessary to study the effects of seasonal changes in day/night temperature differences and day length.
Data availability statement
The raw data supporting the conclusions of this article will be made available by the authors, without undue reservation.
Author contributions
HH: Conceptualization, Formal Analysis, Investigation, Methodology, Visualization, Writing – original draft, Writing – review & editing. UM: Methodology, Writing – review & editing. MU: Writing – review & editing. YK: Conceptualization, Formal Analysis, Funding acquisition, Project administration, Supervision, Visualization, Writing – original draft, Writing – review & editing.
Funding
The author(s) declare financial support was received for the research, authorship, and/or publication of this article. This work was supported by JSPS KAKENHI Grant number 23H02406 to YK.
Acknowledgments
We thank Edanz (https://jp.edanz.com/ac) for editing a draft of this manuscript. Finally, we greatly appreciate technical support from Ms. Yuko Suzuki, Michiko Saito and Nozomi Yokota (Iwate University).
Conflict of interest
The authors declare that the research was conducted in the absence of any commercial or financial relationships that could be construed as a potential conflict of interest.
The author MU declared that they were an editorial board member of Frontiers, at the time of submission. This had no impact on the peer review process and the final decision.
Publisher’s note
All claims expressed in this article are solely those of the authors and do not necessarily represent those of their affiliated organizations, or those of the publisher, the editors and the reviewers. Any product that may be evaluated in this article, or claim that may be made by its manufacturer, is not guaranteed or endorsed by the publisher.
Supplementary material
The Supplementary Material for this article can be found online at: https://www.frontiersin.org/articles/10.3389/fphgy.2023.1304255/full#supplementary-material
References
Bowler C., Neuhaus G., Yamagata H., Chua N. H. (1994). Cyclic GMP and calcium mediate phytochrome phototransduction. Cell 77, 73–81. doi: 10.1016/0092-8674(94)90236-4
Briggs W. R., Olney M. A. (2001). Photoreceptors in plant photomorphogenesis to date. Five phytochromes, two cryptochromes, one phototropin, and one superchrome. Plant Physiol. 125, 85–88. doi: 10.1104/PP.125.1.85
Chinnusamy V., Zhu J., Zhu J. K. (2007). Cold stress regulation of gene expression in plants. Trends Plant Sci. 12, 444–451. doi: 10.1016/J.TPLANTS.2007.07.002
Devlin P. F. (2002). Signs of the time: environmental input to the circadian clock. J. Exp. Bot. 53, 1535–1550. doi: 10.1093/JXB/ERF024
Dodd A. N., Jakobsen M. K., Baker A. J., Telzerow A., Hou S. W., Laplaze L., et al. (2006). Time of day modulates low-temperature Ca signals in Arabidopsis. Plant J. 48, 962–973. doi: 10.1111/J.1365-313X.2006.02933.X
Doherty C. J., Van Buskirk H. A., Myers S. J., Thomashow M. F. (2009). Roles for Arabidopsis CAMTA transcription factors in cold-regulated gene expression and freezing tolerance. Plant Cell 21, 972–984. doi: 10.1105/TPC.108.063958
Dong M. A., Farré E. M., Thomashow M. F. (2011). Circadian clock-associated 1 and late elongated hypocotyl regulate expression of the C-repeat binding factor (CBF) pathway in arabidopsis. Proc. Natl. Acad. Sci. U.S.A. 108, 7241–7246. doi: 10.1073/pnas.1103741108/-/dcsupplemental/pnas.201103741si.pdf
Fowler S., Thomashow M. F. (2002). Arabidopsis transcriptome profiling indicates that multiple regulatory pathways are activated during cold acclimation in addition to the CBF cold response pathway. Plant Cell 14, 1675–1690. doi: 10.1105/TPC.003483
Hiraki H., Uemura M., Kawamura Y. (2019). Calcium signaling-linked CBF/DREB1 gene expression was induced depending on the temperature fluctuation in the field: views from the natural condition of cold acclimation. Plant Cell Physiol. 60, 303–317. doi: 10.1093/PCP/PCY210
Kidokoro S., Yoneda K., Takasaki H., Takahashi F., Shinozaki K., Yamaguchi-Shinozaki K. (2017). Different cold-signaling pathways function in the responses to rapid and gradual decreases in temperature. Plant Cell 29, 760–774. doi: 10.1105/TPC.16.00669
Kiegle E., Moore C. A., Haseloff J., Tester M. A., Knight M. R. (2000). Cell-type-specific calcium responses to drought, salt and cold in the Arabidopsis root. Plant J. 23, 267–278. doi: 10.1046/J.1365-313X.2000.00786.X
Knight H., Knight M. R. (2000). Imaging spatial and cellular characteristics of low temperature calcium signature after cold acclimation in Arabidopsis. J. Exp. Bot. 51, 1679–1686. doi: 10.1093/JEXBOT/51.351.1679
Knight H., Trewavas A. J., Knight M. R. (1996). Cold calcium signaling in Arabidopsis involves two cellular pools and a change in calcium signature after acclimation. Plant Cell 8, 489–503. doi: 10.1105/TPC.8.3.489
Knight M. R., Smith S. M., Trewavas A. J. (1992). and Wind-induced plant motion immediately increases cytosolic calcium. Proc. Natl. Acad. Sci. U.S.A. 89, 4967–4971. doi: 10.1073/PNAS.89.11.4967
Krebs M., Held K., Binder A., Hashimoto K., Den Herder G., Parniske M., et al. (2012). FRET-based genetically encoded sensors allow high-resolution live cell imaging of Ca2+ dynamics. Plant J. 69, 181–192. doi: 10.1111/J.1365-313X.2011.04780.X
Levitt J. (1980). “Responses of plants to Enviromental Stresses,” in Chilling, Freezing, and High Temperature Stresses, vol. I. (New York: Academic Press).
Martí M. C., Stancombe M. A., Webb A. A. R. (2013). and Cell- and stimulus type-specific intracellular free Ca2+ signals in Arabidopsis. Plant Physiol. 163, 625–634. doi: 10.1104/PP.113.222901
McAinsh M. R., Pittman J. K. (2009). and Shaping the calcium signature. New Phytol. 181, 275–294. doi: 10.1111/J.1469-8137.2008.02682.X
Miki Y., Takahashi D., Kawamura Y., Uemura M. (2019). Temporal proteomics of Arabidopsis plasma membrane during cold- and de-acclimation. J. Proteomics 197, 71–81. doi: 10.1016/J.JPROT.2018.11.008
Millar A. J. (2004). Input signals to the plant circadian clock. J. Exp. Bot. 55, 277–283. doi: 10.1093/JXB/ERH034
Minami A., Tominaga Y., Furuto A., Kondo M., Kawamura Y., Uemura M. (2015). Arabidopsis dynamin-related protein 1E in sphingolipid-enriched plasma membrane domains is associated with the development of freezing tolerance. Plant J. 83, 501–514. doi: 10.1111/TPJ.12907
Monroy A. F., Dhindsa R. S. (1995). Low-temperature signal transduction: induction of cold acclimation-specific genes of alfalfa by calcium at 25 degrees C. Plant Cell 7, 321–331. doi: 10.1105/TPC.7.3.321
Nagao M., Arakawa K., Takezawa D., Fujikawa S. (2008). Long- and short-term freezing induce different types of injury in Arabidopsis thaliana leaf cells. Planta 227, 477–489. doi: 10.1007/S00425-007-0633-9
Nagel-Volkmann J., Plieth C., Becker D., Lüthen H., Dörffling K. (2009). Cold-induced cytosolic free calcium ion concentration changes in wheat. J. Plant Physiol. 166, 1955–1960. doi: 10.1016/J.JPLPH.2009.05.002
Plieth C., Hansen U. P., Knight H., Knight M. R. (1999). Temperature sensing by plants: the primary characteristics of signal perception and calcium response. Plant J. 18, 491–497. doi: 10.1046/J.1365-313X.1999.00471.X
Steponkus P. L., Uemura M., Joseph R. A., Gilmour S. J., Thomashow M. F. (1998). Mode of action of the COR15a gene on the freezing tolerance of Arabidopsis thaliana. Proc. Natl. Acad. Sci. U.S.A. 95, 14570–14575. doi: 10.1073/PNAS.95.24.14570
Tähtiharju S., Sangwan V., Monroy A. F., Dhindsa R. S., Borg M. (1997). The induction of kin genes in cold-acclimating Arabidopsis thaliana. Evidence of a role for calcium. Planta 203, 442–447. doi: 10.1007/S004250050212
Takahashi D., Kawamura Y., Uemura M. (2016). Cold acclimation is accompanied by complex responses of glycosylphosphatidylinositol (GPI)-anchored proteins in Arabidopsis. J. Exp. Bot. 67, 5203–5215. doi: 10.1093/JXB/ERW279
Thalhammer A., Bryant G., Sulpice R., Hincha D. K. (2014). Disordered cold regulated15 proteins protect chloroplast membranes during freezing through binding and folding, but do not stabilize chloroplast enzymes in vivo. Plant Physiol. 166, 190–201. doi: 10.1104/PP.114.245399
Tominaga Y., Suzuki K., Uemura M., Kawamura Y. (2021). In Planta monitoring of cold-responsive promoter activity reveals a distinctive photoperiodic response in cold acclimation. Plant Cell Physiol. 62, 43–52. doi: 10.1093/PCP/PCAA138
Uemura M., Joseph R. A., Steponkus P. L. (1995). Cold acclimation of arabidopsis thaliana (Effect on plasma membrane lipid composition and freeze-induced lesions). Plant Physiol. 109, 15–30. doi: 10.1104/PP.109.1.15
Wang Y., Hua J. (2009). A moderate decrease in temperature induces COR15a expression through the CBF signaling cascade and enhances freezing tolerance. Plant J. 60, 340–349. doi: 10.1111/J.1365-313X.2009.03959.X
Wanner L. A., Junttila O. (1999). Cold-induced freezing tolerance in Arabidopsis. Plant Physiol. 120, 391–399. doi: 10.1104/PP.120.2.391
Watanabe E., Kondo M., Kamal M. M., Uemura M., Takahashi D., Kawamura Y. (2022). Plasma membrane proteomic changes of Arabidopsis DRP1E during cold acclimation in association with the enhancement of freezing tolerance. Physiol. Plant 174, e13820. doi: 10.1111/PPL.13820
Yamazaki T., Kawamura Y., Minami A., Uemura M. (2008). Calcium-dependent freezing tolerance in Arabidopsis involves membrane resealing via synaptotagmin SYT1. Plant Cell 20, 3389–3404. doi: 10.1105/TPC.108.062679
Zarka D. G., Vogel J. T., Cook D., Thomashow M. F. (2003). Cold induction of Arabidopsis CBF genes involves multiple ICE (inducer of CBF expression) promoter elements and a cold-regulatory circuit that is desensitized by low temperature. Plant Physiol. 133, 910–918. doi: 10.1104/PP.103.027169
Keywords: cold acclimation, calcium signal, temperature change, field, Arabidopsis, CBF/DREB1
Citation: Hiraki H, Matsushima U, Uemura M and Kawamura Y (2023) Cold acclimation is affected by diurnal cycles and minute-scale random temperature fluctuations via calcium signals. Front. Plant Physiol. 1:1304255. doi: 10.3389/fphgy.2023.1304255
Received: 29 September 2023; Accepted: 06 November 2023;
Published: 30 November 2023.
Edited by:
Sandra J. Bucci, Instituto de Biociencias de la Patagonia INBIOP-CONICET-UNPSJB, ArgentinaReviewed by:
Majken Pagter, Aalborg University, DenmarkNadia Soledad Arias, Instituto de Biociencias de la Patagonia INBIOP-CONICET-UNPSJB, Argentina
Copyright © 2023 Hiraki, Matsushima, Uemura and Kawamura. This is an open-access article distributed under the terms of the Creative Commons Attribution License (CC BY). The use, distribution or reproduction in other forums is permitted, provided the original author(s) and the copyright owner(s) are credited and that the original publication in this journal is cited, in accordance with accepted academic practice. No use, distribution or reproduction is permitted which does not comply with these terms.
*Correspondence: Yukio Kawamura, eWthd2FAaXdhdGUtdS5hYy5qcA==