
94% of researchers rate our articles as excellent or good
Learn more about the work of our research integrity team to safeguard the quality of each article we publish.
Find out more
CORRECTION article
Front. Physiol., 17 April 2025
Sec. Metabolic Physiology
Volume 16 - 2025 | https://doi.org/10.3389/fphys.2025.1594299
 Fengyu Han1,2†Feng Hu1,2†Tao Wang2,3Wei Zhou2,3Linjuan Zhu2,3Xiao Huang1,2,3Huihui Bao1,2,3*Xiaoshu Cheng1,2,3*
A Corrigendum on
Association between basal metabolic rate and all-cause mortality in a prospective cohort of southern Chinese adults
by Han F, Hu F, Wang T, Zhou W, Zhu L, Huang X, Bao H and Cheng X (2022). Front. Physiol. 12:790347. doi: 10.3389/fphys.2021.790347
In the published article, there was an error in Table 1–4 and Figure 1 as published. The incorrect unit for BMR was mistakenly used. The correct unit for BMR should be kcal/day, instead of kJ/day. The corrected Table 1–4 and Figure 1 and their captions appear below.
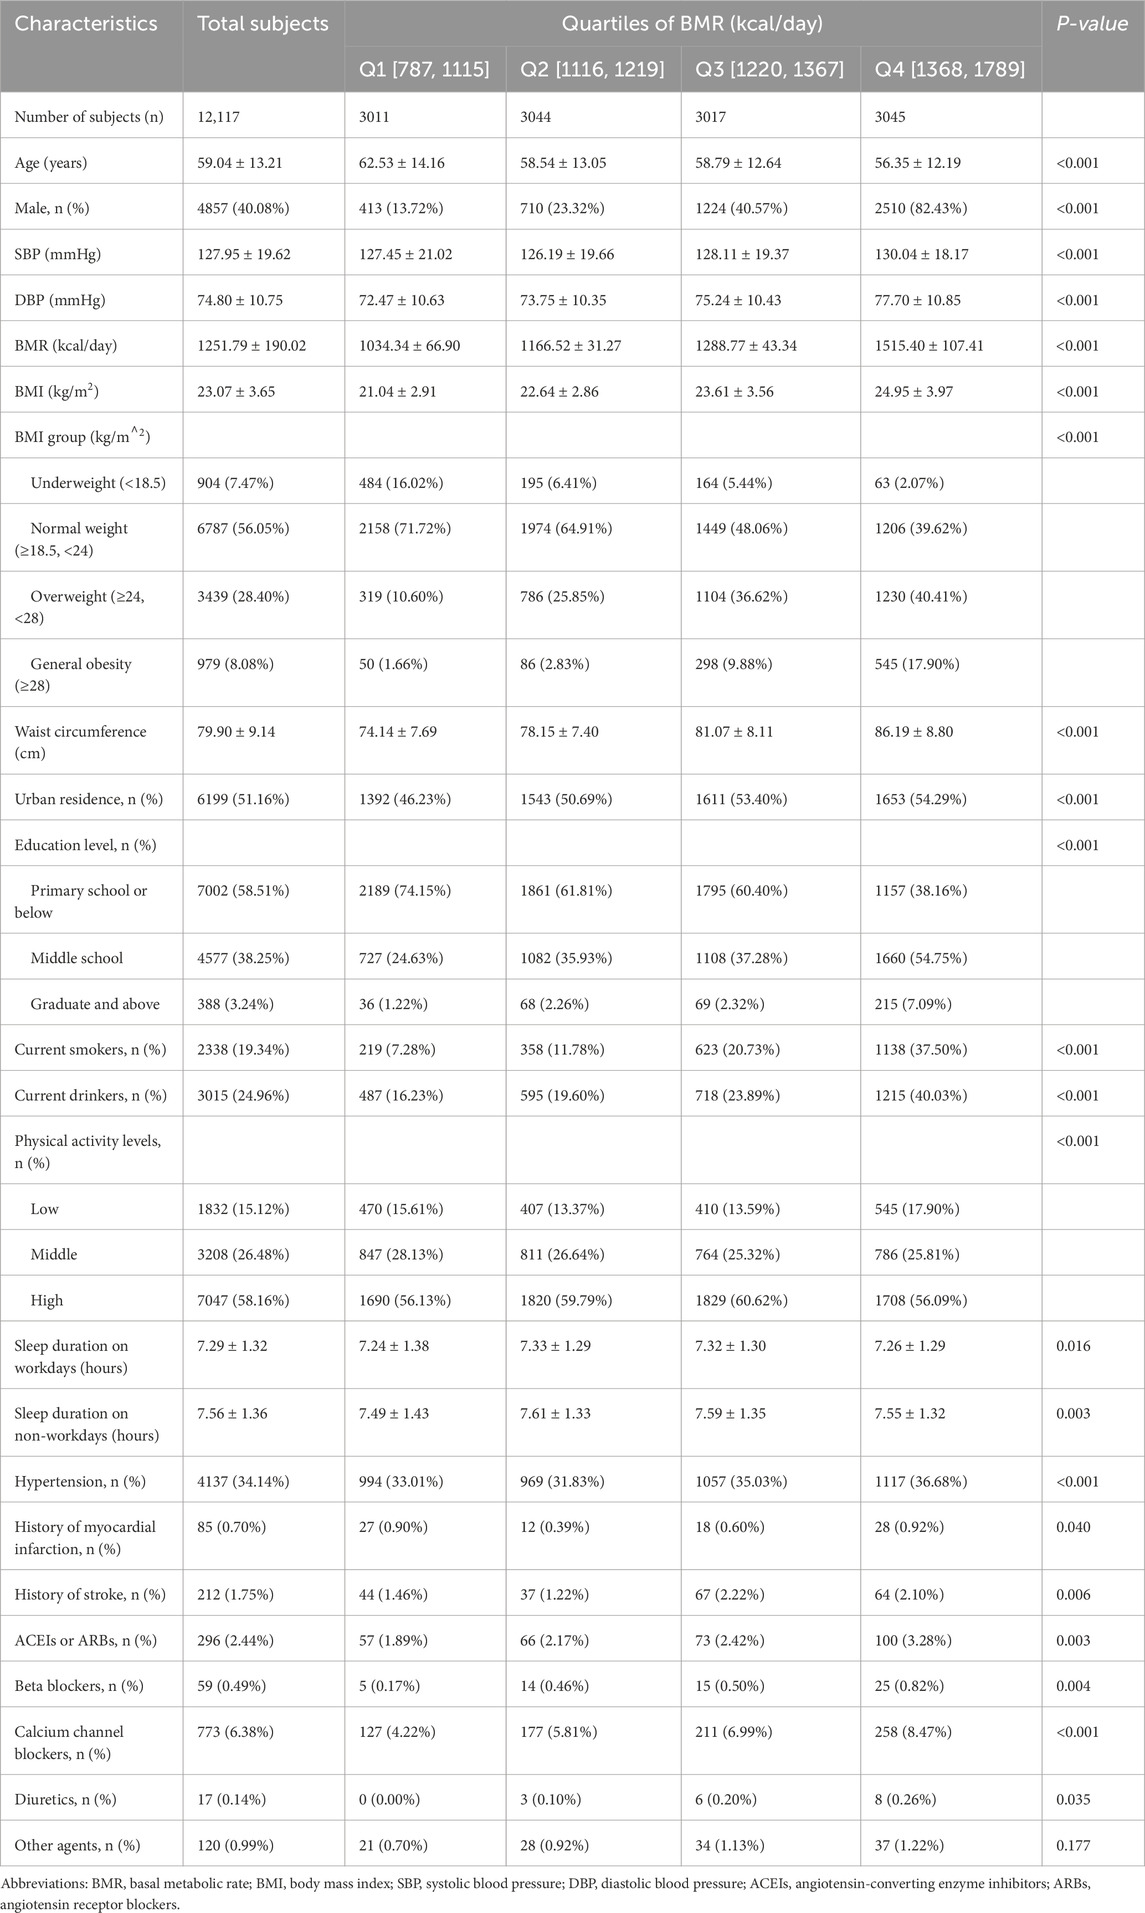
Table 1. Baseline characteristics of the study population according to quartiles of BMR.
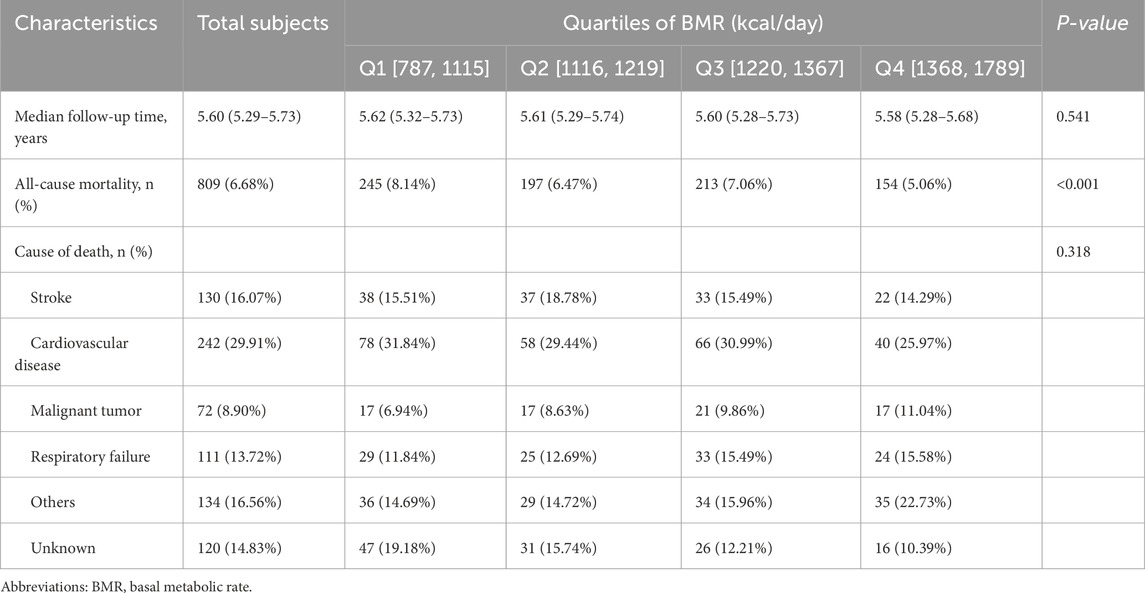
Table 2. All-cause mortality of the study population according to quartiles of BMR.
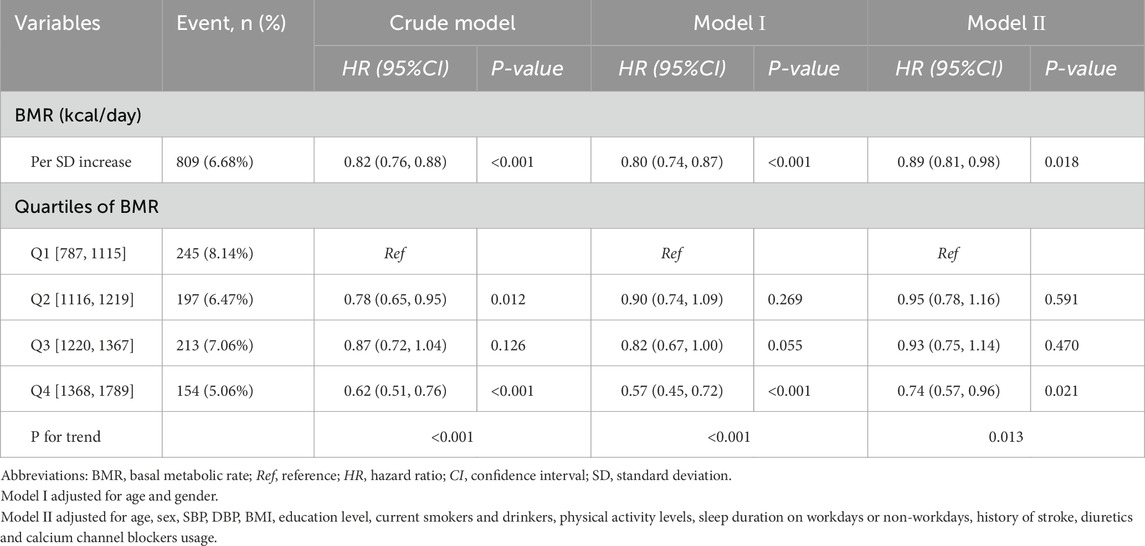
Table 3. Hazard ratios of different BMR categories for all-cause mortality.
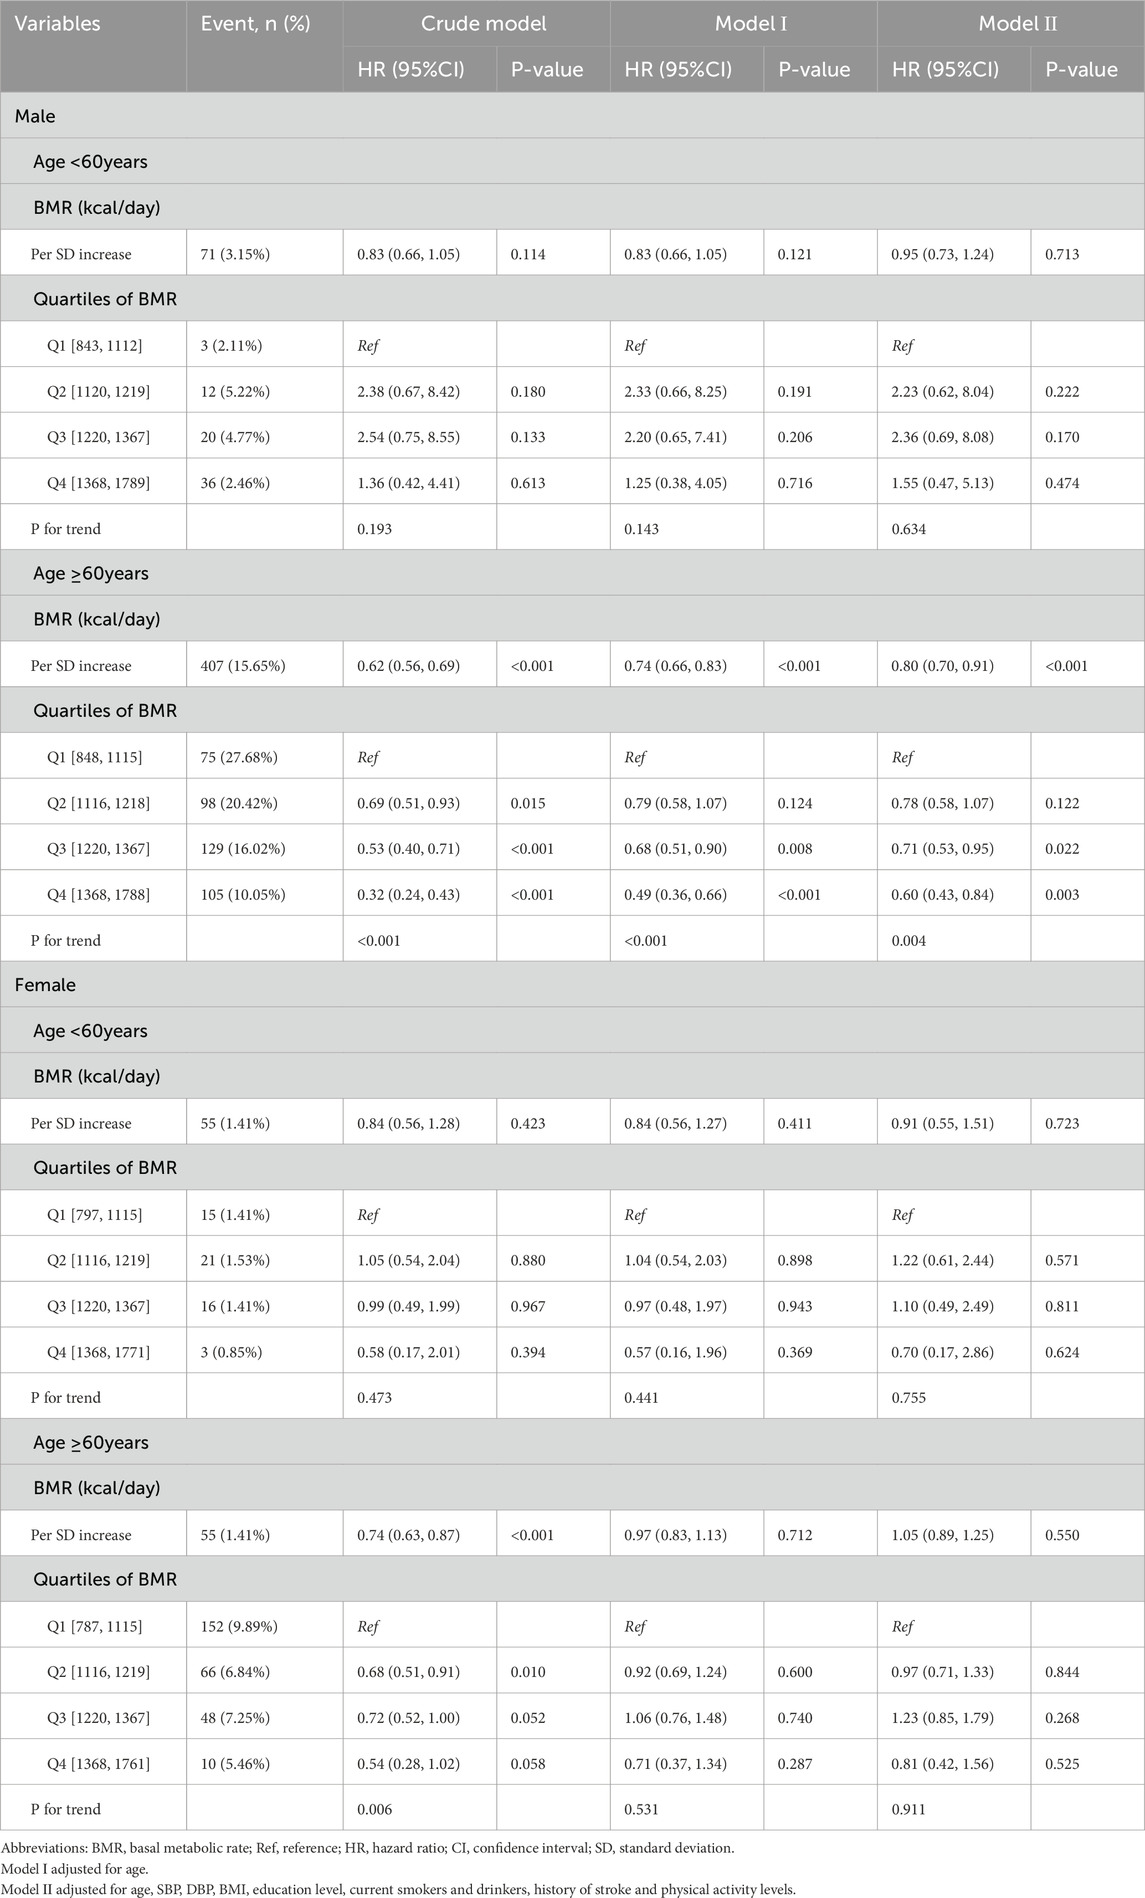
Table 4. Hazard ratios of different BMR categories for all-cause mortality grouped by age and sex.

Figure 1. Smooth curve (A) adjusted for gender, SBP, DBP, BMI, education level, current smokers, physical activity levels and history of stroke. Smooth curve (B) adjusted for age, SBP, DBP, BMI, education level, current smokers and drinkers, history of stroke and physical activity levels.
In the published article, there was an error in Supplementary Figure 2, Supplementary Tables 2, 4, 5. The incorrect unit for BMR was mistakenly used. The correct unit for BMR should be kcal/day, instead of kJ/day. The correct supplementary material has been published with the original article.
In the published article, there was an error. The incorrect unit for BMR was mistakenly used. The correct unit for BMR should be kcal/day, instead of kJ/day.
A correction has been made to Abstract, Result. This sentence previously stated:
“There was a significantly inverse relationship between BMR levels and all-cause mortality in elderly male individuals (adjusted-HR per SD increase: 0.80, 95% CI: 0.70–0.91, P < 0.001). Compared with BMR levels ≤ 1,115 kJ/day, there was lower all-cause mortality in third and highest BMR quartiles in the elderly male subjects (adjusted-HR: 0.71, 95% CI:0.53–0.95, P = 0.022; adjusted-HR: 0.60, 95% CI: 0.43–0.84, P = 0.003, respectively.”
The corrected sentence appears below:
“There was a significantly inverse relationship between BMR levels and all-cause mortality in elderly male individuals (adjusted-HR per SD increase: 0.80, 95% CI: 0.70–0.91, P < 0.001). Compared with BMR levels ≤ 1,115 kcal/day, there was lower all-cause mortality in third and highest BMR quartiles in the elderly male subjects (adjusted-HR: 0.71, 95% CI:0.53–0.95, P = 0.022; adjusted-HR: 0.60, 95% CI: 0.43–0.84, P = 0.003, respectively.”
A correction has been made to Results, Association Between the Basal Metabolic Rate and All-Cause Mortality, Paragraph 1. This sentence previously stated:
“The multivariable analyses indicated that the BMR was inversely associated with all-cause mortality (adjusted-HR per SD increase in confounder model: 0.89, 95% CI: 0.81–0.98, P = 0.018, Table 3). Compared with BMR levels ≤1,115 kJ/day, the highest BMR quartiles had lower all-cause mortality in the confounder model (adjusted-HR: 0.74, 95% CI: 0.57–0.96, P = 0.021; P for trend = 0.013, Table 3).”
The corrected sentence appears below:
“The multivariable analyses indicated that the BMR was inversely associated with all-cause mortality (adjusted-HR per SD increase in confounder model: 0.89, 95% CI: 0.81–0.98, P = 0.018, Table 3). Compared with BMR levels ≤1,115 kcal/day, the highest BMR quartiles had lower all-cause mortality in the confounder model (adjusted-HR: 0.74, 95% CI: 0.57–0.96, P = 0.021; P for trend = 0.013, Table 3).”
A correction has been made to Results, Association Between the Basal Metabolic Rate and All-Cause Mortality, Paragraph 2. This sentence previously stated:
“Compared with BMR levels ≤ 1,115 kJ/day, there was lower all-cause mortality in the third and highest BMR quartiles in elderly male subjects (adjusted-HR: 0.71, 95% CI: 0.53–0.95, P = 0.022; adjusted-HR: 0.60, 95% CI: 0.43–0.84, P = 0.003, respectively).”
The corrected sentence appears below:
“Compared with BMR levels ≤ 1,115 kcal/day, there was lower all-cause mortality in the third and highest BMR quartiles in elderly male subjects (adjusted-HR: 0.71, 95% CI: 0.53–0.95, P = 0.022; adjusted-HR: 0.60, 95% CI: 0.43–0.84, P = 0.003, respectively).”
A correction has been made to Results, Association Between the Basal Metabolic Rate and All-Cause Mortality, Paragraph 2. This sentence previously stated:
“There was an inverse relationship between the BMR and all-cause mortality in elderly male individuals. Compared with BMR levels ≤1,115 kJ/day, there was lower all-cause mortality in the third and highest BMR quartiles in elderly male subjects.”
The corrected sentence appears below:
“There was an inverse relationship between the BMR and all-cause mortality in elderly male individuals. Compared with BMR levels ≤1,115 kcal/day, there was lower all-cause mortality in the third and highest BMR quartiles in elderly male subjects.”
A correction has been made to Results, Association Between the Basal Metabolic Rate and All-Cause Mortality, Paragraph 3. This sentence previously stated:
“The survival analysis showed that compared with BMR levels ≤ 1,115 kJ/day, there was lower all-cause mortality in the highest BMR quartiles in elderly individuals (Kaplan-Meier, log-rank P = 0.141 or P = 0.008 for the highest BMR quartiles relative to the lowest BMR quartiles in the non-elderly or elderly population, respectively; Figure 2).”
The corrected sentence appears below:
“The survival analysis showed that compared with BMR levels ≤ 1,115 kcal/day, there was lower all-cause mortality in the highest BMR quartiles in elderly individuals (Kaplan-Meier, log-rank P = 0.141 or P = 0.008 for the highest BMR quartiles relative to the lowest BMR quartiles in the non-elderly or elderly population, respectively; Figure 2).”
A correction has been made to Results, Association Between the Basal Metabolic Rate and All-Cause Mortality, Paragraph 3. This sentence previously stated:
“Survival analysis found that compared with BMR levels ≤ 1,115 kJ/day, there was lower all-cause mortality in the highest BMR quartiles (Kaplan-Meier, log-rank P < 0.001 or P < 0.001 for the highest BMR quartiles relative to the lowest BMR quartiles in female or male subjects, respectively; Figure 3).”
The corrected sentence appears below:
“Survival analysis found that compared with BMR levels ≤ 1,115 kcal/day, there was lower all-cause mortality in the highest BMR quartiles (Kaplan-Meier, log-rank P < 0.001 or P < 0.001 for the highest BMR quartiles relative to the lowest BMR quartiles in female or male subjects, respectively; Figure 3).”
A correction has been made to Discussion, Paragraph 6. This sentence previously stated:
“The longevity mice not only had elevated BMR but also raised total daily energy expenditures and elevated expenditure on physical activity.”
The corrected sentence appears below:
“The longevous mice not only had elevated BMR but also raised total daily energy expenditures and elevated expenditure on physical activity.”
The authors apologize for these errors and state that this does not change the scientific conclusions of the article in any way. The original article has been updated.
All claims expressed in this article are solely those of the authors and do not necessarily represent those of their affiliated organizations, or those of the publisher, the editors and the reviewers. Any product that may be evaluated in this article, or claim that may be made by its manufacturer, is not guaranteed or endorsed by the publisher.
Keywords: basal metabolic rate, all-cause mortality, Chinese, adults, aging
Citation: Han F, Hu F, Wang T, Zhou W, Zhu L, Huang X, Bao H and Cheng X (2025) Corrigendum: Association between basal metabolic rate and all-cause mortality in a prospective cohort of southern Chinese adults. Front. Physiol. 16:1594299. doi: 10.3389/fphys.2025.1594299
Received: 15 March 2025; Accepted: 25 March 2025;
Published: 17 April 2025.
Edited and reviewed by:
Chun Yang, Nanjing Medical University, ChinaCopyright © 2025 Han, Hu, Wang, Zhou, Zhu, Huang, Bao and Cheng. This is an open-access article distributed under the terms of the Creative Commons Attribution License (CC BY). The use, distribution or reproduction in other forums is permitted, provided the original author(s) and the copyright owner(s) are credited and that the original publication in this journal is cited, in accordance with accepted academic practice. No use, distribution or reproduction is permitted which does not comply with these terms.
*Correspondence: Huihui Bao, aHVpaHVpX2Jhbzc3QDEyNi5jb20=; Xiaoshu Cheng, eGlhb3NodW1lbmZhbjEyNkAxNjMuY29t
†These authors have contributed equally to this work
Disclaimer: All claims expressed in this article are solely those of the authors and do not necessarily represent those of their affiliated organizations, or those of the publisher, the editors and the reviewers. Any product that may be evaluated in this article or claim that may be made by its manufacturer is not guaranteed or endorsed by the publisher.
Research integrity at Frontiers
Learn more about the work of our research integrity team to safeguard the quality of each article we publish.