
95% of researchers rate our articles as excellent or good
Learn more about the work of our research integrity team to safeguard the quality of each article we publish.
Find out more
ORIGINAL RESEARCH article
Front. Physiol. , 31 January 2025
Sec. Gastrointestinal Sciences
Volume 16 - 2025 | https://doi.org/10.3389/fphys.2025.1515437
This article is part of the Research Topic Biological Rhythms in the Brain and Gastrointestinal Tract View all 5 articles
 Ayla Secio-Silva1‡
 Paulo Henrique Evangelista-Silva2‡
 Felipe Emrich1
 Letícia Selvatici-Tolentino1Maíza Ferreira1Ana Bárbara de Paula Silva1Bruno Henrique Gomes1Tatienne Neder Figueira-Costa3
 André Gustavo Oliveira1
 Rodrigo Antonio Peliciari-Garcia4Francemilson Goulart-Silva2
 Paula Bargi-Souza1*†
Hypothyroidism is a common thyroid dysfunction with a higher prevalence in women. Impairments in the regulation of basal metabolism, small intestine nutrient transporter, dyslipidemia, and disruption in circadian clocks have been associated with the thyroid disorder. This study aimed to evaluate whether hypothyroidism affects the small intestine circadian clock and the daily expression pattern of gut nutrient transporters in female mice. Adult female C57BL/6J mice were subjected to hypothyroidism by the administration of methimazole (0.1%) and sodium perchlorate (1%) in drinking water for 45 days. After, the animals were subdivided and euthanized every 4 h over the 24 h period under deep anesthesia. The proximal small intestine segment was collected and immediately frozen for gene expression analysis of circadian core clock components (Bmal1, Per2, Cry1, and Nr1d1) and nutrient transporters by RT-qPCR. The daily protein content of nutrient transporters involved in the absorption of the products of hydrolysis of lipids, proteins, and carbohydrates was evaluated over 24 h in isolated small intestinal epithelium by Western blotting. The expression of clock genes and protein content of nutrients transporters in the jejunum of control female mice exhibited a well-defined circadian rhythmicity, while no rhythmic oscillation over 24 h was observed for the transporter transcripts. Hypothyroidism abolished the circadian rhythmicity of circadian clock, punctually reduced the transcript content of Slc2a5 (GLUT5) at ZT12 and Slc2a2 (GLUT2) at ZT4, and disrupted the circadian oscillation of L-FABP, CD36, PEPT1, and GLUT2 protein contents in the small intestine of female mice. In conclusion, our findings indicate that thyroid hormones modulate the circadian clock of small intestine and the daily rhythmicity of components related to absorptive processes in female mice. Moreover, our data suggest that the mechanisms triggered by thyroid hormones involve posttranscriptional and/or translational modifications of proteins related to lipid, protein, and carbohydrate absorption. Together, these data contribute to the general comprehension of metabolic alterations often observed in hypothyroidism and have far-reaching implications at clinical levels considering the higher worldwide prevalence of hypothyroidism in women and its association with obesity and metabolic syndrome.
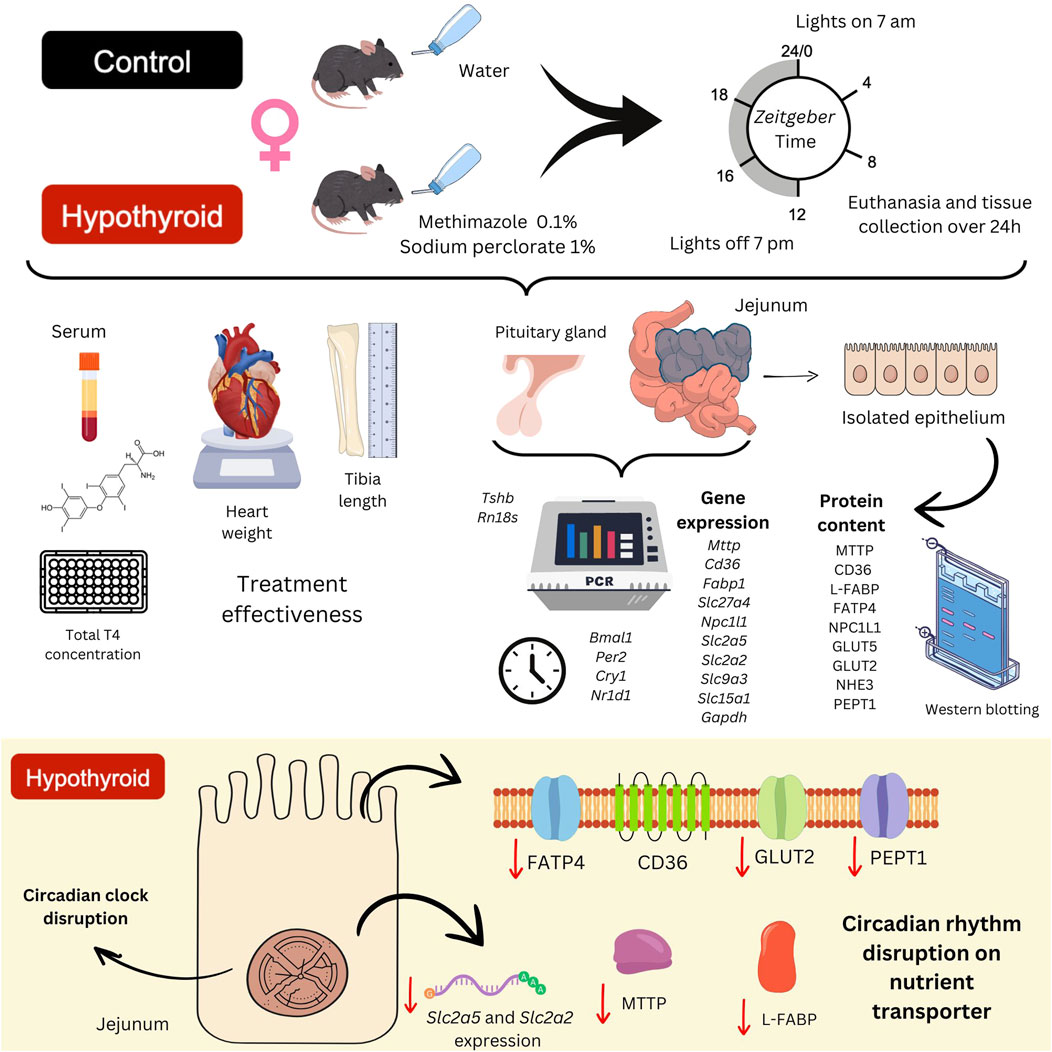
GRAPHICAL ABSTRACT | This study aimed to evaluate whether hypothyroidism affects the small intestine circadian clock and the daily expression pattern of gut nutrient transporters in female mice. C57BL/6J adult female mice were divided into Control and Hypothyroid groups. Hypothyroidism was confirmed by the increased Tshb mRNA content in the pituitary gland, reduced total thyroxin (T4) serum concentration, and decreased heart weight/tibia length ratio in hypothyroid female mice. The animals were euthanized every 4 h over 24 h under deep anesthesia, and the tissues were freshly collected. Gene expression analysis of the jejunum was performed by RT-qPCR, and the protein content of the isolated intestinal epithelium was evaluated by Western blotting. Hypothyroidism disrupted the circadian oscillation of core clock components and the circadian oscillation of L-FABP, CD36, PEPT1, and GLUT2 protein contents in the small intestine of female mice, which might contribute to the metabolic alterations often observed in hypothyroidism.
The modern lifestyle is associated with exposure to artificial light at night and shift work, leading to the desynchronization of biological rhythms in a significant portion of the population worldwide (Ng and Kaur, 2022). The desynchronization is reinforced by the mealtime irregularity once food exerts an important role as a temporal cue in the entrainment of biological rhythms (Hussain and Pan, 2015; Lewis et al., 2020). The disruption of circadian rhythmicity is strongly associated with impairments in the whole body endocrine-metabolic homeostasis and gastrointestinal processes (Voigt et al., 2019). Higher prevalence of irritable bowel syndrome and abdominal pain are among the major complaints related to gastrointestinal disorders by shift workers and transcontinental travellers (Hussain and Pan, 2015; Knutsson and Boggild, 2010; Nojkov et al., 2010; Vener et al., 1989). Moreover, the disruption of daily rhythmic processes involved in the intestinal macronutrient absorption might contribute to the pathogenesis of endocrine-metabolic disorders (Bishehsari et al., 2016).
The most common endocrine-metabolic diseases are diabetes mellitus, metabolic syndrome, and thyroid dysfunctions, showing a positive correlation among them (Khatiwada et al., 2016). Hypothyroidism has a higher prevalence in women, and it is characterized by higher Thyroid Stimulating Hormone (TSH) levels and reduced serum concentrations of thyroid hormones (TH) (Bargi-Souza et al., 2015; Bargi-Souza et al., 2013; Goulart-Silva et al., 2011; Secio-Silva et al., 2022), thyroxine (T4), and triiodothyronine (T3). Moreover, it has been associated with an increased risk of metabolic syndrome development, abdominal obesity, and hypertriglyceridemia in a sex-dependent manner (Iwen et al., 2013; Mehran et al., 2017). Elevated TSH levels, although still within the normal range, are associated with obesity, dyslipidemia, hypertension, inflammation, and metabolic syndrome (Chang et al., 2019). In parallel, individuals with metabolic syndrome exhibit higher free T4 levels and present a positive correlation between insulin resistance and total T3 serum levels (Iwen et al., 2018; Tarcin et al., 2012).
Besides the well-known systemic effects of THs in thermogenesis, energy homeostasis, and metabolism (Iwen et al., 2018; Tarcin et al., 2012; Sentis et al., 2024), THs also affect the intestinal development (Giolito and Plateroti, 2022; Ishizuya-Oka et al., 2009), motility (Xu et al., 2024) and small intestine absorption as described in studies evaluating the jejunum, isolated intestinal epithelium, and enterocytes, as well as in human colon adenocarcinoma cells, known as Caco-2 cells. Briefly, it has been shown that THs increase the villi length (Losacco et al., 2018), modulate the expression of lipid (Losacco et al., 2018; Chu et al., 1995; Shin and Osborne, 2003; Zhu and Cheng, 2010), carbohydrate (Blakemore et al., 1995; Hashimoto et al., 2009; Matosin et al., 1996; Matosin-Matekalo et al., 1999; Mochizuki et al., 2007; Potenza et al., 2009) and protein (Ashida et al., 2002; Ashida et al., 2004; Jumarie and Malo, 1994) transporters by transcriptional and translational mechanisms.
There is a strict correlation between thyroid function and circadian rhythmicity (Ikegami et al., 2019). It has been demonstrated that thyroid axis components exhibit daily rhythmicity (Fliers et al., 2014; Kalsbeek et al., 2005; Kalsbeek et al., 2000; Roelfsema and Veldhuis, 2013). Shift workers have a higher prevalence of hypothyroidism, reaching approximately 30% for women and 20% for men (Oțelea and Călugăreanu, 2018). We have recently demonstrated that thyroid dysfunctions alter the core circadian clock expression in the central clock, located in the suprachiasmatic nuclei (SCN) of the hypothalamus, heart, and pituitary gland (Bargi-Souza et al., 2019; Emrich et al., 2024; Peliciari-Garcia et al., 2018; Peliciari-Garcia et al., 2016). Hypothyroidism also alters the daily pattern of spontaneous locomotor activity, body temperature, and oxygen consumption, showing that THs modulate the rhythmicity of metabolism by mechanisms possibly involving the transcriptional regulation of the core clock component Bmal1 by T3 (Emrich et al., 2024).
Therefore, considering these THs effects in the molecular clockwork machinery and the increased hypothyroidism prevalence in women, this study aimed to evaluate the rhythmicity of the jejunum clockwork machinery (Bmal1, Per2, Cry1, and Nr1d1) and transporters involved in the macronutrient absorption (L-FABP, FATP4, MTTP, CD36, NPC1L1, PEPT1, NHE3, GLUT5, and GLUT2) in female mice under control and hypothyroid conditions, looking for a possible explanation for the increased risk of metabolic syndrome development in hypothyroid women, as observed in population studies.
Seven-week-old female C57BL/6J mice (Mus musculus) were obtained from the Central Animal Facility of the Federal University of Minas Gerais (UFMG). Four to five animals were housed in collective cages (28 cm × 17 cm × 12 cm), with water and food ad libitum. They were kept in a temperature (28°C ± 2°C) controlled room under a 12 h/12 h light-dark cycle (07:00 h/19:00 h, Zeitgeber Time (ZT) 0 = 07:00 h). Luminosity was kept between 200 and 300 lux during the light phase and 0.5–1 lux in the dark phase.
The mice were divided into the Control (C - euthyroid) and Hypothyroid (H) groups. Hypothyroidism was induced by the treatment with methimazole (0.1%) and sodium perchlorate (1%), inhibitors of thyroid hormone synthesis, dissolved in the drinking water for 45 days (Emrich et al., 2024; Barros et al., 2023; Marsili et al., 2010). Body weight was weekly evaluated. After treatment, control and hypothyroid animals were equally divided into six subgroups for the 24 h tissue collection, taking place every 4 h, corresponding to ZTs 0/24, 4, 8, 12, 16, and 20, as previously described (Emrich et al., 2024). Each animal was euthanized by decapitation following the inhalation of the anesthetic isoflurane (3%–5%). All experimental procedures were approved by the Ethics Committee on the Use of Animals (CEUA) of the UFMG (CEUA: 349/2023), according to the legislation of the National Council for Control and Animal Experimentation (CONCEA).
The pituitary gland was collected for assessment of hypothyroidism induction, immediately frozen in liquid nitrogen, and kept at −80°C for further molecular analysis. The serum was obtained from trunk blood, centrifuged at 4000 RPM for 20 min (5804R Centrifuge, Eppendorf, Hamburg, Germany), and stored at −20°C until subsequent analysis. The heart and tibia were collected for the respective weight and length measurements.
The small intestine segment was collected, and the length was measured from the end of the stomach to the beginning of the cecum. The initial 4 cm corresponding to the duodenum were discarded, and the following 10 cm were collected, which corresponds to the proximal portion of jejunum, which was then washed with saline solution (0.9% NaCl). For the gene expression analysis, 30 mg of tissue was collected, washed, and then frozen in liquid nitrogen and kept at −80°C for further molecular analysis.
For the evaluation of the daily protein content, the jejunum fragment was placed into a washing solution (3.2 mM DTT and 3 mM sodium azide diluted in saline) and processed, as previously described (Losacco et al., 2018; Torelli Hijo et al., 2019). Briefly, the intestine mucosa was exposed, cut into ±0.5 cm pieces, and washed with cold saline to remove the luminal contents. Next, the tissue fragments were incubated in washing solution (0.5 mM DTT and 1.5 mM EDTA, dissolved in saline) for 5 min at room temperature and then bathed in phosphate-buffered saline (PBS, pH 7.4) for 20 min at 4°C. The intestine fragments were incubated in an orbital shaker for 60 min at 37°C and 200 RPM (Orbital shaker, Model 420, ThermoFisher Scientific, United States of America) in a PBS1X solution containing 0.5 mM DTT and 1.5 mM EDTA to detachment of the epithelium. At the end, the liquid phase containing the isolated epithelium was filtered with gauze and transferred to a new tube, followed by centrifugation at 2000 RPM (5804R Centrifuge, Eppendorf, Hamburg, Germany) for 10 min at 4°C. Afterwards, the supernatant was discarded, the pellet was diluted in RIPA lysis buffer (150 mM NaCl, 0.5% sodium deoxycholate, 50 mM Tris·HCl, pH 8.0, 0.1% SDS, 0.1% Nonidet P-40, 2 mM Na3VO4, 10 mM NaF, and 0.2 mM phenylmethylsulfonyl fluoride (PMSF)), supplemented with complete Mini, EDTA-free Protease Inhibitor Cocktail (Roche Diagnostics), and the homogenate was stored −80°C until protein quantification.
The expression of clock genes and genes encoding proteins involved in nutrient absorption in the jejunum segment, as well as the Tshb mRNA content in the pituitary gland, were evaluated using Reverse Transcription (RT) followed by Real-Time Polymerase Chain Reaction (PCR) (RT-qPCR). Total RNA was obtained with TRIzol® reagent (Thermo Fisher Scientific, Waltham, Massachusetts, United States) according to the manufacturer’s protocol. The concentration of total RNA was assessed by spectrophotometry using NanoDrop One (Thermo Fisher Scientific). The integrity of total RNA was also verified from 1 µg of total RNA in agarose gel (1%), stained with GelRed (1:100000, Thermo Fisher Scientific). The total RNA was considered intact when 28S and 18S ribosomal RNA bands were observed in the transilluminator with UV light. The Reverse Transcription assay followed the M-MLV Reverse Transcriptase enzyme protocol (Promega®, United States of America) using 1 µg of total RNA of each sample for cDNA synthesis. Real-time PCR was performed using the RT2 SYBR® Green qPCR Mastermix (QIAGEN Sciences, Maryland 20874, United States of America) and carried out by ViiA™ 7 Real-Time PCR System (Applied Biosystems™). The primers used for the PCR assay, efficiency, and slope values are listed in Table 1. The specificity of the reaction was analyzed by the dissociation curve (melting point). Efficiency and slope values were determined using a serial dilution curve (0.001 up to 1) (Dussault and Pouliot, 2006). The expression of each target gene in pituitary gland and jejunum was normalized by Rn18s and Gapdh expression, respectively, according to the 2−ΔCT method (Livak and Schmittgen, 2001; Secio-Silva et al., 2023).
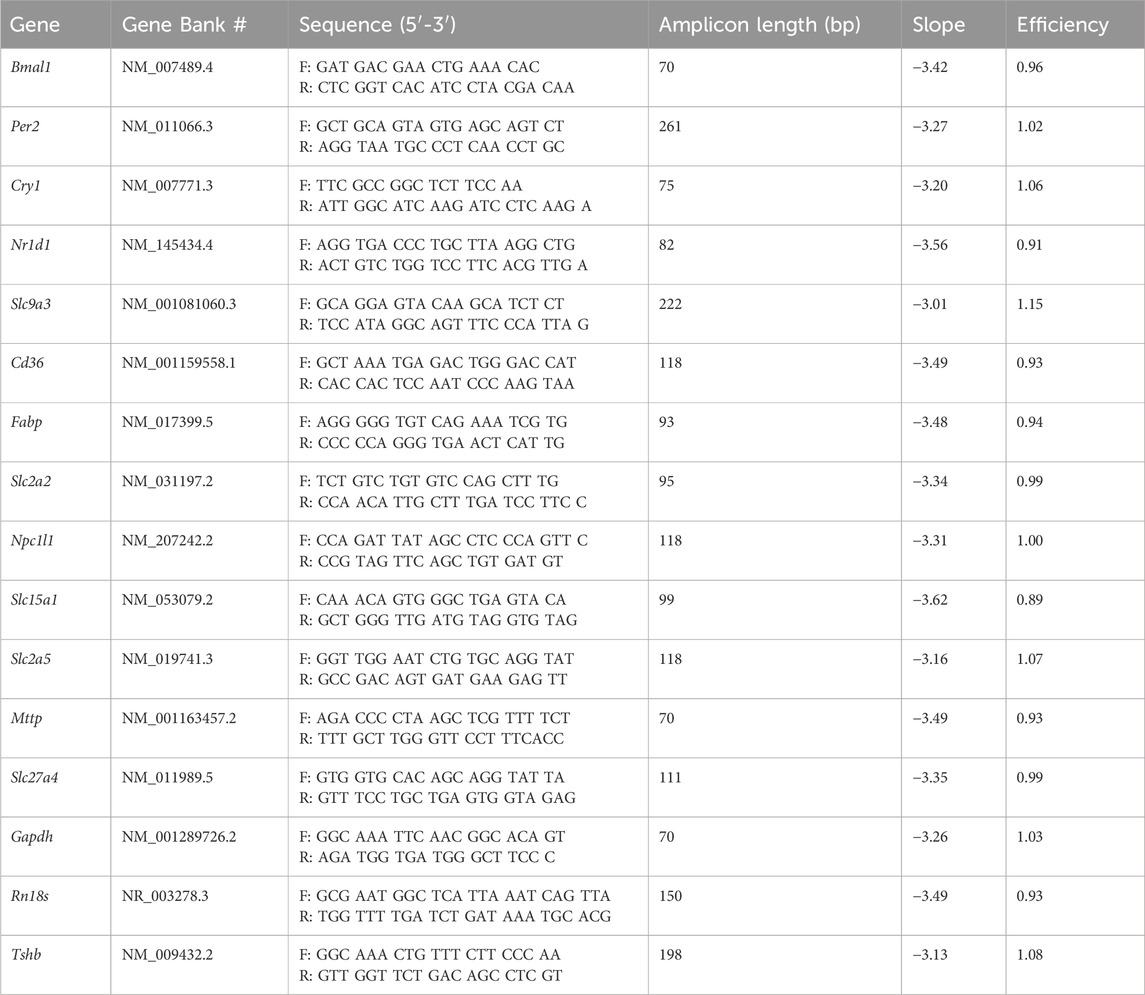
Table 1. Primer sequences used for qPCR and their respective efficiency and slope values.
The jejunum epithelium homogenate was centrifuged at 17,949 g at 4°C for 20 min, and the supernatant was collected. Total protein concentration was estimated by spectrophotometry from the bovine serum albumin curve using the Bradford reagent, as described (Bradford, 1976). The samples were then prepared as 1 μg/μL in Laemmli solution. For the SDS-PAGE electrophoresis, 30 µg of each sample were heated to 37°C for 30 min and then applied to SDS-PAGE and subjected to electrophoresis at 100 V for 1 h. In each gel, one sample of each group and respective ZT was applied. Polyacrylamide gels were made at a concentration of 10% for analysis of NPC1L1, NHE3, GLUT2, GLUT5, CD36, MTTP, PEPT1 proteins, and 12% for FATP4 and L-FABP proteins. These intestinal transporters were selected based on their expression and involvement in the absorption of carbohydrates, proteins, and lipids in the jejunum segment. Proteins were transferred by electrophoresis at 100 V for 100 min to a nitrocellulose membrane (Bio-Rad Laboratories, Inc., United States of America). After transference, the membranes were stained with Ponceau S 0.1% (w/v) in 5% (v/v) acetic acid to check equal loading of gels and further data normalization (Romero-Calvo et al., 2010). The labeling specificity for each protein target was confirmed by comparison with the standard molecular weight of Colorcode Prestained Protein Marker (10–180 kDa) (Sinapse Biotecnologia, Brazil) (Table 2), also used as a reference to cut the membranes according to the protein target. The membranes were washed three times with a solution of PBS 1X and 0.1% Tween 20 (PBST) for 10 min each and then blocked with 5% skimmed milk powder diluted in PBST for 1 h at room temperature.
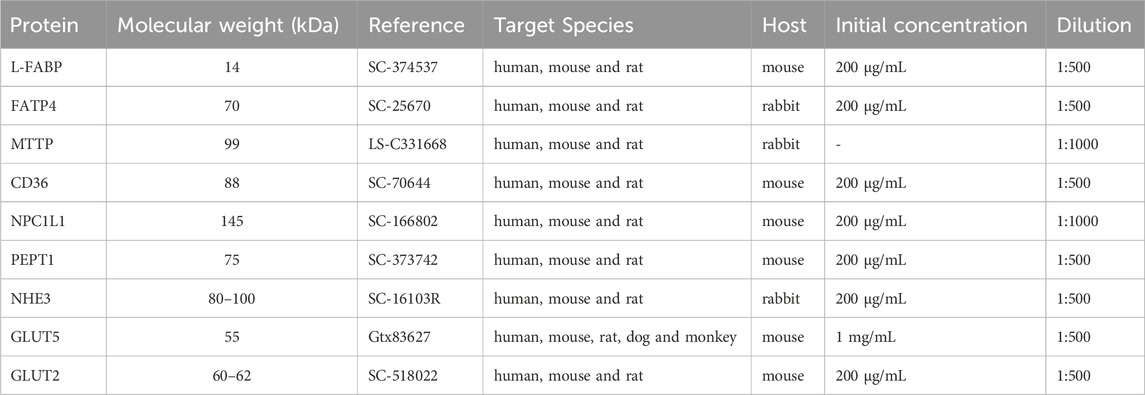
Table 2. Primary antibodies used for Western blotting.
The specific primary antibodies used are listed in Table 2. The primary antibody incubation was carried out overnight under agitation at 4°C–8°C. The membranes were then washed four times with PBST, 10 min each, and subjected to incubation with peroxidase-conjugated secondary antibody (Jackson Immuno research laboratories, Inc., United States of America) diluted 1:5000 in PBST for 75 min at room temperature. After this procedure, the membranes were washed four times with PBST and incubated with 1 mL of the Enhanced Chemiluminescence solution (ECL: 1 M Tris-HCL pH 8.5, 250 mM Luminol, 90 mM p-coumaric acid, and 30% hydrogen peroxide). For the GLUT2 and MTTP analyses, the membranes were stripped with 10 mL of stripping solution (Glycine 15 g/mL and NaCl 11.6 g/mL, pH 2.2) for 30 min under agitation, followed by the addition of 625 µL of 1 N NaOH and incubation for another 30 min. Next, the membranes were washed three times with PBST for 10 min. The stripping protocol was repeated twice. After, the membranes were incubated with blocking solution with 5% skimmed milk for 1 h at room temperature, followed by incubation with GLUT2 or MTTP primary antibodies.
The images from immunoblotting membranes were captured in the GE Amersham Image 600 Luminescence Analyzer (GE) instrument (Amersham Biosciences, Amersham, United Kingdom). The densitometry of blots for each target protein per ZT was obtained with ImageJ version 1.53t (Wayne Rasband and contributors, National Institutes of Health, Bethesda, Maryland). Each sample was normalized by the respective lane densitometry of Ponceau staining. The results were expressed as arbitrary units (AU).
Total T4 serum concentration was assessed by a commercial ELISA kit (Monobind Inc. - EUA, USA Diagnóstica), according to the manufacturer’s protocol. The absorbance at 450 nm was detected by BioTek Epoch Reader Instruments, Inc.
The outliers were detected by ROUT (Q = 1%) analysis, followed by the normality test using the Shapiro-Wilk test and homoscedasticity using Fisher’s and Spearman’s tests. The comparisons of Tshb mRNA content, total T4 serum concentration, and the heart weight/tibia length ratio between Control and Hypothyroid groups were performed using the Mann-Whitney test. Body weight evolution was evaluated by Two-way ANOVA considering the variables treatment (control vs. hypothyroid) and time (weeks), and pairwise comparison was assessed by Bonferroni’s multiple comparison test. The gene expression and protein content data for each group were organized by ZT (0/24, 4, 8, 12, 16, 20). The ZT24 values correspond to the double plotting of the ZT0 results. The oscillation within each experimental group over 24 h was assessed by One-way ANOVA or Kruskal–Wallis tests, according to the criteria of normality and homocedasticity. When One-Way ANOVA or Kurskal-Wallis depicted statistical significance, the time series were subjected to the cosinor fitting of the data with a 24 h periodicity to test whether the depicted oscillation exhibited a circadian pattern (Carvalho-Moreira et al., 2024; Cornelissen, 2014). The rhythmometric parameters (mesor, amplitude, and acrophase) were obtained for the time series that circadian rhythmicity was statistically confirmed. The differences related to the rhythmometric parameters among Control and Hypothyroid groups were compared using the Student’s t-test. Furthermore, Two-way ANOVA was applied considering the variables treatment (control vs. hypothyroid) and time (ZT0/24, 4, 8, 12, 16, and 20), as well as the interaction between these variables. The pairwise comparison was evaluated by Bonferroni’s multiple comparison test. The results were plotted as means ± SEM and considered statistically significant when P < 0.05. Statistical analyses were performed using GraphPad Prism version 9.4.1 for macOS, GraphPad Software, San Diego, California, United States of America, www.graphpad.com.
The effectiveness of hypothyroidism induction was evaluated by the quantification of the thyroid axis components, such as the Tshb transcript in the pituitary and total T4 serum concentration. Considering the effects of thyroid hormone on cardiac mass, the systemic hypothyroid condition was assessed by measuring the heart weight (Hajje et al., 2014), which was normalized by the tibia length, once alterations in body weight are expected under hypothyroidism (Rakov et al., 2017; Yin et al., 1982).
The hypothyroidism was confirmed by the increased pituitary Tshb mRNA content (Figure 1A), reduced total T4 serum concentration (Figure 1B), and heart weight/tibia length ratio (Figure 1D). The body weight of control mice increased over the weeks, while the body weight of the hypothyroid group remained stagnant (Figure 1C).
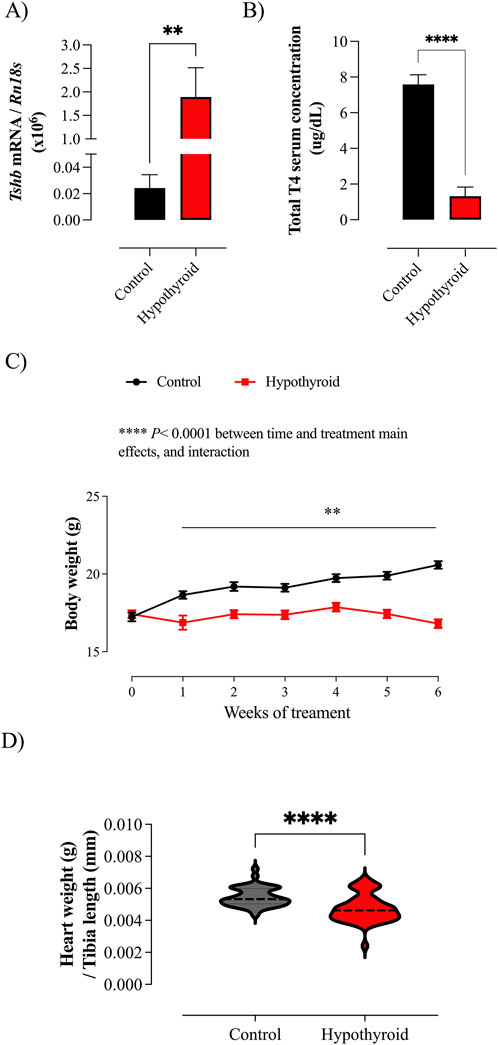
Figure 1. Evaluation of hypothyroidism induction efficacy in female mice and body weight evolution. (A) Expression of the Tshb transcript in the pituitary gland of Control (black) and Hypothyroid (red) mice. The results were multiplied by 106 for better visualization. (B) Total T4 serum concentration in Control and Hypothyroid mice. (C) Body weight evolution over the weeks of treatment in Control and Hypothyroid female mice. (D) Heart weight/tibia length ratio of Control and Hypothyroid animals. Data are presented as means ± SEM (A–C) or median and interquartile range (D). (A, B, D) Unpaired t-test (two-tailed), **P < 0.01, ****P < 0.0001 vs. Control, n = 7–12/group for Tshb mRNA expression and total T4 serum concentration; n = 43–48/group for heart weight/tibia length ratio. (C) Two-way ANOVA considering the variables: treatment (control vs. hypothyroid) and time (weeks of treatment); ****P < 0.0001 for time and treatment main effects (results displayed above the graph). Pairwise comparison was tested by Bonferroni’s multiple comparison test, **P < 0.01 vs. Control group at the respective week of treatment, n = 43–48/group.
The expression of core clock components Bmal1, Per2, Cry1, and Nr1d1 was evaluated in the proximal intestine of female mice under control or hypothyroid conditions (Table 3; Figure 2). A significant time variation over 24 h was observed in the expression of all investigated clock genes in the Control group, while only Cry1 mRNA showed 24 h oscillation in Hypothyroid mice (Table 3, P < 0.05 for Kruskal–Wallis test).
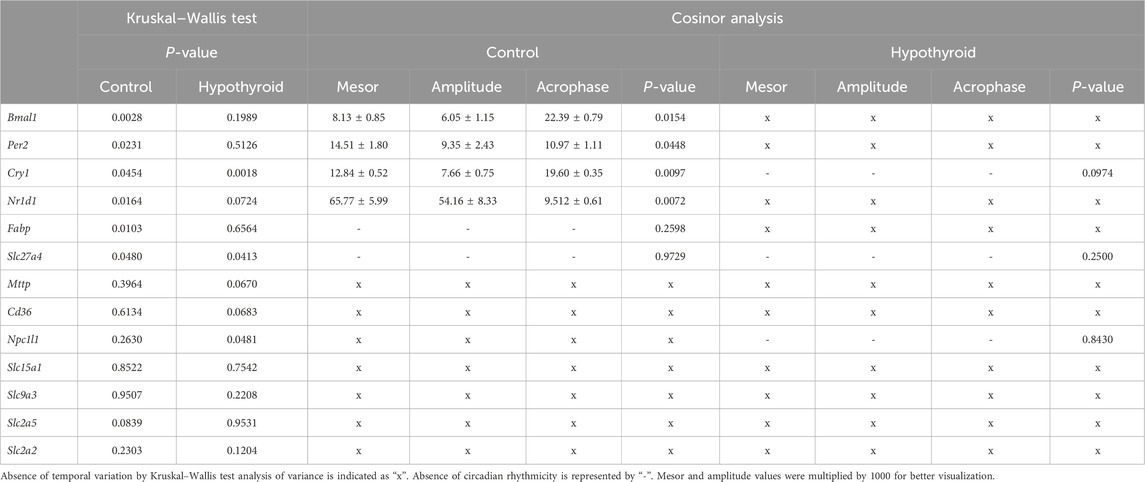
Table 3. Rhythmic analysis of the transcripts’ content in the jejunum of Control and Hypothyroid female mice.
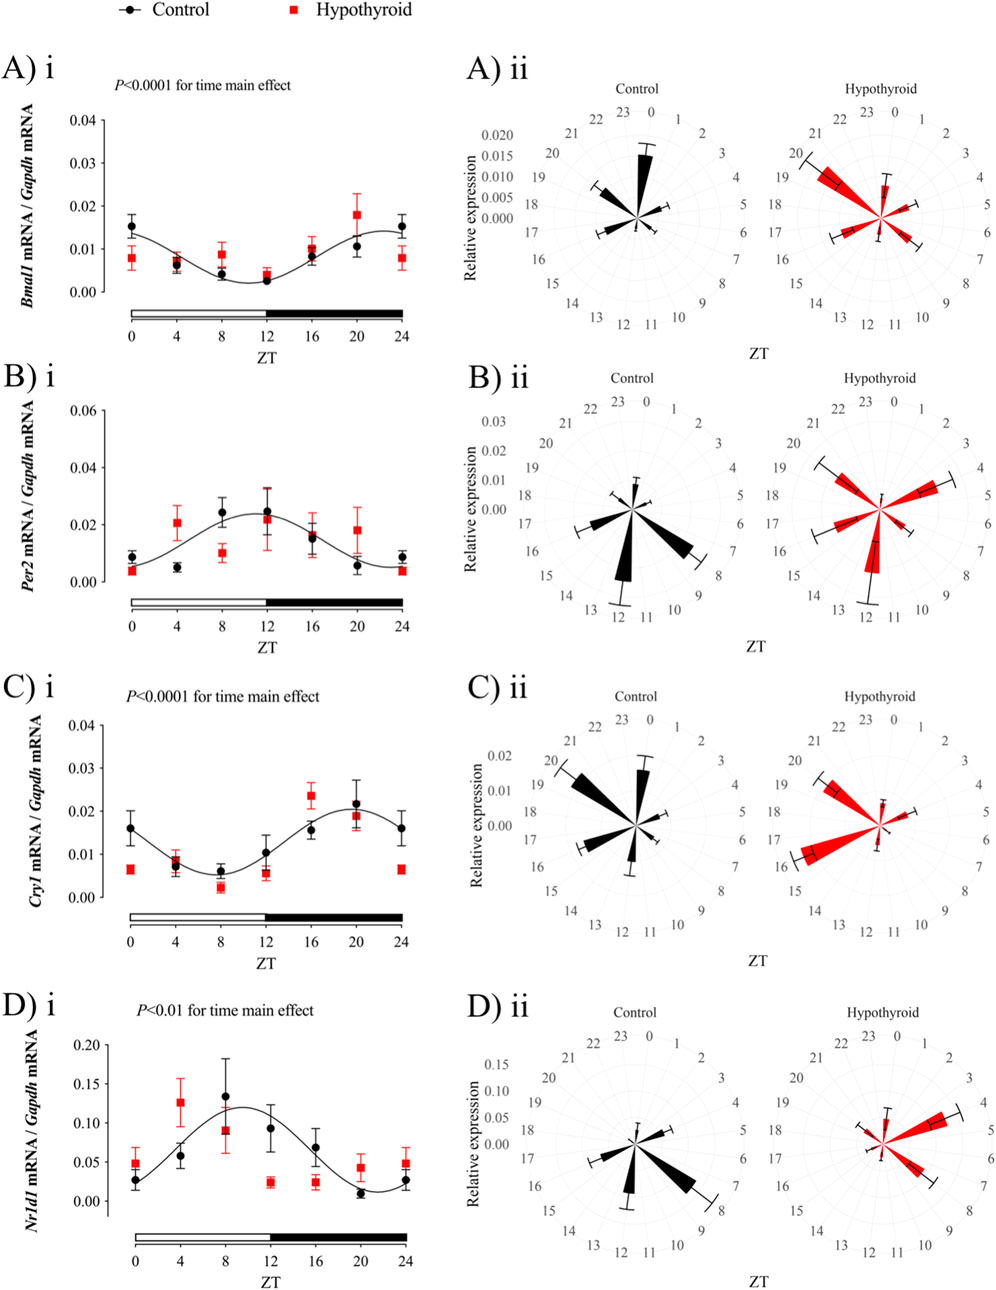
Figure 2. Circadian clock transcript expression in the jejunum of Control (black) and Hypothyroid (red) female mice. Relative gene expression of Bmal1 (Ai-ii), Per2 (Bi-ii), Cry1 (Ci-ii), and Nr1d1 (Di-ii) was normalized by the Gapdh mRNA expression. i and ii) Data are presented as means ± SEM. i) Two-way ANOVA results are described above the graph, and the 24 h cosine curve fitting is represented as black filled lines for the Control group. The absence of a line in the Hypothyroid group indicates no significance for the Kruskal–Wallis test or absence of a 24 h-period of rhythmicity, as described in Table 3. White and black horizontal bars represent the light and dark phases, respectively. ii) Graphical clock representation from the relative expression of each core clock component in the Control and Hypothyroid groups. The ZT24 values correspond to the double plotting of the ZT0 results. Zeitgeber Time (ZT); n = 6–9/group/ZT.
The expression of all investigated core clock components in the proximal intestine of Control female mice exhibited a circadian rhythmicity depicted by the significant P-value for the cosine curve fitting of the data (represented by the solid black line in Figure 2; Table 3). No 24 h rhythmicity was detected in the core clock components from the jejunum of Hypothyroid female mice (Figure 2; Table 3).
The daily expression pattern of genes encoding proteins involved in the absorption and transport of lipids, peptides, carbohydrates, and sodium in the small intestine of control and hypothyroid female mice was investigated (Figure 3; Table 3).
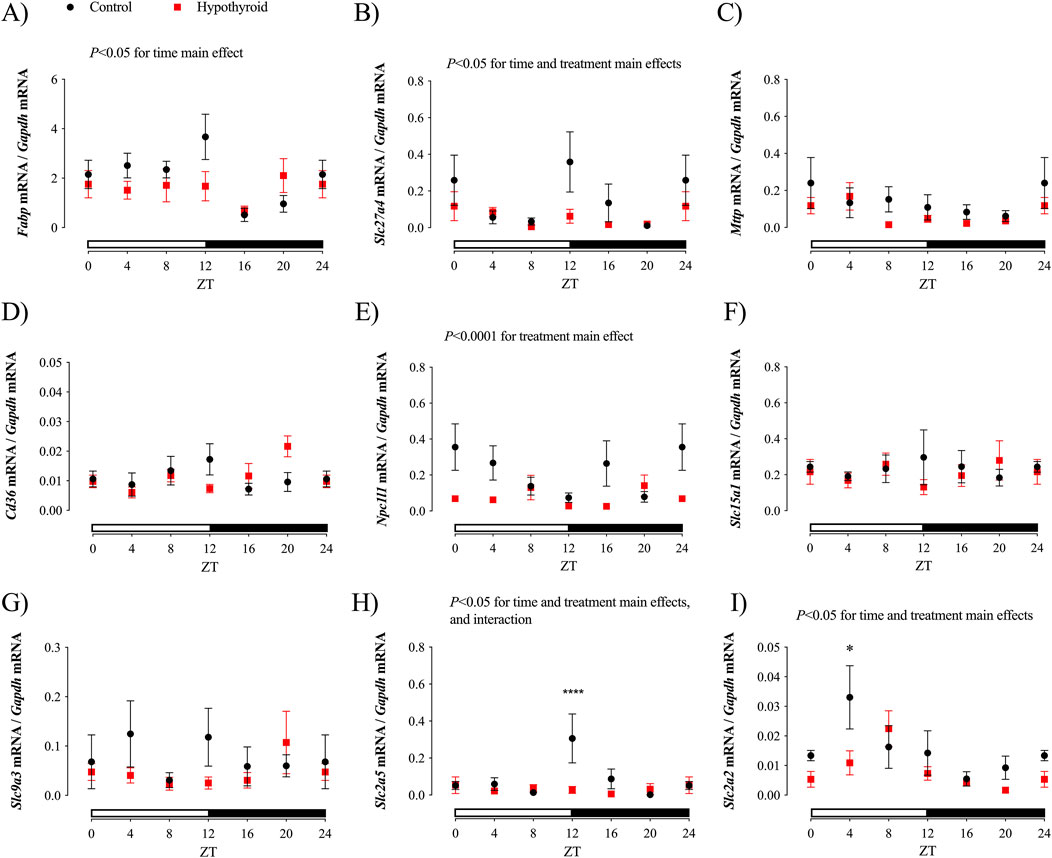
Figure 3. Daily expression of transcripts related to lipid, peptides, sodium, and carbohydrate absorption in the jejunum of Control (black) and Hypothyroid (red) female mice. Daily expression of Fabp (A), Slc27a4 (B), Mttp (C), Cd36 (D), Npc1l1 (E), Slc15a1 (F), Slc9a3 (G), Slc2a5 (H), and Slc2a2 (I). The target gene expression was normalized by the Gapdh mRNA expression. Data are presented as means ± SEM. Two-way ANOVA results are described above the graph. Bonferroni’s multiple comparison test: *P < 0.05 and ****P < 0.0001 vs. respective Control. The absence of a line indicates no significance for the Kruskal–Wallis test or absence of a 24 h-period of rhythmicity, as described in Table 3. White and black horizontal bars represent the light and dark phases, respectively. The ZT24 values correspond to the double plotting of the ZT0 results. Zeitgeber Time (ZT); n = 6–9/group/ZT.
Significant daily oscillations in jejunum were observed for Fabp mRNA content, which encodes FABP, of control female mice; Slc27a4 gene expression, which encodes FATP4 protein, in both control and hypothyroid mice; and Npc1l1 mRNA content (encoding NPC1L1) only in jejunum of hypothyroid mice (Table 3). The transcript content of Fabp, Slc27a4, Slc2a5, and Slc2a2, which encode FABP, FATP4, GLUT5, and GLUT2 proteins, respectively, showed significant time variation in the proximal intestine of female mice (Figures 3A, B, H, I). The effect of treatment (hypothyroidism) was significant for Slc27a4, Npc1l1, Slc2a2 and Slc2a5 (Figures 3B, E, H, I). Moreover, the interaction between time and treatment factors was significant for Slc2a5 (Figure 3H).
No significant alterations were depicted for the content of Mttp, Cd36, Slc15a1, and Slc9a3 transcripts (Figures 3C, D, F, G, respectively), which encode the proteins MTTP, CD36, PEPT1, and NHE3, respectively, according to the Two-way ANOVA. Pair-wise analysis showed punctual differences between control and hypothyroid mice, showing reductions of Slc2a2 mRNA contents at ZT12 and ZT4, respectively (Figures 3H, I).
According to cosinor analysis, none of these investigated transcripts exhibited a circadian oscillatory pattern in both groups (Table 3).
The temporal analysis within each experimental group showed significant daily oscillations for all investigated proteins in the isolated intestinal epithelium of female mice, except for CD36 and PEPT1 in the hypothyroid group and NPC1L1 in both experimental groups (Table 4). The content of all investigated proteins, with the exception of NPC1L1 (Figure 4E), exhibited circadian rhythmicity in the intestinal epithelium of the Control group (Figures 4, 5). The respective mesor, amplitude, and acrophase are described in Table 4.
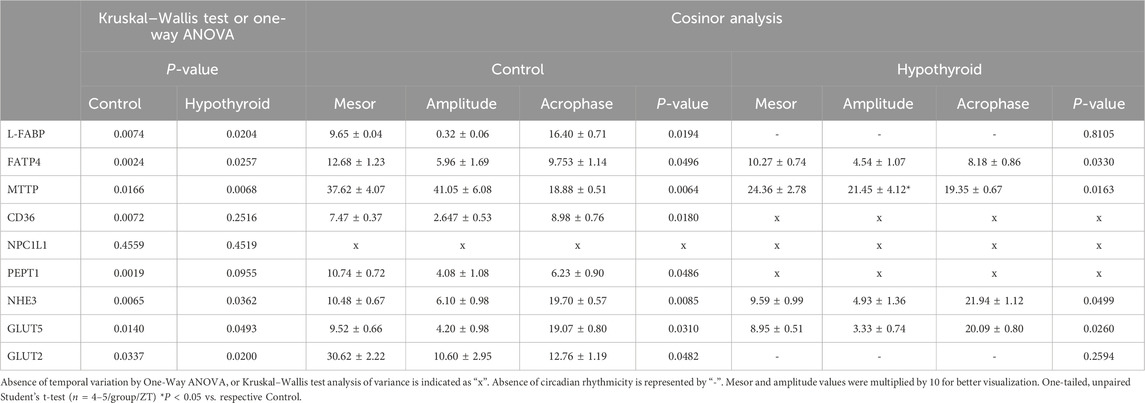
Table 4. Rhythmic analysis of nutrient transport-related proteins investigated in the isolated intestinal epithelium of Control and Hypothyroid female mice.
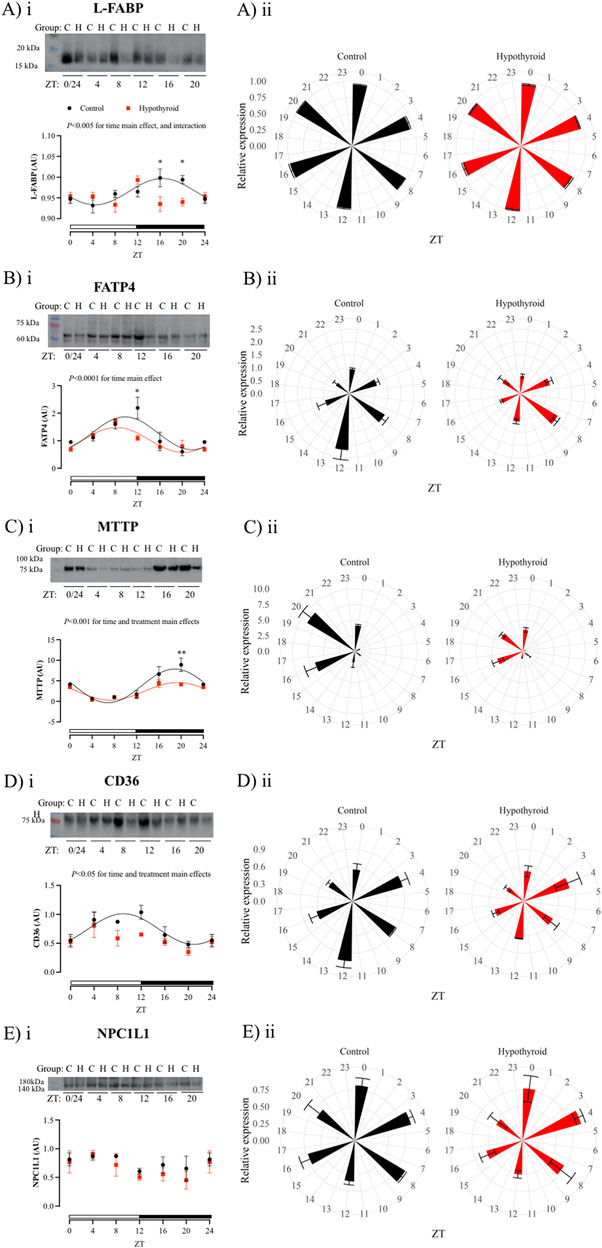
Figure 4. Daily content of proteins related to lipid and cholesterol absorption in the isolated intestinal epithelium of Control (black) and Hypothyroid (red) female mice. Protein content of L-FABP (Ai-ii), FATP4 (Bi-ii), MTTP (Ci-ii), CD36 (Di-ii), and NPC1L1 (Ei-ii), transporters related to the absorption of lipids and cholesterol. i and ii) The data are presented as means ± SEM. i) Representative bands are arranged above the respective graphs, with the molecular weight height indicated alongside. Two-way ANOVA significance is presented above each graph. Bonferroni’s post hoc test *P < 0.05 vs. respective control. The 24 h cosine curve fitting is represented as filled lines for the Control (black) and Hypothyroid (red) groups. The absence of a line indicates no significance for the Kruskal–Wallis test/One Way ANOVA or absence of 24 h-period rhythmicity, as described in Table 4. White and black horizontal bars represent the light and dark phases, respectively. ii) Graphical clock representation from the protein content of transporter in Control and Hypothyroid groups. The ZT24 values correspond to the double plotting of the ZT0 results. Zeitgeber Time (ZT), n = 4–5/group/ZT.

Figure 5. Daily content of proteins related to peptide, sodium, and carbohydrate absorption in the isolated intestinal epithelium of Control (black) and Hypothyroid (red) female mice. Protein content of PEPT1 (Ai-ii) and NHE3 (Bi-ii), transporters related to peptide and sodium intestinal absorption, and GLUT5 (Ci-ii) and GLUT2 (Di-ii) transporters related to the intestinal carbohydrate absorption. i and ii) The data are presented as means ± SEM. i) Representative bands are arranged above the respective graphs, with the molecular weight height indicated alongside. Two-way ANOVA significance is presented above each graph. Bonferroni’s post hoc test *P < 0.05 vs. respective control. The 24 h cosine curve fitting is represented as filled lines for the Control (black) and Hypothyroid (red) groups. The absence of a line in the Hypothyroid group indicates no significance for the Kruskal–Wallis test/One-Way ANOVA or absence of 24 h-period rhythmicity, as described in Table 4. White and black horizontal bars represent the light and dark phases, respectively. ii) Graphical clock representation from the protein content of transporter in Control and Hypothyroid groups. The ZT24 values correspond to the double plotting of the ZT0 results. Zeitgeber Time (ZT), n = 4–5/group/ZT.
Hypothyroidism disrupted the circadian pattern of L-FABP, CD36, PEPT1, and GLUT2 content (Figures 4A, D, 5A, D, respectively; Table 4), and reduced the rhythmic amplitude of MTTP protein (Figure 4Ci; Table 4) in isolated intestinal epithelium of female mice.
The comparison between control and hypothyroid groups showed significance for time main effect in all proteins evaluated (Figures 4, 5), with the exception of NPC1L1. The effects of hypothyroidism (treatment factor) were significant for the content of MTTP, CD36, PEPT1, and GLUT2 proteins (Figures 4C, D, 5A, D), while the interaction between time and treatment was significant only for L-FABP content (Figure 4A). In addition, the hypothyroidism reduced L-FABP content at ZTs 16 and 20 (Figure 4Ai), FATP4 at ZT12 (Figure 4Bi), MTTP at ZT20 (Figure 4Ci), PEPT1 at ZT 8 (while P = 0.09 was depicted at ZT4) (Figure 5Ai), and GLUT2 at ZT16 (Figure 5Di) according to the pairwise comparisons.
The present study shows that the proximal intestine of female mice exhibits a functional circadian clock and that the protein content of most nutrient transporters rhythmically oscillates over the 24 h period (except NPC1L1). Moreover, this study demonstrates that hypothyroidism alters the circadian rhythmicity of the jejunum clock and the majority of proteins involved in the absorption/transport of nutrients in the proximal intestine of female mice.
The proximal intestine is an important player in energy homeostasis given its role in macronutrient absorption. This process exhibits daily rhythmicity which in turn, is under control of the endogenous circadian clock but also driven by food intake (Hussain and Pan, 2015; Sladek et al., 2007). Herein, the circadian pattern of core clock gene expression in the proximal intestine confirms the existence of functional clockwork machinery in the jejunum of female mice. Importantly, this transcript expression analysis was performed in the whole jejunum in order to preserve the strict communication between epithelial, immune, and neural cells in the mucosa and muscle and the intrinsic synchronization of the clock genes, which could be compromised by the tissue dissociation and cell isolation (Becquet et al., 2014; de Lima Cavalcanti et al., 2023).
A clear circadian rhythmicity in the protein content of nutrient transporters in control enterocytes was observed, except for NPC1L1. Interestingly, the protein circadian pattern of jejunum nutrient transporters did not correlate with their respective transcript levels. Several studies demonstrate that circadian regulation can occur in different stages of protein expression, from epigenetic modifications to transcriptional, posttranscriptional, translational, and posttranslational regulations (Green et al., 2016; Kojima et al., 2011). For instance, the daily rhythms of one-fifth of proteins in the liver are not accompanied by transcriptional level alterations (Robles et al., 2014). Therefore, the data from control female mice strongly suggest that part of intestine plasticity related to the absorptive processes over 24 h might involve the regulation of steps beyond gene transcription, such as posttranscriptional and/or translation steps. Further studies might help to characterize the molecular mechanisms involved in the circadian regulation of gut transporters.
The enterocytes of the proximal intestine are targets of TH actions (Losacco et al., 2018; Matosin-Matekalo et al., 1999; Mochizuki et al., 2007; Ashida et al., 2002; Ashida et al., 2004; Jumarie and Malo, 1994). The TH are involved in regulation of circadian clockwork machinery in a sex- and tissue-specific manner (Bargi-Souza et al., 2019; Emrich et al., 2024; Peliciari-Garcia et al., 2018; Peliciari-Garcia et al., 2016; Barros et al., 2023; de Assis et al., 2024). It is well known that the desynchronization of biological rhythms affects several physiological and biochemical processes and is associated with a higher prevalence of obesity and metabolic disorders (Antunes et al., 2010). Herein, we have shown that hypothyroidism disrupts the circadian expression of core clock components in the small intestine of female mice. A recent study demonstrated the specific deletion of Bmal1 in the intestine of mice decreased glucose absorption due to the reduction of SGLT1 protein levels. This effect led to a decline in hepatic glycogen levels and points out the pivotal role of the intestine circadian clock for the systemic metabolic homeostasis (Onuma et al., 2022). Similar correlation could be applied to our data considering the loss of circadian rhythmicity in the expression of core clock components, including Bmal1, in the small intestines of female mice.
As observed in control animals, the daily content of all investigated transcripts related to nutrient absorption did not exhibit a circadian pattern in the hypothyroid small intestine. Next, the daily pattern of proteins involved in nutrient absorption was investigated in the isolated epithelium of female mice. It is worth mentioning that the isolation of this epithelium ensures a refinement in the technique ensuring the analysis of transporters exclusively in intestinal sites involved with nutrient absorption. The hypothyroidism disrupts L-FABP, CD36, PEPT1, and GLUT2 circadian rhythms, reduces the MTTP amplitude, and punctually decreases the FATP4 content at the moment of the light to dark photoperiod transition. In parallel, NPC1L1 content in female enterocytes was not altered by hypothyroidism. Together, these findings indicate a possible impairment in the absorption of all macronutrients under hypothyroid conditions.
MTTP, FATP4, CD36, and L-FABP proteins are involved in the intestinal absorption of lipid hydrolysis products (Hussain, 2014). MTTP is a key protein for chylomicron formation, being essential for the processing and absorption of lipid from a diet, and its deficiency in the intestine is associated with lipid malabsorption (Xie et al., 2006; Yen et al., 2015). CD36 protein is an important transporter for the absorption of long-chain fatty acids and regulation of chylomicron formation (Cifarelli and Abumrad, 2018). Also, L-FABP exerts an important role in the lipid absorption, once it binds to lipid metabolites that cross the apical membrane of the enterocyte, transporting them to the endoplasmic reticulum, where they are used for the TAG synthesis, a prerequisite for the chylomicron biogenesis (Gajda and Storch, 2015). Thus, hypothyroidism seems to impact the daily rhythmicity of transport and processing of products of the triacylglycerol hydrolysis, such as fatty acids.
Previous studies have reported that hypothyroid-induced alterations in whole-body metabolism are accompanied by tissue-specific changes in triglycerides-derived fat acid uptake (Klieverik et al., 2009). Downregulation of low-density lipoprotein (LDL) receptor activity, decreased hepatic uptake of cholesterol from the circulation, reduction of T3-mediated control of sterol regulatory element-binding protein 2 (SREBP-2) - which modulates cholesterol biosynthesis through regulation of 3-hydroxy-3-methylglutaryl-coenzyme A reductase (HMG-COA redutase) activity (Duntas and Brenta, 2018) - reduced hepatic β-oxidation and insulin resistance are also associated with hypothyroidism. Together, these alterations might contribute to the increased risk of dyslipidemias and abnormal accumulation of liver triglycerides (hepatic steatosis) often observed in hypothyroid individuals (Hatziagelaki et al., 2022).
Regarding the content of proteins related to peptide absorption, control female enterocytes exhibited a well-defined circadian oscillatory pattern for the PEPT1 and NHE3 proteins, with acrophase in opposition (antiphase). The circadian oscillatory pattern of PEPT1 content and its activity have been previously reported in the jejunum and duodenum portions of the small intestines of rats (Pan et al., 2002; Qandeel et al., 2009). Hypothyroidism does not affect the NHE3 rhythmicity while it abolishes the PEPT1 circadian oscillation. Our findings suggest that the intestinal absorption of dietary protein could be impaired under hypothyroid conditions, which might contribute to the reduction of protein synthesis and muscle weakness observed in such thyroid dysfunction (Mullur et al., 2014; Salvatore et al., 2014).
Finally, regarding the proteins involved in carbohydrate transportation, both GLUT5 and GLUT2 have shown a circadian oscillatory pattern in the enterocytes of control female mice. The acrophase of GLUT2 in the control group occurred at the beginning of the dark phase (ZT12), which is consistent with the activity pattern of nocturnal mice. Similar daily oscillation in the GLUT2 protein was described in the rat small intestine (Corpe and Burant, 1996). Although the intestinal glucose absorption is mainly regulated by the SGLT1 protein, previous studies have demonstrated that in response to increased glucose concentration after a meal, the GLUT2 is translocated to the apical membrane of enterocytes, contributing to the glucose uptake in the small intestine. Besides, GLUT2 present in the enterocyte basolateral membrane of the enterocyte is crucial for the release of glucose into the bloodstream (Kellett and Brot-Laroche, 2005). Our results show that hypothyroidism impairs the daily expression of GLUT2 in enterocytes and may contribute to the carbohydrate-altered metabolism in this thyroid dysfunction.
It is worth mentioning that changes in the proteins related to the absorption of nutrients in enterocytes could influence the plasticity and morphology of the jejunum, as already described in hypothyroid male mice (Losacco et al., 2018), culminating in the shift of preferred metabolic pathways. Together, these alterations could contribute to body composition and metabolic changes under hypothyroid conditions, as commonly observed in malabsorption diseases such as celiac disease (Medza and Szlagatys-Sidorkiewicz, 2023; Montoro-Huguet et al., 2021). It is important to highlight that the identified phenotype was evaluated solely in females, and no functional assays for jejunum nutrient absorption were conducted. Further functional investigations may contribute to the characterization of the small intestine circadian physiology as well as the implications of the chronodisruption induced by hypothyroidism in the pathogenesis of metabolic syndrome in females.
In conclusion, our findings demonstrate the importance of THs for the proper rhythmic expression of core clock components and proteins related to the absorption and transport of macronutrients as fatty acids, proteins, and carbohydrates, as well as micronutrients as sodium in the jejunum of female mice. Such alterations may contribute to the wide range of metabolic modifications commonly associated with hypothyroidism, explaining, at least in part, the correlation between hypothyroidism, diabetes mellitus, and metabolic syndrome.
The original contributions presented in the study are included in the article/supplementary material, further inquiries can be directed to the corresponding author.
The animal study was approved by the Ethics Committee on the Use of Animals (CEUA) of the UFMG (CEUA: 349/2023). The study was conducted in accordance with the local legislation and institutional requirements.
AS-S: Formal Analysis, Investigation, Methodology, Validation, Writing–original draft. PE-S: Formal Analysis, Investigation, Methodology, Writing–original draft. FE: Formal Analysis, Investigation, Methodology, Validation, Writing–review and editing. LS-T: Formal Analysis, Methodology, Validation, Visualization, Writing–review and editing. MF: Investigation, Methodology, Validation, Writing–original draft. AS: Investigation, Methodology, Validation, Writing–original draft. BG: Investigation, Methodology, Writing–original draft. TF-C: Conceptualization, Writing–original draft. AO: Visualization, Writing–review and editing. RP-G: Formal Analysis, Investigation, Methodology, Writing–review and editing. FG-S: Conceptualization, Formal Analysis, Funding acquisition, Methodology, Resources, Visualization, Writing–review and editing. PB-S: Conceptualization, Formal Analysis, Funding acquisition, Investigation, Methodology, Project administration, Resources, Supervision, Validation, Visualization, Writing–review and editing.
The author(s) declare that financial support was received for the research, authorship, and/or publication of this article. This work was supported by the Brazilian National Council for Scientific and Technological Advancement (CNPq) [PB-S: 403972/2021-3 and 444456/2024-4], Research Foundation of the State of Minas Gerais (FAPEMIG) [PB-S: APQ-00013-22]; FAPESP [FG-S: 2019/05086-7] and Pró-Reitoria de Pesquisa da Universidade Federal de Minas Gerais (PRPq-UFMG). AS-S is the recipient of a Coordination for the Improvement of Higher Education Personnel (CAPES) fellowship, PHE-S is recipient of FAPESP fellowship (#2020/12201-4), LT-S is a recipient of CNPq scholarship, BG, AS and MF are recipients of FAPEMIG scholarship and FE is recipient of FAPEMIG fellowship.
We are grateful to Dr. Pedro Pires Goulart Guimarães and Dr. Robson Santos for granting the PCR equipment necessary for the development of this study and Carolina F. de Barros for the technical assistance and early discussions.
The authors declare that the research was conducted in the absence of any commercial or financial relationships that could be construed as a potential conflict of interest.
The author(s) declare that no Generative AI was used in the creation of this manuscript.
All claims expressed in this article are solely those of the authors and do not necessarily represent those of their affiliated organizations, or those of the publisher, the editors and the reviewers. Any product that may be evaluated in this article, or claim that may be made by its manufacturer, is not guaranteed or endorsed by the publisher.
Antunes L. C., Levandovski R., Dantas G., Caumo W., Hidalgo M. P. (2010). Obesity and shift work: chronobiological aspects. Nutr. Res. Rev. 23, 155–168. doi:10.1017/S0954422410000016
Ashida K., Katsura T., Motohashi H., Saito H., Inui K. (2002). Thyroid hormone regulates the activity and expression of the peptide transporter PEPT1 in Caco-2 cells. Am. J. Physiol. Gastrointest. Liver Physiol. 282, G617–G623. doi:10.1152/ajpgi.00344.2001
Ashida K., Katsura T., Saito H., Inui K. (2004). Decreased activity and expression of intestinal oligopeptide transporter PEPT1 in rats with hyperthyroidism in vivo. Pharm. Res. 21, 969–975. doi:10.1023/b:pham.0000029285.45101.ee
Bargi-Souza P., Peliciari-Garcia R. A., Nunes M. T. (2019). Disruption of the pituitary circadian clock induced by hypothyroidism and hyperthyroidism: consequences on daily pituitary hormone expression profiles. Thyroid 29, 502–512. doi:10.1089/thy.2018.0578
Bargi-Souza P., Romano R. M., Goulart-Silva F., Brunetto E. L., Nunes M. T. (2015). T(3) rapidly regulates several steps of alpha subunit glycoprotein (CGA) synthesis and secretion in the pituitary of male rats: potential repercussions on TSH, FSH and LH secretion. Mol. Cell. Endocrinol. 409, 73–81. doi:10.1016/j.mce.2015.04.002
Bargi-Souza P., Romano R. M., Salgado Rde M., Goulart-Silva F., Brunetto E. L., Zorn T. M., et al. (2013). Triiodothyronine rapidly alters the TSH content and the secretory granules distribution in male rat thyrotrophs by a cytoskeleton rearrangement-independent mechanism. Endocrinology 154, 4908–4918. doi:10.1210/en.2013-1508
Barros C. F., Guarnieri L. O., Mansk L. M. Z., Secio-Silva A., Emrich F., Ferreira M., et al. (2023). The memory impairment by hypothyroidism in mice is dependent on time-of-day and sex. Behav. Brain Res. 452, 114595. doi:10.1016/j.bbr.2023.114595
Becquet D., Boyer B., Rasolonjanahary R., Brue T., Guillen S., Moreno M., et al. (2014). Evidence for an internal and functional circadian clock in rat pituitary cells. Mol. Cell. Endocrinol. 382, 888–898. doi:10.1016/j.mce.2013.11.004
Bishehsari F., Levi F., Turek F. W., Keshavarzian A. (2016). Circadian rhythms in gastrointestinal health and diseases. Gastroenterology 151, e1–e5. doi:10.1053/j.gastro.2016.07.036
Blakemore S. J., Aledo J. C., James J., Campbell F. C., Lucocq J. M., Hundal H. S. (1995). The GLUT5 hexose transporter is also localized to the basolateral membrane of the human jejunum. Biochem. J. 309 (Pt 1), 7–12. doi:10.1042/bj3090007
Bradford M. M. (1976). A rapid and sensitive method for the quantitation of microgram quantities of protein utilizing the principle of protein-dye binding. Anal. Biochem. 72, 248–254. doi:10.1016/0003-2697(76)90527-3
Carvalho-Moreira J. P., de Oliveira Guarnieri L., Passos M. C., Emrich F., Bargi-Souza P., Peliciari-Garcia R. A., et al. (2024). CircadiPy: an open-source toolkit for analyzing chronobiology time series. J. Neurosci. Methods 411, 110245. doi:10.1016/j.jneumeth.2024.110245
Chang Y. C., Hua S. C., Chang C. H., Kao W. Y., Lee H. L., Chuang L. M., et al. (2019). High TSH level within normal range is associated with obesity, dyslipidemia, hypertension, inflammation, hypercoagulability, and the metabolic syndrome: a novel cardiometabolic marker. J. Clin. Med. 8, 817. doi:10.3390/jcm8060817
Chu R., Madison L. D., Lin Y., Kopp P., Rao M. S., Jameson J. L., et al. (1995). Thyroid hormone (T3) inhibits ciprofibrate-induced transcription of genes encoding beta-oxidation enzymes: cross talk between peroxisome proliferator and T3 signaling pathways. Proc. Natl. Acad. Sci. U. S. A. 92, 11593–11597. doi:10.1073/pnas.92.25.11593
Cifarelli V., Abumrad N. A. (2018). Intestinal CD36 and other key proteins of lipid utilization: role in absorption and gut homeostasis. Compr. Physiol. 8, 493–507. doi:10.1002/cphy.c170026
Cornelissen G. (2014). Cosinor-based rhythmometry. Theor. Biol. and Med. Model. 11, 16. doi:10.1186/1742-4682-11-16
Corpe C. P., Burant C. F. (1996). Hexose transporter expression in rat small intestine: effect of diet on diurnal variations. Am. J. Physiol. 271, G211–G216. doi:10.1152/ajpgi.1996.271.1.G211
de Assis L. V. M., Harder L., Lacerda J. T., Parsons R., Kaehler M., Cascorbi I., et al. (2024). Tuning of liver circadian transcriptome rhythms by thyroid hormone state in male mice. Sci. Rep. 14, 640. doi:10.1038/s41598-023-50374-z
de Lima Cavalcanti T. Y. V., Lima M. C., Bargi-Souza P., Franca R. F. O., Peliciari-Garcia R. A. (2023). Zika virus infection alters the circadian clock expression in human neuronal monolayer and neurosphere cultures. Cell Mol. Neurobiol. 44, 10. doi:10.1007/s10571-023-01445-2
Duntas L. H., Brenta G. (2018). A renewed focus on the association between thyroid hormones and lipid metabolism. Front. Endocrinol. (Lausanne) 9, 511. doi:10.3389/fendo.2018.00511
Dussault A. A., Pouliot M. (2006). Rapid and simple comparison of messenger RNA levels using real-time PCR. Biol. Proced. Online 8, 1–10. doi:10.1251/bpo114
Emrich F., Gomes B. H., Selvatici-Tolentino L., Lopes R. A., Secio-Silva A., Carvalho-Moreira J. P., et al. (2024). Hypothyroidism alters the rhythmicity of the central clock, body temperature and metabolism: evidence of Bmal1 transcriptional regulation by T3. J. Physiol. 602, 4865–4887. doi:10.1113/JP286449
Fliers E., Kalsbeek A., Boelen A. (2014). Mechanisms in Endocrinology: beyond the fixed setpoint of the hypothalamus-pituitary-thyroid axis. Eur. J. Endocrinol./Eur. Fed. Endocr. Soc. 171, R197–R208. doi:10.1530/eje-14-0285
Gajda A. M., Storch J. (2015). Enterocyte fatty acid-binding proteins (FABPs): different functions of liver and intestinal FABPs in the intestine. Prostagl. Leukot. Essent. Fat. Acids 93, 9–16. doi:10.1016/j.plefa.2014.10.001
Giolito M. V., Plateroti M. (2022). Thyroid hormone signaling in the intestinal stem cells and their niche. Cell Mol. Life Sci. 79, 476. doi:10.1007/s00018-022-04503-y
Goulart-Silva F., de Souza P. B., Nunes M. T. (2011). T3 rapidly modulates TSHβ mRNA stability and translational rate in the pituitary of hypothyroid rats. Mol. Cell. Endocrinol. 332, 277–282. doi:10.1016/j.mce.2010.11.005
Green C. B. (2016). “Circadian post-transcriptional control of metabolism,” in A time for metabolism and hormones. Editors P. Sassone-Corsi, and Y. Christen (Cham), 41–50. (CH).
Hajje G., Saliba Y., Itani T., Moubarak M., Aftimos G., Fares N. (2014). Hypothyroidism and its rapid correction alter cardiac remodeling. PLoS One 9, e109753. doi:10.1371/journal.pone.0109753
Hashimoto K., Ishida E., Matsumoto S., Okada S., Yamada M., Satoh T., et al. (2009). Carbohydrate response element binding protein gene expression is positively regulated by thyroid hormone. Endocrinology 150, 3417–3424. doi:10.1210/en.2009-0059
Hatziagelaki E., Paschou S. A., Schon M., Psaltopoulou T., Roden M. (2022). NAFLD and thyroid function: pathophysiological and therapeutic considerations. Trends Endocrinol. Metab. 33, 755–768. doi:10.1016/j.tem.2022.08.001
Hussain M. M. (2014). Intestinal lipid absorption and lipoprotein formation. Curr. Opin. Lipidol. 25, 200–206. doi:10.1097/MOL.0000000000000084
Hussain M. M., Pan X. (2015). Circadian regulation of macronutrient absorption. J. Biol. Rhythms 30, 459–469. doi:10.1177/0748730415599081
Ikegami K., Refetoff S., Van Cauter E., Yoshimura T. (2019). Interconnection between circadian clocks and thyroid function. Nat. Rev. Endocrinol. 15, 590–600. doi:10.1038/s41574-019-0237-z
Ishizuya-Oka A., Hasebe T., Buchholz D. R., Kajita M., Fu L., Shi Y. B. (2009). Origin of the adult intestinal stem cells induced by thyroid hormone in Xenopus laevis. FASEB J. 23, 2568–2575. doi:10.1096/fj.08-128124
Iwen K. A., Oelkrug R., Brabant G. (2018). Effects of thyroid hormones on thermogenesis and energy partitioning. J. Mol. Endocrinol. 60, R157–R170. doi:10.1530/jme-17-0319
Iwen K. A., Schroder E., Brabant G. (2013). Thyroid hormones and the metabolic syndrome. Eur. Thyroid. J. 2, 83–92. doi:10.1159/000351249
Jumarie C., Malo C. (1994). Alkaline phosphatase and peptidase activities in Caco-2 cells: differential response to triiodothyronine. Vitro Cell Dev. Biol. Anim. 30A, 753–760. doi:10.1007/BF02631298
Kalsbeek A., Buijs R. M., van Schaik R., Kaptein E., Visser T. J., Doulabi B. Z., et al. (2005). Daily variations in type II iodothyronine deiodinase activity in the rat brain as controlled by the biological clock. Endocrinology 146, 1418–1427. doi:10.1210/en.2004-0763
Kalsbeek A., Fliers E., Franke A. N., Wortel J., Buijs R. M. (2000). Functional connections between the suprachiasmatic nucleus and the thyroid gland as revealed by lesioning and viral tracing techniques in the rat. Endocrinology 141, 3832–3841. doi:10.1210/endo.141.10.7709
Kellett G. L., Brot-Laroche E. (2005). Apical GLUT2: a major pathway of intestinal sugar absorption. Diabetes 54, 3056–3062. doi:10.2337/diabetes.54.10.3056
Khatiwada S., Sah S. K., Kc R., Baral N., Lamsal M. (2016). Thyroid dysfunction in metabolic syndrome patients and its relationship with components of metabolic syndrome. Clin. Diabetes Endocrinol. 2, 3. doi:10.1186/s40842-016-0021-0
Klieverik L. P., Coomans C. P., Endert E., Sauerwein H. P., Havekes L. M., Voshol P. J., et al. (2009). Thyroid hormone effects on whole-body energy homeostasis and tissue-specific fatty acid uptake in vivo. Endocrinology 150, 5639–5648. doi:10.1210/en.2009-0297
Knutsson A., Boggild H. (2010). Gastrointestinal disorders among shift workers. Scand. J. Work Environ. Health 36, 85–95. doi:10.5271/sjweh.2897
Kojima S., Shingle D. L., Green C. B. (2011). Post-transcriptional control of circadian rhythms. J. Cell Sci. 124, 311–320. doi:10.1242/jcs.065771
Lewis P., Oster H., Korf H. W., Foster R. G., Erren T. C. (2020). Food as a circadian time cue - evidence from human studies. Nat. Rev. Endocrinol. 16, 213–223. doi:10.1038/s41574-020-0318-z
Livak K. J., Schmittgen T. D. (2001). Analysis of relative gene expression data using real-time quantitative PCR and the 2(-Delta Delta C(T)) Method. Methods 25, 402–408. doi:10.1006/meth.2001.1262
Losacco M. C., de Almeida C. F. T., Hijo A. H. T., Bargi-Souza P., Gama P., Nunes M. T., et al. (2018). High-fat diet affects gut nutrients transporters in hypo and hyperthyroid mice by PPAR-a independent mechanism. Life Sci. 202, 35–43. doi:10.1016/j.lfs.2018.03.053
Marsili A., Ramadan W., Harney J. W., Mulcahey M., Castroneves L. A., Goemann I. M., et al. (2010). Type 2 iodothyronine deiodinase levels are higher in slow-twitch than fast-twitch mouse skeletal muscle and are increased in hypothyroidism. Endocrinology 151, 5952–5960. doi:10.1210/en.2010-0631
Matosin M., Allison G. G., Ilundain A. A., Shirazi-Beechey S. P., Brot-Laroche E. (1996). GLUT1 to 5 and SGLT1 expression in thyroid-hormone-treated Caco-2 cells. Biochem. Soc. Trans. 24, 238S. doi:10.1042/bst024238s
Matosin-Matekalo M., Mesonero J. E., Laroche T. J., Lacasa M., Brot-Laroche E. (1999). Glucose and thyroid hormone co-regulate the expression of the intestinal fructose transporter GLUT5. Biochem. J. 339 (Pt 2), 233–239. doi:10.1042/0264-6021:3390233
Medza A., Szlagatys-Sidorkiewicz A. (2023). Nutritional status and metabolism in celiac disease: narrative review. J. Clin. Med. 12, 5107. doi:10.3390/jcm12155107
Mehran L., Amouzegar A., Rahimabad P. K., Tohidi M., Tahmasebinejad Z., Azizi F. (2017). Thyroid function and metabolic syndrome: a population-based thyroid study. Horm. Metab. Res. 49, 192–200. [Not Available]. doi:10.1055/s-0042-117279
Mochizuki K., Sakaguchi N., Goda T. (2007). Triiodothyronine (T3) and fructose coordinately enhance expression of the GLUT5 gene in the small intestine of rats during weaning period. Biosci. Biotechnol. Biochem. 71, 1345–1347. doi:10.1271/bbb.70014
Montoro-Huguet M. A., Belloc B., Dominguez-Cajal M. (2021). Small and large intestine (I): malabsorption of nutrients. Nutrients 13, 1254. doi:10.3390/nu13041254
Mullur R., Liu Y. Y., Brent G. A. (2014). Thyroid hormone regulation of metabolism. Physiol. Rev. 94, 355–382. doi:10.1152/physrev.00030.2013
Ng C. M., Kaur S. (2022). Environmental light exposure and mealtime regularity: implications for human health. Chronobiol Int. 39, 1183–1194. doi:10.1080/07420528.2022.2093212
Nojkov B., Rubenstein J. H., Chey W. D., Hoogerwerf W. A. (2010). The impact of rotating shift work on the prevalence of irritable bowel syndrome in nurses. Am. J. Gastroenterol. 105, 842–847. doi:10.1038/ajg.2010.48
Onuma S., Kinoshita S., Shimba S., Ozono K., Michigami T., Kawai M. (2022). The lack of Bmal1, a core clock gene, in the intestine decreases glucose absorption in mice. Endocrinology 163, bqac119. doi:10.1210/endocr/bqac119
Oțelea M. R., Călugăreanu L. (2018). Circadian rhythm deregulation and thyroid dysfunction: results of an observational study on night shift workers. RJOM 69, 49–53. doi:10.2478/rjom-2018-0009
Pan X., Terada T., Irie M., Saito H., Inui K. (2002). Diurnal rhythm of H+-peptide cotransporter in rat small intestine. Am. J. Physiol. Gastrointest. Liver Physiol. 283, G57–G64. doi:10.1152/ajpgi.00545.2001
Peliciari-Garcia R. A., Bargi-Souza P., Young M. E., Nunes M. T. (2018). Repercussions of hypo and hyperthyroidism on the heart circadian clock. Chronobiol Int. 35, 147–159. doi:10.1080/07420528.2017.1388253
Peliciari-Garcia R. A., Previde R. M., Nunes M. T., Young M. E. (2016). Interrelationship between 3,5,3´-triiodothyronine and the circadian clock in the rodent heart. Chronobiol Int. 33, 1444–1454. doi:10.1080/07420528.2016.1229673
Potenza M., Via M. A., Yanagisawa R. T. (2009). Excess thyroid hormone and carbohydrate metabolism. Endocr. Pract. 15, 254–262. doi:10.4158/EP.15.3.254
Qandeel H. G., Duenes J. A., Zheng Y., Sarr M. G. (2009). Diurnal expression and function of peptide transporter 1 (PEPT1). J. Surg. Res. 156, 123–128. doi:10.1016/j.jss.2009.03.052
Rakov H., Engels K., Hones G. S., Brix K., Kohrle J., Moeller L. C., et al. (2017). Sex-specific phenotypes of hyperthyroidism and hypothyroidism in aged mice. Biol. Sex. Differ. 8, 38. doi:10.1186/s13293-017-0159-1
Robles M. S., Cox J., Mann M. (2014). In-vivo quantitative proteomics reveals a key contribution of post-transcriptional mechanisms to the circadian regulation of liver metabolism. PLoS Genet. 10, e1004047. doi:10.1371/journal.pgen.1004047
Roelfsema F., Veldhuis J. D. (2013). Thyrotropin secretion patterns in health and disease. Endocr. Rev. 34, 619–657. doi:10.1210/er.2012-1076
Romero-Calvo I., Ocon B., Martinez-Moya P., Suarez M. D., Zarzuelo A., Martinez-Augustin O., et al. (2010). Reversible Ponceau staining as a loading control alternative to actin in Western blots. Anal. Biochem. 401, 318–320. doi:10.1016/j.ab.2010.02.036
Salvatore D., Simonides W. S., Dentice M., Zavacki A. M., Larsen P. R. (2014). Thyroid hormones and skeletal muscle--new insights and potential implications. Nat. Rev. Endocrinol. 10, 206–214. doi:10.1038/nrendo.2013.238
Secio-Silva A., Emrich F., Evangelista-Silva P. H., Prates R. P., Hijo A. H. T., Figueira-Costa T. N., et al. (2023). Which housekeeping gene is the best choice for RT-qPCR analysis in mice fed with a high-fat diet? Studies in the liver, kidney, pancreas, and intestines. Gene Rep. 31, 101756. doi:10.1016/j.genrep.2023.101756
Secio-Silva A., Figueira-Costa T. N., Emrich F., Abrantes A. F., Peliciari-Garcia R. A., Bargi-Souza P. (2022). Why is there iodine in table salt? Front. For Young Minds 10. doi:10.3389/frym.2022.873610
Sentis S. C., Dore R., Oelkrug R., Kolms B., Iwen K. A., Mittag J. (2024). Hypothalamic thyroid hormone receptor α1 signaling controls body temperature. Thyroid 34, 243–251. doi:10.1089/thy.2023.0513
Shin D. J., Osborne T. F. (2003). Thyroid hormone regulation and cholesterol metabolism are connected through Sterol Regulatory Element-Binding Protein-2 (SREBP-2). J. Biol. Chem. 278, 34114–34118. doi:10.1074/jbc.M305417200
Sladek M., Rybova M., Jindrakova Z., Zemanova Z., Polidarova L., Mrnka L., et al. (2007). Insight into the circadian clock within rat colonic epithelial cells. Gastroenterology 133, 1240–1249. doi:10.1053/j.gastro.2007.05.053
Tarcin O., Abanonu G. B., Yazici D., Tarcin O. (2012). Association of metabolic syndrome parameters with TT3 and FT3/FT4 ratio in obese Turkish population. Metab. Syndr. Relat. Disord. 10, 137–142. doi:10.1089/met.2011.0098
Torelli Hijo A. H., Coutinho C. P., Alba-Loureiro T. C., Moreira Leite J. S., Bargi-Souza P., Goulart-Silva F. (2019). High fat diet modulates the protein content of nutrient transporters in the small intestine of mice: possible involvement of PKA and PKC activity. Heliyon 5, e02611. doi:10.1016/j.heliyon.2019.e02611
Vener K. J., Szabo S., Moore J. G. (1989). The effect of shift work on gastrointestinal (GI) function: a review. Chronobiologia 16, 421–439.
Voigt R. M., Forsyth C. B., Keshavarzian A. (2019). Circadian rhythms: a regulator of gastrointestinal health and dysfunction. Expert Rev. Gastroenterol. Hepatol. 13, 411–424. doi:10.1080/17474124.2019.1595588
Xie Y., Newberry E. P., Young S. G., Robine S., Hamilton R. L., Wong J. S., et al. (2006). Compensatory increase in hepatic lipogenesis in mice with conditional intestine-specific Mttp deficiency. J. Biol. Chem. 281, 4075–4086. doi:10.1074/jbc.M510622200
Xu G. M., Hu M. X., Li S. Y., Ran X., Zhang H., Ding X. F. (2024). Thyroid disorders and gastrointestinal dysmotility: an old association. Front. Physiol. 15, 1389113. doi:10.3389/fphys.2024.1389113
Yen C. E., Nelson D. W., Yen M. I. (2015). Intestinal triacylglycerol synthesis in fat absorption and systemic energy metabolism. J. Lipid Res. 56, 489–501. doi:10.1194/jlr.R052902
Yin F. C., Spurgeon H. A., Rakusan K., Weisfeldt M. L., Lakatta E. G. (1982). Use of tibial length to quantify cardiac hypertrophy: application in the aging rat. Am. J. Physiol. 243, H941–H947. doi:10.1152/ajpheart.1982.243.6.H941
Keywords: thyroid hormones, circadian clock, jejunum, metabolism, female
Citation: Secio-Silva A, Evangelista-Silva PH, Emrich F, Selvatici-Tolentino L, Ferreira M, Silva ABdP, Gomes BH, Figueira-Costa TN, Oliveira AG, Peliciari-Garcia RA, Goulart-Silva F and Bargi-Souza P (2025) Hypothyroidism impairs the circadian rhythmicity of clock genes and proteins involved in gut nutrient absorption in female mice. Front. Physiol. 16:1515437. doi: 10.3389/fphys.2025.1515437
Received: 22 October 2024; Accepted: 13 January 2025;
Published: 31 January 2025.
Edited by:
Leonardo VM de Assis, University of Lübeck, GermanyReviewed by:
Sujata Rao, Cleveland Clinic, United StatesCopyright © 2025 Secio-Silva, Evangelista-Silva, Emrich, Selvatici-Tolentino, Ferreira, Silva, Gomes, Figueira-Costa, Oliveira, Peliciari-Garcia, Goulart-Silva and Bargi-Souza. This is an open-access article distributed under the terms of the Creative Commons Attribution License (CC BY). The use, distribution or reproduction in other forums is permitted, provided the original author(s) and the copyright owner(s) are credited and that the original publication in this journal is cited, in accordance with accepted academic practice. No use, distribution or reproduction is permitted which does not comply with these terms.
*Correspondence: Paula Bargi-Souza, YmFyZ2lzb3V6YXBAdWZtZy5icg==
†ORCID: Paula Bargi-Souza, orcid.org/0000-0001-7746-0636
‡These authors have contributed equally to this work
Disclaimer: All claims expressed in this article are solely those of the authors and do not necessarily represent those of their affiliated organizations, or those of the publisher, the editors and the reviewers. Any product that may be evaluated in this article or claim that may be made by its manufacturer is not guaranteed or endorsed by the publisher.
Research integrity at Frontiers
Learn more about the work of our research integrity team to safeguard the quality of each article we publish.