 Stefan Mendt1†*§
 Georgi Zout1†§
 Marco Rabuffetti2§
 Hanns-Christian Gunga1§
 Aditi Bunker3§
 Sandra Barteit3‡§
 Martina Anna Maggioni1,4‡§
- 1Charité - Universitätsmedizin Berlin, Institute of Physiology, Center for Space Medicine and Extreme Environments Berlin, Berlin, Germany
- 2IRCCS Fondazione Don Carlo Gnocchi, Milano, Italy
- 3Heidelberg Institute of Global Health, Heidelberg University Hospital, Heidelberg University, Heidelberg, Germany
- 4Department of Biomedical Sciences for Health, Università degli Studi di Milano, Milano, Italy
Background: Consumer-grade wearables are becoming increasingly popular in research and in clinical contexts. These technologies hold significant promise for advancing digital medicine, particularly in remote and rural areas in low-income settings like sub-Saharan Africa, where climate change is exacerbating health risks. This study evaluates the data agreement between consumer-grade and research-established devices under standardized conditions.
Methods: Twenty-two participants (11 women, 11 men) performed a structured protocol, consisting of six different activity phases (sitting, standing, and the first four stages of the classic Bruce treadmill test). We collected heart rate, (core) body temperature, step count, and energy expenditure. Each variable was simultaneously tracked by consumer-grade and established research-grade devices to evaluate the validity of the consumer-grade devices. We statistically compared the data agreement using Pearson’s correlation r, Lin’s concordance correlation coefficient (LCCC), Bland-Altman method, and mean absolute percentage error.
Results: A good agreement was found between the wrist-worn Withings Pulse HR (consumer-grade) and the chest-worn Faros Bittium 180 in measuring heart rate while sitting, standing, and slow walking on a treadmill at a speed of 2.7 km/h (r ≥ 0.82, |bias| ≤ 3.1 bpm), but this decreased with increasing speed (r ≤ 0.33, |bias| ≤ 11.7 bpm). The agreement between the Withing device and the research-established device worn on the wrist (GENEActiv) for measuring the number of steps also decreased during the treadmill phases (first stage: r = 0.48, bias = 0.6 steps/min; fourth stage: r = 0.48, bias = 17.3 steps/min). Energy expenditure agreement between the Withings device and the indirect calorimetry method was poor during the treadmill test (|r| ≤ 0.29, |bias | ≥ 1.7 MET). The Tucky thermometer under the armpit (consumer-grade) and the Tcore sensor on the forehead were found to be in poor agreement in measuring (core) body temperature during resting phases (r ≤ 0.53, |bias| ≥ 0.8°C) and deteriorated during the treadmill test.
Conclusion: The Withings device showed adequate performance for heart rate at low activity levels and step count at higher activity levels, but had limited overall accuracy. The Tucky device showed poor agreement with the Tcore in all six different activity phases. The limited accuracy of consumer-grade devices suggests caution in their use for rigorous research, but points to their potential utility in capture general physiological trends in long-term field monitoring or population-health surveillance.
1 Introduction
According to the Intergovernmental Panel on Climate Change, the global average annual temperature is expected to rise by 1.5°C between 2030 and 2052 (compared to pre-industrial levels) due to greenhouse gas emissions and other human activities (Masson-Delmotte et al., 2018). A rise in global temperature causes extreme weather events, which pose an increased risk to nature, the economic, and to human health (Eitelwein et al., 2024). For example, prolonged periods of unusually low rainfall (droughts) threaten food and water security, heatwaves will lead to a significant increase in temperature-related diseases and deaths, wildfires will increase air pollution, and flooding will increase crop damage and the risk of disease. The World Health Organization estimates that climate change will cause around 250,000 additional deaths per year due to malnutrition, malaria, diarrheal diseases, and heat stress alone (World Health Organization, 2023). Climate change also adversely affect the ability to work and reduce labor productivity (Kjellstrom et al., 2009), particularly in low-income regions such as sub-Saharan Africa (SSA), where subsistence agriculture is crucial for the livelihood of small rural communities (Asare-Nuamah, 2021; Ayal, 2021). For example, the simulated effects of climate change on agricultural production in the eastern and coastal regions of Kenya predicts a at least 50% rest/hour work intensity during the planting season and a up to 50% rest/hour work intensity during the maize harvesting period for the years 2050 and 2100 (Yengoh and Ardö, 2020). As smallholder farmers use a lot of human labor, an increase in environmental temperature has a considerable impact on their health. In addition to increased cardiovascular stress and impaired physical and cognitive functions, physical exertion due to labor increases the incidence of heatstroke (Bouchama et al., 2022).
Research on the effects of environmental heat-related stress on health and work ability in low- and middle-income countries primarily relies on data from hospitals, surveys, and of Health and Demographic Surveillance Systems (Diboulo et al., 2012; Egondi et al., 2012; Katiyatiya et al., 2014; Park et al., 2018; Chavaillaz et al., 2019; Frimpong et al., 2020; Barteit et al., 2023; Sapari et al., 2023). The ability to monitor physiological responses to heat stress such as heart rate, body temperature, and physical activity directly in the field using wearable devices would provide invaluable data for managing health risks in smallholder farmers and residents in SSA. Objective monitoring of physical activity has rapidly advanced in recent decades with the development of commercial and research-grade wearables. Compared to research-grade technologies, consumer-grade wearables are often lower in cost, easier to use, less obtrusive and not tied to a specific location (Dunn et al., 2018); however, these advantages often come at the expense of data accuracy.
Despite the growing use of wearables in high-income settings, there is limited research on their application in low-income, climate-vulnerable regions such as SSA (Koch et al., 2022). Recent studies have demonstrated the utility of wearable devices in low-resource settings though concerns remain about the trade-offs between affordability and accuracy (Huhn et al., 2022; Matzke et al., 2024). The present study seeks to fill this gap by comparing the accuracy of consumer-grade wearables under controlled conditions. Previous studies already dealt with comparison of different wearables measuring the same physiological parameter under controlled conditions (Nelson et al., 2016; Gillinov et al., 2017; Wahl et al., 2017; Eisenkraft et al., 2023). In this study, however, we focus on multiple physiological parameters that are relevant for assessing the environmental impact on human health and performance at individual level. For this purpose, a sample of young adults was equipped with a set of wearable devices for monitoring heart rate, body temperature, and physical acitvity (steps, energy expenditure) during rest and activity periods in a laboratory environment.
2 Methods
2.1 Study participants
We recruited young men and women for our study among medical students through advertisements on the internal Charité student’s platform and social media. Those interested were eligible for inclusion if they were between the ages of 18 and 30 and had no history of competitive training. On the other hand, interested were excluded if they had any form of cardiovascular, metabolic, and neurological diseases, or any physical impairments that would prevent participation in an incremental test on a treadmill. Following explanations of the study aim and protocol, including experimental procedures and known risks, participants provided informed written consent prior to commencing study participation. Based on a sample size calculation using the results of a comparative study between commercial trackers and a portable ECG (Godino et al., 2020), the study sample was planned with 20 participants. To ensure conclusive statistical results at the end of the study, we recruited a total of 22 participants (11 women, 11 men). Their anthropometric data were as follows: age, mean 24.0 (SD 2.4) years; body weight, mean 70.2 (SD 7.7) kg; height, mean 176 (SD 9.1) cm; body mass index, mean 22.6 (SD 1.6) kg/m2. The study was approved by the Ethics Committee of Charité–Universitätsmedizin Berlin (Date: 9 April 2021, EA 4/050/21).
2.2 Data acquisition
The research and consumer-grade wearables considered for evaluation in this study were selected from a study protocol designed for the purpose of providing scientific information on their reliability for the use in the setting of population monitoring in SSA (Barteit et al., 2021). Table 1 provides details of the consumer- and research-grade wearables in the present study.
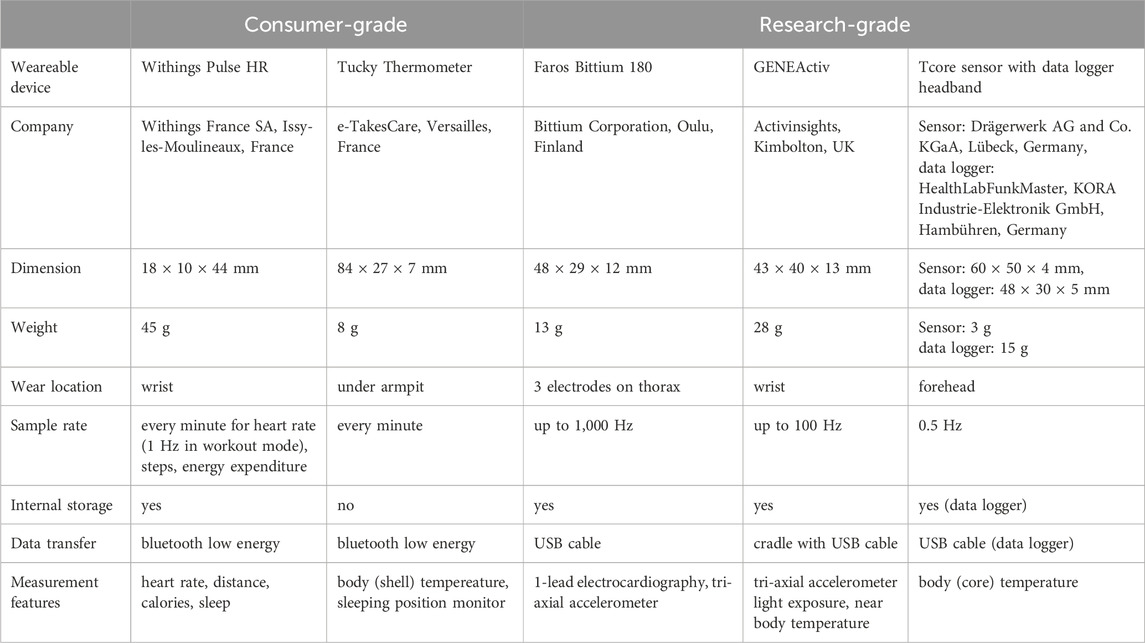
Table 1. Overview of selected consumer-grade and research-grade wearbles.
2.2.1 Consumer-grade wearables
Withings (Withings France SA, Issy-les-Moulineaux, France): We used the Withings Pulse HR device to measure heart rate (HR), steps taken, and calories burned. Data from the internal storage was wirelessly synchronized with a mobile device via the Health Mate application.
Tucky (e-TakesCare, Versailles, France): The Tucky device, a flexible thermometer patch, was used to measure axillary temperature. The recordings were transfered directly via Bluetooth to a mobile device that used the Tucky application.
2.2.2 Research-grade wearables
Faros™ (Bittium Corporation, Oulu, Finland): The Faros Bittium 180 is a gold-standard portable one-lead electrocardiography monitor. It enables long-duration beat-to-beat recordings both inside and outside hospital and healthcare facilities (Laborde et al., 2017; Hartikainen et al., 2019; Bent et al., 2020; Funston et al., 2022; Lang et al., 2022).
Tcore™ (Drägerwerk AG and Co. KGaA, Lübeck, Germany): The Tcore sensor calculates core body temperature (CBT) using a dual-sensor heat flux technology integrated into a soft sensor attached to the forehead (Werner and Gunga, 2020). Accuracy and validty of this technology is given elsewhere (Gunga et al., 2008; Mendt et al., 2017; Soehle et al., 2020; Janke et al., 2021; Engelbart et al., 2023). In this study, the sensor cable was connected to a data logger (HealthLabFunkMaster, KORA Industrie-Elektronik GmbH, Hambühren, Germany) and the data logger was integrated into a custom-made headband.
GENEActiv (Activinsights, Kimbolton, UK): We used the GENEActiv to record raw acceleration data (range ±8 g) along three orthogonal axes (x-, y- and z-axis). Post-processing of the tri-axial accelerometric data enables an objective assessment of physical activities (e.g., energy expenditure, step count) and sleep behavior (Scott et al., 2017; Sanders et al., 2019; Fraysse et al., 2020; Antczak et al., 2021; Jenkins et al., 2022; Hachenberger et al., 2023).
Cortex Metalyzer 3B (CORTEX Biophysik GmbH, Leipzig, Germany): The Cortex Metalyzer 3B is a spiroergometry system designed for measuring oxygen consumption and carbon dioxide production using breath-by-breath gas analysis to calculate energy expenditure (EE) via indirect calorimetry. The device was calibrated once and directly before the study for volume and gas concentrations. For gas calibration, a mixture of 15% oxygen, 5% carbon dioxide, and balance nitrogen was used.
2.3 Study procedure
The measurements were conducted in the laboratories of the Institute of Physiology, Charité–Universitätsmedizin Berlin on weekdays between 9:00 and 14:30 in September 2021. Study participants followed a structured, laboratory-based protocol that included two different resting phases followed by different locomotion phases on a motorized treadmill (Figure 1). In particular, we wanted to simulate intensities typical of the daily routines of subsistence farmers in SSA regions. For example, the metabolic equivalent of task (MET) for the classic Bruce treadmill protocol is estimated to be 4.2 MET for the first stage and 8.3 MET for the third stage according to the FRIEND equation (Kokkinos et al., 2017). MET values of 4.5 and 7.8 correspond to routine chores with small animals and shovel or pitchfork work, respectively (Pickett et al., 2015).
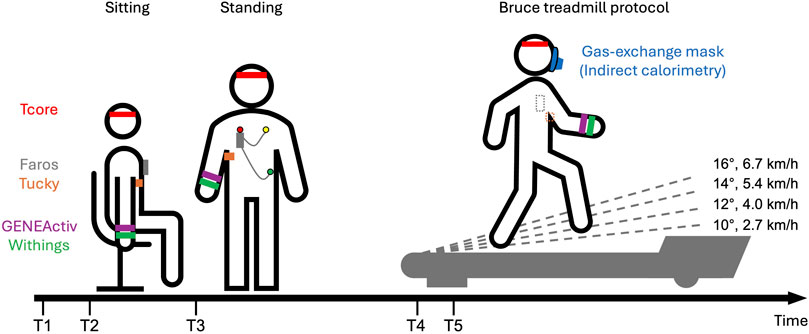
Figure 1. Schematic overview of the experimental protocol: Study participants were first equipped with various devices (T1). After initial setups, study participants sat for 10 min (T2) and then rested for an additioinal 10 min while standing (T3). Participants were fitted with a mask connected to the Cortex Metalyzer and rested for 3 min on the treadmill (T4). Study participants started the classic Bruce protocol (T5). The classic Bruce treadmill test consists of 3-min stages, with speed and slope increasing every 3 min without breaks. Speed and slope are displayed for the first four stages.
Participants were first equipped with various devices. The Tucky device was placed under the right armpit using Tucky double-sided adhesive Adh21. Due to an initial detachment on the first study participant, we have since positioned the device closer to the chest and additionally secured it with medical adhesive tape. The Tcore sensor and headband was fastened on the participants’ forehead. The Faros was positioned on the chest and secured with medical adhesive tape to ensure signal quality. GENEActiv and Withings were placed on the wrist of the non-dominant arm, with GENEActiv positioned directly above Withings.
After these initial setups, participants sat for 10 min and then rested for an additional 10 min while standing. Following this period of rest, measurements continued on a motorized treadmill (h/p/cosmos quasar med 4.0, Nussdorf-Traunstein, Germany). Similar comparative studies also utilized treadmills as test environments (Thiebaud et al., 2018; Thomson et al., 2019). On the treadmill, participants were fitted with a mask over their mouth and nose which was connected to the Cortex Metalyzer, and were also fitted with a harness system to prevent falls on the treadmill. After a 3-min rest on the treadmill, the study participants started the Bruce protocol continuing until complete exhaustion. The classic Bruce treadmill test consists of 3-min stages, with speed and slope increasing every 3 minutes without breaks (Fletcher et al., 2013). The first four stages are as follows: Stage1: 2.7 km/h (1.7 mph), 10%; Stage2: 4.0 km/h (2.5 mph), 12%; Stage3: 5.4 km/h (3.4 mph), 14%; Stage4: 6.7 km/h (4.2 mph), 16%.
Following the treadmill test, the collected data were retrieved and stored on a study computer. Data from Withings and Tucky were downloaded from their respective platforms and spiroergometric data were exported via MetaSoft software, while Tcore, Faros, and GENEActiv data were transferred directly from their internal storage. To ensure synchronization among all considered data logs for later data analysis, timestamps were documented during the experiments. First, the times on the computers associated with the different monitors were recorded at the beginning of each measurement day to account for potential time offsets. This was necessary because GENEActiv, Faros and Tcore were initialized with the study computer, while Withings and Tucky were initialized with the same mobile device, and spiroergometry was conducted using a separate computer. Secondly, the time (on the study computer) at which the rest and activity measurements began was noted.
2.4 Analysis
2.4.1 Data processing
For the data analysis, we considered the period from minute 3 to 8 (6 min) of the 10-min rest phases in sitting (Sit) and standing (Stand) to reduce variability due to excitement or changes in posture. Only the first four stages of the Bruce protocol were analyzed, as all 22 study participants successfully completed these stages. Recordings required processing due to differing units and sampling rate. Faros’ R-R intervals were transformed to HR (using the formula: HR = 60/R-R) and synchronized with the HR measurements taken every second by the Withings wearable. Both HRFaros and HRWithings were then averaged to 1-min intervals. Tucky measures temperature under the armpit (axillary temperature). To obtain an equivalent rectal (core body, CBT) temperature and enable comparison with Tcore temperature (CBTTcore), we added 0.7°C to the recorded Tucky temperature (CBTTucky) as suggested by the Tucky sensor description. CBTTcore, initially recorded at 0.5 Hz, was averaged to 1-min intervals. The step count estimate from Withings (SCWithings) was compared with SCGENEactiv, the result of a step counting function implemented in the R package “GENEAclassify” (Campbell et al., 2023). The input for this function was the vector magnitude, VM = sqrt (x2+y2+z2), which we calculated from the tri-axial acceleration data recorded with the GENEActiv. Since the GENEActiv sampling rate was initially set to 10 Hz to be consistent with in field studies, SCGENEActiv was averaged to 1-min intervals. Energy expenditure during the Bruce test was captured using three different approaches. The first was the indirect calorimetry method, the gold standard for determining energy expenditure by measuring the volume of oxygen consumed and the volume of carbon dioxide produced (Ndahimana and Kim, 2017). Output of indirect calorimetry (EEIC) was the objective measure of the metabolic equivalent of task (MET, 1MET = 3.5 mlO2 kg−1 min−1). The second was with Withings (EEWithings), which however provide data values in kcal per minute. We converted this data into MET using an equation presented in ACSM’s Guideline for Exercise Testing and Prescription (Riebe, 2014). In the third approach, EE was estimated with a prediction formula (EE = 5.01 + 1.000 ENMO) derived from accelerometry data (EEGENEActiv) of free-living adults (White et al., 2016). We calculated the Euclidian norm minus one (ENMO = VM-1) again using the tri-axial acceleration data recorded with the GENEActiv.
2.4.2 Statistical analysis
For the resting (Sit, Stand) and locomotion phases (Stage1, Stage2, Stage3, and Stage4), agreement between two approaches was verified using the following indicators to facilitate comparison with related previous works.
• Pearson correlation: This coefficient r was determined to specify the degree of linear relationship.
• Lin’s concordance correlation coefficient (LCCC): Lin’s CCC includes precision in addition to Pearson’s r (Lin, 1989), providing a more comprehensive measurement of agreement.
• Bland–Altman method (Bland and Altman, 1986): This method provided the mean difference between the methods (bias) and the limits of agreement (LoA, bias±1.96SD of the differences). Lin’s CCC and Bland-Altman analysis were carried out with the R package “SimplyAgree” (Caldwell, 2022).
• Mean absolute percentage error (MAPE): MAPE was calculated according to the formula:
where CGt represented the consumer-grade measurement and RGt represented the research-grade measurement.
The difference between two methods was tested using the t-test or the Wilcoxon signed-rank test, depending on the result of the Shapiro-Wilk test for normality. The level of significance was set at 0.05 (two-sided), and P values were adjusted according to Holm to account for multiple testing. All statistical analyses were carried out using R (version 4.2.0; R Core Team, 2022). Scatterplots and bar charts were created with the R package “ggplot2” (Wickham, 2016).
3 Results
The final dataset for HR, CBT, SC, and EE analysis included 21 participants. To ensure data quality, we excluded HR data of one participant, as 40% of the HRWithing readings during Sit, Stand, and Stage1 were between 43 and 58 bpm, inconsistent with the non-athlete status of our study participants. Additionally, the associated HRFaros readings were almost twice as high each time. For CBT, data from one participant were excluded because the Tucky wearable fell off during treadmill exercise. For SC and EE, one GENEActiv file was corrupted.
Figure 2 displays scatterplots comparing HR, CBT, SC, and EE across all phases. Individual differences between methods are shown in Figure 3. Table 2 provides an overview of HR, CBT, SC, and EE values during rest and locomotion phases, including statistical summaries. Table 3 summarizes the agreements between the methods for all phases.
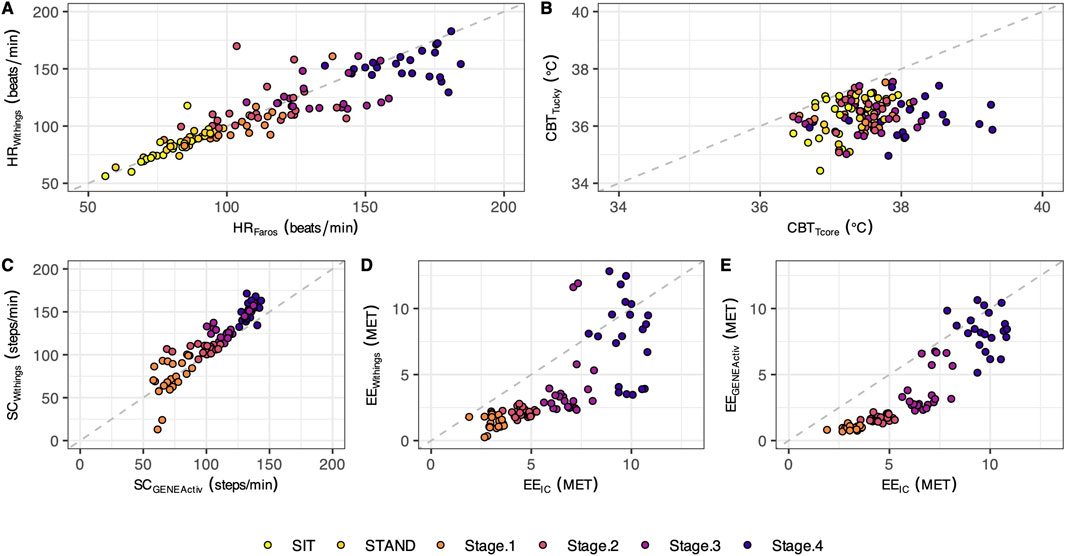
Figure 2. Scatterplots with the identity line. The plotted points represent individual mean values (n = 21) for the different test phases (each phase shown in a different color). The scatterplots illustrate the data for heart rate (A), core body temperature (B), step count (C), and energy expenditure (D, E).
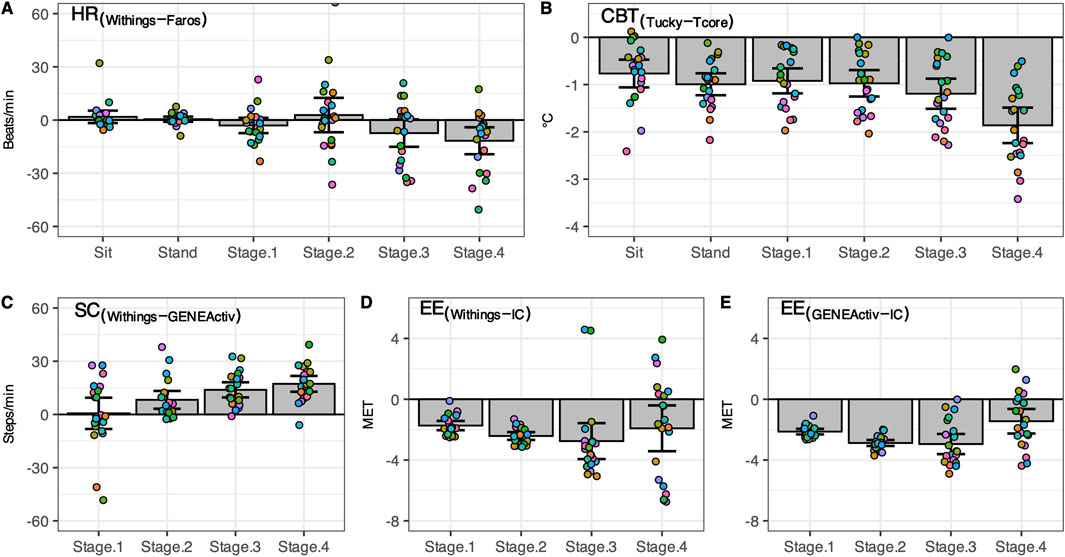
Figure 3. Difference between consumer-level and research-grade monitors. Individual differences (n = 21, circles) as well as mean ± 95% CI are shown for heart rate (A), core body temperature (B), step count (C), and energy expenditure (D, E). Sit, sitting position; Stand, standing position; Stage1 to Stage4, first four stages of the classic Bruce treadmill test; IC, indirect calorimetry.
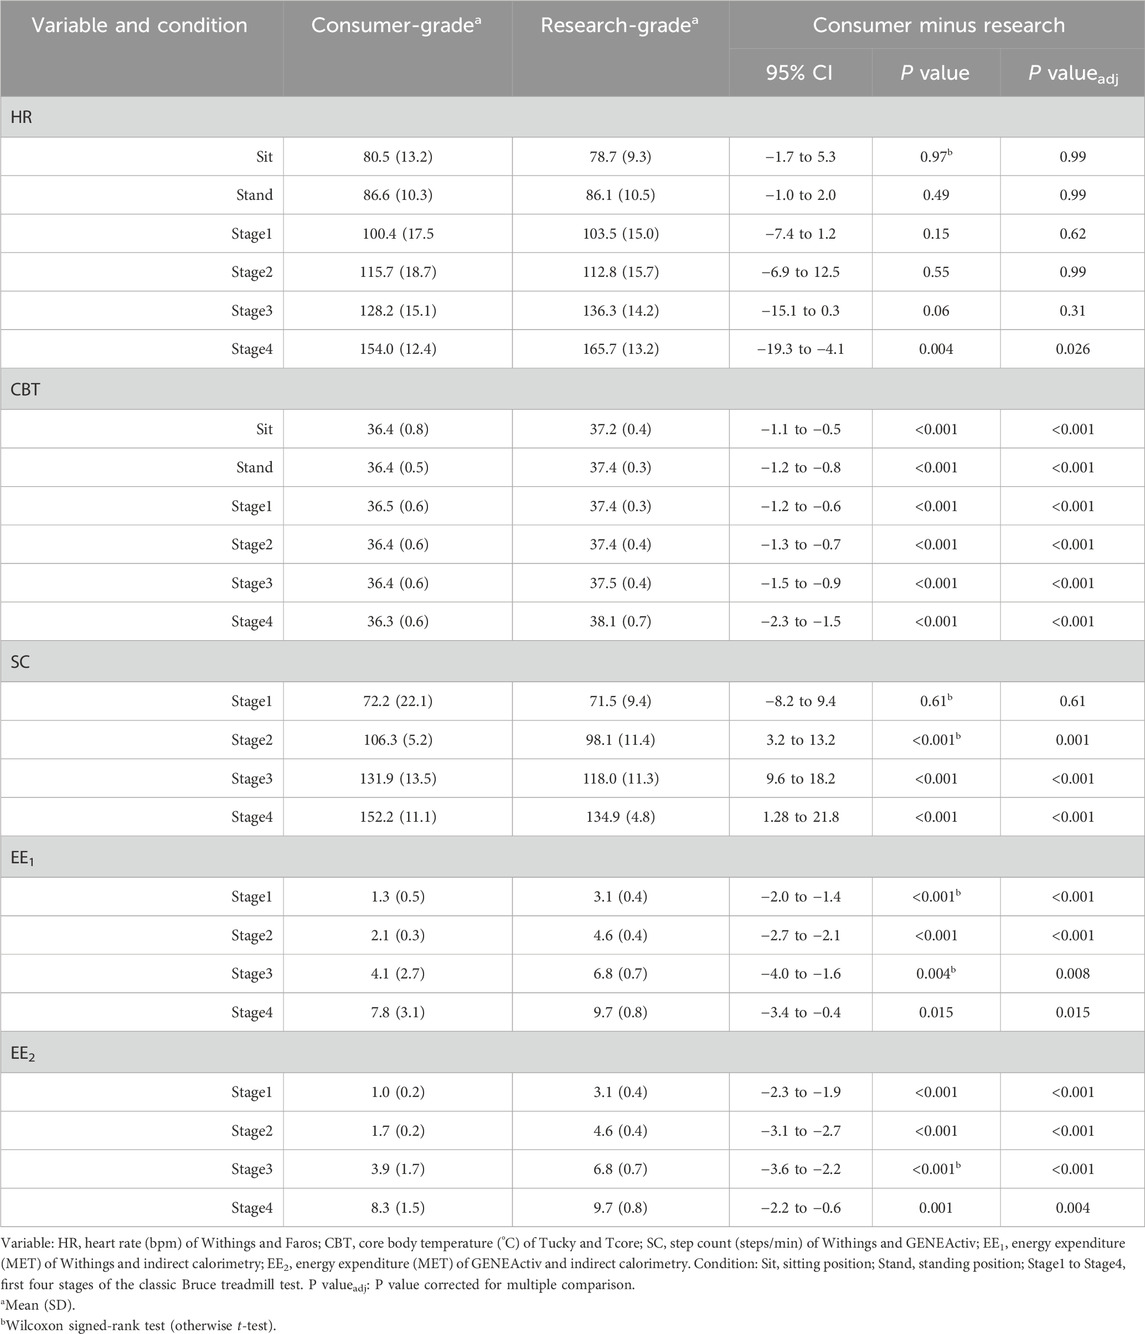
Table 2. Summary of heart rate, core body temperature, step count, and energy expenditure during rest and locomotion phases measured using a consumer-grade and a research-grade method (n = 21).
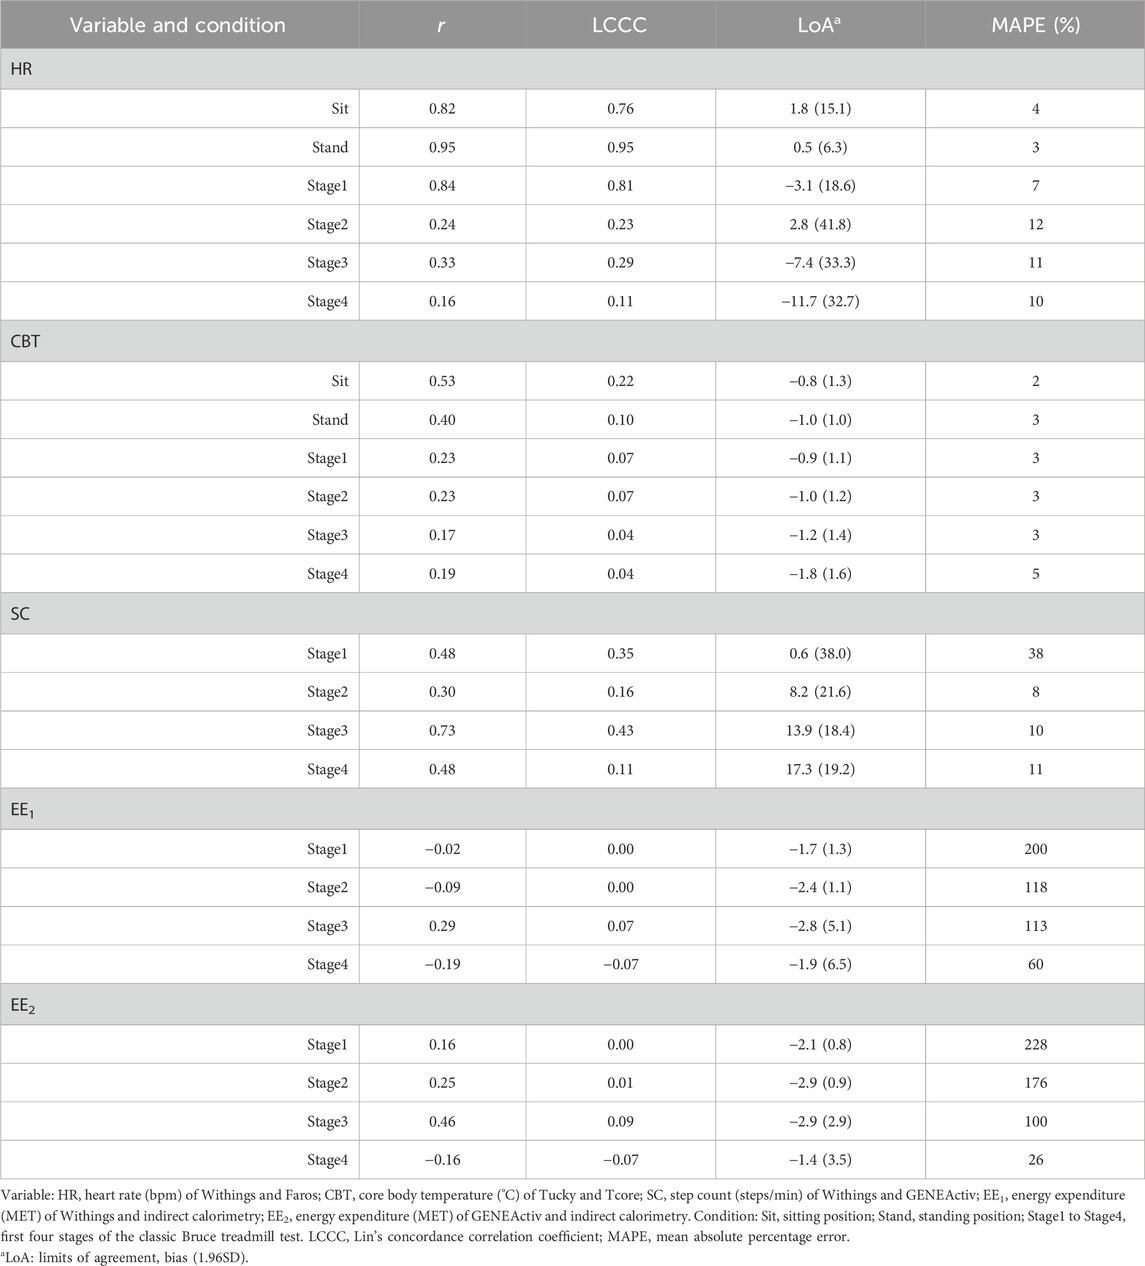
Table 3. Relationship and agreement between the methods for heart rate, core body temperature, step count, and energy expenditure during rest and locomotion phases (n = 21).
3.1 Heart rate
In both resting states, the heart rate was similar for both methods. With increasing physical activity, HRWithings did not increase to the same extent as the HRFaros (Figure 3A). At the 4th stage, the mean difference between the methods was −12 bpm, the largest and statistically significant (Table 2). Correlations were strong and positive for Sit and Stand (r ≥ 0.82, LCCC ≥ 0.76). However, the agreement between HRWithings and HRFaros decreased with increasing physical activity (Table 3). For example, MAPE was more than twice as high from Stage2 (≥10%) as during both resting phases (≤4%).
3.2 Core body temperature
CBTTucky was consistently lower than CBTTcore in all phases (Figure 2B), which was confirmed by statistical analysis (Table 2). The difference between the methods was smallest at rest (Sit, −0.8°C, t20 = −5.44, P < 0.001) and largest in the fourth stage of the Bruce test (−1.8°C, t20 = −10.35, P < 0.001). CBTTucky remained unchanged across different situations (ranged between 36.3°C and 36.5°C), while CBTTcore increased with physical effort (ranging between 37.2°C and 38.1°C). Similar to HR, the correlations between the temperature monitors declined with physical activity. In addition, LoA became wider and the MAPE increased (Table 3).
3.3 Step count
At a treadmill speed of 2.7 km/h (Stage1), step counts were similar between SCWithings and SCGENEActiv (72.2 vs. 71.5 steps/min, z = 0.54, P = 0.61). However, the difference between the methods increased with increasing speed (Figure 3C), while SCWithings increasingly exceeding SCGENEActiv (Table 2). For example, at a treadmill speed of 6.7 km/h (Stage4), SCWithings exceeded SCGENEActiv by about 17 steps/min. (152.2 vs. 134.9 steps/min, t20 = 8.07, P < 0.001). On the other hand, LoA at Stage4 was only half as wide as at Stage1 (Table 3). MAPE was highest in Stage1 (38%), but was only around 10% in the following three stages.
3.4 Energy expenditure
EEIC increased with each subsequent intensity level of the Bruce test (3.1, 4.6, 6.8 and 9.7 MET for Stage1 to Stage4). Reference EEIC was significantly underestimated by both alternative methods, EEWithings and EEGENEActiv, in each of the four treadmill stages (Figures 3D,E). The bias to IC increased for both methods during the first three stages (up to −2.9 MET). At Stage4, the bias was only −1.9 MET (EEWithings) and −1.4 MET (EEGENEActiv), but the LoA was widest at this stage. Although the agreement between EEGENEActiv and EEIC appeared to be better than between EEWithings and EEIC, the agreement between the methods for EE was generally low (Table 3).
4 Discussion
In this study, we measured HR, CBT, SC, and EE during both rest and treadmill phases using reference methods and consumer-grade devices (Withings Pulse HR and Tucky thermometer). We evaluated the accuracy of these parameters against established reference methods (Faros for HR, Tcore for CBT, GENEActiv for SC, and indirect calorimetry for EE). Our results showed that the wrist-worn Withings wearable demonstrated poor agreement or significant differences compared to Faros for HR, indirect calorimetry for EE, and to step-count method using tri-axial acceleration data from GENEActiv. The agreement between Tucky’s rectal equivalent and Tcore’s CBT was low at rest and during the treadmill test with significant temperature differences ranging from −1.8 to −0.8°C.
4.1 Comparison with previous work
In a previous validation study of wearables for HR measurement, a LCCC>0.80 was presented as an acceptable accuracy (Gillinov et al., 2017). Accordingly, our results showed that the Withings device demonstrated acceptable agreement with Faros for low physical activities (Sit: LCCC = 0.76, Stand: LCCC = 0.91, Stage1: LCCC = 0.81). The same applies if MAPE threshold is less than 10% (Boudreaux et al., 2018). In our study, MAPE was ≤4% during both resting states and ranged between 7 and 12% during the treadmill locomotion. However, in another study, the device under test was only considered valid if several criteria were met, e.g., LCCC>0.90 and MAPE<5% (Navalta et al., 2020). Furthermore, agreement in HR with the criterion measure during physical activity seems to be lower than during rest, which is in line with previous findings (Thomson et al., 2019; Bent et al., 2020). Devices that use photoplethysmography to monitor HR tend to be inaccurate at higher intensities of physical activity due to artifacts caused by intense hand movements (Castaneda et al., 2018; Bent et al., 2020; Navalta et al., 2020). In addition to motion artefacts from physical activity, ambient light, misalignment between the skin surface, and poor tissue perfusion can also be a source of error (Alzahrani et al., 2015). Skin tone is apparently not a source of errors (Bent et al., 2020), which is an important observation for studies involving African populations, for example. Interestingly, Stahl et al. (2016) observed a decrease in MAPE at treadmill speeds of >3.2 km/h, attributing this to improved perfusion due to increased intensity. In the present study, a small decline in MAPE was observed at treadmill speeds of >4.0 km/h. Nevertheless, not only the user of wrist-worn HR monitor or the ambient conditions seem to affect measurement accuracy, but also the device itself. Müller et al. (2019) investigated the validity of HR measures of a high-cost consumer-based tracker and a low-cost tracker in a laboratory setting, showing the high-cost tracker had smaller errors and a higher agreement with the criterion measure than the low-cost tracker.
For a step counter to be considered accurate, the MAPE should be less than 1% compared to the criterion measure when walking on a treadmill at a speed of 4.8 km/h (Tudor-Locke et al., 2006). In a recent review of the validation of treadmill step-counting technologies, median MAPE values for wrist-worn monitors ranged from 6.6% to 10.7% at speeds between 3.2 and 6.4 km/h (Moore et al., 2020). In our study, the MAPE ranged from 8% to 38% at speeds between 2.7 and 6.7 km/h (Stage1 to Stage4). In addition, the bias was lowest for Stage1 at 0.6 steps/min and highest for Stage4 at 17.3 steps/min, indicating an increasing overestimation in steps by the Withings Pulse HR with increasing treadmill speed. On the other hand, one could argue that estimating steps using a step counting algorithm with tri-axial acceleration data is not a gold standard. Therefore, we compared the estimates in our study with published hand-counted steps from treadmill experiments of Ducharme et al. (2021) and Tudor-Locke et al. (2019) (Supplementary Table S1). It was shown that both the SCWithings and the SCGENEActiv estimated about 17 steps/min less at speed of 2.7 km/h, which was the largest difference compared to published data. Low accuracy of step counting at slow walking speeds is a common issue with wrist-worn wearables (Moore et al., 2020). At treadmill speeds of 5.4 and 6.7 km/h, differences between hand-count SCWithings were about −12 and −18 steps/min, while differences between hand-count and SCGENEActiv were only about 2 and -1 steps/min. These observations suggest a paradox: bias was best at slow walking speed of 2.7 km/h because both wearables were equally inaccurate. Since the use of raw acceleration data provides a flexibility in processing, selecting a better performing step count function should be considered. For example, Ducharme et al. (2021) recently published a transparent algorithm for step detection, and the open-source Verisense step count algorithm has been optimized (Maylor et al., 2022; Rowlands et al., 2022). While Withings Pulse HR utilizes changes in the acceleration caused by foot impact during walking, the exact algorithm is not disclosed.
The EEWithings showed low overall agreement with EEIC during the treadmill test. The same applies to EEGENEActiv, where acceleration data from GENEActiv was used to estimate EE using a prediction formula for physical activity energy expenditure (White et al., 2016). In both comparisons, the MAPE value was very high at Stage1 (≥200%), but decreased with increasing treadmill locomotion levels and was lowest in Stage4 (Withings: 60%, GENEActiv: 26%). However, Passler et al. (2019) considered a tested device valid if MAPE is less than 10%. The decrease in MAPE with increasing treadmill speed (and grade) indicates better agreement with higher physical workload. In fact, estimated HR by wrist-worn photoplethysmography devices in combination with physiological modeling tended to have lower MAPE for EE estimation during activities above the aerobic threshold (Parak et al., 2017). Moreover, in the present study both wrist-worn devices for EE estimation clearly underestimated the EE for the criterion measure (indirect calorimetry). Wearable trackers for EE estimation predominantly underestimate EE even in a controlled environment (Evenson et al., 2015; Wahl et al., 2017; Fuller et al., 2020). Wearables were typically examined while worn on the wrist (Fuller et al., 2020), though a greater accuracy can be achieved when placed on the hip or shirt collar (Woodman et al., 2017). EE estimates from devices worn on the wrist or hip generally vary in accuracy depending on physical intensity and type of activity (Howe et al., 2009; O’Driscoll et al., 2020). Recently, Ogata et al. presented an equation to improve EE estimation using accelerometer-based MET value and individual HR and showed that estimated total energy expenditure in rescue workers was one-third higher with the combined approach than with the accelerometer-based method alone (Ogata et al., 2024).
Most wearable thermometers were developed to continuously monitor skin temperature, few in order to reflect changes in CBT (Tamura et al., 2018). In the present study, we compared two sensors attached to the skin: the Tucky thermometer under the right armpit and the Tcore sensor on the forehead. Although adding 0.7°C to the measured values of Tucky improved agreement with rectal temperature, correlations between Tucky’s rectal measurements and Tcore’s CBT estimate decreased with increased physical activity (highest during Sit and the lowest during Stage4 of the Bruce treadmill test). In addition, the bias in each of the six activity phases was at least −0.8°C, indicating that Tucky’s rectal measurements underestimated traditional rectal temperature measurement. For example, Gunga et al. (2008) validated the Tcore precursor with rectal temperature measurement during treadmill activities (25%–55% maximum work intensity) at different ambient temperatures, demonstrating a good agreement during resting (Bias: 0.01°C, LoA: 0.74 to 0.72) and working periods (Bias: 0.08°C, LoA: 0.77 to 0.61) at ambient temperature of 25°C. Wearable thermometers are considered in agreement if they comply with the clinically meaningful recommendations of bias of ±0.5°C and LoA of ±1.0°C (Tamura et al., 2018). In our study, however, the bias was at least −0.8°C and the LoA were −2 to 0°C at Stand (narrowest) and −3.5°C to 0.2°C at Stage4 (widest). Our results suggest that the higher the intensity of physical activity, the lower the accuracy of Tucky’s measurements. This inaccuracy could be attributed to the thermoregulatory processes of the skin. Increased physical activity can lead to increased perspiration, which aims to cool the skin and CBT through evaporation. In the context of varying and intensive physical activity, Tucky under the armpit did not achieve sufficient accuracy with CBT. Similar observation was reported for another adesive axillary thermomenter patch. Temperatures of adesive axillary thermomenter showed good agreement with those from the conventional axillary method (Bias: 0.15°C, LoA: 1.13 to 0.99), but failed to those of the bladder as the CBT (Bias: 1.11°C, LoA: 3.19 to 0.98) (Boyer et al., 2021).
4.2 Strength and limitations
This study has several strengths. Firstly, we investigated two devices, Withings Pulse HR and Tucky thermometer, that had not been validated in an independent lab study previously, focusing on their utility for in-field assessment of physiological variables in different situations of varying physical activity. Therefore, a structured protocol consisting of successively changing intensities of activity was implemented. A structured procedure and laboratory-based setting enabled a high precision of comparison and reproducibility of results.
This study was limited to healthy, fair-skinned adults aged 20–29 years. Future research should include a more diverse cohort and a comparison of multiple skin tones, especially when using optical heart rate monitors. Motion that largely affects positioning of wearables, such as treadmill running for a wrist-worn tracker, may impact accuracy and the significance of validation research. Potential interference between devices worn simultaneously on the same wrist might also represent a possible limitation of the study. Additionally, although treadmill-based incremental testing can represent the cardiovascular strain of physical activity during agricultural work, it does not correspond to the actual biomechanics and motions of such physical activity.
5 Conclusion
In recent years, research interest in consumer-grade wearables has surged, driven by the potential of these sensors for a broad range of applications, from on-the-field ergonomic assessments to follow-ups in rehabilitation medicine. In this study, we evaluated the Withings Pulse HR wearable for HR, SC, and EE quantification and the Tucky thermometer for CBT. The Withings device demonstrated good performance in HR monitoring at low physical activity intensities and in SC at higher activity levels. However, the agreement between the Tucky thermometer measured temperature and CBT was low at rest and gradually declined with increased physical activity. In summary, both evaluated consumer-grade wearables did not achieve adequate accuracy for research purposes in controlled environments. However, Withings Pulse HR may be useful for long-term monitoring in the field, as it can effectively detect and recognize general changes in activity and corresponding physiological variables (HR, SC, EE) despite its lack of precision.
Data availability statement
The raw data supporting the conclusions of this article will be made available by the authors, without undue reservation.
Ethics statement
The studies involving humans were approved by Ethics Committee of Charité–Universitätsmedizin Berlin. The studies were conducted in accordance with the local legislation and institutional requirements. The participants provided their written informed consent to participate in this study.
Author contributions
SM: Data curation, Formal Analysis, Visualization, Writing–original draft, Writing–review and editing. GZ: Investigation, Methodology, Writing–original draft. MR: Formal Analysis, Writing–review and editing. H-CG: Funding acquisition, Writing–review and editing. AB: Writing–review and editing. SB: Conceptualization, Resources, Writing–review and editing. MAM: Conceptualization, Funding acquisition, Methodology, Project administration, Supervision, Writing–review and editing.
Funding
The author(s) declare that financial support was received for the research, authorship, and/or publication of this article. The study was part of the German Research Foundation (DFG) funded research unit “Climate Change and Health in sub-Saharan Africa” (FOR 2936), specifically individual project “Climate change, heat stress and their impact on health and working capacity” (DFG Grant number 660477). Authors SM, H-CG and MAM acknowledge the support of the German Aerospace Center -Deutsches Zentrum für Luft- und Raumfahrt (DLR) through the grants 50WB2117, 50WB2030 and 50WB2330. We also acknowledge support from the Open Access Publication Fund of Charité–Universitätsmedizin Berlin.
Acknowledgments
We would like to acknowledge the Charité medical students for their voluntary participation in and dedication to this study. Author MR was supported by Ricerca Corrente, Ministero della Salute.
Conflict of interest
The authors declare that the research was conducted in the absence of any commercial or financial relationships that could be construed as a potential conflict of interest.
Publisher’s note
All claims expressed in this article are solely those of the authors and do not necessarily represent those of their affiliated organizations, or those of the publisher, the editors and the reviewers. Any product that may be evaluated in this article, or claim that may be made by its manufacturer, is not guaranteed or endorsed by the publisher.
Supplementary material
The Supplementary Material for this article can be found online at: https://www.frontiersin.org/articles/10.3389/fphys.2025.1491401/full#supplementary-material
References
Alzahrani A., Hu S., Azorin-Peris V., Barrett L., Esliger D., Hayes M., et al. (2015). A multi-channel opto-electronic sensor to accurately monitor heart rate against motion artefact during exercise. Sensors (Basel) 15, 25681–25702. doi:10.3390/s151025681
Antczak D., Lonsdale C., Del Pozo Cruz B., Parker P., Sanders T. (2021). Reliability of GENEActiv accelerometers to estimate sleep, physical activity, and sedentary time in children. Int. J. Behav. Nutr. Phys. Act. 18, 73. doi:10.1186/s12966-021-01143-6
Asare-Nuamah P. (2021). Climate variability, subsistence agriculture and household food security in rural Ghana. Heliyon 7, e06928. doi:10.1016/j.heliyon.2021.e06928
Ayal D. Y. (2021). Climate change and human heat stress exposure in sub-Saharan Africa. CABI. Reviews. doi:10.1079/PAVSNNR202116049
Barteit S., Boudo V., Ouedraogo A., Zabré P., Ouremi L., Sié A., et al. (2021). Feasibility, acceptability and validation of wearable devices for climate change and health research in the low-resource contexts of Burkina Faso and Kenya: study protocol. PLoS One 16, e0257170. doi:10.1371/journal.pone.0257170
Barteit S., Sié A., Zabré P., Traoré I., Ouédraogo W. A., Boudo V., et al. (2023). Widening the lens of population-based health research to climate change impacts and adaptation: the climate change and health evaluation and response system (CHEERS). Front. Public. Health. 11, 1153559. doi:10.3389/fpubh.2023.1153559
Bent B., Goldstein B. A., Kibbe W. A., Dunn J. P. (2020). Investigating sources of inaccuracy in wearable optical heart rate sensors. NPJ Digit. Med. 3, 18. doi:10.1038/s41746-020-0226-6
Bland J. M., Altman D. G. (1986). Statistical methods for assessing agreement between two methods of clinical measurement. Lancet 1, 307–310. doi:10.1016/S0140-6736(86)90837-8
Boudreaux B. D., Hebert E. P., Hollander D. B., Williams B. M., Cormier C. L., Naquin M. R., et al. (2018). Validity of wearable activity monitors during cycling and resistance exercise. Med. Sci. Sports Exerc 50, 624–633. doi:10.1249/MSS.0000000000001471
Bouchama A., Abuyassin B., Lehe C., Laitano O., Jay O., O’Connor F. G., et al. (2022). Classic and exertional heatstroke. Nat. Rev. Dis. Primers. 8, 8. doi:10.1038/s41572-021-00334-6
Boyer J., Eckmann J., Strohmayer K., Koele W., Federspiel M., Schenk M., et al. (2021). Investigation of non-invasive continuous body temperature measurements in a clinical setting using an adhesive axillary thermometer (SteadyTemp®). Front. Digit. Health 3, 794274. doi:10.3389/FDGTH.2021.794274
Caldwell A. R. (2022). SimplyAgree: an R package and jamovi module for simplifying agreement and reliability analyses. J. Open Source Softw. 7, 4148. doi:10.21105/joss.04148
Campbell C., Gott A., Langford J., Sweetland C., Sweetland P. (2023). GENEAclassify: segmentation and classification of accelerometer data. Available at: https://cran.r-project.org/package=GENEAclassify.
Castaneda D., Esparza A., Ghamari M., Soltanpur C., Nazeran H. (2018). A review on wearable photoplethysmography sensors and their potential future applications in health care. Int. J. Biosens. Bioelectron. 4, 195–202. doi:10.15406/ijbsbe.2018.04.00125
Chavaillaz Y., Roy P., Partanen A.-I., Da Silva L., Bresson É., Mengis N., et al. (2019). Exposure to excessive heat and impacts on labour productivity linked to cumulative CO2 emissions. Sci. Rep. 9, 13711. doi:10.1038/s41598-019-50047-w
Diboulo E., Sié A., Rocklöv J., Niamba L., Yé M., Bagagnan C., et al. (2012). Weather and mortality: a 10 year retrospective analysis of the Nouna Health and demographic surveillance system, burkina faso. Glob. Health. Act. 5 , 6 –13 . doi:10.3402/gha.v5i0.19078
Ducharme S. W., Lim J., Busa M. A., Aguiar E. J., Moore C. C., Schuna J. M., et al. (2021). A transparent method for step detection using an acceleration threshold. J. Meas. Phys. Behav. 4, 311–320. doi:10.1123/jmpb.2021-0011
Dunn J., Runge R., Snyder M. (2018). Wearables and the medical revolution. Per. Med. 15, 429–448. doi:10.2217/pme-2018-0044
Egondi T., Kyobutungi C., Kovats S., Muindi K., Ettarh R., Rocklöv J. (2012). Time-series analysis of weather and mortality patterns in Nairobi’s informal settlements. Glob. Health. Act. 5, 23–32. doi:10.3402/gha.v5i0.19065
Eitelwein O., Fricker R., Green A., Racloz V. (2024) . Quantifying the impact of climate change on human health. Available at: https://www3.weforum.org/docs/WEF_Quantifying_the_Impact_of_Climate_Change_on_Human_Health_2024.pdf.
Eisenkraft A., Goldstein N., Fons M., Tabi M., Sherman A. D., Ben Ishay A., et al. (2023). Comparing body temperature measurements using the double sensor method within a wearable device with oral and core body temperature measurements using medical grade thermometers—a short report. Front. Physiol. 14. doi:10.3389/FPHYS.2023.1279314/FULL
Engelbart G., Brandt S., Scheeren T., Tzabazis A., Kimberger O., Kellner P. (2023). Accuracy of non-invasive sensors measuring core body temperature in cardiac surgery ICU patients – results from a monocentric prospective observational study. J. Clin. Monit. Comput. 37, 1619–1626. doi:10.1007/s10877-023-01049-7
Evenson K. R., Goto M. M., Furberg R. D. (2015). Systematic review of the validity and reliability of consumer-wearable activity trackers. Int. J. Behav. Nutr. Phys. Act. 12, 159. doi:10.1186/s12966-015-0314-1
Fletcher G. F., Ades P. A., Kligfield P., Arena R., Balady G. J., Bittner V. A., et al. (2013). Exercise standards for testing and training: a scientific statement from the American Heart Association. Circulation 128, 873–934. doi:10.1161/CIR.0b013e31829b5b44
Fraysse F., Post D., Eston R., Kasai D., Rowlands A. V., Parfitt G. (2020). Physical activity intensity cut-points for wrist-worn GENEActiv in older adults. Front. Sports Act. Living 2, 579278. doi:10.3389/fspor.2020.579278
Frimpong K., Odonkor S. T., Kuranchie F. A., Nunfam V. F. (2020). Evaluation of heat stress impacts and adaptations: perspectives from smallholder rural farmers in Bawku East of Northern Ghana. Heliyon 6, e03679. doi:10.1016/j.heliyon.2020.e03679
Fuller D., Colwell E., Low J., Orychock K., Tobin M. A., Simango B., et al. (2020). Reliability and validity of commercially available wearable devices for measuring steps, energy expenditure, and heart rate: systematic review. JMIR Mhealth Uhealth 8, e18694. doi:10.2196/18694
Funston R., Gibbs A., Diven J., Francey J., Easlea H., Murray S., et al. (2022). Comparative study of a single lead ECG in a wearable device. J. Electrocardiol. 74, 88–93. doi:10.1016/j.jelectrocard.2022.08.004
Gillinov S., Etiwy M., Wang R., Blackburn G., Phelan D., Gillinov A. M., et al. (2017). Variable accuracy of wearable heart rate monitors during aerobic exercise. Med. Sci. Sports Exerc 49, 1697–1703. doi:10.1249/MSS.0000000000001284
Godino J. G., Wing D., de Zambotti M., Baker F. C., Bagot K., Inkelis S., et al. (2020). Performance of a commercial multi-sensor wearable (Fitbit Charge HR) in measuring physical activity and sleep in healthy children. PLoS One 15, e0237719. doi:10.1371/JOURNAL.PONE.0237719
Gunga H. C., Sandsund M., Reinertsen R. E., Sattler F., Koch J. (2008). A non-invasive device to continuously determine heat strain in humans. J. Therm. Biol. 33, 297–307. doi:10.1016/j.jtherbio.2008.03.004
Hachenberger J., Teuber Z., Li Y.-M., Abkai L., Wild E., Lemola S. (2023). Investigating associations between physical activity, stress experience, and affective wellbeing during an examination period using experience sampling and accelerometry. Sci. Rep. 13, 8808. doi:10.1038/s41598-023-35987-8
Hartikainen S., Lipponen J. A., Hiltunen P., Rissanen T. T., Kolk I., Tarvainen M. P., et al. (2019). Effectiveness of the chest strap electrocardiogram to detect atrial fibrillation. Am. J. Cardiol. 123, 1643–1648. doi:10.1016/j.amjcard.2019.02.028
Howe C. A., Staudenmayer J. W., Freedson P. S. (2009). Accelerometer prediction of energy expenditure: vector magnitude versus vertical axis. Med. Sci. Sports Exerc 41, 2199–2206. doi:10.1249/MSS.0b013e3181aa3a0e
Huhn S., Axt M., Gunga H.-C., Maggioni M. A., Munga S., Obor D., et al. (2022). The impact of wearable technologies in health research: scoping review. JMIR Mhealth Uhealth 10, e34384. doi:10.2196/34384
Janke D., Kagelmann N., Storm C., Maggioni M. A., Kienast C., Gunga H.-C., et al. (2021). Measuring core body temperature using a non-invasive, disposable double-sensor during targeted temperature management in post-cardiac arrest patients. Front. Med. (Lausanne) 8, 666908. doi:10.3389/fmed.2021.666908
Jenkins C. A., Tiley L. C. F., Lay I., Hartmann J. A., Chan J. K. M., Nicholas C. L. (2022). Comparing GENEActiv against actiwatch-2 over seven nights using a common sleep scoring algorithm and device-specific wake thresholds. Behav. Sleep. Med. 20, 369–379. doi:10.1080/15402002.2021.1924175
Katiyatiya C. L. F., Muchenje V., Mushunje A. (2014). Farmers’ perceptions and knowledge of cattle adaptation to heat stress and tick resistance in the eastern cape, South Africa. Asian-Australas. J. Anim. Sci. 27, 1663–1670. doi:10.5713/ajas.2014.141
Kjellstrom T., Holmer I., Lemke B. (2009). Workplace heat stress, health and productivity - an increasing challenge for low and middle-income countries during climate change. Glob. Health. Act. 2, 2047. doi:10.3402/gha.v2i0.2047
Koch M., Matzke I., Huhn S., Gunga H.-C., Maggioni M. A., Munga S., et al. (2022). Wearables for measuring health effects of climate change-induced weather extremes: scoping review. JMIR Mhealth Uhealth 10, e39532. doi:10.2196/39532
Kokkinos P., Kaminsky L. A., Arena R., Zhang J., Myers J. (2017). New generalized equation for predicting maximal oxygen uptake (from the fitness registry and the importance of exercise national database). Am. J. Cardiol. 120, 688–692. doi:10.1016/J.AMJCARD.2017.05.037
Laborde S., Mosley E., Thayer J. F. (2017). Heart rate variability and cardiac vagal tone in psychophysiological research - recommendations for experiment planning, data analysis, and data reporting. Front. Psychol. 8, 213. doi:10.3389/fpsyg.2017.00213
Lang M., Mendt S., Paéz V., Gunga H.-C., Bilo G., Merati G., et al. (2022). Cardiac autonomic modulation and response to sub-maximal exercise in Chilean hypertensive miners. Front. Physiol. 13, 846891. doi:10.3389/fphys.2022.846891
Lin L. I. (1989). A concordance correlation coefficient to evaluate reproducibility. Biometrics 45, 255–268. doi:10.2307/2532051
Matzke I., Huhn S., Koch M., Maggioni M. A., Munga S., Muma J. O., et al. (2024). Assessment of heat exposure and health outcomes in rural populations of western Kenya by using wearable devices: observational Case study. JMIR Mhealth Uhealth 12, e54669. doi:10.2196/54669
Maylor B. D., Edwardson C. L., Dempsey P. C., Patterson M. R., Plekhanova T., Yates T., et al. (2022). Stepping towards more intuitive physical activity metrics with wrist-worn accelerometry: validity of an open-source step-count algorithm. Sensors 22, 9984. doi:10.3390/s22249984
Masson-Delmotte V., Zhai P., Pörtner H.-O., Roberts D., Skea J., Shukla P., et al. (2018). Global warming of 1.5°C. An IPCC Special Report on the impacts of global warming of 1.5°C above pre-industrial levels and related global greenhouse gas emission pathways, in the context of strengthening the global response to the threat of climate change. Cambridge University Press. doi:10.1017/9781009157940
Mendt S., Maggioni M. A., Nordine M., Steinach M., Opatz O., Belavý D., et al. (2017). Circadian rhythms in bed rest: monitoring core body temperature via heat-flux approach is superior to skin surface temperature. Chronobiol Int. 34, 666–676. doi:10.1080/07420528.2016.1224241
Moore C. C., McCullough A. K., Aguiar E. J., Ducharme S. W., Tudor-Locke C. (2020). Toward harmonized treadmill-based validation of step-counting wearable technologies: a scoping review. J. Phys. Act. Health 17, 840–852. doi:10.1123/jpah.2019-0205
Müller A. M., Wang N. X., Yao J., Tan C. S., Low I. C. C., Lim N., et al. (2019). Heart rate measures from wrist-worn activity trackers in a laboratory and free-living setting: validation study. JMIR Mhealth Uhealth 7, e14120. doi:10.2196/14120
Navalta J. W., Montes J., Bodell N. G., Salatto R. W., Manning J. W., DeBeliso M. (2020). Concurrent heart rate validity of wearable technology devices during trail running. PLoS One 15, e0238569. doi:10.1371/journal.pone.0238569
Ndahimana D., Kim E.-K. (2017). Measurement methods for physical activity and energy expenditure: a review. Clin. Nutr. Res. 6, 68–80. doi:10.7762/cnr.2017.6.2.68
Nelson M. B., Kaminsky L. A., Dickin D. C., Montoye A. H. K. (2016). Validity of consumer-based physical activity monitors for specific activity types. Med. Sci. Sports. Exerc. 48, 1619–1628. doi:10.1249/MSS.0000000000000933
O’Driscoll R., Turicchi J., Beaulieu K., Scott S., Matu J., Deighton K., et al. (2020). How well do activity monitors estimate energy expenditure? A systematic review and meta-analysis of the validity of current technologies. Br. J. Sports Med. 54, 332–340. doi:10.1136/bjsports-2018-099643
Ogata H., Negishi Y., Koizumi N., Nagayama H., Kaneko M., Kiyono K., et al. (2024). Individually optimized estimation of energy expenditure in rescue workers using a tri-axial accelerometer and heart rate monitor. Front. Physiol. 15, 1322881. doi:10.3389/fphys.2024.1322881
Parak J., Uuskoski M., Machek J., Korhonen I. (2017). Estimating heart rate, energy expenditure, and physical performance with a wrist photoplethysmographic device during running. JMIR Mhealth Uhealth 5, e97. doi:10.2196/mhealth.7437
Park J., Bangalore M., Hallegatte S., Sandhoefner E. (2018). Households and heat stress: estimating the distributional consequences of climate change. Environ. Dev. Econ. 23, 349–368. doi:10.1017/S1355770X1800013X
Passler S., Bohrer J., Blöchinger L., Senner V. (2019). Validity of wrist-worn activity trackers for estimating VO2max and energy expenditure. Int. J. Environ. Res. Public Health 16, 3037. doi:10.3390/ijerph16173037
Pickett W., King N., Lawson J., Dosman J., Trask C., Brison R. J., et al. (2015). Farmers, mechanized work, and links to obesity. Prev. Med. Balt. 70, 59–63. doi:10.1016/J.YPMED.2014.11.012
R Core Team (2022). R: A Language and Environment for Statistical Computing. ,Vienna, Austria. Available at: https://www.R-project.org/ (Accessed February 29, 2024).
Riebe D. (2014). “General principles of exercise prescription,” in ACSM’s guidelines for exercise testing and prescription. Editor L. S. Pescatello (Philadelphia: Wolters Kluwer/Lippincott Williams and Wilkins Health), 161–193.
Rowlands A. V., Maylor B., Dawkins N. P., Dempsey P. C., Edwardson C. L., Soczawa-Stronczyk A. A., et al. (2022). Stepping up with GGIR: validity of step cadence derived from wrist-worn research-grade accelerometers using the verisense step count algorithm. J. Sports Sci. 40, 2182–2190. doi:10.1080/02640414.2022.2147134
Sanders S. G., Jimenez E. Y., Cole N. H., Kuhlemeier A., McCauley G. L., Van Horn M. L., et al. (2019). Estimated physical activity in adolescents by wrist-worn GENEActiv accelerometers. J. Phys. Act. Health 16, 792–798. doi:10.1123/jpah.2018-0344
Sapari H., Selamat M. I., Isa M. R., Ismail R., Wan Mahiyuddin W. R. (2023). The impact of heat waves on health care services in Low- or middle-income countries: protocol for a systematic review. JMIR. Res. Protoc. 12, e44702. doi:10.2196/44702
Scott J. J., Rowlands A. V., Cliff D. P., Morgan P. J., Plotnikoff R. C., Lubans D. R. (2017). Comparability and feasibility of wrist- and hip-worn accelerometers in free-living adolescents. J. Sci. Med. Sport 20, 1101–1106. doi:10.1016/j.jsams.2017.04.017
Soehle M., Dehne H., Hoeft A., Zenker S. (2020). Accuracy of the non-invasive TcoreTM temperature monitoring system to measure body core temperature in abdominal surgery. J. Clin. Monit. Comput. 34, 1361–1367. doi:10.1007/s10877-019-00430-9
Stahl S. E., An H.-S., Dinkel D. M., Noble J. M., Lee J.-M. (2016). How accurate are the wrist-based heart rate monitors during walking and running activities? Are they accurate enough? BMJ Open Sport Exerc Med. 2, e000106. doi:10.1136/bmjsem-2015-000106
Tamura T., Huang M., Togawa T. (2018). Current developments in wearable thermometers. Adv. Biomed. Eng. 7, 88–99. doi:10.14326/abe.7.88
Thiebaud R. S., Funk M. D., Patton J. C., Massey B. L., Shay T. E., Schmidt M. G., et al. (2018). Validity of wrist-worn consumer products to measure heart rate and energy expenditure. Digit. Health 4, 2055207618770322. doi:10.1177/2055207618770322
Thomson E. A., Nuss K., Comstock A., Reinwald S., Blake S., Pimentel R. E., et al. (2019). Heart rate measures from the Apple Watch, Fitbit Charge HR 2, and electrocardiogram across different exercise intensities. J. Sports Sci. 37, 1411–1419. doi:10.1080/02640414.2018.1560644
Tudor-Locke C., Aguiar E. J., Han H., Ducharme S. W., Schuna J. M., Barreira T. V., et al. (2019). Walking cadence (steps/min) and intensity in 21–40 year olds: CADENCE-adults. Int. J. Behav. Nutr. Phys. Activity 16, 8. doi:10.1186/s12966-019-0769-6
Tudor-Locke C., Sisson S. B., Lee S. M., Craig C. L., Plotnikoff R. C., Bauman A. (2006). Evaluation of quality of commercial pedometers. Can. J. Public Health 97 (Suppl. 1), S10–S16. doi:10.1007/BF03405359
Wahl Y., Düking P., Droszez A., Wahl P., Mester J. (2017). Criterion-validity of commercially available physical activity tracker to estimate step count, covered distance and energy expenditure during sports conditions. Front. Physiol. 8, 725. doi:10.3389/fphys.2017.00725
Werner A., Gunga H.-C. (2020). “Monitoring of core body temperature in humans,” in Stress challenges and immunity in space. Editor A. Choukèr (Cham: Springer International Publishing), 477–498. doi:10.1007/978-3-030-16996-1_26
White T., Westgate K., Wareham N. J., Brage S. (2016). Estimation of physical activity energy expenditure during free-living from wrist accelerometry in UK adults. PLoS One 11, e0167472. doi:10.1371/journal.pone.0167472
Wickham H. (2016). ggplot2: elegant graphics for data analysis. Cham: Springer International Publishing. doi:10.1007/978-3-319-24277-4
Woodman J. A., Crouter S. E., Bassett D. R., Fitzhugh E. C., Boyer W. R. (2017). Accuracy of consumer monitors for estimating energy expenditure and activity type. Med. Sci. Sports Exerc 49, 371–377. doi:10.1249/MSS.0000000000001090
World Health Organization (2023). Clim. change. Available at: https://www.who.int/news-room/fact-sheets/detail/climate-change-and-health (Accessed July 13, 2024).
Keywords: fitness tracker, accelerometer, physiological parameters, global health, heat stress, SSA
Citation: Mendt S, Zout G, Rabuffetti M, Gunga H-C, Bunker A, Barteit S and Maggioni MA (2025) Laboratory comparison of consumer-grade and research-established wearables for monitoring heart rate, body temperature, and physical acitivity in sub-Saharan Africa. Front. Physiol. 16:1491401. doi: 10.3389/fphys.2025.1491401
Received: 04 September 2024; Accepted: 16 January 2025;
Published: 13 February 2025.
Edited by:
Mohammad Yavarimanesh, University of San Diego, United StatesReviewed by:
Colin K Drummond, Case Western Reserve University, United StatesYounes Rezaee Danesh, Yüzüncü Yıl University, Türkiye
Copyright © 2025 Mendt, Zout, Rabuffetti, Gunga, Bunker, Barteit and Maggioni. This is an open-access article distributed under the terms of the Creative Commons Attribution License (CC BY). The use, distribution or reproduction in other forums is permitted, provided the original author(s) and the copyright owner(s) are credited and that the original publication in this journal is cited, in accordance with accepted academic practice. No use, distribution or reproduction is permitted which does not comply with these terms.
*Correspondence: Stefan Mendt, c3RlZmFuLm1lbmR0QGNoYXJpdGUuZGU=
†These authors share first authorship
‡These authors share senior authorship
§ORCID: Stefan Mendt, orcid.org/0000-0001-8227-9655; Georgi Zout, orcid.org/0009-0009-5962-1024; Marco Rabuffetti, orcid.org/0000-0003-1638-7978; Hanns-Christian Gunga, orcid.org/0000-0002-0145-179X; Aditi Bunker, orcid.org/0000-0001-5906-156X; Barteit, orcid.org/0000-0002-3806-6027; Maggioni, orcid.org/0000-0002-6319-8566