
95% of researchers rate our articles as excellent or good
Learn more about the work of our research integrity team to safeguard the quality of each article we publish.
Find out more
ORIGINAL RESEARCH article
Front. Physiol. , 27 March 2025
Sec. Skin Physiology
Volume 16 - 2025 | https://doi.org/10.3389/fphys.2025.1489907
 Hongye Liu1†
 Yang Li2†
 Ling Ren1Xiaofeng Yang1Shuo Zhang1
 Hongmei Bi1Hongxia He1
 Jingyu Ren1Xiaoqing Lang1
 Shuping Guo1*
Objective: This study aims to identify potential target genes and therapeutic drugs for alopecia areata (AA).
Methods: Utilizing training and testing data, we evaluated multi-gene panels derived from commonly upregulated genes in publicly available AA patient datasets. The functions of these genes in biological processes were analyzed to identify special multi-gene panels that may play crucial roles in AA. Differences in immune cell infiltration between AA patients and healthy controls were assessed using gene set variation analysis (GSVA) and the Wald test. Signature genes were further validated in specific subsets using single-cell RNA sequence data. Finally, molecular docking and molecular dynamics simulation were conducted to evaluate interactions between protein structures encoded by signature genes and the potential new drug candidates.
Results: When the cut-off value of log2FoldChage was greater than 1.0, 51 common upregulated genes were identified in the datasets GSE68801 and GSE45512, and the enrichment analysis of biological process indicated the significant involvement of immune cells in AA. The predictive performance of multi-gene panels demonstrated excellent accuracy in pathways related to “regulation of T cell-mediated cytotoxicity” and “cell killing.” GSVA and the Wald test demonstrated that the infiltration of T cells and NK cells in AA patients was significantly higher than in healthy controls. Based on single-cell immune cell subsets, we found that within the macrophage migration inhibitory factor signaling pathway, the interactions between NK T cells, CD8 T cells, and melanocytes were observed exclusively in AA patients but not in healthy controls. This indicates that NK T and CD8 T cells may play an important role in the attack on hair follicles via melanocytes. Additionally, we selected several important biomarkers for molecular docking with interacting chemicals, evaluated the stability of drug–protein binding patterns through molecular dynamics simulation, and identified several potential targeted therapeutic agents.
Conclusion: In this study, we screened several key genes associated with immune cells and potential drug-like chemicals that could serve as targeted therapies for AA.
Alopecia areata (AA) is a common autoimmune, non-cicatricial form of alopecia and is the second most prevalent type of alopecia in clinic (McMichael and Roberson, 2023; Anzai et al., 2019). Current evidence suggests that AA is primarily a T cell-mediated disease (Anzai et al., 2019; Xing et al., 2014); notably, in vivo experiments demonstrated that CD8+ T-cell depletion can reverse established AA, whereas CD4+ T-cell depletion does not exhibit the same effect (Xing et al., 2014; Lee et al., 2023a). However, the extent of hair loss and the patient’s age are the most significant factors affecting treatment outcomes. Currently, there is no effective treatment for patients with AA, and relapse is quite common following the withdrawal of medication (Xie et al., 2022; Strazzulla et al., 2018).
Corticosteroids, such as triamcinolone acetonide, are commonly used to treat patients with limited AA. In a study involving 219 Asian patients with AA, more than 50% experienced scalp improvement after 12 weeks of treatment (Tan et al., 2002). Another monotherapy with 3%–5% minoxidil was insufficient to promote complete hair regrowth, but it stimulated hair growth in AA patients (Price, 1987). Methotrexate may be an effective treatment for patients with AA who have not responded to standard therapies, and it has shown success in both adults (Chartaux and Joly, 2010) and children (Royer et al., 2011). In a recent double-blind randomized clinical trial (NCT02037191) (Joly et al., 2023), 45 out of 89 AA patients received methotrexate therapy, and hair regrowth was partially restored in patients treated with methotrexate alone, while complete regrowth was achieved in up to 31% of patients who received a low-dose combination with prednisone. Furthermore, Janus kinase (JAK) inhibitors, such as tofacitinib, ruxolitinib, and baricitinib, have demonstrated efficacy in treating AA patients. However, the durability of the response to these medications is erratic, and most patients experience hair loss again after discontinuation (Mackay-Wiggan et al., 2016a). Therefore, it is essential to accelerate the development of new therapeutic targets and drugs to help AA patients regain full hair and restore their confidence.
In this study, we first screened significant genes associated with immune cell function and developed training and testing models to validate their role in identifying AA samples. Subsequently, we simulated the drug-binding scores for pockets in the crystal structure and evaluated the affinity scores of target gene-interacting chemicals to identify potential drugs for AA patients.
AA-associated bulk-RNA sequence datasets [GSE68801 (Jabbari et al., 2016), GSE45512 (Xing et al., 2014), and GSE80342 (Mackay-Wiggan et al., 2016b)] and single-cell RNA sequence dataset (GSE233906) were manually downloaded from Gene Expression Omnibus (GEO). Detailed characteristics of the patients and samples used in this study are provided in Supplementary Table S1. The differentially expressed genes (DEGs) between AA patients and healthy controls in the GSE68801 and GSE45512 datasets were identified using Wald significance tests from the DESeq2 package (version 1.42.0) in R language, based on a negative binomial distribution (Love et al., 2014). Potential candidate genes were screened from the shared upregulated DEGs with log2FoldChange greater than 1.00 and P value less than 0.05.
First, an enrichment analysis of biological processes was performed for shared upregulated DEGs to identify relevant multi-gene panels, each containing a maximum of four genes. Then, a generalized linear model was applied to the training dataset GSE68801, and the performance of the corresponding gene panel was tested in other datasets GSE45512 and GSE80342. Finally, to systematically train and test the performance of multi-gene panels in predicting AA patients, 97 machine learning models were deployed to find optimal multi-gene panels. Detailed methods and models are provided in the reproducible code.
To explore the different roles of immune cells played in AA patients, the GSVA (Hänzelmann et al., 2013) was conducted to compare immune cell infiltration in individual samples based on the CIBERSORT and TCIA signature genes identified by Newman et al. (2015) and Charoentong et al. (2017), which include 22 and 28 gene sets representing different immune cell types and/or functions, respectively. Then, the Wald test of individual scores was applied between AA patients and healthy controls, determining statistical significance and fold-change differences.
The weighted gene co-expression network analysis (WGCNA) of the top 10,000 upregulated or downregulated DEGs was conducted to find potential module eigen genes (Langfelder and Horvath, 2008). In the training data of this study, a soft thresholding power value of 10 was selected for fitting the unsigned scale-free topology network. The adaptive pruning algorithm based on hierarchical clustering with a minimum size of 100 genes was used to calculate the topological overlap matrix and corresponding dissimilarity. Then, the consensus measure in the gene expression network, defined by the correlation of the eigen genes, was used to merge modules with a correlation greater than 0.80 into a new gene module. Finally, the Pearson correlation matrix of module eigen genes and immune cell infiltration was generated and visualized on a heatmap.
To verify the differences in signature genes among subtypes of immune cells, we compared the target gene expression in a publicly available single-cell RNA sequence dataset (GSE233906), including six AA patients and two healthy controls. The initial cell clusters were recognized using Seurat V5 (Hao et al., 2024), and cell types were annotated using the reference Human Primary Cell Atlas Data in the R package SingleR (Version 2.4.1) (Aran et al., 2019). The Wilcox test was then used to compare the differences in signature genes in subset cells between AA patients and healthy controls.
To evaluate the potential targeted therapeutic properties of these signature genes, crystal structures of target genes were acquired from the Worldwide Protein Data Bank (PDBe-KB, 2022). The identification of drug-binding pockets followed a Voronoi mosaic-based protein pocket detection algorithm (Le Guilloux et al., 2009). Only pockets with drug score greater than 0.1 were used for molecular docking evaluation. The docking program smina, based on the AutoDock Vina tool, was used to predict receptor–ligand binding affinity (Koes et al., 2013). The potential binding chemicals were queried from the Comparative Toxicogenomics Database (CTDdb) (Davis et al., 2023).
To further understand the stability and flexibility of drug binding to target chemicals, we performed molecular dynamics simulations using GROMACS (2024) (Pronk et al., 2013). Coordinate and topological files were compiled in GROMACS using the AMBER94 force field (Sorin and Pande, 2005) and the recommended water model TIP3P (transferable intermolecular potential with 3 points). Physiological conditions were simulated by adding 0.15 M of salt (NaCl) in a 1 cubic nanometer solvent box. During all simulations, each protein–ligand complex was simulated for 300 ns at 300 K and 1 atm pressure. Free energy landscape (FEL), root mean square deviation (RMSD), root mean square fluctuation (RMSF), and solvent-accessible surface area (SASA) were used to evaluate the thermal and pressure stability and flexibility of the binding chemicals.
All statistical analyses were conducted on platforms R-4.3.2 and Python-3.9.10. The functional enrichment analysis for biological processes of gene sets was calculated using the R package clusterProfiler (Version 4.10.1) (Wu et al., 2021). WGCNA (Version 1.72-5) (Langfelder and Horvath, 2008) was used to calculate the correlation between eigen genes of DEGs and scores of immune cell infiltration. The crystal structures of drug-binding pockets and molecular docking were visualized using the Python packages py3Dmol (Version 2.0.4) and pymol (Version 2.5.7).
As shown in Figure 1A, at a cut-off value of 0.5 for log2FoldChange, 1,774 genes were upregulated and 944 genes were downregulated in the GSE68801 dataset, 785 genes were upregulated and 689 genes were downregulated in the GSE45512 dataset. When the cut-off value of log2FoldChange was 1.00, 364 and 106 genes were upregulated in GSE68801 and GSE45512, respectively, of which 51 were common genes (Figure 1B; Supplementary Table S2). Figure 1C shows the relative expression values of these common genes in the individual samples. Interestingly, the enrichment of biological process for these 51 genes was mainly associated with immune cell regulation, differentiation, and activation (Figure 1D; Supplementary Table S3). For example, processes such as T-cell activation regulation and lymphocyte differentiation were significantly enriched.
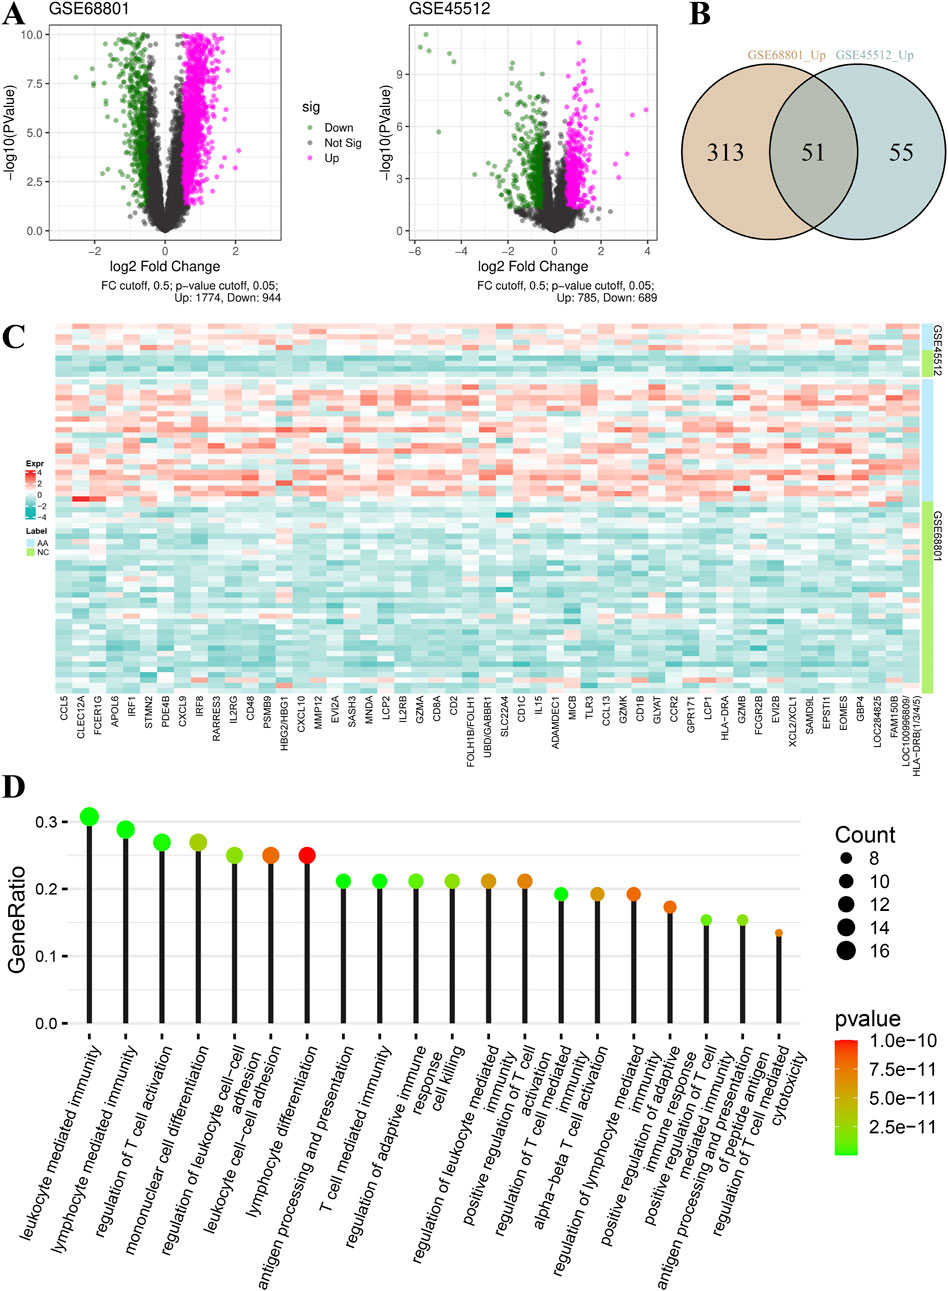
Figure 1. Gene expression and biological function of signature genes. (A) Volcano plots of differentially expressed genes of datasets GSE68801 and GSE45512. (B) Venn plot of common upregulated genes of datasets GSE68801 and GSE45512. (C) Relative expression heatmap of 51 common genes (AA, alopecia areata; NC, normal control). (D) Top 20 terms in enrichment results of biological function for the 51 common genes. The dot size and color represent the gene count and P value of each term, respectively.
To assess the predictive performance of multi-gene panels, candidate genes associated with “regulation of T cell-mediated cytotoxicity” and “cell killing” were chose to fit generalized linear models on individuals from the GSE68801 dataset. As shown in Figure 2A, the multi-gene panel consisted of CD1C, MICB, CD1B, FCGR2B, and HLA-DRA genes, and the predicted results included four (4/23) false-positive individuals and three (3/36) false-negative individuals. The AUC values of the top four combination of multi-gene panels were all greater than 0.95. In another multi-gene panel consisting of GZMA, CD2, CD1C, MIC, CCL13, CD1B, HLA-DRA, GZMB, and FCGR2B genes (Figure 2B), none of the individuals were predicted to be false-positive or false-negative. The AUC values of the top four combination of multi-gene panels were also greater than 0.95. Furthermore, the same multi-gene panels were tested in other datasets GSE45512 and GSE80342 (Supplementary Figure S1A, B), and the predictive performance was even better than that of the current training dataset.
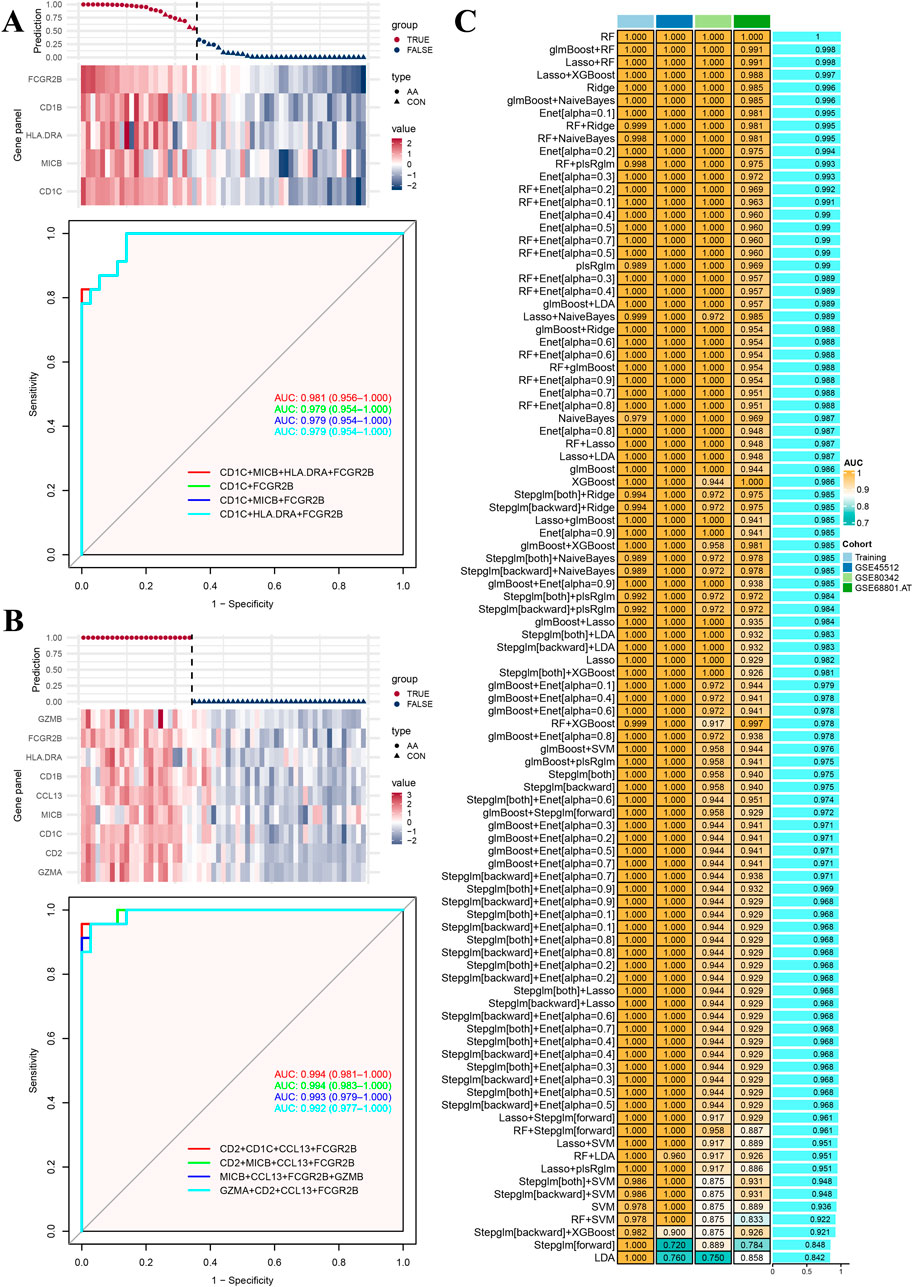
Figure 2. Model training and testing results. (A) Prediction model and relative expression heatmap for genes in the enriched term “regulation of T cell-mediated cytotoxicity.” Performance of top four multi-gene panel receiver operative curves. (B) Prediction model and relative expression heatmap for genes in the enriched term “cell killing.” Performance of top four multi-gene panel receiver operative curves. (C) Performance of training and testing cohorts for 97 machine learning models.
In addition, to avoid over-fitting within the multi-gene panels, a series of machine learning algorithms, including 97 different combinations, were used for training and testing in different datasets to screen the optimal fitting models. As shown in Figure 2C, based on the aforementioned 51 common genes, most of the fitted models demonstrated strong predictive performance in both the training or testing cohorts, although some models exhibited false-negative or false-positive scores in certain samples (Supplementary Figure S2).
We further performed GSVA on all included samples to evaluate the degree of infiltration of different types of immune cells. As shown in Figure 3A, in the three cohorts of CIBERSORT immune cell infiltration results, the infiltration scores of “T cell gamma delta,” “T cell CD8,” “NK cells activated,” and “NK cells resting” in AA individuals were significantly increased. On the other hand, the infiltration scores of “eosinophils”, “plasma cells,” and “mast cells activated” were significantly lower than those in healthy controls. As shown in Figure 3B, the infiltration score changes between AA patients and healthy controls in TCIA immune cell subtypes suggest the important role of CD8 T cells, such as “activated CD8 T cell” and “effector memory CD8 T cell.” Consistent with a previous study, the depletion of CD8 T cells reversed the AA disease in an in vivo experiment in mice (Lee et al., 2023a). All immune cell infiltration scores were used as phenotypic traits to calculate associations with module eigen genes.
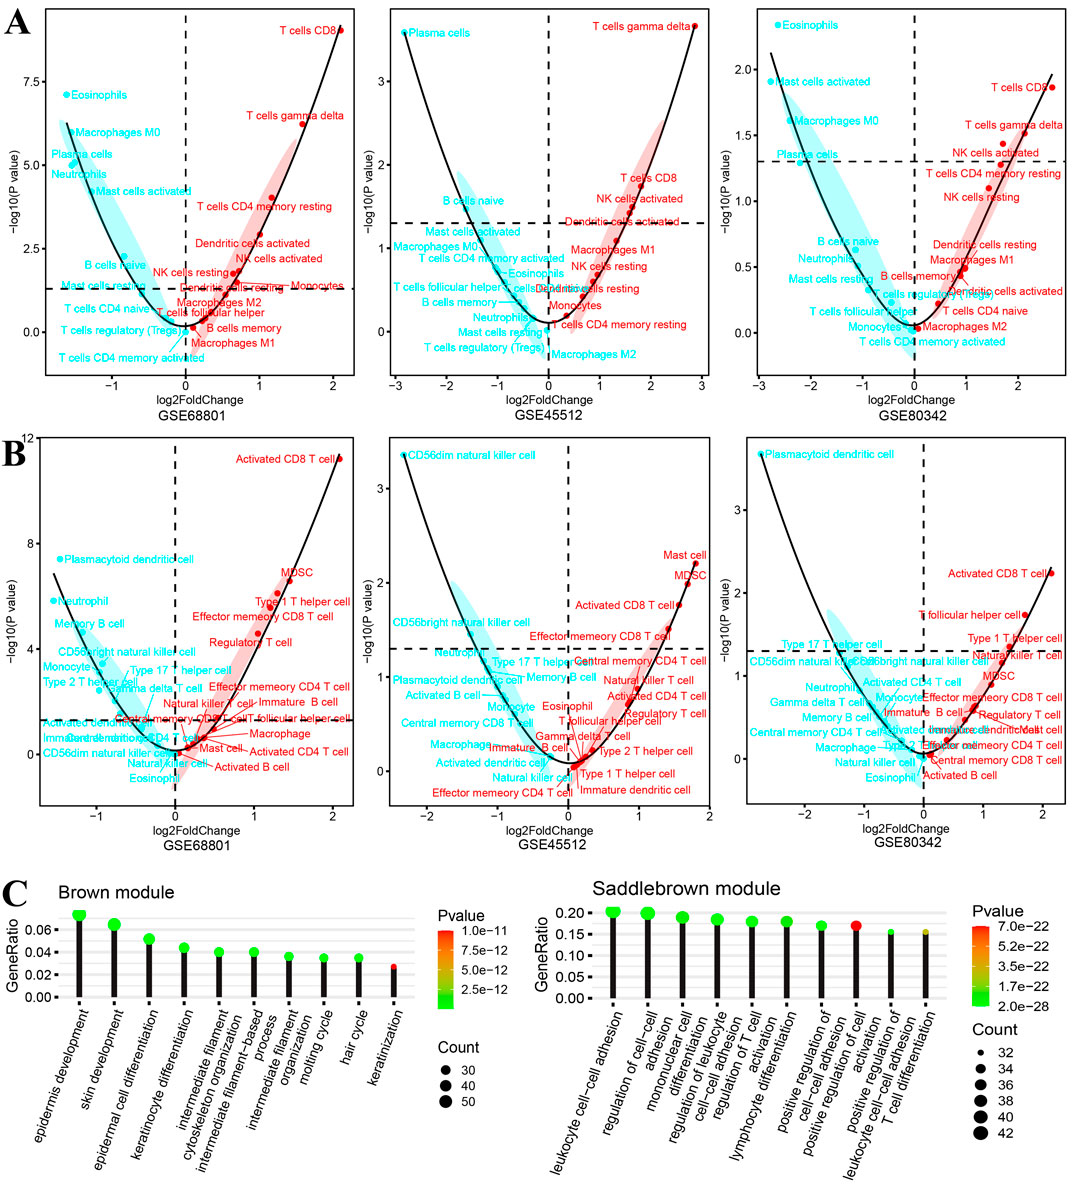
Figure 3. Differences in immune cell infiltration and biological function of gene modules of interest. (A, B) Significance tests and fold changes for immune cell infiltration [(A) CIBERSORT and (B) TCIA] scores of gene expression sets from the scalp of AA patients and healthy controls in datasets GSE68801, GSE45512, and GSE80342. (C) Biological functions of two gene modules (negatively correlated brown module and positively correlated saddle brown module), which focused on skin cell development and immune cell activation, respectively.
In the final results of merged WGCNA, 15 gene modules were found within the selected DEGs in the training cohort. Interestingly, the biological process enrichment analysis of each gene module revealed that the brown module was significantly enriched in “epidermis development,” “epidermal cell differentiation,” “keratinocyte differentiation,” and “hair cycle” and that the saddle brown module was significantly enriched in “leukocyte cell–cell adhesion,” “mononuclear cell differentiation,” “regulation of T-cell activation,” and “T-cell differentiation” (Figure 3C). Moreover, the significant correlation results between module eigen genes and CIBERSORT immune cell infiltration indicate that they play important roles in these biological processes. As shown in Figure 4A, a few gene modules were significantly associated with all immune cell infiltration scores, such as positively correlated modules gray, dark-gray, and saddle brown, and negatively correlated modules blue, brown, and dark olive-green. In addition, the correlation results of module eigen genes are generally consistent with the TCIA immune cell atlas compared with similar cell subtypes (Figure 4B).
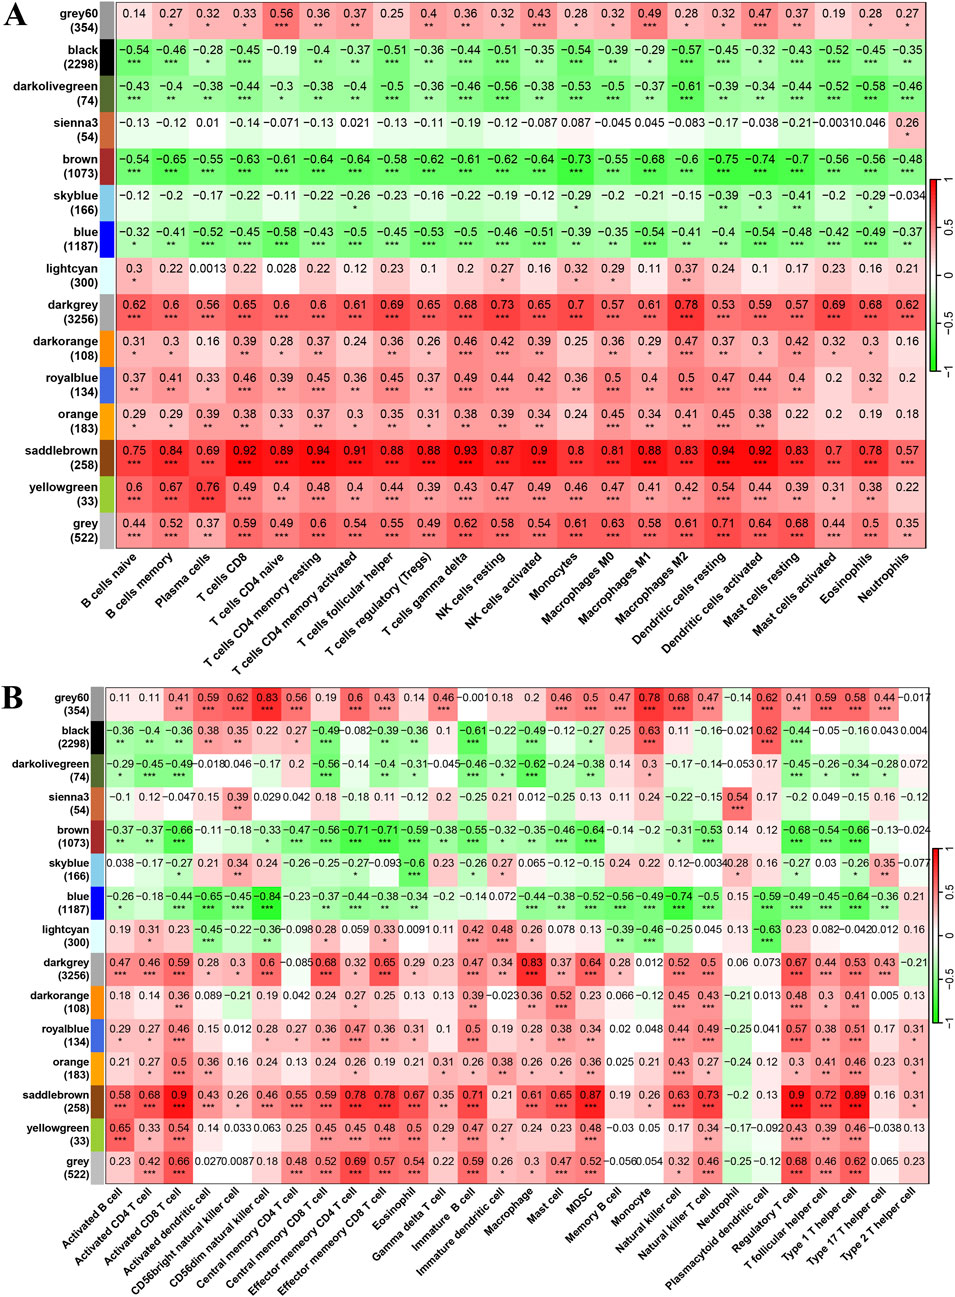
Figure 4. Pearson correlation results of module eigen genes and immune cell infiltration scores. (A, B) Heatmap of Pearson correlation results of module eigen genes and immune cell infiltration scores. [(A) CIBERSORT and (B) TCIA; *P < 0.05, **P < 0.01, ***P < 0.001].
Figure 5A shows the single-cell UMAP plot of the different cell subsets and the relative proportions of cell subtypes in six AA patients and two healthy controls. Then, we screened 16 genes that were highly expressed in immune cell subtypes such as CD4 T, CD8 T, and NK T (Supplementary Figure S3A). The Wilcox test of signature genes was conducted between AA patients and healthy controls in different cell subtypes (Supplementary Figure S3B), and GSVA scores of samples based on the top 50 biomarkers in each cell cluster were compared (Figure 5B; Supplementary Table S4). Consistent with the aforementioned result, the immune cell infiltration scores of subtypes CD4 T, CD8 T and NK T were significantly increased in AA patients. In addition, a generalized linear model of the 16 genes was fitted in cohorts GSE68801, GSE45512 and GSE80342, and there were no false-positive or false-negative predictions in the results (Figure 5C).
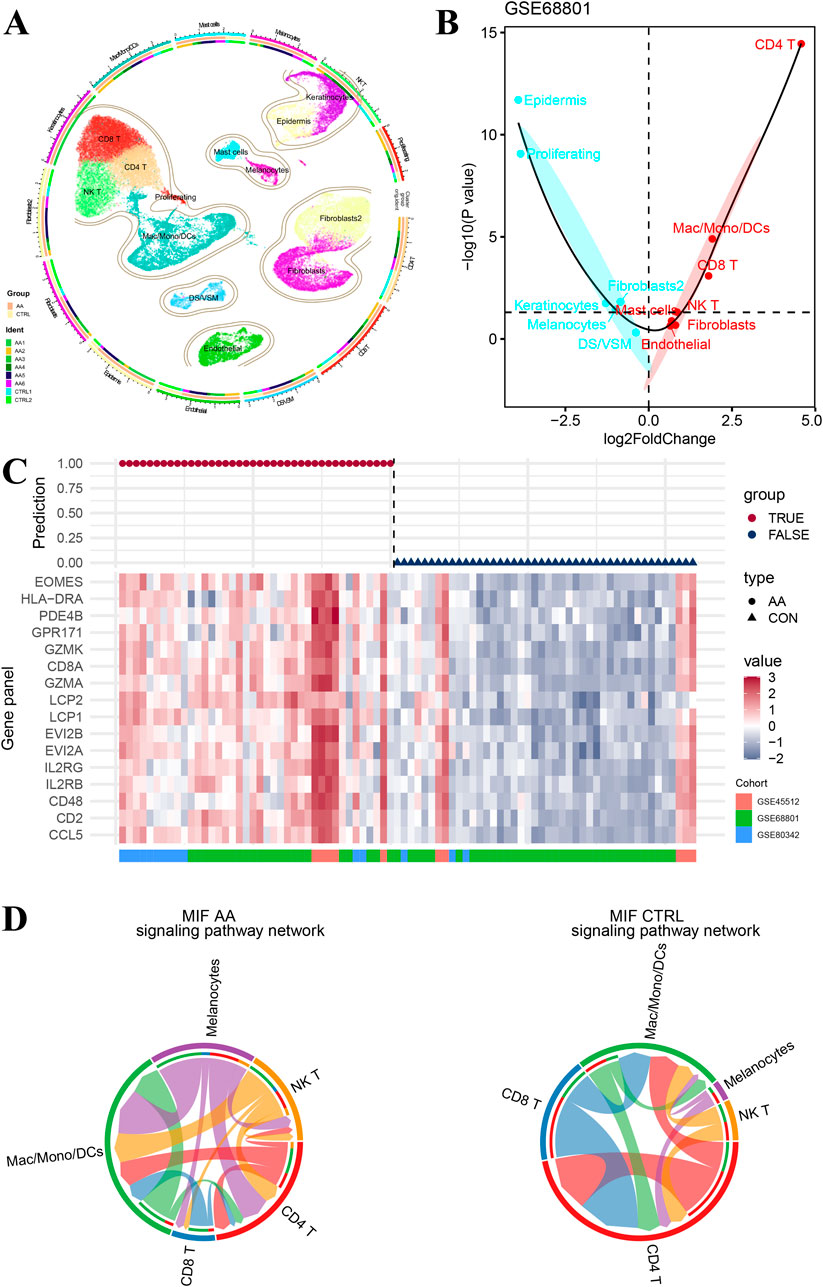
Figure 5. Immune cell interactions in single cell RNA-seq cell subtypes. (A) Cell type atlas of six alopecia areata patients and two healthy controls in the single-cell RNA sequence dataset GSE233906. (B) Difference in cell type infiltration on the basis of top 50 biomarkers in each cell cluster. (C) Predictive performance of gene-panel with 16 genes in pooled datasets GSE68801, GSE45512, and GSE80342. (D) Comparative network of cell–cell chat (including CD4 T, CD8 T, NK T, mac/mono/DCs, and melanocyte) signaling pathways for macrophage migration inhibitory factors.
There is evidence that melanocyte peptide epitopes can function as autoantigens to induce NK cells and T lymphocytes accumulated around hair follicles in the lesional skin of AA patients but rarely in the normal skin due to the immune privilege (Ito et al., 2008; Gilhar et al., 2001). Therefore, we constructed a network of cell–cell chat (including CD4 T, CD8 T, NK T, Mac/Mono/DCs, and melanocyte) signaling pathways for macrophage migration inhibitory factors (Figure 5D). As a result, signaling from NK T and CD8 T cells to melanocytes was observed in AA patients but not in healthy controls, suggesting that NK T and CD8 T may play an important role in attacking hair follicles via melanocytes.
The evaluation of target therapeutic properties was based on the drug-binding score of the pocket and molecular docking affinity. As shown in Figures 6, 7A, the molecular structure of eight proteins, namely, CCL5, CD2, IL2RB, IL2RG, PDE4B, GZMA, CD8A, and HLA-DRA, and the details of ligand–residue interactions in the drug-binding pocket only presented the optimal molecular docking pose in each binding pocket. The four other genes, namely, CD48, LCP1, LCP2, and GZMK, in Figure 7B, only presented the available pockets in their protein structures with drug-binding score greater than 0.1 (Supplementary Table S5). The remaining four genes, namely, EOMES, GPR171, EVI2A, and EVI2B, do not have corresponding 3D crystal structures of proteins in the database.
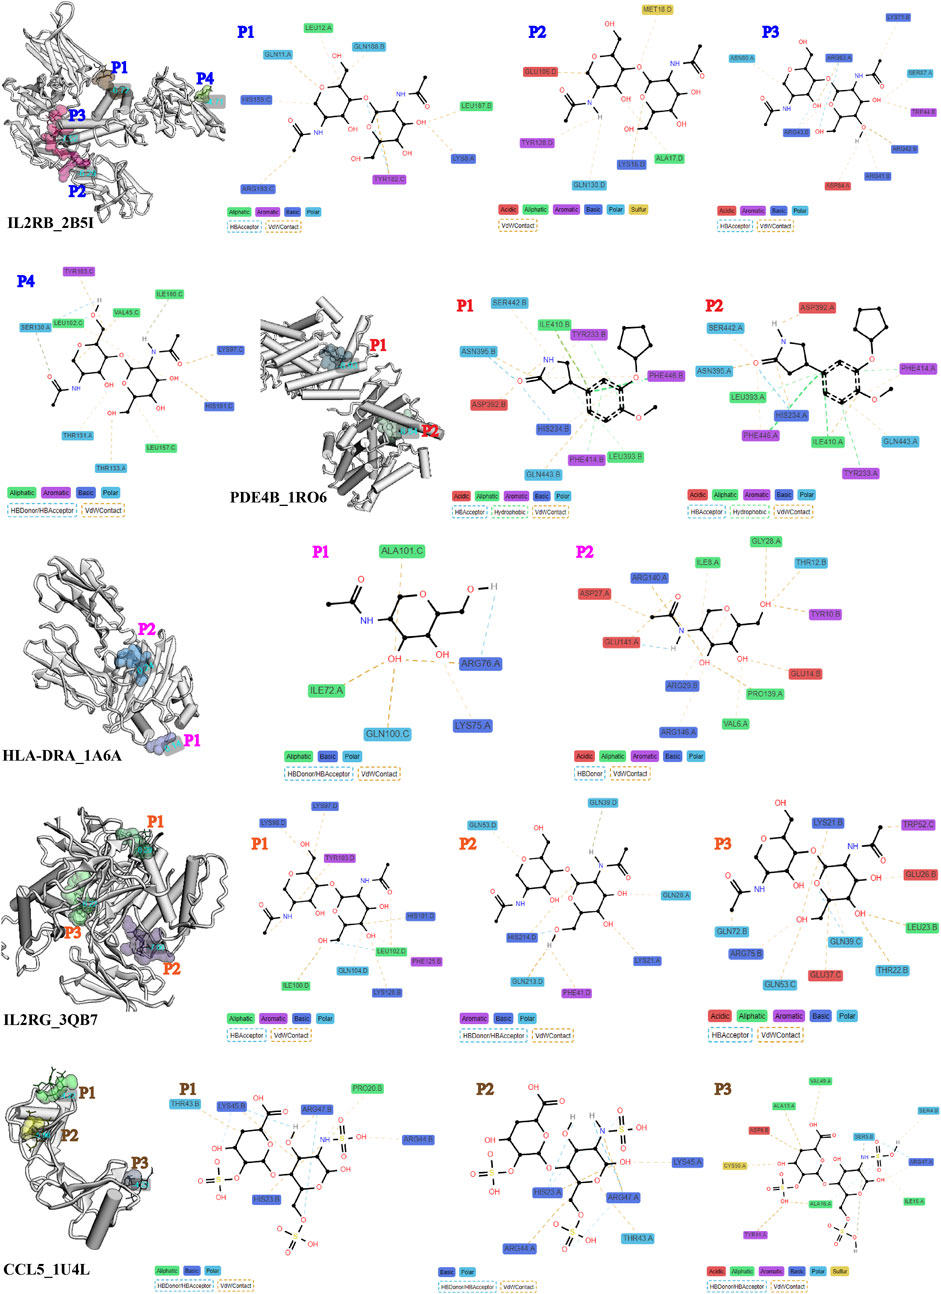
Figure 6. Details of ligand–residue interactions in drug-binding pockets.
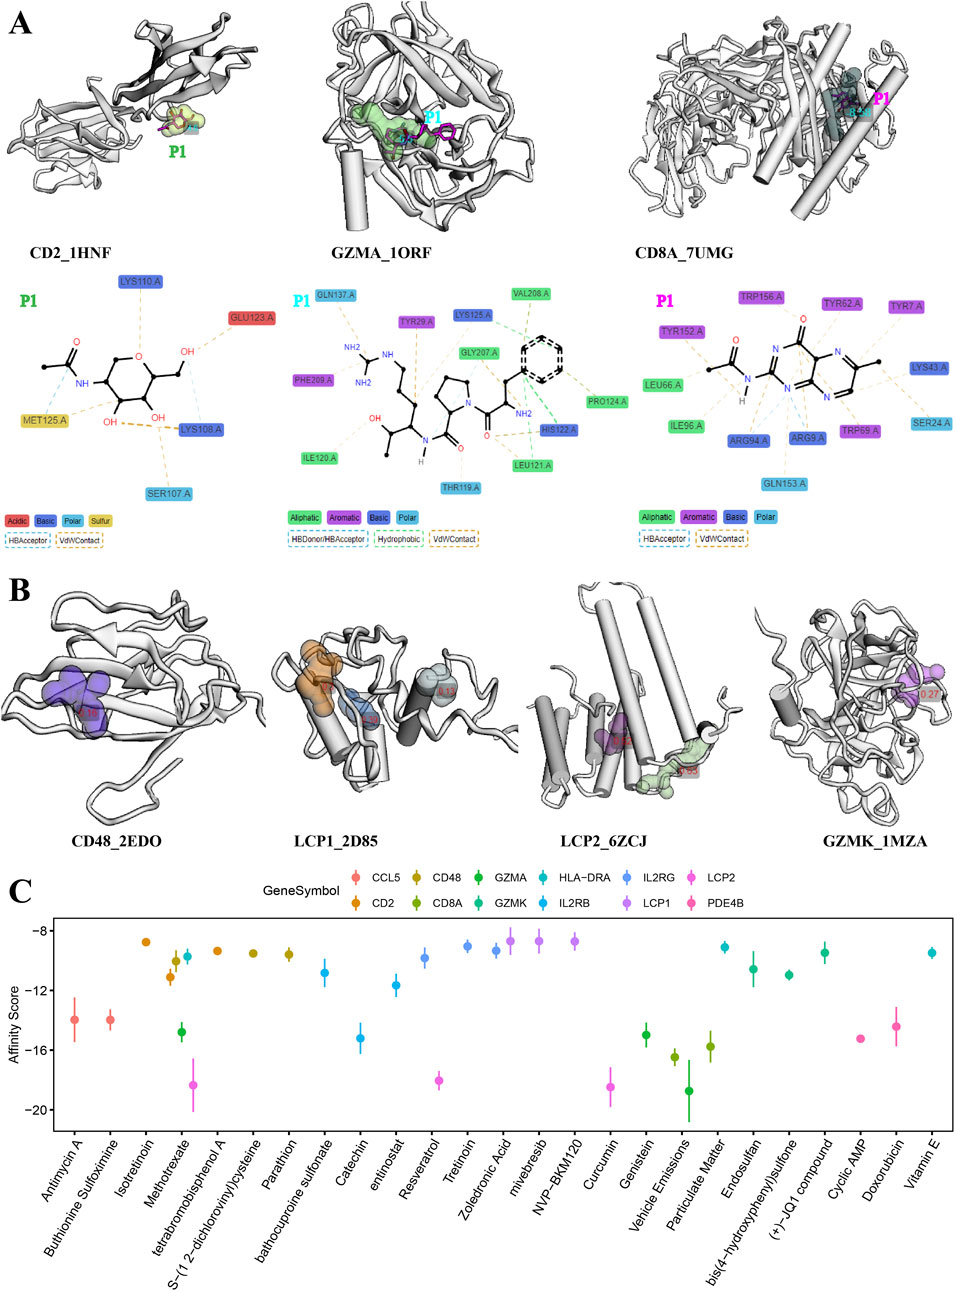
Figure 7. Evaluation of molecular docking and drug-binding pocket. (A) Details of ligand–residue interactions in drug-binding pockets. (B) Crystal structure of the optimal molecular docking position in each available pocket. (C) Top three chemicals with the highest affinity score for protein molecular encode by each signature gene.
In addition, we searched the CTDdb to look for therapeutic chemicals associated with target genes (Supplementary Table S6). Molecular docking was performed between available molecular binding pockets and interacting chemicals, as shown in Figure 7C, targeting the top three chemicals with the highest affinity score for each gene. In general, the higher the energy score, the stronger the binding ability between the two molecules and the greater the complexity of the interaction. For example, the chemicals methotrexate, resveratrol, and curcumin are the most optimal target-binding drugs for the LCP2 gene. Details of the molecular docking results are provided in Supplementary Table S7.
An example of molecular dynamics simulation of the binding mode of methotrexate to the HLA-DRA protein is shown in Figure 8. The variation in RMSD in stable ranges reflects the stability of the simulation system (Figure 8A). The cumulative distribution of FEL over RMSD in 300 nanoseconds simulation time is visualized using 100 grid matrices (Figure 8B), where the aggregated peaks correspond to the stability pattern of the composite. The overall RMSF of all amino acid residues is shown in Figure 8C, which characterizes the flexibility and motion intensity of protein amino acids during the whole simulation process. Figure 8D shows the changes in SASA of the two drug–protein binding patterns over the simulation time. Detailed simulation results of RMSD, FEL, RMSF, and SASA in other potential drug–protein binding modes are shown in Supplementary Figures S4–7, respectively.
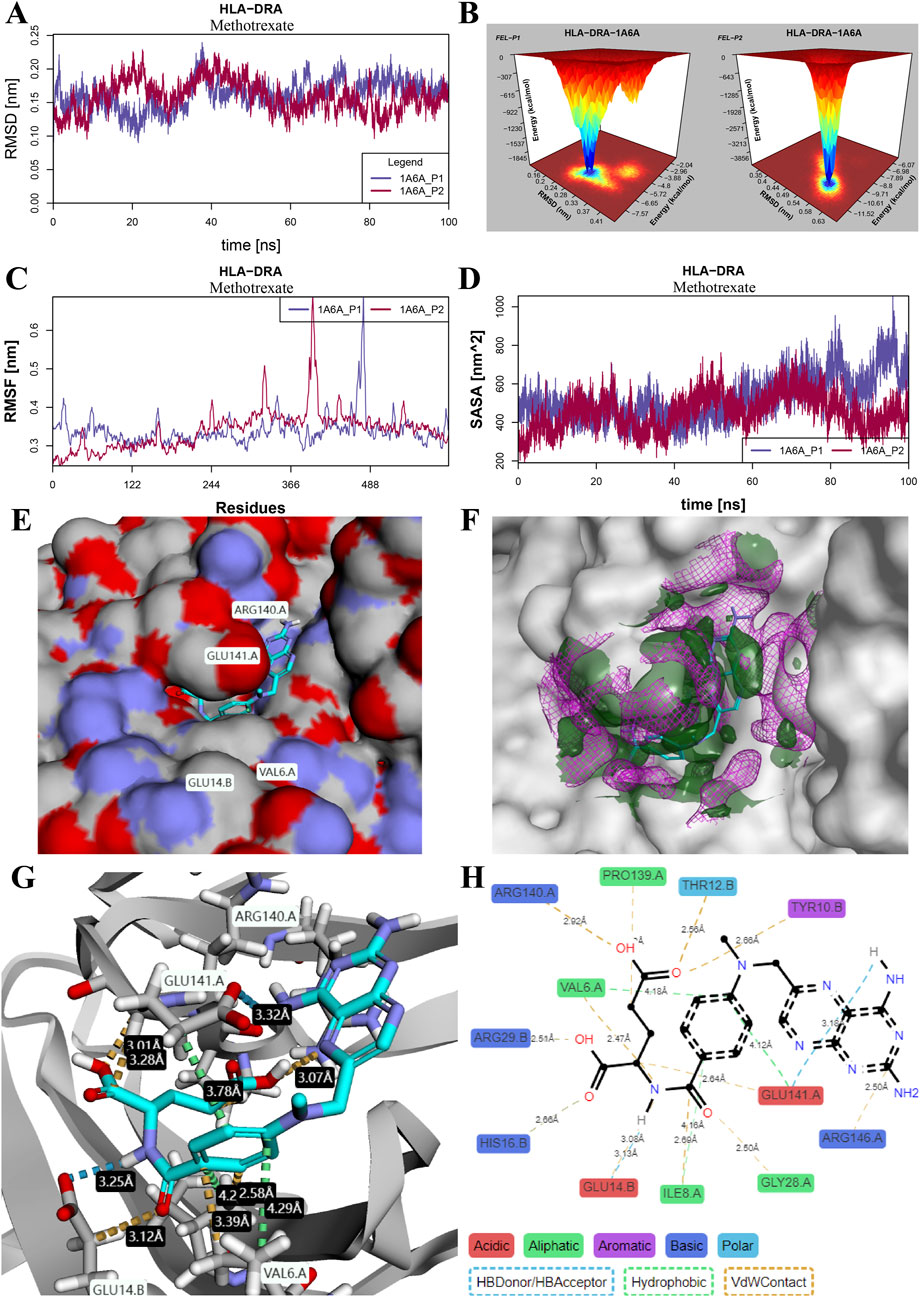
Figure 8. Stability evaluation of molecular dynamics simulation for the binding mode of methotrexate and HLA-DRA protein. (A) RMSD changes in the two binding pocket modes. (B) Three-dimensional heatmap of the cumulative distribution of free energy landscapes (FELs) over RMSD variations in a 300-nanosecond molecular dynamics simulation. (C) RMSF of all amino acid residues in each binding pocket mode. (D) SASA changes in the two binding pocket modes. (E) Binding conformation of methotrexate and HLA-DRA protein complex. (F) Free energy diagram of solvent stability and contribution of solvation to binding free energy. The dark-green area and violet grid represent free energies less than −0.2 kcal/mol/Å3 and greater than 0.2 kcal/mol/Å3, respectively, at a distance of 5Å from the ligand. (G, H) Interactions of methotrexate with binding residues in the crystal structure (G) and schematic diagram (H) of the HLA-DRA protein.
The binding conformation of the methotrexate and HLA-DRA protein complex is shown in Figure 8E. The free energy diagram of solvent stability and contribution of solvation was visualized at a distance of 5 Å from the ligand (Figure 8F), and the large coverage area of the receptor and ligand indicates high solvent stability and accessibility. The total binding energy of the methotrexate molecule with the HLA-DRA protein is −10.49 kcal/mol (Supplementary Table S6). Details of the interaction between amino acid residues and methotrexate atoms were displayed in the crystal structure (Figure 8G) and schematic diagram (Figure 8H) of the HLA-DRA protein, respectively. It was observed that the methotrexate molecule and HLA-DRA protein formed four H-bonds at distances of 3.18 Å, 3.00 Å, 3.12 Å, and 3.13 Å. Three amino acid residues (Val6, Glu141, and Ile8) were involved in the hydrophobic interactions at distances of 4.18 Å, 4.12 Å, and 4.16 Å, respectively.
In this study, we screened 51 upregulated DEGs from the two datasets of AA patients and healthy controls based on log2FoldChange greater than 1.0. The predictive performance of the generalized linear binomial model with different multi-gene panels was applied to training and testing datasets. A series of machine learning algorithms, including 97 different combinations, were tested to avoid model over-fitting. The important role of immune cells, especially CD8 T cells and CD4 T cells, in AA patients was confirmed by the infiltration analysis of featured gene sets and the correlation test with the modular eigen genes. In addition, we validated the important role of immune cell subsets in single-cell RNA sequence data and used 16 highly expressed genes in immune cells for further analysis to develop novel target drugs. Finally, evaluations of molecular docking and molecular dynamics simulations were performed between the protein structures encoded by target genes and the interacting chemicals to discover potential new drugs.
Consistent with the known evidence, our study found that CD4+/8+ T cells play an important role in the formation of AA. As described in single-cell RNA sequence data by Lee et al. (2023a), CD8+ T cells are the primary disease-driving cell type in AA but not CD4+ T cells or NK cells. In a rat model with CD4+ T cell deletion, significant hair growth was observed within 23 days of the start of treatment; however, with the re-emergence of CD4+ T cells, the newly generated hair was eventually lost (McElwee et al., 1999). Interestingly, in another study of peripheral blood from patients with active AA, the circulating CD4/CD8 T cells and NK cells were significantly reduced compared to healthy controls (Younes et al., 2022). Therefore, whether CD4+ T cells act directly on hair follicles or are driven by cytotoxic T lymphocytes via T helper cells requires further investigation. Additionally, there is evidence that cytotoxic CD8+NKG2D+ effector T cells play an important role in the induction of AA in mice (Xing et al., 2014). According to the released cytokines, the CD8+NKG2D+ effector T cells are classified into several subsets, including iNKT1, iNKT2, iNKT10, and iNKT17 (Xu et al., 2023). In an in vivo study using a humanized model, Ghraieb et al. (2018) suggested that iNKT10 cells are key disease-protective lymphocytes in AA lesions. However, the function of other subtypes of iNKT in experimental models of AA has not been studied and confirmed.
Aside from immune cells, current evidence suggests that melanocytes are the trigger point for immune system attacks that cause hair follicle destruction (Xie et al., 2022; Gilhar et al., 2001; Przybyla et al., 2021). In a mouse model of lesional scalp grafts on SCID mice by Gilhar et al. (2001), melanocyte-peptide-activated T cells significantly reduced hair regrowth, suggesting that melanocyte-peptide epitopes can function as autoantigens in alopecia areata. In the macrophage migration inhibitor signaling pathway (Figure 5D), cell–cell interactions of melanocytes from other cell types, such as CD8+ T and NKT, were only present in AA samples, suggesting that melanocytes may play an important role in AA induction. One possible mechanism is that the autoantigens released during the apoptosis of melanocytes that cannot be repaired in time induce CD8+ T-cell attack (Xie et al., 2022).
As for existing treatments for AA patients, both local and systemic, none are effective in the long term, both may have side effects, and relapse often occurs (Zhou et al., 2021). In recent years, with a further understanding of the pathogenesis of AA, some new therapeutic strategies have emerged, such as JAK inhibitors (Mackay-Wiggan et al., 2016a) and some small molecule drugs (Price, 1987; Chartaux and Joly, 2010; Royer et al., 2011; Joly et al., 2023). However, because of the efficacy, side effects, and limited persistence of these drugs, treatment outcomes in patients with AA are often unsatisfactory. Therefore, based on our findings of important target genes and interacting chemicals, we performed molecular docking procedures to search for potential novel therapeutic agents. As a result, molecular methotrexate showed a high affinity for protein structures of LCP2, CD2, CD48, IL2RB, and GZMA; resveratrol showed a high affinity for protein structures of LCP2 and IL2RG; and curcumin showed a high affinity for protein structures of LCP2 (Figure 6C).
Consistent with recent evidence from a randomized controlled trial (NCT02037191) (Joly et al., 2023), the combination of methotrexate and low-dose prednisone resulted in full hair regrowth in up to 31% of patients, with nearly the same effect as the JAK inhibitors. Results from another single-center retrospective case series suggest that methotrexate monotherapy is a viable option for patients with severe AA who do not respond to other standard therapies or have systemic corticosteroid contraindications (Kinoshita-Ise et al., 2021). The same conclusion has been found in systematic reviews and meta-analyses of AA patients receiving methotrexate treatment, and adults appear to be more sensitive to methotrexate treatment than pediatric patients (Phan et al., 2019). However, in another systematic review and meta-analysis of AA patients using JAK inhibitors, there was no difference in response rates between children and adult cases (Phan and Sebaratnam, 2019). In a randomized controlled trial using a mixture of curcumin in the treatment of alopecia areata, curcumin had a 63.33% response rate but was not better than minoxidil (70%) in short-term treatment (12 weeks) (Mao et al., 2022).
Another new highlight in this study is the application of molecular docking and molecular dynamics simulation in the exploration of potential therapeutic drugs to treat AA. For decades, computer-aided screening of novel drugs has played an important role in the treatment of many diseases (Sliwoski et al., 2014; Pinzi and Rastelli, 2019). For example, in the research of a new compound that could reduce the appearance of age spots, Mann et al. (2018) performed molecular docking, screening 50,000 compounds for comparison with known whitening ingredients. In clinical randomized controlled trials, they found that Thiamidol was successful in reducing human skin pigmentation. Ghosh et al. (2018) found that by applying molecular docking to find new treatments for acne, the molecule VCD-004 showed optimal skin penetration and a powerful anti-inflammatory effect by reducing pro-inflammatory cytokines (IL-6), independent of its antibacterial effect (Ghosh et al., 2018). Aside from the molecular docking process, molecular dynamics simulation is an important approach to evaluate the effect of simulated physiological conditions on docked drug–protein complexes (Liu et al., 2018; Parise et al., 2024). In this study, the stability and flexibility evaluation results of RMSD, FEL, RMSF, and SASA advance our understanding of the available drug-like chemicals to target proteins, thereby accelerating the development of new therapeutic agents.
The exact pathological mechanism of AA is not clear, but the widely described theory is a collapse of the immune privilege system, making the functional changes within immune cells in AA pathology highly complex. Therefore, there are certain limitations in discussing the role of immune subsets of cells in AA in this study. For example, the absence or aberrant function of T-reg cells will lead to autoimmune diseases as T-reg cells can suppress the immune responses of other cells and act as master regulators of self-tolerance (Lucca and Dominguez-Villar, 2020). There is evidence that T-reg cells are significantly reduced in patients with AA compared to other dermatoses (Speiser et al., 2019). Uchida et al. (2020) revealed that the number of γδT cells in the scalp of patients with AA was significantly higher than that of healthy controls. IFN-α-producing plasmacytoid dendritic cells initiate the occurrence of AA in mice by inducing cell apoptosis (Ito et al., 2020). In addition, most potential target gene chemicals need to be evaluated and validated in future in vitro or in vivo experiments before clinical approval.
As far as we know, AA is a complex autoimmune disease, and further evidence and validation are needed to support a precise theory of its pathogenesis. In any case, this study confirmed the important roles of CD4+ T and CD8+ T cells in bulk RNA and single-cell RNA sequence datasets; using robust methods to train and test models of key genes, as well as molecular docking and evaluation of protein-chemical evaluations, we screened several important target proteins and drug-like compounds. The findings of this study, in whole or in part, contribute to a better understanding of the characterization of immune cell subsets in AA and provide new insights for future research on targeted therapies.
The original contributions presented in the study are included in the article/Supplementary Material; further inquiries can be directed to the corresponding authors.
HL: conceptualization, resources, and writing–original draft. YL: resources, supervision, and writing–review and editing. LR: data curation, methodology, resources, and writing–original draft. XY: methodology, resources, software, and writing–original draft. SZ: formal analysis, software, and writing–original draft. HB: formal analysis, software, visualization, and writing–original draft. HH: supervision, validation, and writing–original draft. JR: formal analysis, software, and writing–original draft. XL: supervision, validation, and writing–original draft. SG: conceptualization, investigation, and writing–original draft.
The author(s) declare that financial support was received for the research and/or publication of this article. This study was supported by Health Research Project of Shanxi Provincial Health Commission (2024058).
The authors thank Maimaiti A and Turhon M for their machine learning code.
The authors declare that the research was conducted in the absence of any commercial or financial relationships that could be construed as a potential conflict of interest.
All claims expressed in this article are solely those of the authors and do not necessarily represent those of their affiliated organizations, or those of the publisher, the editors and the reviewers. Any product that may be evaluated in this article, or claim that may be made by its manufacturer, is not guaranteed or endorsed by the publisher.
The Supplementary Material for this article can be found online at: https://www.frontiersin.org/articles/10.3389/fphys.2025.1489907/full#supplementary-material
Anzai A., Wang E., Lee E. Y., Aoki V., Christiano A. M. (2019). Pathomechanisms of immune-mediated alopecia. Int. Immunol. 31, 439–447. doi:10.1093/intimm/dxz039
Aran D., Looney A. P., Liu L., Wu E., Fong V., Hsu A., et al. (2019). Reference-based analysis of lung single-cell sequencing reveals a transitional profibrotic macrophage. Nat. Immunol. 20, 163–172. doi:10.1038/s41590-018-0276-y
Charoentong P., Finotello F., Angelova M., Mayer C., Efremova M., Rieder D., et al. (2017). Pan-cancer immunogenomic analyses reveal genotype-immunophenotype relationships and predictors of response to checkpoint blockade. CELL Rep. 18, 248–262. doi:10.1016/j.celrep.2016.12.019
Chartaux E., Joly P. (2010). Long-term follow-up of the efficacy of methotrexate alone or in combination with low doses of oral corticosteroids in the treatment of alopecia areata totalis or universalis. Ann. Dermatol Venereol. 137, 507–513. doi:10.1016/j.annder.2010.06.031
Davis A. P., Wiegers T. C., Johnson R. J., Sciaky D., Wiegers J., Mattingly C. J. (2023). Comparative Toxicogenomics database (CTD): update 2023. NUCLEIC ACIDS Res. 51, D1257–D1262. doi:10.1093/nar/gkac833
Ghosh S., Sinha M., Bhattacharyya A., Sadhasivam S., Megha J., Reddy S., et al. (2018). A rationally designed multifunctional antibiotic for the treatment of drug-resistant acne. J. INVEST DERMATOL 138, 1400–1408. doi:10.1016/j.jid.2017.11.041
Ghraieb A., Keren A., Ginzburg A., Ullmann Y., Schrum A. G., Paus R., et al. (2018). iNKT cells ameliorate human autoimmunity: lessons from alopecia areata. J. Autoimmun. 91, 61–72. doi:10.1016/j.jaut.2018.04.001
Gilhar A., Landau M., Assy B., Shalaginov R., Serafimovich S., Kalish R. S. (2001). Melanocyte-associated T cell epitopes can function as autoantigens for transfer of alopecia areata to human scalp explants on Prkdc(sci) mice. J. INVEST DERMATOL 117, 1357–1362. doi:10.1046/j.0022-202x.2001.01583.x
Hänzelmann S., Castelo R., Guinney J. (2013). GSVA: gene set variation analysis for microarray and RNA-seq data. BMC Bioinforma. 14, 7. doi:10.1186/1471-2105-14-7
Hao Y., Stuart T., Kowalski M. H., Choudhary S., Hoffman P., Hartman A., et al. (2024). Dictionary learning for integrative, multimodal and scalable single-cell analysis. Nat. Biotechnol. 42, 293–304. doi:10.1038/s41587-023-01767-y
Ito T., Ito N., Saatoff M., Hashizume H., Fukamizu H., Nickoloff B. J., et al. (2008). Maintenance of hair follicle immune privilege is linked to prevention of NK cell attack. J. INVEST DERMATOL 128, 1196–1206. doi:10.1038/sj.jid.5701183
Ito T., Suzuki T., Sakabe J. I., Funakoshi A., Fujiyama T., Tokura Y. (2020). Plasmacytoid dendritic cells as a possible key player to initiate alopecia areata in the C3H/HeJ mouse. Allergol. Int. 69, 121–131. doi:10.1016/j.alit.2019.07.009
Jabbari A., Cerise J. E., Chen J. C., Mackay-Wiggan J., Duvic M., Price V., et al. (2016). Molecular signatures define alopecia areata subtypes and transcriptional biomarkers. EBIOMEDICINE 7, 240–247. doi:10.1016/j.ebiom.2016.03.036
Joly P., Lafon A., Houivet E., Donnadieu N., Richard M. A., Dupuy A., et al. (2023). Efficacy of methotrexate alone vs methotrexate plus low-dose prednisone in patients with alopecia areata totalis or universalis: a 2-step double-blind randomized clinical trial. JAMA DERMATOL 159, 403–410. doi:10.1001/jamadermatol.2022.6687
Kinoshita-Ise M., Sachdeva M., Martinez-Cabriales S. A., Shear N. H., Lansang P. (2021). Oral methotrexate monotherapy for severe alopecia areata: a single center retrospective case series. J. Cutan. Med. Surg. 25, 490–497. doi:10.1177/1203475421995712
Koes D. R., Baumgartner M. P., Camacho C. J. (2013). Lessons learned in empirical scoring with spina from the CSAR 2011 benchmarking exercise. J. Chem. Inf. MODEL 53, 1893–1904. doi:10.1021/ci300604z
Langfelder P., Horvath S. (2008). WGCNA: an R package for weighted correlation network analysis. BMC Bioinforma. 9, 559. doi:10.1186/1471-2105-9-559
Lee E. Y., Dai Z., Jaiswal A., Wang E., Anandasabapathy N., Christiano A. M. (2023). Functional interrogation of lymphocyte subsets in alopecia areata using single-cell RNA sequencing. Proc. Natl. Acad. Sci. U. S. A. 120, e2305764120. doi:10.1073/pnas.2305764120
Le Guilloux V., Schmidtke P., Tuffery P. (2009). Fpocket: an open source platform for ligand pocket detection. BMC Bioinforma. 10, 168. doi:10.1186/1471-2105-10-168
Liu X., Shi D., Zhou S., Liu H., Liu H., Yao X. (2018). Molecular dynamics simulations and novel drug discovery. Expert Opin. Drug Discov. 13, 23–37. doi:10.1080/17460441.2018.1403419
Love M. I., Huber W., Anders S. (2014). Moderated estimation of fold change and dispersion for RNA-seq data with DESeq2. GENOME Biol. 15, 550. doi:10.1186/s13059-014-0550-8
Lucca L. E., Dominguez-Villar M. (2020). Modulation of regulatory T cell function and stability by co-inhibitory receptors. Nat. Rev. Immunol. 20, 680–693. doi:10.1038/s41577-020-0296-3
Mackay-Wiggan J., Jabbari A., Nguyen N., Cerise J. E., Clark C., Ulerio G., et al. (2016a). Oral ruxolitinib induces hair regrowth in patients with moderate-to-severe alopecia areata. JCI Insight 1, e89790. doi:10.1172/jci.insight.89790
Mackay-Wiggan J., Jabbari A., Nguyen N., Cerise J. E., Clark C., Ulerio G., et al. (2016b). Oral ruxolitinib induces hair regrowth in patients with moderate-to-severe alopecia areata. JCI Insight 1, e89790. doi:10.1172/jci.insight.89790
Mann T., Gerwat W., Batzer J., Eggers K., Scherner C., Wenck H., et al. (2018). Inhibition of human tyrosinase requires molecular motifs distinctively different from mushroom tyrosinase. J. INVEST DERMATOL 138, 1601–1608. doi:10.1016/j.jid.2018.01.019
Mao Y., Xu Z., Song J., Xie Y., Mei X., Shi W. (2022). Efficacy of a mixed preparation containing piperine, capsaicin and curcumin in the treatment of alopecia areata. J. Cosmet. Dermatol 21, 4510–4514. doi:10.1111/jocd.14931
McElwee K. J., Spiers E. M., Oliver R. F. (1999). Partial restoration of hair growth in the DEBR model for Alopecia areata after in vivo depletion of CD4+ T cells. Br. J. Dermatol 140, 432–437. doi:10.1046/j.1365-2133.1999.02705.x
McMichael A. J., Roberson M. L. (2023). Characterizing epidemiology and burden of disease in alopecia areata-making it count. JAMA DERMATOL 159, 369–370. doi:10.1001/jamadermatol.2023.0001
Newman A. M., Liu C. L., Green M. R., Gentles A. J., Feng W., Xu Y., et al. (2015). Robust enumeration of cell subsets from tissue expression profiles. Nat. METHODS 12, 453–457. doi:10.1038/nmeth.3337
Parise A., Cresca S., Magistrato A. (2024). Molecular dynamics simulations for the structure-based drug design: targeting small-GTPases proteins. Expert Opin. Drug Discov. 19, 1259–1279. doi:10.1080/17460441.2024.2387856
PDBe-KB (2022). PDBe-KB: collaboratively defining the biological context of structural data. NUCLEIC ACIDS Res. 50, D534–D542. doi:10.1093/nar/gkab988
Phan K., Ramachandran V., Sebaratnam D. F. (2019). Methotrexate for alopecia areata: a systematic review and meta-analysis. J. Am. Acad. DERMATOL 80, 120–127.e2. doi:10.1016/j.jaad.2018.06.064
Phan K., Sebaratnam D. F. (2019). JAK inhibitors for alopecia areata: a systematic review and meta-analysis. J. Eur. Acad. Dermatol Venereol. 33, 850–856. doi:10.1111/jdv.15489
Pinzi L., Rastelli G. (2019). Molecular docking: shifting paradigms in drug discovery. Int. J. Mol. Sci. 20, 4331. doi:10.3390/ijms20184331
Price V. H. (1987). Topical minoxidil (3%) in extensive alopecia areata, including long-term efficacy. J. Am. Acad. DERMATOL 16, 737–744. doi:10.1016/s0190-9622(87)70096-6
Pronk S., Páll S., Schulz R., Larsson P., Bjelkmar P., Apostolov R., et al. (2013). GROMACS 4.5: a high-throughput and highly parallel open source molecular simulation toolkit. BIOINFORMATICS 29, 845–854. doi:10.1093/bioinformatics/btt055
Przybyla A., Lehmann A. A., Zhang T., Mackiewicz J., Galus Ł., Kirchenbaum G. A., et al. (2021). Functional T cell reactivity to melanocyte antigens is lost during the progression of malignant melanoma, but is restored by immunization. Cancers (Basel) 13, 223. doi:10.3390/cancers13020223
Royer M., Bodemer C., Vabres P., Pajot C., Barbarot S., Paul C., et al. (2011). Efficacy and tolerability of methotrexate in severe childhood alopecia areata. Br. J. Dermatol 165, 407–410. doi:10.1111/j.1365-2133.2011.10383.x
Sliwoski G., Kothiwale S., Meiler J., Lowe E. J. (2014). Computational methods in drug discovery. Pharmacol. Rev. 66, 334–395. doi:10.1124/pr.112.007336
Sorin E. J., Pande V. S. (2005). Exploring the helix-coil transition via all-atom equilibrium ensemble simulations. Biophys. J. 88, 2472–2493. doi:10.1529/biophysj.104.051938
Speiser J. J., Mondo D., Mehta V., Marcial S. A., Kini A., Hutchens K. A. (2019). Regulatory T-cells in alopecia areata. J. Cutan. Pathol. 46, 653–658. doi:10.1111/cup.13479
Strazzulla L. C., Wang E., Avila L., Lo S. K., Brinster N., Christiano A. M., et al. (2018). Alopecia areata: an appraisal of new treatment approaches and overview of current therapies. J. Am. Acad. DERMATOL 78, 15–24. doi:10.1016/j.jaad.2017.04.1142
Tan E., Tay Y. K., Goh C. L., Chin G. Y. (2002). The pattern and profile of alopecia areata in Singapore--a study of 219 Asians. Int. J. DERMATOL 41, 748–753. doi:10.1046/j.1365-4362.2002.01357.x
Uchida Y., Gherardini J., Schulte-Mecklenbeck A., Alam M., Chéret J., Rossi A., et al. (2020). Pro-inflammatory Vδ1(+)T-cells infiltrates are present in and around the hair bulbs of non-lesional and lesional alopecia areata hair follicles. J. DERMATOL Sci. 100, 129–138. doi:10.1016/j.jdermsci.2020.09.001
Wu T., Hu E., Xu S., Chen M., Guo P., Dai Z., et al. (2021). clusterProfiler 4.0: a universal enrichment tool for interpreting omics data. Innov. (Camb) 2, 100141. doi:10.1016/j.xinn.2021.100141
Xie B., Sun J., Song X. (2022). Hair follicle melanocytes initiate autoimmunity in alopecia areata: a trigger point. Clin. Rev. Allergy Immunol. 63, 417–430. doi:10.1007/s12016-022-08954-w
Xing L., Dai Z., Jabbari A., Cerise J. E., Higgins C. A., Gong W., et al. (2014). Alopecia areata is driven by cytotoxic T lymphocytes and is reversed by JAK inhibition. Nat. Med. 20, 1043–1049. doi:10.1038/nm.3645
Xu W., Wan S., Xie B., Song X. (2023). Novel potential therapeutic targets of alopecia areata. Front. Immunol. 14, 1148359. doi:10.3389/fimmu.2023.1148359
Younes A. K., Hammad R., Othman M., Sobhy A. (2022). CD4, CD8 and natural killer cells are depressed in patients with alopecia areata: their association with disease activity. BMC Immunol. 23, 13. doi:10.1186/s12865-022-00486-4
Keywords: immune cell infiltration, multi-gene panel, alopecia areata, machine learning, module eigen genes, molecular docking, molecular dynamics simulation
Citation: Liu H, Li Y, Ren L, Yang X, Zhang S, Bi H, He H, Ren J, Lang X and Guo S (2025) Performance exploration of multi-gene panels of alopecia areata susceptibility and drug-binding targets. Front. Physiol. 16:1489907. doi: 10.3389/fphys.2025.1489907
Received: 02 September 2024; Accepted: 13 March 2025;
Published: 27 March 2025.
Edited by:
Helen He, Mount Sinai Hospital, United StatesReviewed by:
Gunjan Saini, Medical College of Wisconsin, United StatesCopyright © 2025 Liu, Li, Ren, Yang, Zhang, Bi, He, Ren, Lang and Guo. This is an open-access article distributed under the terms of the Creative Commons Attribution License (CC BY). The use, distribution or reproduction in other forums is permitted, provided the original author(s) and the copyright owner(s) are credited and that the original publication in this journal is cited, in accordance with accepted academic practice. No use, distribution or reproduction is permitted which does not comply with these terms.
*Correspondence: Shuping Guo, Z3NwNjY4OEBzaW5hLmNvbQ==
†These authors have contributed equally to this work
Disclaimer: All claims expressed in this article are solely those of the authors and do not necessarily represent those of their affiliated organizations, or those of the publisher, the editors and the reviewers. Any product that may be evaluated in this article or claim that may be made by its manufacturer is not guaranteed or endorsed by the publisher.
Research integrity at Frontiers
Learn more about the work of our research integrity team to safeguard the quality of each article we publish.