- 1Physiological Laboratory, University of Cambridge, Cambridge, United Kingdom
- 2Department of Veterinary Medicine, University of Cambridge, Cambridge, United Kingdom
- 3Department of Biochemistry, University of Cambridge, Cambridge, United Kingdom
Introduction: Intracellular Ca2+ signalling regulates membrane permeabilities, enzyme activity, and gene transcription amongst other functions. Large transmembrane Ca2+ electrochemical gradients and low diffusibility between cell compartments potentially generate short-lived, localised, high-[Ca2+] microdomains. The highest concentration domains likely form between closely apposed membranes, as at amphibian skeletal muscle transverse tubule–sarcoplasmic reticular (T-SR, triad) junctions.
Materials and methods: Finite element computational analysis characterised the formation and steady state and kinetic properties of the Ca2+ microdomains using established empirical physiological and anatomical values. It progressively incorporated Fick diffusion and Nernst–Planck electrodiffusion gradients, K+, Cl−, and Donnan protein, and calmodulin (CaM)-mediated Ca2+ buffering. It solved for temporal–spatial patterns of free and buffered Ca2+, Gaussian charge differences, and membrane potential changes, following Ca2+ release into the T-SR junction.
Results: Computational runs using established low and high Ca2+ diffusibility (DCa2+) limits both showed that voltages arising from intracytosolic total [Ca2+] gradients and the counterions little affected microdomain formation, although elevated DCa2+ reduced attained [Ca2+] and facilitated its kinetics. Contrastingly, adopting known cytosolic CaM concentrations and CaM-Ca2+ affinities markedly increased steady-state free ([Ca2+]free) and total ([Ca2+]), albeit slowing microdomain formation, all to extents reduced by high DCa2+. However, both low and high DCa2+ yielded predictions of similar, physiologically effective, [Ca2+-CaM]. This Ca2+ trapping by the relatively immobile CaM particularly increased [Ca2+] at the junction centre. [Ca2+]free, [Ca2+-CaM], [Ca2+], and microdomain kinetics all depended on both CaM-Ca2+ affinity and DCa2+. These changes accompanied only small Gaussian (∼6 mV) and surface charge (∼1 mV) effects on tubular transmembrane potential at either DCa2+.
Conclusion: These physical predictions of T-SR Ca2+ microdomain formation and properties are compatible with the microdomain roles in Ca2+ and Ca2+-CaM-mediated signalling but limited the effects on tubular transmembrane potentials. CaM emerges as a potential major regulator of both the kinetics and the extent of microdomain formation. These possible cellular Ca2+ signalling roles are discussed in relation to possible feedback modulation processes sensitive to the μM domain but not nM bulk cytosolic, [Ca2+]free, and [Ca2+-CaM], including ryanodine receptor-mediated SR Ca2+ release; Na+, K+, and Cl− channel-mediated membrane excitation and stabilisation; and Na+/Ca2+ exchange transport.
1 Introduction
Intracellular Ca2+ is key to cellular signalling, regulating membrane permeabilities, enzyme activity, and gene transcription, typically at high nM, and triggering excitation–contraction coupling and apoptosis at µM bulk cytosolic concentrations. In addition to the extracellular space and cytosol, it occurs within membrane-bound organelles, including the endoplasmic reticulum (ER) and mitochondria. Its concentrations in the different compartments are tightly regulated at markedly different levels (e.g., extracellular space, ∼3 mM, and cytosol, ∼50 nM). It is also heavily buffered, the latter forming an important source of [Ca2+]i regulation: over 99% of cytoplasmic Ca2+ is protein-bound. Ca2+ itself is poorly mobile, diffusing 100-fold slower than K+ or Cl−. The resulting large transmembrane gradients driving Ca2+ fluxes and its buffering and poor diffusibility predispose to the generation of Ca2+ microdomains at the mouth of the translocating Ca2+ channels. These are spatially and temporally restricted “clouds” of high [Ca2+] potentially involved in local highly specific cellular regulatory actions.
Microdomains are important in cellular signalling. Thus, neuronal L- but not N- or P/Q-Cav-mediated extracellular Ca2+ entry triggers CREB Ser133 phosphorylation (Dolmetsch et al., 2001) through specific effectors within microdomains specifically around L-Cavs in the L-Cav “channelosome.” These are insensitive to microdomains around other channels because [Ca2+] then decays sharply away from L-Cavs. Furthermore, cellular regions with closely apposed membranes further restricting Ca2+ diffusion, promoting microdomain formation, are common and important. Thus, plasma membrane (PM)–endoplasmic reticular (ER) junctions formed during T-lymphocyte activation coordinate Ca2+ entry; failure of this microdomain formation leads to severe combined immunodeficiency (Feske et al., 2006). Similar membrane-restricted compartments enabling Ca2+ accumulation occur in a wide range of cells during store-operated Ca2+ entry.
Finally, regarding skeletal and cardiac muscle, triad and dyad, transverse tubule–sarcoplasmic reticular (T-SR) junctions, those in amphibian skeletal muscle, have been anatomically characterised in quantitative detail by electron microscopic methods (Franzini-Armstrong, 1970; 1973). Propagated surface membrane action potentials are conducted into T-tubular membranes invaginating deep within the cell. Pairs of sarcoplasmic reticular (SR) terminal cisternae come into proximity with T-tubular membranes at regular intervals. These form triads, each comprising two SR cisternae and one T-tubule. The T-SR gaps are extremely narrow (12 nm), permitting contained tubular dihydropyridine receptors (DHPRs) and bridging SR ryanodine receptor (RyR) membrane proteins to allosterically interact (Martin et al., 2003; Usher-Smith et al., 2007). Tubular depolarisation triggers DHPR conformational changes, which, in turn, activates the RyR gating SR Ca2+ efflux into the tight T-SR space, potentially forming Ca2+ microdomains, whose subsequent flux into the remaining cytosol mediates excitation–contraction coupling (ECC) (Huang et al., 2011).
Even in relatively well anatomically characterised skeletal muscle T-SR junctions, such Ca2+ microdomains are difficult to study experimentally. They are small, confined between membranes, dispersed over the cell anatomy, and release Ca2+ in smaller quantities than those in other signalling events. The [Ca2+] changes involved are low compared to other cytosolic ion concentrations, necessitating measurement techniques highly specific to Ca2+. However, many of these are unsuited to study the microdomain, as opposed to bulk cytosolic [Ca2+]. Many fluorescent indicator-based methods use high-affinity Ca2+ buffers such as Mag-Fluo-4 and GCaMP that themselves perturb local Ca2+ and have too low a temporal resolution (Despa et al., 2014; Sanchez et al., 2021; Saucerman and Bers, 2012). Some electrophysiological methods have the necessary temporal but not the necessary spatial resolution. For example, Ca2+-dependent Cl− current measurements similarly only measure cell-wide Ca2+ signalling events.
Alternative theoretical modelling approaches used detailed quantitative characterisations of the cellular anatomy of the skeletal muscle to develop geometrical models of the T-SR junction, permitting mathematical modelling of their regional Ca2+ diffusion properties (Bardsley et al., 2021). This initial study demonstrated the formation of Ca2+ microdomains of potential physiological importance, resulting in [Ca2+] attaining concentrations of ∼20 µM at the microdomain centre. However, it was confined to simple diffusion equations applied to free Ca2+ diffusion in the absence of other relevant physiological factors. This prompted the present more quantitative and physiologically realistic approach. We thus now incorporated contributions from charge build-ups within the domain, effects of other ions and major Ca2+ buffers. We further investigated for consequent effects on transmembrane potentials and membrane surface charge.
2 Theory
2.1 Overview of the approach
The study first generated a MATLAB model simulating Ca2+ entry and diffusion through and out of the T-SR junction space, adopting parameters used in the existing Ca2+ diffusional model in order to permit comparisons between the results of the two studies (Bardsley et al., 2021). It then successively incorporated contributions from cytosolic K+ and Cl−, Donnan protein, and Ca2+ buffers and then additionally examined the effects of the consequent [Ca2+] patterns on the membrane potential and surface charge, providing a physiologically realistic analysis of T-SR junctional Ca2+ domain formation and properties.
This analysis involved four main anatomical or computational steps (Figure 1, columns 1 and 2): (1) the domain was defined using previously characterised and adopted dimensions of the junction, cytosolic ion concentrations, and expected fluxes and (2) the equations defining ion behaviour were applied to generate a functional model, including those defining the possible roles of counterions. This analysis of inorganic ion fluxes then (i) added electrodiffusion to the previous purely diffusive analyses that had described free Ca2+ fluxes and their contribution to microdomain formation. It next (ii) superimposed electrodiffusive flux contributions of other major in vivo inorganic K+ and Cl−, as well as Donnan proteins. This explored the extent to which (i) charge build-up from Ca2+ release into a restricted T-SR space generated additional forces for microdomain dissipation, which could reduce accumulated Ca2+. Contrastingly, (ii) the resulting fluxes of the highly mobile Cl− and K+ counterions could dissipate this charge build-up, reducing the electric potentials generated by Ca2+ accumulation, permitting increased maximal [Ca2+].
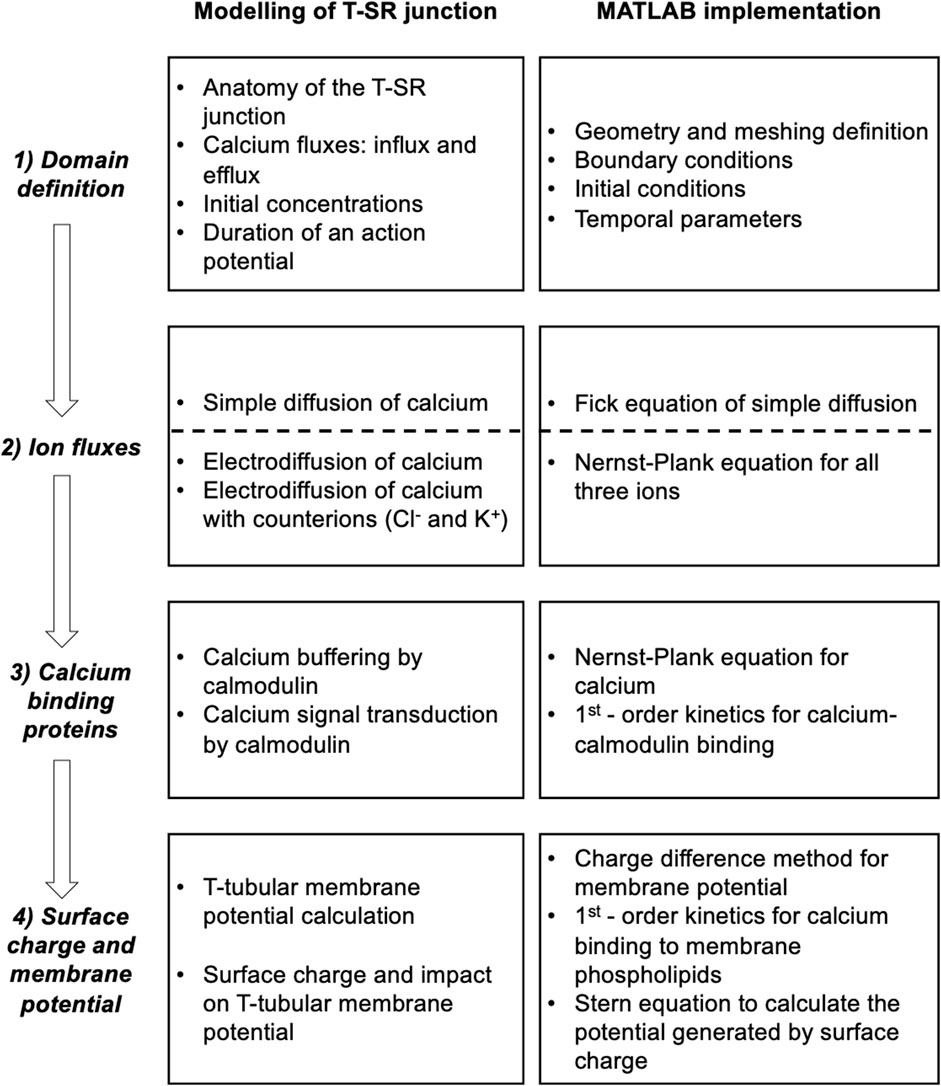
Figure 1. Development and implementation of the T-SR junctional domain model. Successive modelling (left) and implementation steps (right) from (1) definition of the T-SR junction domain model, followed by the progressive implementation of (2) diffusive and electrodiffusive counterion ion fluxes, (3) Ca2+ buffers within the domain, and (4) charge difference and surface charge effects on cell membrane potentials.
Modelling was then extended, exploring contributions of biological molecules including cytosolic Ca2+-binding proteins and phospholipids of the enclosing membrane to microdomain formation and properties. These further steps comprised (3) exploring contributions of cytosolic Ca2+ buffers to microdomain formation. For example, binding of Ca2+ to Ca2+-binding proteins, giving rise to a concentration of bound Ca2+, [Ca2+]bound, could further affect the free Ca2+ concentrations, [Ca2+]free, effective Ca2+ diffusion rates, and the total T-SR junction cytosolic Ca2+ concentration, [Ca2+]. Cytosolic Ca2+-binding proteins, besides buffering free Ca2+, potentially subserve transduction roles, generating physiologically important signals, and (4) examining the consequences of the consequent charge accumulation on the T-tubule membrane potential. Thus, the altered cytosolic [Ca2+]free itself could modify tubular and SR membrane potential through both Gaussian effects of the net charge difference and through changes in membrane surface charge densities generated by the free Ca2+, with possible consequences for voltage-gated membrane protein function.
This more realistic and complete Ca2+ domain description could shed light on the factors affecting microdomain formation and their implications for its contained regulatory and signalling properties. The above steps are discussed in forthcoming sections.
2.2 Definition of domain geometry and meshing
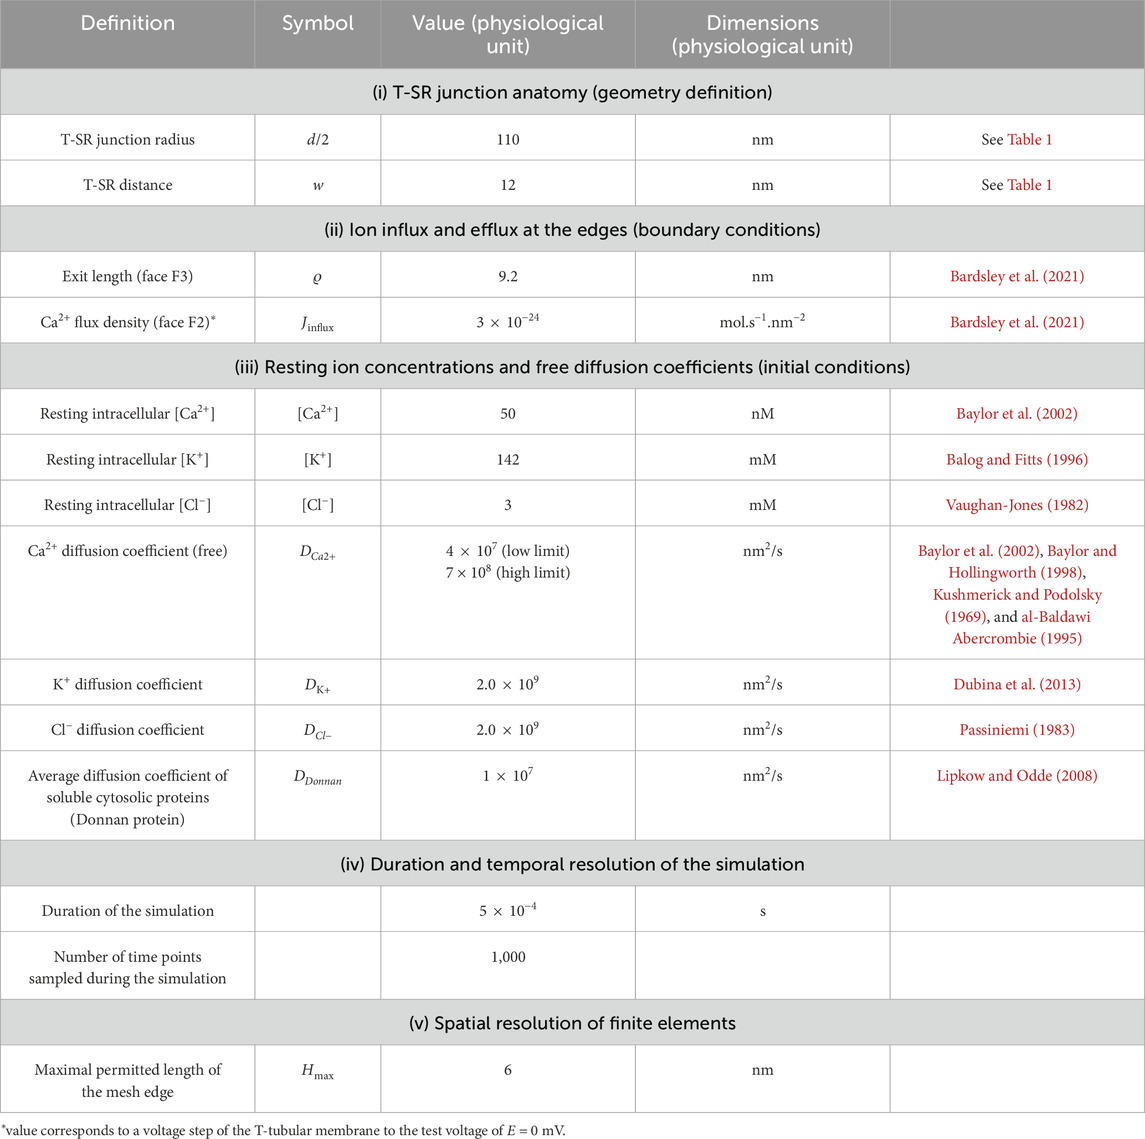
The equations used in the MATLAB PDE Toolbox correspondingly defined the model’s boundary conditions (BCs), simple ion diffusion, ion electrodiffusion, Ca2+–calmodulin (CaM) binding, and consequent bulk and surface membrane potentials (Figure 1, column 2). Table 1 summarises (i) previously reported overall geometrical and capacitative properties of amphibian skeletal muscle used to calculate (ii) key sarcomere and tubular membrane surface areas and sarcomere volumes. These were combined with (iii) previously reported electron microscopically measured dimensions to derive a geometrical model of the T-SR junction along previously reported lines (Bardsley et al., 2021). This further made it possible (iv) to quantify the numbers of T-SR junctions required to replicate previously reported Ca2+ release fluxes. The resulting formalised representation of a given T-SR junction was a cylinder, with radius d/2 = 110 nm and w = 12 nm (Figure 2). In Figure 2A, F1 represents the T-tubular membrane, and F2, the SR membrane. The F3 face opens onto the bulk cytosol. Figure 2B shows the subdivision into finite elements (meshing) of the volume for finite element analysis. The Toolbox meshes the volume into tetrahedrons of maximal edge length Hmax. Meshing was generated de novo on every run, explaining potential inter-run variability. Nevertheless, spatial resolution was set high enough (Hmax
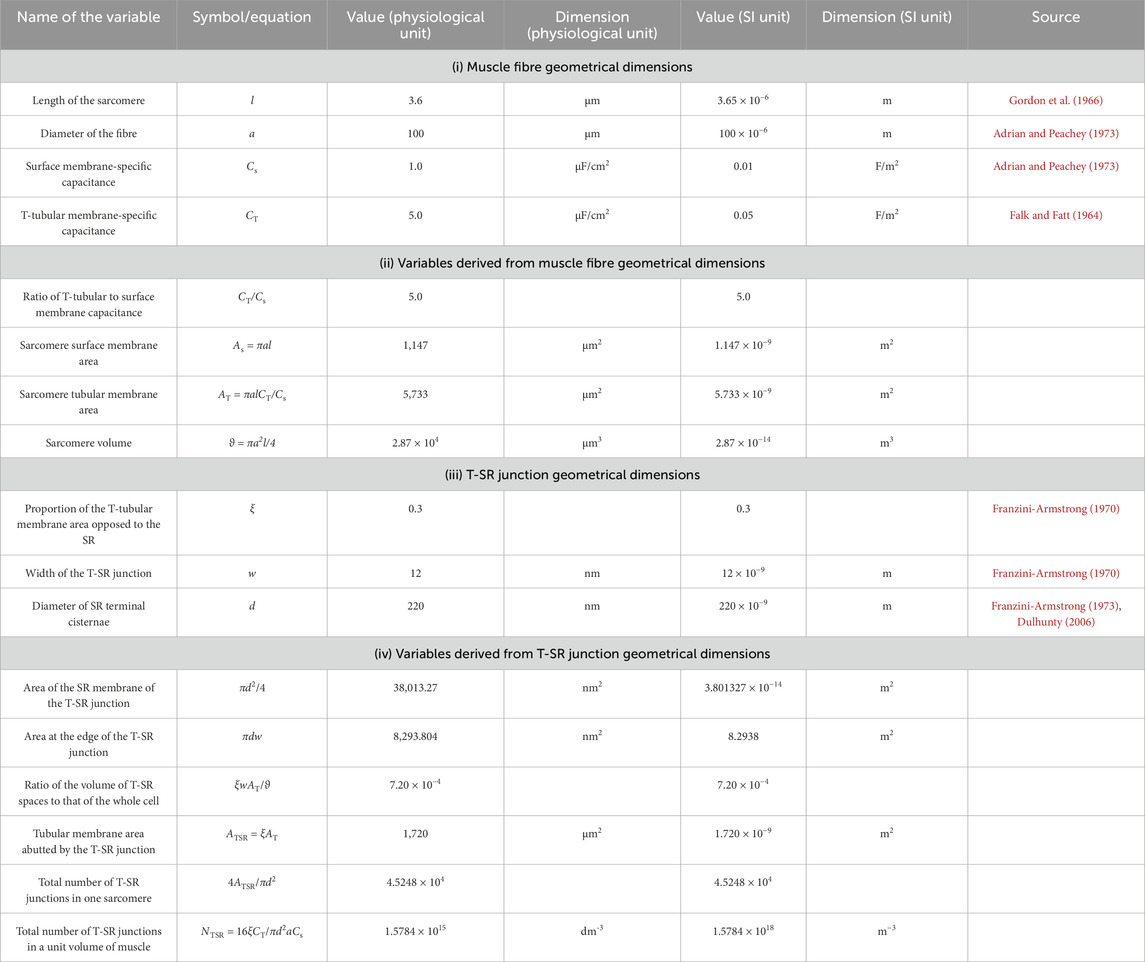
Table 1. Structural characteristics of amphibian skeletal muscle fibres and transverse tubular–sarcoplasmic reticular (T-SR) junctions.
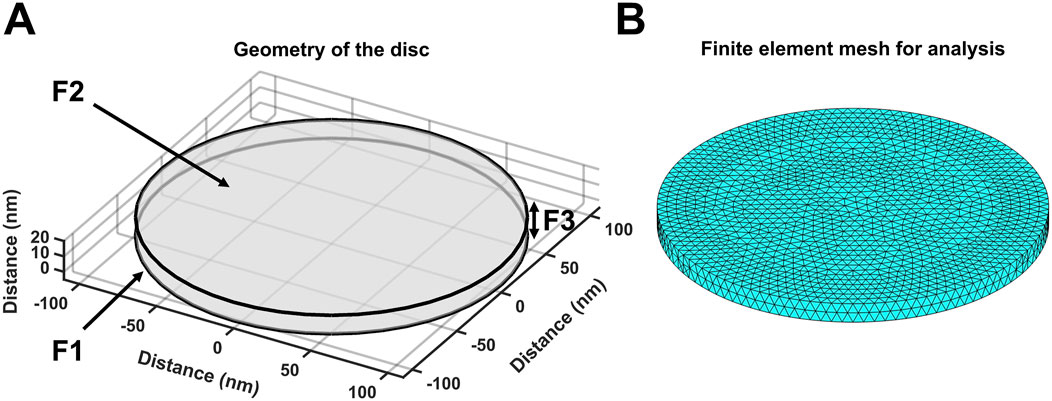
Figure 2. Geometry and mesh representation of a T-SR junction. (A) Modelled T-SR junction geometry, where the T-tubular (F1) and SR (F2) membranes are closely apposed. The F3 face opens onto the bulk cytosol of the skeletal myocyte. The junction has diameter d = 220 nm in the radial (XY) plane, and the membranes are separated by a junctional gap of only w = 12 nm in the axial (Z) plane. This membrane-enclosed compartment restricts the diffusion of Ca2+, allowing high-[Ca2+] build-up. (B) Finite element meshing of the volume into tetrahedrons of maximal edge length Hmax = 6 nm.
2.3 Domain flux boundary and initial modelling conditions
The initial conditions for the start of the modelling process assumed uniform resting ion concentrations equal to their corresponding bulk cytosolic concentrations (Table 2). Neumann BCs were used to describe Ca2+ fluxes in and out of the geometry at the edges of the domain, entering and leaving the junction. These set the derivative at each boundary to be equal to a constant. In MATLAB, Neumann BCs are defined as in Equation 1:
with
We adopted simple, standardised excitation parameters of Ca2+ flux through F2 corresponding to full activation at a test voltage of 0 mV. This Ca2+ release influx density at each individual T-SR junction, Jinflux, was calculated from previously reported experimental overall initial rates of SR Ca2+ release, d[Ca2+]/dt (Kovacs et al., 1983). This yields the Ca2+ influx,
The Ca2+ efflux through the face F3 opening onto the bulk cytosol,
2.4 Diffusive and electrodiffusive fluxes
The partial differential equations (PDEs) exploring T-SR junction ion fluxes and accumulation were adapted to a format solvable by the MATLAB PDE Toolbox:
The concentration term, c, of each diffusible species, j, is a function of both radial position, r, within the T-SR junction and time t, following initiation of ion influx, cj = ψ(r, t). The coefficients
Given that
These simplify Equation 4 to give Equation 7:
The physical constants used in the following computational solution of the equations adopted standard physically accepted symbols and values: Faraday’s constant, F = 96,485.309 C/mol; gas constant, R = 8.314511 J/(K.mol); elementary charge, e = 1.60217 × 10⁻¹⁹ C; free space permittivity, ε0 = 8.854187817 × 10⁻²¹ F/nm; cytoplasmic relative permittivity, εc = 80 (Spencer and Morgan, 2020); and Avogadro’s number, NA = 6.0221367 × 10²³/mol.
Of the adopted flux equations, first, the Fick equation models diffusive fluxes in response to concentration gradients. For diffusion in three dimensions,
with
Second, the Nernst–Plank equation (Equation 10) models electrodiffusive fluxes driven by both concentration and voltage terms:
with
Equation 11 is in both concentration c and electric potential
Second, the Poisson equation expresses
Third,
Since the T-SR space is flat and thin, its radius (d/2) greatly exceeds its width w, and so, w << d. Accordingly, the surface area of the rim of the T-SR junction, F3, is much smaller than the surface area of the enclosing F1 and F2 membranes, πdw << πd2/4, within which time- and space-dependent transmembrane T-tubular and SR potential changes ∆V tend to
So, the quantity of charge, δq, within a given annulus is
As the thickness
Since membrane capacitance
Finally, substituting Equation 16 into Equation 18 yields
Hence,
Combining Equations 12, 20 yields
Comparing terms for Equations 4, 21 yields the coefficients listed in Equation 22:
Nernst–Planck modelling was applied to electrodiffusion first of [Ca2+], subsequently adding contributions of [K+] and [Cl−]. In both cases, it additionally included soluble, negatively charged, intracellular membrane-impermeable Donnan proteins at concentrations [Donnan], resulting in bulk T-SR cytosolic electroneutrality at time t = 0 (Table 2).
2.5 Modelling intradomain Ca2+ buffers
The presence of CaM was next modelled as having a uniform concentration throughout the T-SR junctional region. Assuming a finite pool of Ca2+ and CaM reversibly binding to produce Ca2+-CaM, the total Ca2+ concentration, [Ca2+] = [Ca2+]total, now comprises contributions from free, [Ca2+]free, and bound Ca2+, [Ca2+]bound:
Correspondingly, the total CaM concentration [CaM] comprises free, [CaM]free, and bound [CaM-Ca2+] components:
At every step taken by the solver, for each node of the mesh, [Ca2+-CaM] is approximated by
Expressing dissociation constant Kd,
Equations 25, 26 derive from the definition of
The overall Ca2+ diffusive fluxes are now determined by an effective diffusion coefficient
Finally, the exit boundary condition in Equation 3 is revised to
2.6 The net Ca2+ accumulation in the T-SR junction
The net rate at which Ca2+ is trapped within the T-SR junction whether as [Ca2+]free or [Ca2+]bound in the presence or absence of CaM can be directly determined from balancing the magnitude of the boundary Ca2+ influxes and effluxes. The Ca2+ influx density through the SR membrane face F2, Jinflux, is constant whether CaM is present or absent. The overall influx rate into a single T-SR junction of diameter d (Equation 29) can then be obtained from the flux density into each T-SR junction (Equation 2):
The Ca2+ efflux at the T-SR junctional edge face F3, axial distance w, opening onto the bulk cytosol, as a function of time (Equation 30) is determined by the exit boundary condition in Equation 28:
The net rate of T-SR junction Ca2+ accumulation or trapping at any given time τ is then the difference (Equation 31):
Accordingly, the mean [Ca2+], averaged through the entire T-SR space, at any given time,
Correspondingly, <[Ca2+]>τ is also obtainable from the spatial integral through the cross-sectional area of the T-SR junction of the actual concentrations through the cross-sectional area of the T-SR junction at the end of the same time interval (0, τ). Here, the constant term before the integral is the inverse total volume of the T-SR gap junctional region, and the
A comparison of the time and spatial integrals in Equations 32, 33 evaluating <[Ca2+]>τ provides tests for overall Ca2+ conservation throughout the time interval (0, τ), which is discussed in Results.
2.7 Effects on transmembrane potentials
[Ca2+] and [Ca2+]free influence the transmembrane potential change, ∆V, in two independent ways. Both in turn could influence the function in voltage-sensitive, including T-tubular membrane, proteins. First, accumulation of charged particles in the T-SR space increases its cytosolic potential Vi, thereby affecting ∆V. Each T-SR space annular element has width
Combining Equation 34 with Equation 19 for its contained electric potential
This is identical in form to the previously introduced charge difference equation predicting membrane potentials from intracellular electrolyte concentrations independent of assumptions of Nernst equilibrium or steady-state ion fluxes required by the classical Goldman–Hodgkin–Katz equation (Fraser and Huang, 2004; Goldman, 1943). This previous application had made resting potential predictions consistent with established experimental analyses (Mullins and Noda, 1963) of equilibrium (
The change in
Ca2+–protein binding/unbinding does not affect ∆
Second, membrane phospholipids contain high negative intracellular and extracellular surface-charge densities,
with
with k being the Boltzmann constant and
The effects of this surface charge extend for a few nm from the membrane, a distance comparable to the 12-nm T-SR gap with its membranes on both sides, with potential significance.
Furthermore, the surface charge modifies the resulting transmembrane potential profile and the consequent actual transmembrane potential ∆V (Figure 3). The latter depends on both the overall transmembrane potential decrease between the respective bulk cytosolic, Vi, and extracellular potentials, Vo, and inner- and outer-membrane leaflet surface charge contributions, ∆Vσi(0) and ∆Vσo(0), respectively, dependent on
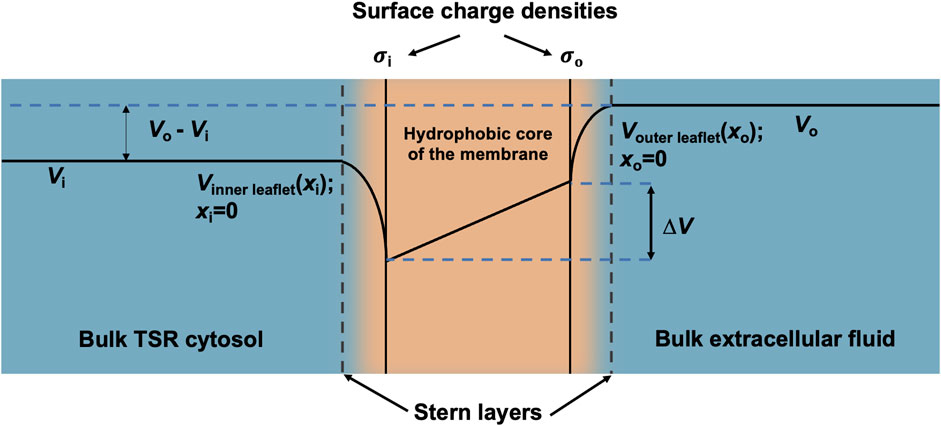
Figure 3. Surface charge density and electric potential in the Stern layers. Typical profile of electric potential across the plasma membrane (not to scale) containing a hydrophobic core and separating the bulk T-SR cytosol and extracellular fluid. In the present analysis, Vi, the bulk cytosolic potential, is subject to change by net charge differences in the intracellular space, whereas Vo, the bulk extracellular potential, is constant. The Stern layer where the electrical potential is lower than expected due to the presence of a negative surface charge on the intracellular and extracellular faces of the plasma membrane (
3 Materials and methods
Table 3 summarises the computational implementation of the equations derived in Theory. Modelling was performed on MATLAB (R 2023a, Update 5) using the PDE Toolbox. The equations were solved using a 2020 Mac Book Pro (Apple M1 chip, 8 GB RAM). The modelling process followed the previously described optimised pipeline (Bardsley et al., 2021), involving the following steps (for computational source listings, see Supplementary Material): 1) geometry generation: generating the cylinder representing the T-SR junction according to specified dimensions; 2) meshing of the T-SR junction into finite elements; 3) solving of the PDE(s) using the specified coefficients, initial conditions, and BCs; and 4) plotting: extracting, processing, and plotting the data from the solver. The solutions involving four simultaneous PDEs involving Ca2+, K+, Cl−, and Donnan protein, as opposed to a single PDE involving Ca2+ with Neumann BCs, caused excessively long running times. These reflected the computationally expensive exit-length based Neumann BCs describing ion diffusion from the T-SR space into the bulk cytosol at face F3. Such computational cost did not scale linearly with the sequential addition of more equations. For example, at a resolution of Hmax = 12 nm, a one-equation model required 60 s and a two-equation model required 50 min to solve, and models with three and four equations were unsolvable. This was dealt with by utilising a mixed set of F3 boundary conditions. Ca2+ diffusion from T-SR into the bulk cytosol used the Neumann BC previously shown to be consistent with experimental measurements (Bardsley et al., 2021). The remaining counterions were modelled with computationally cheaper Dirichlet BCs. Instead of defining a flux orthogonal to the F3 face, this modelled a fixed value for the solution u at F3, where, as adopted by the PDE Toolbox,
4 Results
4.1 Domain definition and initial conditions
Table 1 summarises determinations of the domain structure and dimensions from established electron microscopic anatomical data aligned, therefore ensuring comparability with earlier reports (Bardsley et al., 2021). (i) Reported values of muscle fibre geometrical dimensions of sarcomere length, l, fibre diameter, a, and surface, Cs, and tubular, CT, membrane capacitances (Adrian and Peachey, 1973; Falk and Fatt, 1964; Gordon et al., 1966) were used to derive (ii) values of the ratio of T-tubular to surface membrane capacitance, CT/Cs, and the sarcomere surface membrane area, As, tubular membrane area, AT, and volume,
The initial conditions listed in Table 2 (i) combine the T-SR gap geometry with details of its meshing for finite element analysis. (ii) They determined the BCs concerning (a) the adopted value of Ca2+ influx into each T-SR junction. This was obtained from previous reports, in which a voltage step to test membrane potential, E = 0 mV, yielded a maximum rate of [Ca2+] increase, d[Ca2+]/dt = 180 μmol/(dm3 s), elevating the bulk peak cytosolic calcium concentration to [Ca2+]max = 3.161 μmol/dm3 (Kovacs et al., 1983). Combining this with the values given in Table 1 yielded a Ca2+ flux density into the T-SR junction, Jinflux = 3.00 × 10⁻²⁴ mol/(nm2 s), corresponding to a Ca2+ flux into each T-SR junction, Φinflux = 1.14 × 10⁻¹⁹ mol/s and (b) the exit length ϱ, = 9.2 nm. This represented Ca2+ diffusion into a well-stirred cytosol, in which it is continuously sequestered by SERCA activity, providing overall flux conservation between cytosolic and SR compartments, derived from previous solutions (Bardsley et al., 2021). They also included (iii) values of adopted counterion concentrations and their diffusion coefficients when these were included in the computational solutions and (iv) duration and temporal and (v) mesh resolution of each run.
The reported values of the biological diffusion coefficient, DCa, vary under different conditions over a range of ∼107 nm2 s−1–108 nm2 s−1, the lowest empirical values extending to mini-electrode technique measurements of 1.0 × 10⁷ nm2 s−1 in Myxicola axoplasm with intact Ca-sequestering organelles most realistically reflecting bulk cytosolic physiological conditions (al-Baldawi and Abercrombie, 1995). However, the present studies sought to investigate Ca2+ diffusion or accumulation in a restricted T-SR space potentially not representative of the whole-cell cytoplasm. Nevertheless, we could perform and compare results from computations using low and high limits for DCa, spanning the reported range covering both possibilities.
Adopting the value provided by Baylor and Hollingworth (1998) of DCa2+ = 7 × 10⁸ nm2 s−1 allows for the myoplasmic viscosity being two-fold higher than that of a simple salt solution (Kushmerick and Podolsky, 1969). It also assumes an absence of (1) Ca2+-sequestering membrane-bound organelles and (2) cytoplasmic Ca2+ buffers. Within the restricted T-SR space, condition (1) is likely fulfilled but not condition (2): even the T-SR-restricted space likely includes a Ca2+ buffer additional to CaM that could affect DCa2+. Including the entire bulk cytoplasmic Ca2+-binding capacity yielded a 50-fold DCa2+ reduction, predicting a lower limit of DCa2+ = 2.8 × 10⁷ nm2 s−1 (Kushmerick and Podolsky, 1969). Nevertheless, adopting DCa2+ = 7 × 10⁸ nm2 s−1 provided an upper computational limit that could be compared with findings from a lower DCa limit of 4.0 × 10⁷ nm2 s−1 derived from the lower end of the range 5–20 × 107 nm2 s−1 determined from empirical isotope and mini-electrode measurements in ATP-depleted Myxicola axoplasm (al-Baldawi and Abercrombie, 1995). It was therefore possible to compare findings and assess the sensitivity of the computational outcomes to DCa2+ through these orders of magnitude.
4.2 Simple free-Ca2+ diffusion modelled using the Fick equation
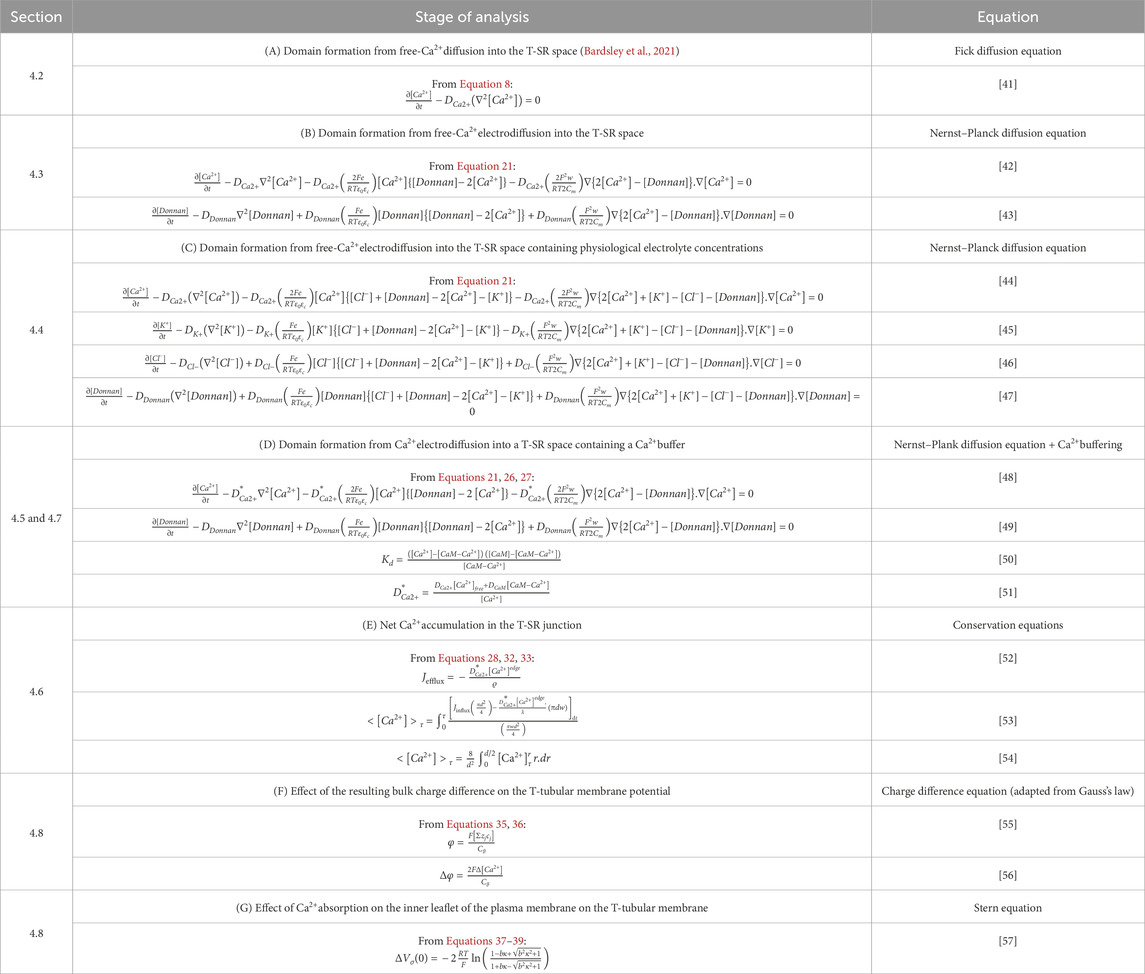
As indicated above (Section 2.1), our diffusional modelling first progressively investigated fluxes of free ions within the T-SR junction, advancing from Fick to Nernst–Planck analysis and from fluxes of Ca2+ alone to an inclusion of the remaining intracellular, inorganic, and Donnan ions occurring in vivo. We first modelled simple Ca2+ diffusion and Ca2+ microdomain formation during imposed depolarisation using Fick’s law (implemented as in Table 3 A; Equation 41). Figure 4 confirms the formation of high-[Ca2+] microdomains at both the low (Figure 4I) and high (Figure 4I) limiting DCa values to different extents and kinetics. It demonstrates (A–C) radial (A) and axial (B, C) steady-state T-SR junctional [Ca2+] profiles reached by 0.5 ms. (A) and (C) conserve the original proportions of the geometry to visualise the spatial [Ca2+] profile, while (B) is distorted for clarity. (D) and (E) show the evolution of [Ca2+] concentration over time. The colour of traces in (D) corresponds to the markers in (C). At the low DCa limit, a maximum concentration of 22 µM was achieved in the region in the centre of the junction (Figure 4ID). [Ca2+] decreased to 3 μM at equilibrium with the bulk cytosolic [Ca2+] at the edge. The microdomain was almost fully formed 0.25 ms after the voltage step, maintaining its steady state thereafter (Figure 4IE). At the high DCa limit (Figure 4II), a maximum concentration of 2.9 µM was reached at the centre of the junction (Figure 4IID), and [Ca2+] decreased to 0.4 μM at equilibrium with the bulk cytosolic [Ca2+] at the edge. The microdomain was fully formed by 0.2 ms after the voltage step (Figure 4IIE).
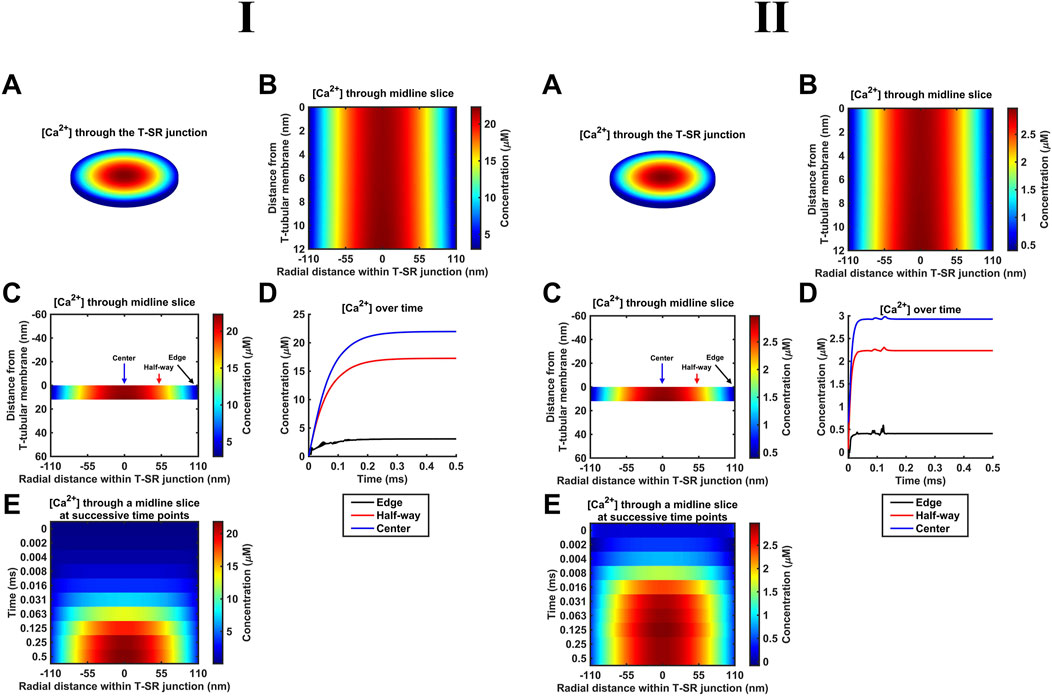
Figure 4. Principal results from a simple Ca2+ diffusion model. (A–C) Steady-state T-SR junction [Ca2+] profiles, obtained at 0.5 ms. (A,C) conserve the original proportions of the geometry to illustrate the spatial [Ca2+] profile, and (B) is distorted for clarity. In (I), note the 22-µM [Ca2+] region in the centre of the junction and [Ca2+] decreasing to 3 μM at the edge. (D, E) Evolution of [Ca2+] concentration over time. Colours of traces in (D) correspond to the markers in (C). A concentration of 20 µM at the centre of the T-SR junction is reached in 0.15 ms. The microdomain adopts and maintains its steady-state profile by 0.25 ms. Studies made at Ca2+ diffusion coefficients at low and high limits of DCa = 4
These results are consistent with the previous findings (Bardsley et al., 2021). The noise in some of the [Ca2+] traces (Figure 4D, edge) is attributable to the stiff nature of the Neumann BC used to model Ca2+ flux through face F3. The noise could be reduced by increasing the temporal resolution. This greatly increased the processing time without altering the final steady state; the temporal resolution given in Table 2 was sufficient for our objectives.
4.3 Modelling Ca2+ electrodiffusion with the Nernst–Plank equation
The succeeding modelling stages considered contributions of both electrical potential and concentration gradients using the Nernst–Plank equation. These began with their application (Table 3 B, Equations 42, 43) to the Ca2+ fluxes introduced above. Thus, the concentration gradient resulting from Ca2+ accumulation in the T-SR junction, in turn, generates charge gradient and voltage differences. Figure 5 shows the resulting steady-state T-SR junction [Ca2+] profile at 0.5 ms (A) and the time evolution of [Ca2+] changes, following stimulus application (B, C) obtained at the low (Figure 5I) and high DCa limits (Figure 5II). As in the previous case, the flattened T-SR junctional geometry (Figure 5B) prevented the formation of axial gradients from the SR to T-tubular membrane but permitted significant radial concentration and charge gradients. Nevertheless, incorporation of the electrical potential term did not notably affect either the kinetics or steady-state features of domain formation. As before, [Ca2+] decreased from 22 µM in the centre to 3 μM (Figure 5I) and 2.9 µM to 0.4 µM at the edge at the low and high DCa limits (Figure 5II), respectively. Furthermore, Figure 5D shows the difference between the heatmap in Figure 4A and the heatmap in panel A here. The uniformity indicates that there is no detectable difference in [Ca2+] after the addition of electrodiffusion to the model at either DCa investigated.
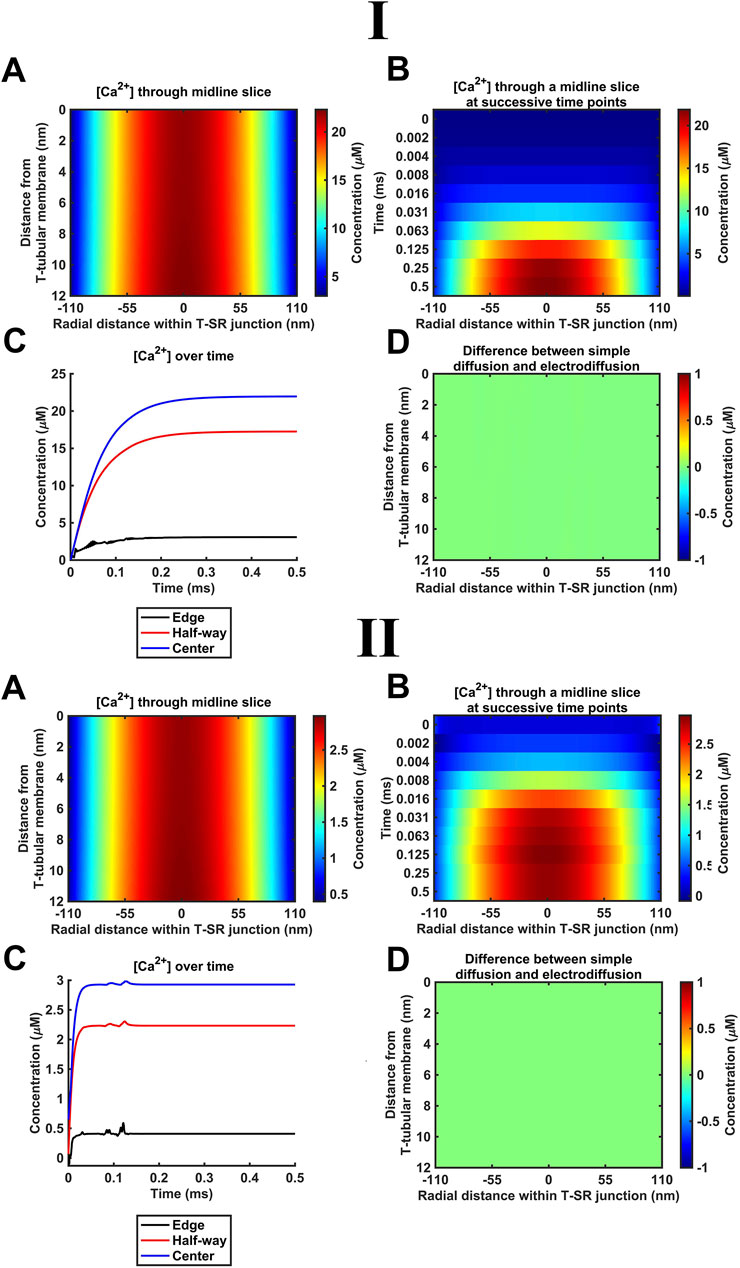
Figure 5. Introducing Ca2+ electrodiffusion to the model of the T-SR junction. (A) T-SR junctional [Ca2+] profile in the steady state (after 0.5 ms). (B,C) Time-dependent changes in [Ca2+]. (D) Difference between the heatmap in Figure 4A and the heatmap in (A) here. Note that the uniform green colour indicates no detectable difference in [Ca2+] after the incorporation of full electrodiffusion terms in the model. Studies made at Ca2+ diffusion coefficients at low and high limits of DCa = 4
4.4 Introducing counterions to the T-SR junction electrodiffusive model
K+ and Cl− constitute the remaining major intracellular ions. However, they occur at mM concentrations, as opposed to the μM [Ca2+] concentrations considered here. Depending on the adopted low (Figure 6I) or high (Figure 6II) DCa limits, they would be 100- or 3-fold more diffusible than Ca2+. Their contributions were next included by introducing separate equations for their electrodiffusion (Table 3 C, Equations 44–47). Nevertheless, consistent with the above finding that the Ca2+ electrical potential term incorporated as part of the Nernst–Plank equation had little impact on Ca2+ distribution, neither did adding terms for K+ and Cl−, whether at the low (Figure 6I) or high (Figure 6II) DCa values studied. Figures 6A, C, E show steady-state heatmaps of [Ca2+], [Cl−], and [K+] profiles, respectively. The profiles shown in Figure 6A were similar to those of Figures 4A, 5A, suggesting unaffected [Ca2+] distributions.
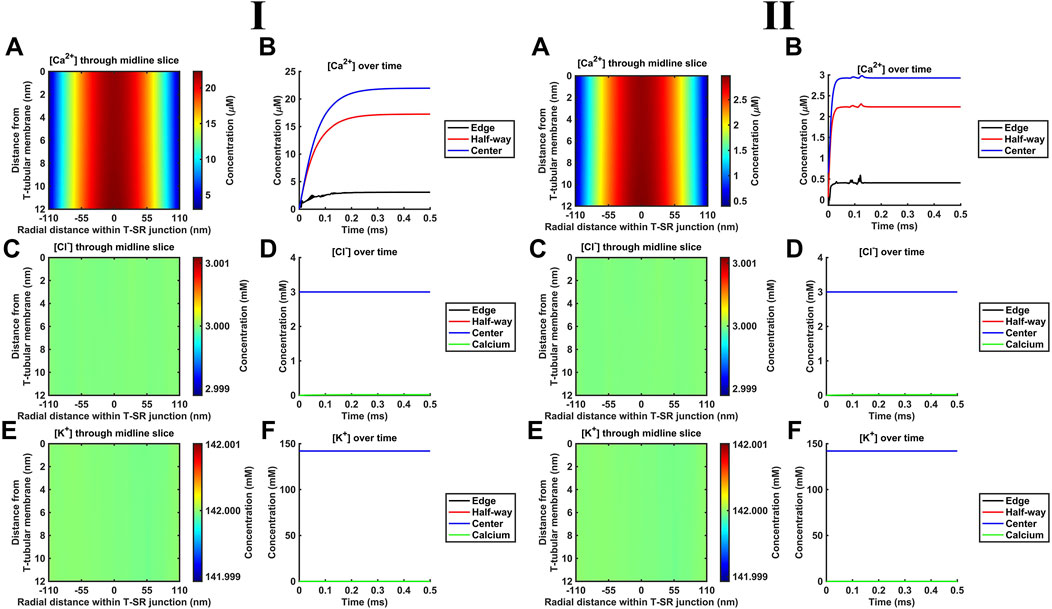
Figure 6. Introducing counterions (Cl− and K+) to the electrodiffusive model. (A,C,E) Heatmaps of the respective steady-state [Ca2+], [Cl−], and [K+] profiles. Note similar profiles in A, as in Figures 4A, 5A, and uniform green colour in (C, E), highlighting a uniform T-SR junction [Cl−] and [K+] remaining constant and equal to resting conditions. (B) Time-dependent [Ca2+] changes consistent with those given in Figures 4D, 5C. (D,F) Time-dependent changes in [Cl−] and [K+] relative to [Ca2+]centre. [Cl−] and [K+] remain constant, with the counterions unaffected by the accumulation of Ca2+ in the junction. Changes in [Ca2+]centre are negligible relative to [Cl−] and [K+]. Studies made at Ca2+ diffusion coefficients at low and high limits of DCa = 4
Furthermore, Figure 6B shows time-dependent changes in [Ca2+] identical to those seen in Figures 5D, 6C. Furthermore, [Cl−] and [K+] were unaffected by the release of Ca2+ during depolarisation, remaining constant during Ca2+ microdomain formation. The uniformity in Figures 6C, E indicates that [Cl−] and [K+] in the T-SR junction remain constant and equal to resting conditions. In plots of the time-dependent changes in [Cl−] and [K+] relative to the Ca2+ concentration at the centre of the domain, [Ca2+]centre (Figures 6D, F), [Cl−], and [K+] remained constant, accordingly unaffected by the junctional Ca2+ accumulation. Changes in [Ca2+]centre were negligible relative to [Cl−] and [K+].
These control findings suggest that the magnitude of the in vivo T-SR junction µM [Ca2+] gradients did not have major physical effects on the concentrations of either Ca2+ or the remaining electrolyte, present at mM concentrations, whether at the low or high DCa limits. This has implications for the relative contributions of concentration and electrical terms on the solved Nernst–Plank equations. This notion was tested in simulations exploring the hypothetical effect of increasing Ca2+ flux through the SR membrane by 106-fold at the low DCa limit (Figure 7). [Cl−] and [K+] profiles were now affected by the accumulation of a divalent cation in the T-SR junction and the subsequent charge gradient generated. Figures 7A, B show heatmaps for the steady-state spatial profiles of [Cl−] and [K+]. Figures 7C, D show the corresponding time-dependent [Cl−] and [K+] changes. They suggest that the negatively charged Cl− is concentrated by the accumulation of positive Ca2+ in the centre of the T-SR junction, while the positively charged K+ was repelled.
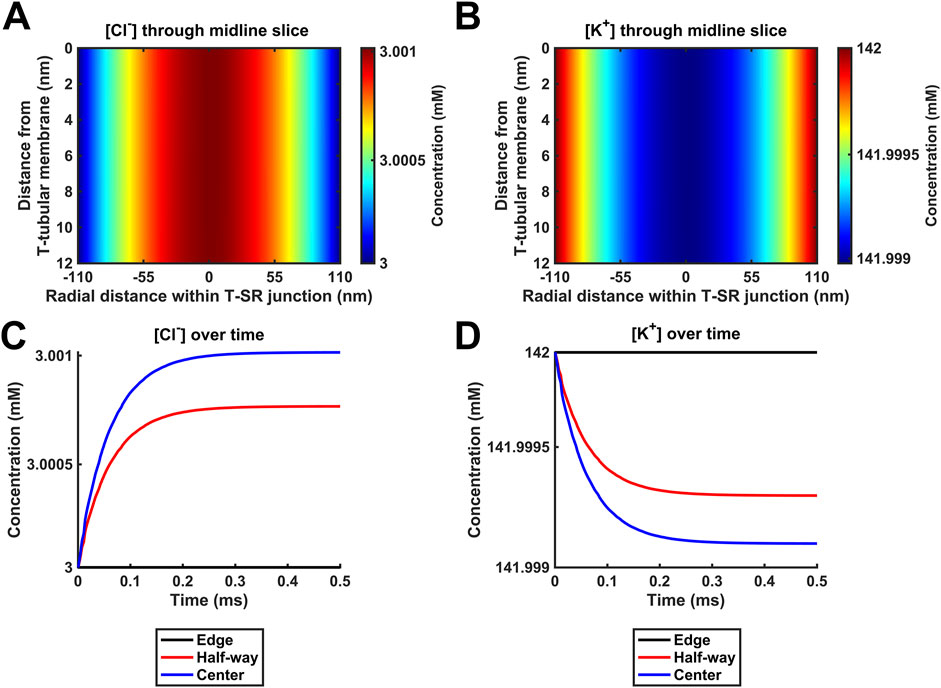
Figure 7. Positive control for the modelling of T-SR junction electrodiffusion. Hypothetical behaviour of Cl− and K+ with 106-fold increases in Ca2+ release from the SR beyond any physiologically attainable levels. (A,B) Heatmaps of the spatial profile of [Cl−] and [K+], respectively. (C,D) Time-dependent changes in [Cl−] and [K+]. Note that in this situation, [Cl−] and [K+] profiles are affected by the accumulation of a divalent cation in the T-SR junction and the subsequent charge gradient generated. The negatively charged Cl− is concentrated by the accumulation of positive Ca2+ in the centre of the T-SR junction, while the positively charged K+ is repelled. Study made at Ca2+ diffusion coefficients at the low limit of DCa = 4
The extensions of the original diffusion analysis of T-SR Ca2+ fluxes and concentrations following voltage induced SR Ca2+ release then proceeded from this Nernst–Planck analysis. It successively added to the analysis major intracellular electrolytes, Ca2+ buffering, bulk charge differences, and membrane surface-charge properties. Together, these resulted in a more physiologically realistic study of the resulting Ca2+ microdomains.
4.5 Modelling Ca2+ buffering
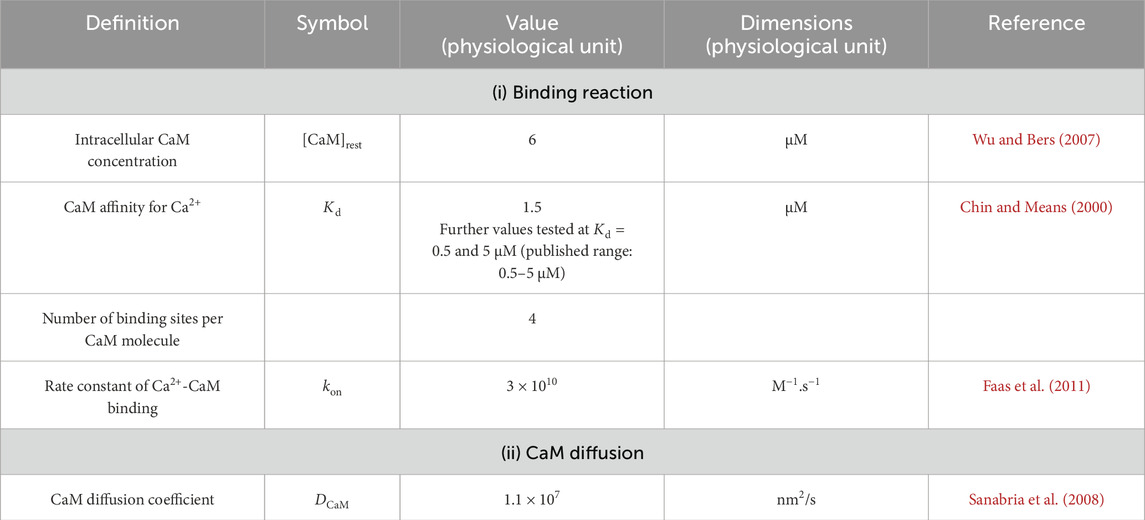
In the cytoplasm of skeletal myocytes, the major classes of Ca2+-binding proteins are Ca2+ buffers. Of these, comparisons of the major buffers CaM, troponin, parvalbumin, and myosin suggested that CaM and troponin were the most important in buffering large rapid changes in [Ca2+] (Robertson et al., 1981). However, troponin is restricted to the myofilaments, while CaM is mobile throughout the cell. Furthermore, CaM is the most important mobile buffer in the cytosol of skeletal myocytes (Pertille et al., 2010). It is also the major transducer of Ca2+ signals. It acts directly by modulating the activity of target molecules such as the RyR (McCarthy et al., 2020) and Nav (Salvage et al., 2021) or indirectly by stimulating CaM kinase II (CaMKII) and triggering signalling cascades. Therefore, CaM is an excellent Ca2+-binding protein to model in this context as it illustrates (i) the action of Ca2+ buffers on microdomain formation and (ii) the impact of these resulting microdomains on downstream Ca2+ signalling. Table 4 summarises the values of the main parameters used in CaM modelling.
Figure 8 summarises the impact of CaM on T-SR junctional [Ca2+], following the activation of SR Ca2+ release at the low (Figure 8I) and high DCa limits (Figure 8II). The modelling (Table 3 D, Equations 47–51) used the Nernst–Planck equation with no counterions other than the Donnan protein as the previous analyses showed that these only negligibly impacted Ca2+ microdomain formation but greatly increased the complexity and computational load entailed by the model. Our model output the free Ca2+ concentration, [Ca2+]free, allowing comparisons with the computations in above and previous studies (Bardsley et al., 2021), the concentration of Ca2+ bound to CaM, [Ca2+]bound, relevant to its physiological regulatory properties, and the total of these concentrations, [Ca2+] = [Ca2+]total, reflecting the effectiveness of Ca2+ microdomain formation. All these parameters reflect the end result of modelling the T-SR geometry, ion-diffusion coefficients, and Ca2+-CaM-binding properties, following activation of SR Ca2+ release into the T-SR space.
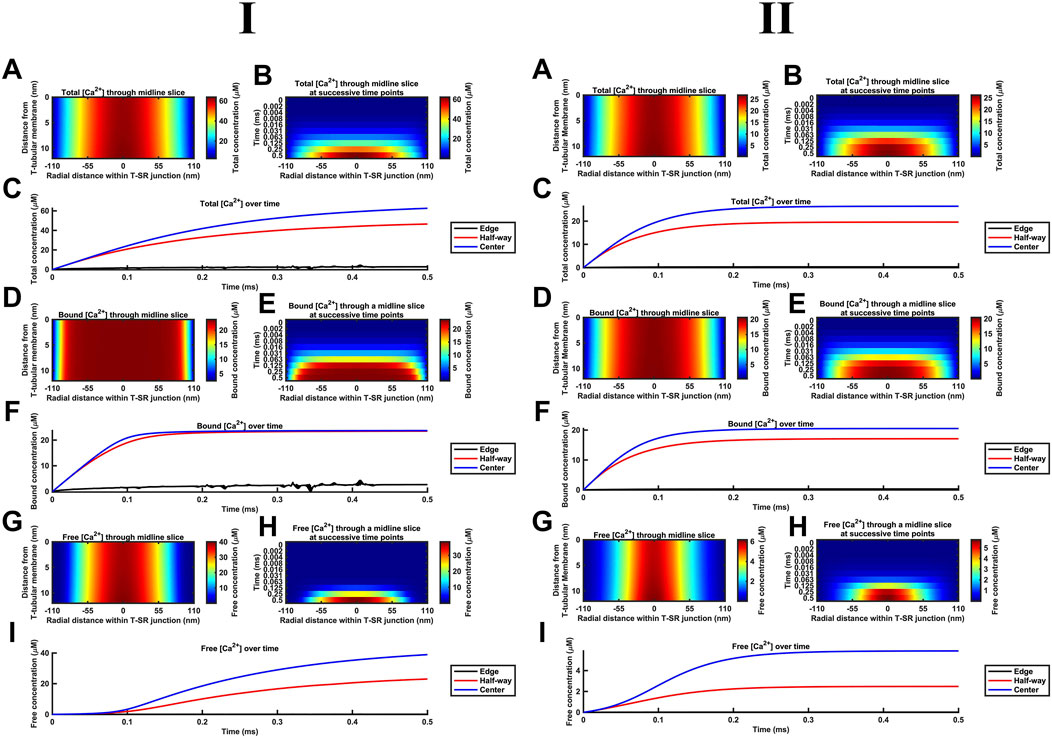
Figure 8. Ca2+ buffering by CaM increases [Ca2+] and [Ca2+]free and modifies microdomain kinetics. Studies made at Ca2+ diffusion coefficients at low and high limits of DCa = 4
First, in the presence of buffer, the spatial (Figures 8A, B) and temporal [Ca2+] profiles (Figure 8C) demonstrated larger eventual increases in [Ca2+] than in modelling situations without Ca2+ buffers, reaching differing maximal [Ca2+] of 60 and 30 μM at the low and high DCa limits, respectively (Figure 8A). The corresponding spatial (Figures 8D, E) and temporal [Ca2+]bound profiles (Figure 8F) demonstrate that CaM was saturated throughout most of the T-SR junction, with [Ca2+]bound reaching more similar maxima of 24 and 20 μM at the low and high DCa limits, respectively (Figure 8D). Nevertheless, the concentration decreased sharply at the edges to extents more marked in the low DCa limit, whence [Ca2+]bound did not exceed 3 μM at the edges of the domain (Figure 8E). Finally, the spatial (Figures 8G, H) and temporal [Ca2+]free profiles (Figure 8I) demonstrate spatial [Ca2+]free profiles after 0.5 ms, differing from that of [Ca2+] at both the low and high DCa limits. Thus, there was a sharper decrease in [Ca2+]free from the centre to the edge of the junction, suggesting that Ca2+ gets heavily buffered once it decreases below a threshold for CaM saturation. However, in the present system in which there is a steady-state Ca2+ flux through as opposed to an equilibrium quantity of Ca2+ within the T-SR junction, [Ca2+]free was not reduced but increased relative to results obtained in the absence of a buffer. However, low and high DCa cases yielded different maximal [Ca2+]free of 40 and 6 µM. Thus, increasing DCa decreased maximal [Ca2+], but this was mainly accounted for by reductions in maximal [Ca2+]free, and there was relatively little change in [Ca2+]bound. [Ca2+]free was maximal in the centre but sharply decreased in the outer half of the junction. Comparing Figures 8A, G revealed that the [Ca2+]free microdomain was highly spatially restricted and almost entirely confined to the inner half of the T-SR junction.
In general, the high [Ca2+] in the centre of the T-SR junction thus overcame the CaM buffering capacity, while the lower [Ca2+] towards the edge was heavily buffered. As such, during microdomain formation, Ca2+ accumulation may transiently and locally exceed buffering capacity, but this does not spread and remains a highly localised phenomenon. Indeed, although CaM was rapidly saturated at the centre of the domain, [Ca2+]bound was low at the edge of the T-SR junction, indicating that a significant buffering capacity remained for CaM.
Second, the presence of a molecule binding and slowing down Ca2+ diffusion also altered the kinetics of microdomain formation. The kinetic portrayals (Figures 8B, C) show a significant slowdown in the kinetics of [Ca2+] microdomain formation. This was more marked with the low DCa values. In the latter case, there was still a significant evolution of the microdomain between 0.25 ms and 0.5 ms (Figure 8B). The [Ca2+] plot against time did not attain a plateau in the interval studied, indicating that steady state was not reached even by 0.5 ms. With the high DCa values, [Ca2+] increased more rapidly, attaining a plateau by 2 ms. In contrast, Figures 8E, F show that [Ca2+]bound increases very rapidly, reaching saturation within 0.1 ms, and with the domain almost fully formed by 0.125 ms with both the low and high DCa values (Figure 8F). However, Figures 8H, I demonstrate that [Ca2+]free increases more slowly than both [Ca2+]bound and [Ca2+], an effect more marked at low DCa. In the latter situation, plots of [Ca2+]free in the centre of the T-SR junction followed a sigmoid evolution, with an initial 0.1-ms lag phase attributable to Ca2+ buffering by CaM (Figure 8I). [Ca2+]free kinetics were considerably more rapid at the high DCa value, reaching their maximum values by 0.2 ms, following the onset of the Ca2+ influx while remaining more rapid than the corresponding [Ca2+] and [Ca2+]bound.
Third, during the early stages of Ca2+ release, most of the Ca2+ was bound by CaM, with little change in [Ca2+]free, while CaM was rapidly saturated at both tested DCa. This shows potential physiological significance: saturated CaM-Ca2+ and free Ca2+ have distinct signalling properties—CaM regulates downstream effectors (e.g., CaMKII, RyR1, Nav, and SK), while free Ca2+ modulates other proteins [e.g., RyR1, Nav, BK, and NCX (see Discussion)] or interacts with voltage-sensitive proteins by means of its charge. Figure 8 also highlights these two important regulators of the T-SR junction evolving with distinct temporal kinetics during an AP: where these two pathways converge (e.g., regulation of RyR1), the actions of CaM and free Ca2+ are staggered due to Ca2+ buffering.
4.6 Buffer-mediated Ca2+ trapping within the T-SR junction
Of potential physiological implications of these features, first, noteworthy were the higher levels of [Ca2+]free attained in the presence of CaM than those in its absence. This is compatible with buffering by CaM reducing the leakage of [Ca2+]free into the bulk cytosol. Ca2+-CaM binding then effectively traps Ca2+ in the T-SR junction, causing the [Ca2+]free microdomain to become spatially restricted (Figure 8G). Such T-SR junctional Ca2+ trapping could be directly modelled by analysing the magnitude of Ca2+ fluxes into and out of the junction in the presence and absence of CaM, at both the low and the high DCa values (Figures 9I, II, respectively; Table 3 E, Equations 52–54). The Ca2+ influxes through the SR membrane face F2 and effluxes through the T-SR junctional edge face F3, opening onto the bulk cytosol.
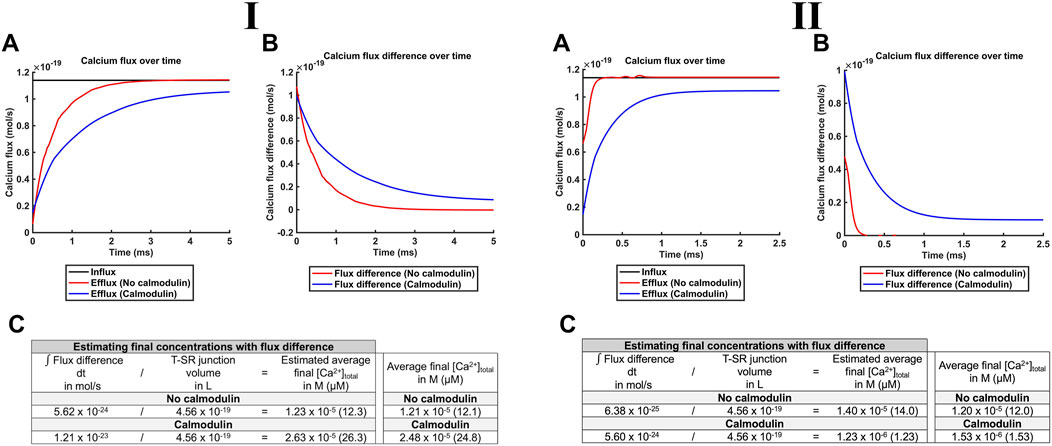
Figure 9. CaM traps Ca2+ in the centre of the T-SR junction, enhancing microdomain formation. Studies done at Ca2+ diffusion coefficients at low and high limits of DCa = 4
Figure 9A plots the modelled magnitudes of T-SR junction Ca2+ influxes and effluxes. The influx of Ca2+,
4.7 Impact of variations in CaM affinity on [Ca2+] and microdomain kinetics
The exact CaM affinity for Ca2+, its Kd (Table 3 D, Equation 50), is difficult to measure with different values quoted in the literature, varying with the measurement method (surface plasmon resonance and radioisotope displacement), conditions (in vitro, in vivo, and ion concentrations), what is measured (EF-hand affinity and apparent affinity), the specific CaM (different isoforms and species), and the conformation (R-state and T-state) (Faas et al., 2011). Independent of the precise conditions, Kd varies with conformational changes and post-translational modifications. A T- to R-state conformational change increases the affinity 100-fold (Faas et al., 2011). Ser101 phosphorylation by casein kinase II significantly increases the affinity. Ser101 is near the third EF-hand (Ca2+-binding motif); the negative charge on the phosphate group enhances cation binding (Aiuchi et al., 1991). These inconsistencies complicate the choice of a specific value, but consensus values for Kd fall between 0.5 µM and 5 µM (Chin and Means, 2000). We used our model to explore the consequences of such variations in Ca2+ microdomain formation and CaM signalling.
Figure 10 demonstrates decreases in maximal [Ca2+] and [Ca2+]free with reductions in CaM affinity at both DCa2+ values tested. At lower DCa2+, [Ca2+] notably decreased from 55 to 43 μM, and [Ca2+]free showed a smaller, 24 µM to 20 μM, decrease. At higher DCa2+, [Ca2+] showed a greater proportional decrease from 35 to 11 μM, and [Ca2+]free showed a decrease from 10 µM to 3 μM. The smaller decrease of [Ca2+]free compared to that of [Ca2+] is attributable to the reduced CaM saturation at lower affinity. Thus, at Kd = 0.5 µM and 5 μM, 98.3% and only 82.5% respectively of available CaM Ca2+-binding sites were occupied. The linear relationships between Kd, [Ca2+], and [Ca2+]free were shallow.
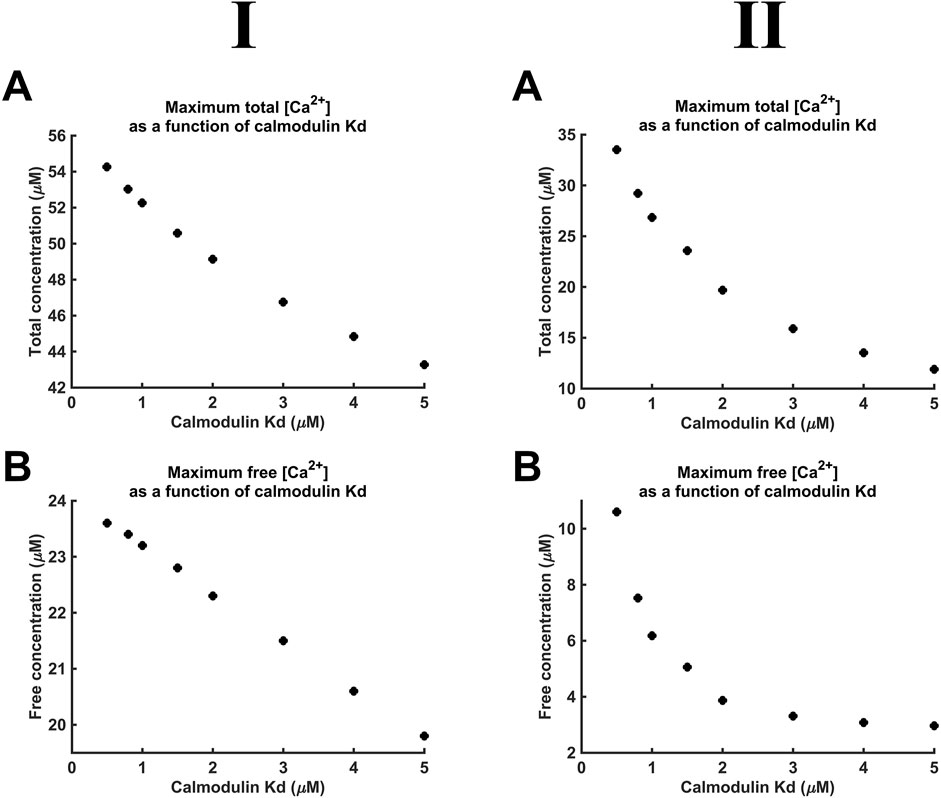
Figure 10. [Ca2+] and [Ca2+]free as functions of CaM Ca2+ binding constant Kd. Studies done at Ca2+ diffusion coefficients at low and high limits of DCa = 4
Additional to maximal [Ca2+], Kd variations also affect the kinetics of microdomain formation. The rate of microdomain formation was represented by a time constant given by the length of time necessary to reach 63% (1–1/e) of maximal [Ca2+] (Figure 11A). The high (Figure 11II), as opposed to the low DCa2+ (Figure 11I), value was associated with lower time constants. The time constants decreased with decreasing CaM affinity for Ca2+, i.e., microdomains form faster at lower CaM affinity and higher DCa2+ (Figure 11B). However, a 10-fold reduction in affinity leads only to a 15% reduction in the time constant. The kinetics of microdomain formation are thus relatively robust to altered CaM affinity.
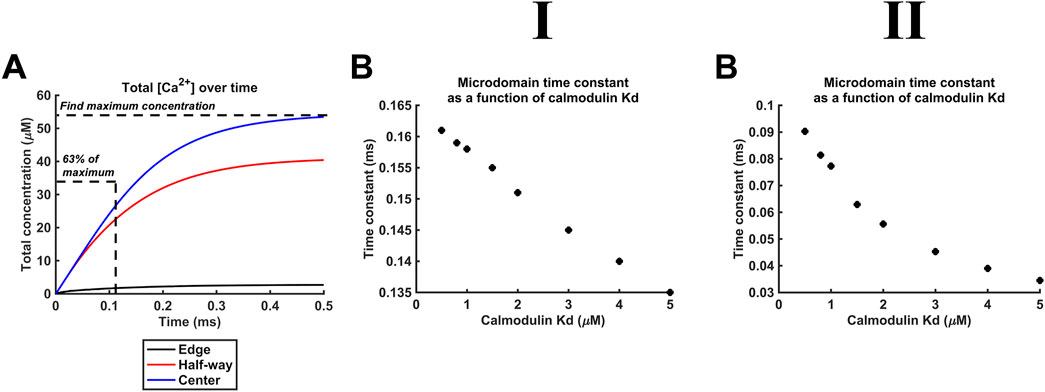
Figure 11. Microdomain formation slows with increased CaM affinity for Ca2+. Studies done at Ca2+ diffusion coefficients at low and high limits of DCa = 4
Finally, Kd variations steeply altered CaM-Ca2+-binding site occupancies through the microdomain. Figure 12 shows eventual [Ca2+] (A, B), Ca2+-binding site occupancies (C, D) and CaM saturation (E, F) profiles at high (Kd = 0.5 µM) (A, C, E) and low (Kd = 5 µM) CaM affinities (B, D, F) at both low (Figure 12I) and high DCa2+ values tested (Figure 12II). [Ca2+] variations were relatively small: maximum [Ca2+] decreased by ∼30% from 55 μM at high to 40 μM at low affinity at low DCa2+ and from 35 μM to 10 μM at high DCa. At both DCa2+ values, there were sharp spatial decreases towards the T-SR junction edges. In contrast, 93% of all CaM molecules were saturated at high affinity, decreasing to 47% saturation at low affinity at low DCa2+. Similarly, 90% of CaM molecules were saturated at high affinity, decreasing to 25% saturation at low affinity, at low DCa2+. However, at the T-SR junction edges, virtually all and only a fraction of Ca2+-binding sites were occupied whether at high or low CaM affinity, respectively, at both tested DCa2+ (Figures 12C, D). Correspondingly, in the domain centre, virtually all and only ∼50% of the CaM molecules were saturated with all four Ca2+-binding sites occupied. These proportions decreased sharply towards the edges of the T-SR junction (Figures 12E, F). Thus, variations in CaM affinity following conformational and post-translational modifications, in addition to [Ca2+] variations, could modify T-SR junction Ca2+ microdomains. This could affect CaM-mediated Ca2+ signal transduction. Such actions would be superimposed on CaM’s intrinsic regulatory properties: CaM has four Ca2+-binding sites, all of which require occupation to activate CaM’s regulatory role whether on RyR or CaMKII.
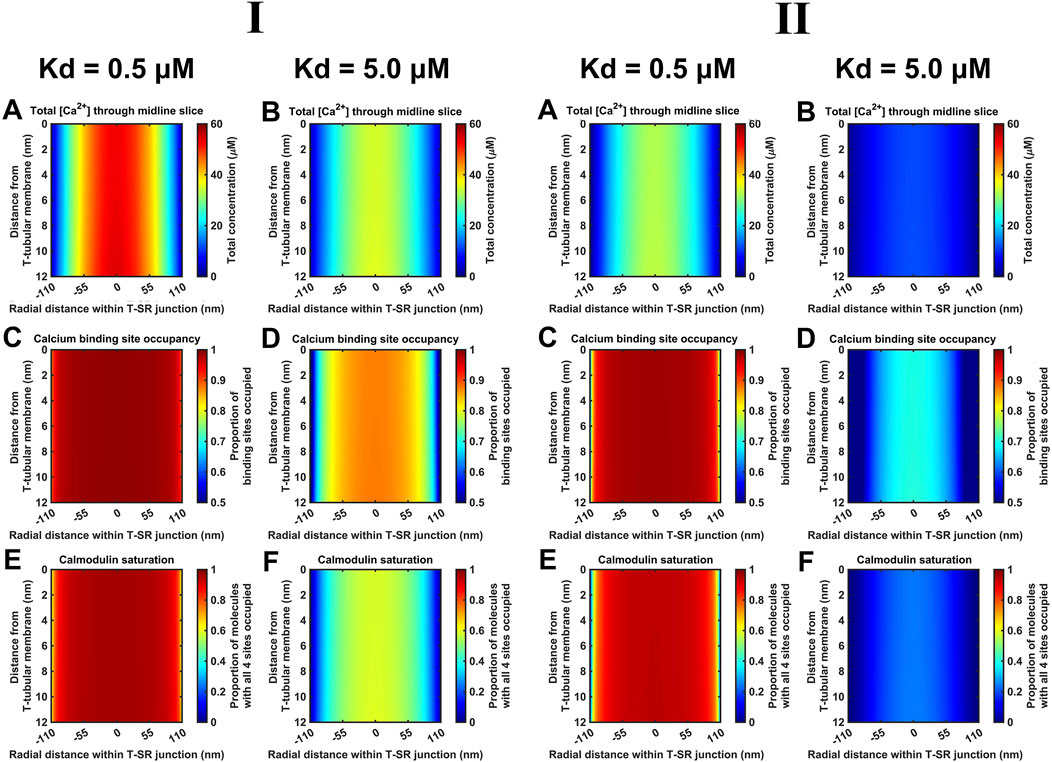
Figure 12. Ca2+-binding sites and CaM saturation as functions of the CaM affinity for Ca2+. Studies done at Ca2+ diffusion coefficients at low and high limits of DCa = 4
4.8 Action of accumulated T-SR junction Ca2+ on membrane potentials
Additional to the above cytosolic actions of kinetically distinct free and CaM-bound Ca2+ changes on important T-SR junctional molecules including Nav1.4 and RyR1, the released Ca2+ potentially affects T-tubular, ΔV, and SR transmembrane potentials. These could also affect membrane protein function. We explored these effects for the high concentrations [Ca2+] = 52 µM and [Ca2+]free = 28 µM predicted here for low DCa2+ (Figure 13I) and [Ca2+] = 30 µM and [Ca2+]free = 6 µM for high DCa2+ (Figure 13II). These yielded similar results, which are described for low DCa2+
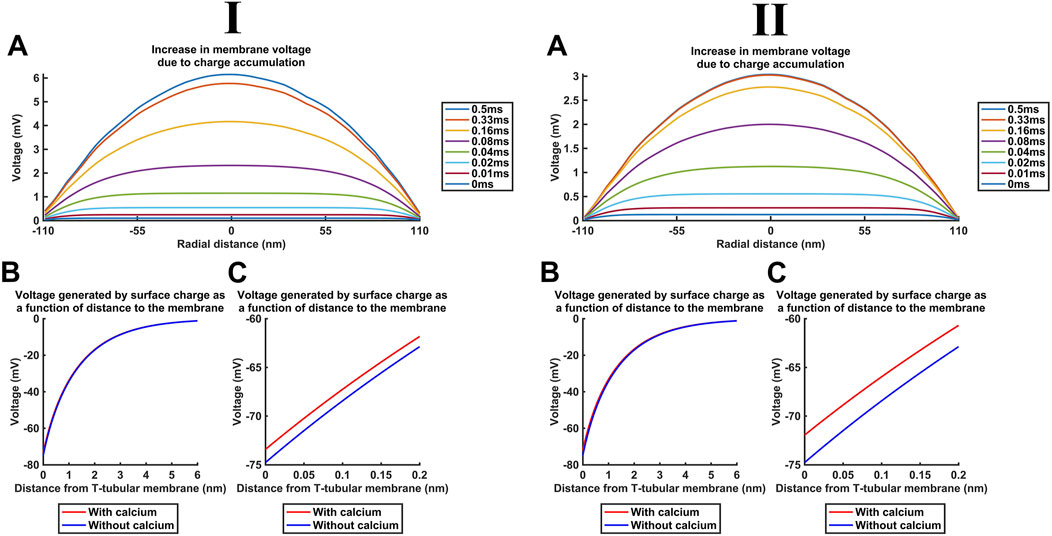
Figure 13. Ca2+ release into the T-SR junction alters the bulk cytosolic and Stern layer potentials. Studies done at Ca2+ diffusion coefficients at low and high limits of DCa = 4
First, Figure 13A shows the increase in the bulk intracellular membrane potential Vi calculated with the charge difference approach (Table 3 F, Equations 55, 56). Even the highest [Ca2+] = 52 μM at the T-SR junction centre at radial distance = 0 nm only generated a +6-mV increase in Vi (Figure 13A) and, therefore, ∆V.
Second, in the absence of Ca2+, both inner- and the outer-membrane leaflets possess a surface charge of densities
Table 5 summarises the parameter values used in surface potential modelling altering such surface charges. A maximum [Ca2+]free at the centre of the domain, at the end of the simulation (t = 0.5 ms) reaching 28 µM, as modelled here, generated a +1.4-mV surface potential increase at x = 0 nm. This change is not matched at the outer leaflet, effectively resulting in only a small, +1.4-mV increase in ∆V (Figure 13D). The outer-membrane leaflet generates similar potentials, but small variations in adsorption at extracellular mM Ca2+ concentrations would only minimally affect the surface potential at the outer-membrane surface.
These changes in ∆V are additive, summing to a maximum change of 7.4 mV in ∆V. This is small in relation to either resting membrane potentials of ∼−90 mV or the action potential-mediated excursion to +40 mV in skeletal myocytes (Filatov et al., 2005). These findings confine Ca2+ release to a modification of voltage-dependent ion channel activation and inactivation, as opposed to the transmembrane field.
5 Discussion
Ca2+ microdomains can form at the mouths of Ca2+ channels during cell signalling due to large transmembrane Ca2+ release/entry gradients and relatively poor Ca2+ cytosolic diffusibility. They are likely accentuated in cellular structures such as at skeletal muscle T-SR triad junctions, where closely apposed membranes further restrict Ca2+ diffusion. Such T-SR junctions are strategic in excitation–contraction coupling (Franzini-Armstrong and Nunzi, 1983; Franzini-Armstrong et al., 1999; Kelly, 1969). Here, Cav1.1-DHPR1 conformational changes allosterically activate directly coupled SR-RyR1-Ca2+ channels (Huang et al., 2011) and possibly other adjacent, coupled SR-RyRs (Huang, 2001; Marx et al., 1998), initiating intracellular SR-Ca2+ release. In contrast, in cardiac muscle dyad junctional sites, Cav1.2-mediated Ca2+ entry initiates a Ca2+-induced, RyR2-mediated SR-Ca2+ release (Cannell and Soeller, 1997; Endo, 2009; Fabiato and Fabiato, 1975; Soeller and Cannell, 1997). This could potentially yield contrasting, more nonlinear effects on junctional Ca2+ levels that could merit future detailed study.
However, their small size and difficulties inherent in their direct experimental study leave the physiological events within Ca2+ microdomains poorly understood. Nevertheless, modelling studies may provide useful insights into processes within this space. Recent modelling of simple Ca2+ diffusion suggested that such microdomains could transiently and locally reach concentrations 1,000-fold greater than the remaining bulk resting cytosolic [Ca2+] (Bardsley et al., 2021). The present study more realistically incorporated effects of additional in vivo factors, including charge gradients, counterions, and Ca2+ and osmotic buffers, on the development and properties of such Ca2+ microdomains. It assessed their possible contributions to cytosolic and surface membrane signalling. Adding to the previous report, it explored effects of voltage gradients consequent upon Ca2+ accumulation and additional electrodiffusive effects of the in vivo counterions K+ and Cl− and osmotic-buffering anions. It similarly assessed the effect of varying 107∼108 nm2 s−1 reported Ca2+ diffusion values, further bearing in mind restricted T-SR space conditions potentially not representative of the whole-cell cytoplasm. Adopting the DCa2+ value proposed by Baylor and Hollingworth (1998), DCa2+ = 7 × 10⁸ nm2 s−1, a two-fold smaller DCa2+ than the free value assumed a myoplasmic viscosity 2-fold than that of a simple salt solution (Kushmerick and Podolsky, 1969). It excluded effects of Ca2+-sequestering membrane-bound organelles, likely true within the T-SR space, and of cytoplasmic Ca2+ buffers. However, even the T-SR-restricted space likely includes Ca2+ buffers additional to CaM, affecting DCa2+. Including the entire bulk cytoplasmic Ca2+-binding capacity would have yielded a 50-fold DCa2+ reduction to 2.8 × 10⁷ nm2 s−1 (Kushmerick and Podolsky, 1969). Nevertheless, the adopted DCa2+ value could provide an upper computational limit. This could be compared with the results from a lower DCa limit of 4.0 × 10⁷ nm2 s−1 based on empirical isotope and mini-electrode measurements (al-Baldawi and Abercrombie, 1995). This would comprehensively cover variations in the results arising from reported DCa2+ variations. Furthermore, with these low and high DCa2+ limits, the modelling then incorporated Ca2+ buffering and its actions upon both free [Ca2+]free and total [Ca2+], which could impact cytosolic Ca2+ signalling. It also considered consequences for the T-tubular membrane potential that might also directly impact voltage-sensitive proteins. Finally, comparing the results at the low and high DCa2+ limits lent security to the inferences here as applicable through the entire range of reported DCa2+. They also yielded further insights into the relative effects of DCa2+ and CaM buffering on domain characteristics.
Findings from such an analysis have implications in skeletal muscle physiology, detailed and referenced below, for (1) the possible importance of CaM regulating the kinetics and the extent of Ca2+ microdomain formation and its own role in local T-SR junctional Ca2+ signalling. It exerted relatively (2) minor effects upon T-tubular and possibly SR transmembrane potentials. Nevertheless, both Ca2+ and CaM likely (3) activate multiple RyR regulatory sites. They may also exert (4) inhibitory actions in skeletal (Nav1.4) and cardiac muscle Na+ channel (Nav1.5) C-terminal EF-like hand motifs and isoleucine–glutamine (IQ) domain regions or binding sites between Nav domains III and IV, (5) activating actions on both “big” (BK)- and small-conductance (SK1, SK2, and SK3) K+ channels; both (4) and (5) may reduce skeletal muscle membrane excitability. They also potentially (6) modify Na+/Ca2+ exchanger activity. They, thus, potentially contribute to important physiological and clinical translational situations.
Several, some counter-intuitive, predictions illustrating the need for such a full quantitative analysis of the properties of complex systems of this kind emerged. First, at both DCa2+ values studied, electrodiffusion little impacted microdomain formation under the adopted in vivo electrolyte and osmotic conditions. Full Nernst–Plank modelling yielded similar Ca2+ microdomain formation properties as the simple Fick diffusion analysis, aligned to previous reports (Bardsley et al., 2021). Further introducing K+ and Cl− counterions into the model also did not significantly alter the microdomain [Ca2+]. The higher DCa2+ did reduce the attained domain [Ca2+]free but sped up the kinetics with which this was reached. In contrast, control introductions of 106 greater, unphysiological Ca2+ influx terms did demonstrate significant differences. These findings together indicate that the electrical potential term of the Nernst–Plank equation resulting from the charge accumulation, resulting from Ca2+ influx into the domain, contributed little to ion movement and to the resulting T-SR junction [Ca2+] under the adopted in vivo conditions.
Second, computations with either DCa2+ quantitatively demonstrated for the first time that CaM is a potential major regulator of both the kinetics and extent of Ca2+ microdomain formation. This could indicate its major role in Ca2+ signalling at T-SR junction microdomains: CaM is the major mobile cytosolic buffer in skeletal myocytes. We demonstrate an unexpected result that at the microdomain level with a sustained Ca2+ entry, such buffers bind their target, reduce its diffusibility, and trap it in the microdomain, leading to an overall increase in free target Ca2+ concentration. Introducing CaM thus increased both [Ca2+] and [Ca2+]free. Further modelling attributed this effect to Ca2+ trapping by the relatively immobile CaM, restricting Ca2+ efflux. The [Ca2+] reached transiently exceeded the CaM buffering capacity, particularly at the centre of the junction for durations of 0.5 ms. Furthermore, [Ca2+], [Ca2+]free, and microdomain kinetics were sensitive to the CaM affinity for Ca2+. The latter could vary in vivo with post-translational modifications, its existence in its active or inactive states, and the exact cellular conditions. Thus, variations in the Kd of CaM altered the Ca2 efflux leaving the T-SR junction of the F3 face. Calmodulin, thus, provides a crucial read-out, modulating the function of the main effectors of the T-SR space. In these simulations performed in the presence of the CaM buffer, higher DCa2+ resulted in a decrease in the attained [Ca2+] reflecting a decrease in [Ca2+]free. However, it had smaller effects on [Ca2+]bound than did the buffering by CaM. The concentration profiles were similar at high and low DCa2+ with sharp decreases at the domain edges. The decreases in [Ca2+] and [Ca2+]free were less marked at the high DCa2+. High DCa2+ also reduced the extent to which buffering slowed the kinetics of microdomain formation.
Third, we explored the influences of T-SR junction Ca2+ domain formation on T-tubular, and possibly, SR transmembrane potentials, using both DCa2+ values. This yielded closely concordant results, which are therefore described for the low-DCa2+ case. The charge differences resulting from cytosolic Ca2+ accumulation contributed a profile of voltage change ∆V, which, however, did not exceed ∼6 mV. Ca2+ adsorption to the inner leaflet of the T-tubular membrane additionally generated a surface Stern potential, but this did not exceed 1.4 mV, matching some previous reports (Catacuzzeno et al., 2008). Other modelling had estimated that Ca2+ adsorption on the inner-membrane leaflet produced a +30-mV ∆V on elevating [Ca2+]i to 2 µM (Pizarro et al., 1991). However, this had adopted extremely higher-than-accepted values of Ca2+–phospholipid affinity, close to the Kd = 20 μM of CaM, contrasting with the accepted reported mM Kd’ range of phospholipid–Ca2+ (Bers et al., 1985; Deplazes et al., 2021; McLaughlin et al., 1981; Melcrová et al., 2016). With those latter Kd’ values, ∆V changes predicted by Pizarro et al. (1991) would have required physiologically unrealistic, mM, changes in [Ca2+]i here.
Our present studies adopted physiologically realistic T-SR junctional structures, participating ions and their concentrations, and Ca2+, particularly CaM-mediated, buffering. They predicted Ca2+ accumulation enhanced by the restricted T-SR junctional geometry. This was further increased by the inclusion of CaM. The resulting Ca2+-CaM buffering then further increased both [Ca2+] and [Ca2+]free. This would result in activated levels of [Ca2+-CaM]. It also resulted in an increased [Ca2+] accumulation within and decreased Ca2+ efflux to the remaining cytosol from the T-SR junction. The extent and features of such Ca2+ microdomains could be modified by both channel-mediated Ca2+ fluxes and longer-term variations in CaM properties affecting its Kd (Parekh, 2008). These modifications would involve both absolute and relative free Ca2+, Ca2+-CaM, and CaM levels, all established cellular signalling agents. This has implications for previous reports, adding to known T-SR junctional feedforward excitation–contraction coupling events (Figure 14A). They suggest reciprocal feedback regulatory phenomena involving the resulting Ca2+ microdomains (Figure 14B).
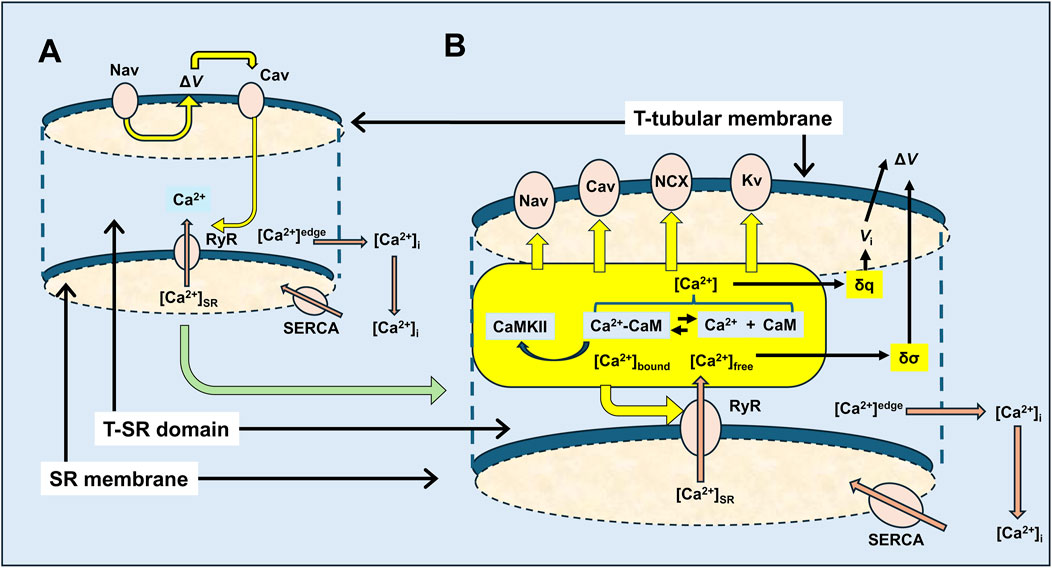
Figure 14. Feedforward vs. feedback actions in excitation–contraction coupling involving possible T-SR junction Ca2+ domains. (A) Classical feedforward events initiated by Nav-mediated depolarisation leading to Cav activation, triggering the RyR-mediated release of SR-stored Ca2+, by either direct allosteric (in skeletal muscle) or Ca2+ entry-induced (in cardiac muscle) Cav-RyR coupling. Released Ca2+ is eventually retrieved into the SR by SR-Ca2+-ATPase (SERCA)-mediated transport. These initial events are contrasted with (B) feedback events, following RyR-mediated SR-Ca2+ release involving a T-SR junctional Ca2+ microdomain space in which the released Ca2+ is buffered and, thus, trapped by cytosolic CaM, resulting in reactions modifying the equilibrium Ca2+ + CaM ↔Ca2+-CaM, in which Ca2+, CaM, and Ca2+-CaM are all key signalling molecules. These potentially exert feedback effects exemplified here in the T-tubular membrane molecules, Nav and Cav, that initiate excitation–contraction coupling, and in the SR membrane, Ca2+-releasing RyR, with potential extensions to Kv, NCX, and cellular metabolic signalling.
Amongst other examples (Figure 14B) (Lei et al., 2024; Li et al., 2023; Salvage et al., 2023), the latter could first involve multiple RyR regulatory sites (Lanner et al., 2010), in turn modulating Ca2+ flux and microdomain formation. Both Ca2+ and CaM likely activate RyR1. Increased [Ca2+] actually increases RyR1 affinity for CaM (Rodney et al., 2000). In contrast, Ca2+-CaM inhibits skeletal muscle RyR1-mediated SR Ca2+ release. These have implications for both positive and negative homoeostatic modifications of the resulting Ca2+ domain, with possible physiologically important consequences (Fruen et al., 2003). Ca2+-CaM also activates CaMKII, which acts on specific RyR1 phosphorylation sites (Meissner, 2010), increasing Ca2+ release (Gehlert et al., 2015). Cardiomyocyte excitation–contraction coupling involves Ca2+ influxes through voltage-activated dihydropyridine receptors (DHPR2 and Cav1.2) activating Ca2+-induced SR-Ca2+ release by RyR2 (Endo, 2009; Fabiato and Fabiato, 1975) at dyad junctional complexes. Here, Ca2+ microdomain formation would also be of direct interest.
Second, skeletal (Nav1.4) and cardiac muscle Na+ channels (Nav1.5) possess potential Ca2+ and CaM-binding modulatory sites (Nathan et al., 2021). Ca2+ might bind directly to one or more EF-like hand motifs (Yoder et al., 2019). Alternatively, Ca2+-CaM could bind to the IQ domain region at their C-terminal domain following initial Ca2+ binding to EF-hand motifs on CaM (Gardill et al., 2019; Young and Caldwell, 2005) or to a site between Nav domains III and IV (Potet et al., 2009). Navs additionally contain sites phosphorylatable by Ca2+-CaM-regulated CaMKII (Loussouarn et al., 2016) and protein kinase C (Bendahhou et al., 1995). Elevating [Ca2+]i to ∼2 µM by rapid Ca2+ photo-release or overspill from neighbouring Ca2+ channels reduced Na+ current, INa, in vitro in single-cell patch-clamped Nav1.4-transfected HEK293 cells and skeletal muscle cell lines. These effects were abrogated by intracellular BAPTA (Ben-Johny et al., 2014), or mutations in the CaM-Ca2+-binding EF hands, or the Nav1.4 C-terminal IQ domain (Ben-Johny et al., 2014; Deschênes et al., 2002; Young and Caldwell, 2005).
Fluo-3-AM and fura-PE3-AM Ca2+ fluorescence studies demonstrated that both the RyR-Ca2+ release activator caffeine and SR Ca2+ re-uptake inhibitor cyclopiazonic acid (CPA) (Du et al., 1994; Seidler et al., 1989) increased bulk cytosolic [Ca2+] in rat soleus and oesophageal striated muscle (Du et al., 1994; Pagala and Taylor, 1998; Seidler et al., 1989; Sekiguchi et al., 1999). In intact loose patch-clamped native murine skeletal muscle fibre preparations (Almers et al., 1983), caffeine and Epac-mediated RyR activation, as well as the RyR inhibitor, dantrolene, correspondingly reduced and increased Na+ current, INa. Dantrolene pretreatment further abrogated the INa inhibitory effects of caffeine or Epac activation (Matthews et al., 2019; Sarbjit-Singh et al., 2020). However, CPA paradoxically increased INa, preserving its time course, steady-state half-maximum voltage, and steepness factor while also abrogating caffeine’s effects (Liu et al., 2021). This was compatible with RyR1-mediated Ca2+ release into a microdomain in the vicinity of both SR RyR1 and the T-tubular membrane Nav1.4 (Liu et al., 2021), permitting distinct local in vivo [Ca2+]TSR. This would increase with increased RyR1-mediated Ca2+ release but decrease with the SR Ca2+ depletion produced by the SERCA antagonist challenge despite their similar effects on bulk cytosolic [Ca2+]i (Pagala and Taylor, 1998; Sekiguchi et al., 1999).
Similarly, murine cardiac muscle showed reduced INa when SR Ca2+ release was enhanced by Epac activation (King et al., 2013; Valli et al., 2018), or in the pro-arrhythmic gain of function RyR2-P2328S genetic modification associated with catecholaminergic polymorphic ventricular tachycardia, with implications for anti-arrhythmic therapy (Huang, 2017; Zhang et al., 2011; 2013). Cardiac CaMKII mutations similarly increase the risk of arrhythmias and heart failure (Swaminathan et al., 2012).
Third, K+ channel opening hyperpolarizes skeletal, cardiac, or smooth-cell membranes, similarly depressing their excitability. Intracellular C-termini of large conductance “Big K+” (BK) channels possess two regulatory Ca2+-binding sites (Sancho and Kyle, 2021; Zeng et al., 2005), conferring a μM local [Ca2+], additional to their voltage, sensitivity (Yang et al., 2015). Small-conductance (SK1, SK2, and SK3) K+ channels (Adelman et al., 2012; Weisbrod, 2020), although not voltage-sensitive, respond to intracellular Ca2+ including RyR-induced Ca2+ release (Neelands et al., 2001) through regulatory C-terminal CaM-binding domains. BK opening may reduce membrane excitability in exercising skeletal muscle (Allen et al., 2008) and modify cardiac sinoatrial node pacing (Meredith et al., 2014; Pineda et al., 2021). SK2 is implicated in pro-arrhythmic atrial and ventricular pathological situations (Yang et al., 2021; Lei et al., 2024; Li et al., 2023; Salvage et al., 2023). Fourth, regarding anion channels, Ca2+-activated Cl− TMEM16A channels open in response to ∼600 nM free [Ca2+] with possible roles in cardiac (Horváth et al., 2016) and skeletal (Dayal et al., 2019) in addition to smooth muscle (Manoury et al., 2010).
Finally, regarding ion transporters, physiologically important in muscle membranes, Na+/Ca2+ exchangers (NCX) have been localised to both skeletal and cardiac muscle T-tubular membranes (Donoso and Hidalgo, 1989; Sacchetto et al., 1996). They can affect higher (10–50-fold) turnover rates than Ca2+-ATPase transporters, but their 10-fold lower Ca2+ affinity [Kd∼1 μM; (Blaustein and Lederer, 1999)] is compatible with activity at the μM-level T-SR microdomain suggested here rather than nM-level bulk cytosolic [Ca2+].
Ca2+ microdomains also exerted potential reciprocal actions through their associated charge accumulation and direct surface membrane adsorption. Both potentially alter ∆V. The latter had previously been implicated in significant +30-mV ∆V alterations that could produce feedback effects from [Ca2+]i elevations to 2 µM during excitation–contraction coupling (Pizarro et al., 1991). However, the present modelling using more realistic Ca2+–phospholipid affinities (Bers et al., 1985; Deplazes et al., 2021; McLaughlin et al., 1981; Melcrová et al., 2016) suggested that even both these effects together would produce <+7.4-mV voltage changes, unlikely to appreciably affect the activation or inactivation of surface membrane molecules, while not excluding the other mechanisms for “retrograde” regulation by RyR1 (Flucher, 2016; Huang et al., 2011).
This modelled T-SR junction Ca2+ microdomains could be important in clinical translational situations. Elevated skeletal muscle T-SR junctional microdomain [Ca2+] could inhibit tubular Nav1.4 function not only in normal sustained activity (Martin et al., 2003; Usher-Smith et al., 2007) but also in particular clinical skeletal myopathies (Dowling et al., 2014). The latter are exemplified by RyR1 mutation-related congenital myopathies or malignant hyperthermia susceptibility resulting from clinical loss-of-function, RyR1 Ca2+-binding site mutations (Witherspoon and Meilleur, 2016). Nav1.4 C-terminal EF hand-like domain mutations have been associated with a myotonic hyperexcitability disorder disrupting Ca2+-mediated inhibition of Nav1.4 function (Biswas et al., 2013; Horie et al., 2020). Abnormally increased myotube diameters and resting [Ca2+]i and decreased RyR1-mediated Ca2+ release reflecting abnormal triad junction formation and maintenance are associated with a junctophilin (JP2) mutation (Woo et al., 2010). Transfection experiments reported reductions in muscle fatigue and improvement in contraction strength, following increased RyR1 phosphorylation produced by CaMKII overexpression (Flück et al., 2024).
In these examples, most of the microdomain Ca2+ accumulation would be likely attributable to RyR-mediated Ca2+ release. These are 1–2 orders of magnitude greater than early Cav1.1 or Cav1.2 tubular currents [skeletal muscle voltage clamp, ICaf ∼25 μA cm−2 (Cota and Stefani, 1986); cardiomyocyte patch clamp ICaL ∼10 pA pF−1 (Morinaga et al., 2019) yielding Jinflux ∼ 8.64 × 10⁻⁷ and ∼6.91 × 10⁻⁸ mol m−2 s−1, respectively, assuming similar CT/Cs and ξ]. Larger skeletal muscle late ICa (80 μA/cm−2, yielding Jinflux ∼ 2.76 × 10⁻⁶ mol m−2s−1) shows activation time courses (100 s of ms) too prolonged to drive excitation–contraction coupling (Sanchez and Stefani, 1978; Sánchez and Stefani, 1983).
The present study complements previous reports (Cannell and Allen, 1984) modelling overall Ca2+ diffusion over the entirety of an amphibian skeletal muscle myofibril half-sarcomere, following altered Ca2+ SR membrane permeability producing Ca2+ release. In their case, the latter was permitted to vary with a driving force dependent on consequent alterations in SR [Ca2+] and a varying eventual bulk cytosolic [Ca2+]. Furthermore, the terminal cisternae, longitudinal sarcoplasmic reticulum, and extramyofibrillar and myofibrillar spaces were each lumped into exchanging compartments, with appropriately localised Ca2+-binding proteins troponin, parvalbumin, and calsequestrin, possessing realistic binding kinetics. This diffusive, as opposed to full electrodiffusive, characterisation adopted free-Ca2+ diffusion coefficient values (7 × 10⁻⁴mm2 s−1) allowing for Ca2+ binding to cytoplasmic-binding sites. Here, we contrastingly specifically address electrodiffusive properties and the effect of cytosolic buffering of established potential physiological importance on these within an anatomically defined structure of dimensions corresponding to that of the skeletal muscle T-SR junction (Dulhunty, 2006; Franzini-Armstrong, 1970; Franzini-Armstrong, 1973). We thus examine its capacity for microdomain formation under a physically defined constant Ca2+ influx from the SR-Ca2+ store, eventually effluxing into a constant bulk cytosolic Ca2+. Further studies could incorporate into such a basic model the space occupied by an L-type Ca2+ channel and RyR molecules within the T-SR junction, including their geometrical and density distributions and their own rate and binding constants for Ca2+ binding, as previously applied for cardiac dyad junctions (Tanskanen et al., 2007). Incorporating such space-filling molecules would reduce the free volume of the T-SR space. They could then proceed to investigate contributions from Ca2+ adsorption onto enclosing membranes. Nevertheless, our present computations provide lower limiting, and useful, general indications of microdomain Ca2+ accumulation within a space corresponding to that of the T-SR geometry. For example, these findings demonstrate physiologically important elevated T-SR junctional Ca2+ levels comparable to the Ca2+-CaM-binding constant.
Closely apposed membranes potentially mediating localised Ca2+ signalling involving Ca2+-dependent proteins also occur widely in other cell types (Chang et al., 2017; Henkart et al., 1976). In smooth muscle, local Ca2+ release into SR–plasma membrane appositions (Devine et al., 1972) could increase repolarizing Ca2+-activated K+ channel activity even when cell-wide Ca2+ release activates MLCK, promoting contraction (Knot et al., 1998). Cerebellar Purkinje and hippocampal neurons (Wu et al., 2017) similarly signal using RyR-Ca2+ release channels (Kano et al., 1995; Kohda et al., 1995; Ouyang et al., 1997; Tedoldi et al., 2020), as recently implicated in INa modulation (Bertagna et al., 2024a; 2024b). Finally, in non-excitable thrombocytes, multiple 20–30-nm-diameter membrane invaginations in their open canalicular systems (OCSs) (Anand and Harper, 2020; Sage et al., 2013) form vacuolar structures apposed to membranes of the Ca2+-storing deep tubular system (DTS) structurally comparable with muscle T-SR junctions (Van Nispen Tot Pannerden et al., 2010). These would constitute an inositol trisphosphate receptor rather than RyR-mediated Ca2+ fluxes. Finally, both Ca2+ and Ca2+-CaM act on other signalling cascades involving soluble proteins: ∼µM Ca2+-CaM may also exert other cytosolic effects as on glyceraldehyde 3-phosphate dehydrogenase (Singh et al., 2004) or itself provide local signalling domains (Saucerman and Bers, 2012).
Data availability statement
The original contributions presented in the study are included in the article/Supplementary Material. Further inquiries can be directed to the corresponding author.
Author contributions
MR: data curation, formal analysis, investigation, methodology, software, validation, visualization, writing–original draft, and writing–review and editing. JM: formal analysis, investigation, methodology, software, supervision, validation, writing–original draft, and writing–review and editing. OB: data curation, methodology, software, validation, visualization, writing–original draft, and writing–review and editing. HM: conceptualization, formal analysis, project administration, software, supervision, writing–original draft, and writing–review and editing. CLHH: conceptualization, data curation, funding acquisition, project administration, supervision, validation, visualization, writing–original draft, and writing–review and editing.
Funding
The author(s) declare that financial support was received for the research, authorship, and/or publication of this article. This study was supported by the British Heart Foundation (BHF) (PG/19/59/34582) and Cambridge BHF Centre for Research Excellence for their generous support.
Conflict of interest
The authors declare that the research was conducted in the absence of any commercial or financial relationships that could be construed as a potential conflict of interest.
Publisher’s note
All claims expressed in this article are solely those of the authors and do not necessarily represent those of their affiliated organizations, or those of the publisher, the editors, and the reviewers. Any product that may be evaluated in this article, or claim that may be made by its manufacturer, is not guaranteed or endorsed by the publisher.
Supplementary material
The Supplementary Material for this article can be found online at: https://www.frontiersin.org/articles/10.3389/fphys.2024.1468333/full#supplementary-material
References
Adelman J. P., Maylie J., Sah P. (2012). Small-conductance Ca2+-activated K+ channels: form and function. Annu. Rev. Physiol. 74, 245–269. doi:10.1146/ANNUREV-PHYSIOL-020911-153336
Adrian R. H., Peachey L. D. (1973). Reconstruction of the action potential of frog sartorius muscle. J. Physiol. 235, 103–131. doi:10.1113/jphysiol.1973.sp010380
Aiuchi T., Hagiwara T., Omata K., Nakaya K., Nakamura Y. (1991). Effect of phosphorylation of calmodulin on calcium binding affinity as estimated by terbium fluorescence. Biochem. Int. 23, 145–149.
al-Baldawi N. F., Abercrombie R. F. (1995). Calcium diffusion coefficient in Myxicola axoplasm. Cell Calcium. 17, 422–430. doi:10.1016/0143-4160(95)90088-8
Allen D. G., Lamb G. D., Westerblad H. (2008). Skeletal muscle fatigue: cellular mechanisms. Physiol. Rev. 88, 287–332. doi:10.1152/physrev.00015.2007
Almers W., Stanfield P. R., Stühmer W. (1983). Lateral distribution of sodium and potassium channels in frog skeletal muscle: measurements with a patch-clamp technique. J. Physiol. 336, 261–284. doi:10.1113/jphysiol.1983.sp014580
Anand P., Harper A. G. S. (2020). Human platelets use a cytosolic Ca2+ nanodomain to activate Ca2+-dependent shape change independently of platelet aggregation. Cell Calcium 90, 102248. doi:10.1016/j.ceca.2020.102248
Balog E. M., Fitts R. H. (1996). Effects of fatiguing stimulation on intracellular Na+ and K+ in frog skeletal muscle. J. Appl. Physiol. (Bethesda, Md. 1985) 81, 679–685. doi:10.1152/jappl.1996.81.2.679
Bardsley O. J., Matthews H. R., Huang C. L. H. (2021). Finite element analysis predicts Ca2+ microdomains within tubular-sarcoplasmic reticular junctions of amphibian skeletal muscle. Sci. Rep. 11, 14376. doi:10.1038/s41598-021-93083-1
Baylor S. M., Hollingworth S. (1998). Model of sarcomeric Ca2± movements, including ATP Ca2± binding and diffusion, during activation of frog skeletal muscle. J. Gen. Physiol. 112, 297–316. doi:10.1085/jgp.112.3.297
Baylor S. M., Hollingworth S., Chandler W. K. (2002). Comparison of simulated and measured calcium sparks in intact skeletal muscle fibers of the frog. J. Gen. Physiol. 120, 349–368. doi:10.1085/jgp.20028620
Bendahhou S., Cummins T. R., Potts J. F., Tong J., Agnew W. S. (1995). Serine-1321-independent regulation of the mu 1 adult skeletal muscle Na+ channel by protein kinase C. Proc. Natl. Acad. Sci. U. S. A. 92, 12003–12007. doi:10.1073/pnas.92.26.12003
Ben-Johny M., Yang P. S., Niu J., Yang W., Joshi-Mukherjee R., Yue D. T. (2014). Conservation of Ca2+/calmodulin regulation across Na and Ca2+ channels. Cell 157, 1657–1670. doi:10.1016/j.cell.2014.04.035
Bers D. M., Philipson K. D., Peskoff A. (1985). Calcium at the surface of cardiac plasma membrane vesicles: cation binding, surface charge screening, and Na−Ca exchange. J. Membr. Biol. 85, 251–261. doi:10.1007/BF01871520
Bertagna F., Ahmad S., Lewis R., Silva S., McFadden J., Huang C., et al. (2024a). Loose patch clamp membrane current measurements in cornus ammonis 1 neurons in murine hippocampal slices. Ann. N. Y. Acad. Sci. 1535, 62–75. doi:10.1111/nyas.15123
Bertagna F., Ahmad S., Lewis R., Silva S., McFadden J., Huang C., et al. (2024b). Loose-patch clamp analysis applied to voltage-gated ionic currents following pharmacological ryanodine receptor modulation in murine hippocampal cornu ammonis-1 pyramidal neurons. Front. Physiol. 15, 1359560. doi:10.3389/fphys.2024.1359560
Bertini I., Gray H. B., Lippard S. J., Valentine J. S. (1994). Bioinorganic chemistry. University Science Books. Melville, NY: American Institute of Physics (AIP) Publishing.
Biswas S., DiSilvestre D. A., Dong P., Tomaselli G. F. (2013). Mechanisms of a human skeletal myotonia produced by mutation in the C-terminus of NaV1.4: is Ca2+ regulation defective? PLoS One 8, e81063. doi:10.1371/journal.pone.0081063
Blaustein M. P., Lederer W. J. (1999). Sodium/calcium exchange: its physiological implications. Physiol. Rev. 79, 763–854. doi:10.1152/physrev.1999.79.3.763
Cannell M. B., Allen D. G. (1984). Model of calcium movements during activation in the sarcomere of frog skeletal muscle. Biophys. J. 45, 913–925. doi:10.1016/S0006-3495(84)84238-1
Cannell M. B., Soeller C. (1997). Numerical analysis of ryanodine receptor activation by L-type channel activity in the cardiac muscle diad. Biophys. J. 73, 112–122. doi:10.1016/S0006-3495(97)78052-4
Catacuzzeno L., Fioretti B., Franciolini F. (2008). Modeling study of the effects of membrane surface charge on calcium microdomains and neurotransmitter release. Biophys. J. 95, 2160–2171. doi:10.1529/biophysj.107.124909
Chang C. L., Chen Y. J., Liou J. (2017). ER-plasma membrane junctions: why and how do we study them? Biochim. Biophys. Acta - Mol. Cell Res. 1864, 1494–1506. doi:10.1016/j.bbamcr.2017.05.018
Chin D., Means A. R. (2000). Calmodulin: a prototypical calcium sensor. Trends Cell Biol. 10, 322–328. doi:10.1016/s0962-8924(00)01800-6
Cossins B. P., Jacobson M. P., Guallar V. (2011). A new view of the bacterial cytosol environment. PLoS Comput. Biol. 7, e1002066. doi:10.1371/journal.pcbi.1002066
Cota G., Stefani E. (1986). A fast-activated inward calcium current in twitch muscle fibres of the frog (Rana montezume). J. Physiol. 370, 151–163. doi:10.1113/jphysiol.1986.sp015927
Dayal A., Ng S. F. J., Grabner M. (2019). Ca2+-activated Cl- channel TMEM16A/ANO1 identified in zebrafish skeletal muscle is crucial for action potential acceleration. Nat. Commun. 10, 115. doi:10.1038/S41467-018-07918-Z
Deplazes E., Tafalla B. D., Murphy C., White J., Cranfield C. G., Garcia A. (2021). Calcium ion binding at the lipid–water interface alters the ion permeability of phospholipid bilayers. Langmuir 37, 14026–14033. doi:10.1021/acs.langmuir.1c02016
Deschênes I., Neyroud N., DiSilvestre D., Marbán E., Yue D. T., Tomaselli G. F. (2002). Isoform-specific modulation of voltage-gated Na+ channels by calmodulin. Circ. Res. 90, e49–e57. doi:10.1161/01.RES.0000012502.92751.E6
Despa S., Shui B., Bossuyt J., Lang D., Kotlikoff M. I., Bers D. M. (2014). Junctional cleft [Ca²⁺]i measurements using novel cleft-targeted Ca²⁺ sensors. Circ. Res. 115, 339–347. doi:10.1161/CIRCRESAHA.115.303582
Devine C. E., Somlyo A. V., Somlyo A. P. (1972). Sarcoplasmic reticulum and excitation-contraction coupling in mammalian smooth muscles. J. Cell Biol. 52, 690–718. doi:10.1083/jcb.52.3.690
Dolmetsch R. E., Pajvani U., Fife K., Spotts J. M., Greenberg M. E. (2001). Signaling to the nucleus by an L-type calcium channel-calmodulin complex through the MAP kinase pathway. Sci. (80-. ) 294, 333–339. doi:10.1126/science.1063395
Donoso P., Hidalgo C. (1989). Sodium-calcium exchange in transverse tubules isolated from frog skeletal muscle. BBA - Biomembr. 978, 8–16. doi:10.1016/0005-2736(89)90491-4
Dowling J. J., Lawlor M. W., Dirksen R. T. (2014). Triadopathies: an emerging class of skeletal muscle diseases. Neurotherapeutics 11, 773–785. doi:10.1007/s13311-014-0300-3
Du G. G., Ashley C. C., Lea T. J. (1994). Effects of thapsigargin and cyclopiazonic acid on the sarcoplasmic reticulum Ca2+ pump of skinned fibres from frog skeletal muscle. Pflügers Arch. 429, 169–175. doi:10.1007/BF00374309
Dubina M. V., Vyazmin S. Y., Boitsov V. M., Nikolaev E. N., Popov I. A., Kononikhin A. S., et al. (2013). Potassium ions are more effective than sodium ions in salt induced peptide formation. Orig. Life Evol. Biosph. 43, 109–117. doi:10.1007/s11084-013-9326-5
Dulhunty A. F. (2006). Excitation-contraction coupling from the 1950s into the new millennium. Clin. Exp. Pharmacol. Physiol. 33, 763–772. doi:10.1111/j.1440-1681.2006.04441.x
Endo M. (2009). Calcium-induced calcium release in skeletal muscle. Physiol. Rev. 89, 1153–1176. doi:10.1152/physrev.00040.2008
Faas G. C., Raghavachari S., Lisman J. E., Mody I. (2011). Calmodulin as a direct detector of Ca2+ signals. Nat. Neurosci. 14, 301–304. doi:10.1038/nn.2746
Fabiato A., Fabiato F. (1975). Contractions induced by a calcium-triggered release of calcium from the sarcoplasmic reticulum of single skinned cardiac cells. J. Physiol. 249, 469–495. doi:10.1113/jphysiol.1975.sp011026
Falk G., Fatt P. (1964). Linear electrical properties of striated muscle fibres observed with intracellular microelectrodes. Proc. R. Soc. Lond. Ser. B, Contain. Pap. 160, 69–123. doi:10.1098/rspb.1964.0030
Feske S., Gwack Y., Prakriya M., Srikanth S., Puppel S.-H., Tanasa B., et al. (2006). A mutation in Orai1 causes immune deficiency by abrogating CRAC channel function. Nature 441, 179–185. doi:10.1038/nature04702
Filatov G. N., Pinter M. J., Rich M. M. (2005). Resting potential–dependent regulation of the voltage sensitivity of sodium channel gating in rat skeletal muscle in vivo. J. Gen. Physiol. 126, 161–172. doi:10.1085/jgp.200509337
Flucher B. E. (2016). Retrograde coupling: muscle’s orphan signaling pathway? Biophys. J. 110, 870–871. doi:10.1016/j.bpj.2015.12.032
Flück M., Sanchez C., Jacquemond V., Berthier C., Giraud M.-N., Jacko D., et al. (2024). Enhanced capacity for CaMKII signaling mitigates calcium release related contractile fatigue with high intensity exercise. Biochim. Biophys. Acta - Mol. Cell Res. 1871, 119610. doi:10.1016/j.bbamcr.2023.119610
Franzini-Armstrong C. (1970). Studies of the triad: I. Structure of the junction in frog twitch fibers. J. Cell Biol. 47, 488–499. doi:10.1083/jcb.47.2.488
Franzini-Armstrong C. (1973). Studies of the triad: IV. Structure of the junction in frog slow fibers. J. Cell Biol. 56, 120–128. doi:10.1083/jcb.56.1.120
Franzini-Armstrong C., Nunzi G. (1983). Junctional feet and particles in the triads of a fast-twitch muscle fibre. J. Muscle Res. Cell Motil. 4, 233–252. doi:10.1007/BF00712033
Franzini-Armstrong C., Protasi F., Ramesh V. (1999). Shape, size, and distribution of Ca2+ release units and couplons in skeletal and cardiac muscles. Biophys. J. 77, 1528–1539. doi:10.1016/S0006-3495(99)77000-1
Fraser J. A., Huang C. L.-H. (2004). A quantitative analysis of cell volume and resting potential determination and regulation in excitable cells. J. Physiol. 559, 459–478. doi:10.1113/jphysiol.2004.065706
Fruen B. R., Black D. J., Bloomquist R. A., Bardy J. M., Johnson J. D., Louis C. F., et al. (2003). Regulation of the RYR1 and RYR2 Ca2+ release channel isoforms by Ca2+-insensitive mutants of calmodulin. Biochemistry 42, 2740–2747. doi:10.1021/bi0267689
Fuhs T., Klausen L. H., Sønderskov S. M., Han X., Dong M. (2018). Direct measurement of surface charge distribution in phase separating supported lipid bilayers. Nanoscale 10, 4538–4544. doi:10.1039/C7NR09522H
Gabriel C., Gabriel S., Corthout E. (1996). The dielectric properties of biological tissues: I. Literature survey. Phys. Med. Biol. 41, 2231–2249. doi:10.1088/0031-9155/41/11/001
Gardill B. R., Rivera-Acevedo R. E., Tung C. C., Van Petegem F. (2019). Crystal structures of Ca2+–calmodulin bound to NaV C-terminal regions suggest role for EF-hand domain in binding and inactivation. Proc. Natl. Acad. Sci. U. S. A. 166, 10763–10772. doi:10.1073/pnas.1818618116
Gehlert S., Bloch W., Suhr F. (2015). Ca2+-dependent regulations and signaling in skeletal muscle: from electro-mechanical coupling to adaptation. Int. J. Mol. Sci. 16, 1066–1095. doi:10.3390/ijms16011066
Goldman D. E. (1943). Potential, impedance and rectification in membranes. J. Gen. Physiol. 27, 37–60. doi:10.1085/jgp.27.1.37
Gordon A. M., Huxley A. F., Julian F. J. (1966). The variation in isometric tension with sarcomere length in vertebrate muscle fibres. J. Physiol. 184, 170–192. doi:10.1113/jphysiol.1966.sp007909
Henkart M., Landis D. M. D., Reese T. S. (1976). Similarity of junctions between plasma membranes and endoplasmic reticulum in muscle and neurons. J. Cell Biol. 70, 338–347. doi:10.1083/jcb.70.2.338
Horie R., Kubota T., Koh J., Tanaka R., Nakamura Y., Sasaki R., et al. (2020). EF hand-like motif mutations of Nav1.4 C-terminus cause myotonic syndrome by impairing fast inactivation. Muscle Nerve 61, 808–814. doi:10.1002/mus.26849
Horváth B., Váczi K., Hegyi B., Gönczi M., Dienes B., Kistamás K., et al. (2016). Sarcolemmal Ca2+-entry through L-type Ca2+ channels controls the profile of Ca2+-activated Cl-current in canine ventricular myocytes. J. Mol. Cell. Cardiol. 97, 125–139. doi:10.1016/J.YJMCC.2016.05.006
Huang C. L.-H. (2001). Charge movements in intact amphibian skeletal muscle fibres in the presence of cardiac glycosides. J. Physiol. 532, 509–523. doi:10.1111/j.1469-7793.2001.0509f.x
Huang C. L.-H. (2017). Murine electrophysiological models of cardiac arrhythmogenesis. Physiol. Rev. 97, 283–409. doi:10.1152/physrev.00007.2016
Huang C. L.-H., Pedersen T. H., Fraser J. A. (2011). Reciprocal dihydropyridine and ryanodine receptor interactions in skeletal muscle activation. J. Muscle Res. Cell Motil. 32, 171–202. doi:10.1007/s10974-011-9262-9
Kano M., Garaschuk O., Verkhratsky A., Konnerth A. (1995). Ryanodine receptor-mediated intracellular calcium release in rat cerebellar Purkinje neurones. J. Physiol. 487, 1–16. doi:10.1113/jphysiol.1995.sp020857
Kelly D. E. (1969). The fine structure of skeletal muscle triad junctions. J. Ultrastruct. Res. 29, 37–49. doi:10.1016/S0022-5320(69)80054-7
Khunpetch P., Majee A., Podgornik R. (2022). Curvature effects in charge-regulated lipid bilayers. Soft Matter 18, 2597–2610. doi:10.1039/D1SM01665B
King J., Wickramarachchi C., Kua K., Du Y., Jeevaratnam K., Matthews H. R., et al. (2013). Loss of Nav1.5 expression and function in murine atria containing the RyR2-P2328S gain-of-function mutation. Cardiovasc. Res. 99, 751–759. doi:10.1093/cvr/cvt141
Knot H. J., Standen N. B., Nelson M. T. (1998). Ryanodine receptors regulate arterial diameter and wall [Ca2+] in cerebral arteries of rat via Ca2+-dependent K+ channels. J. Physiol. 508, 211–221. doi:10.1111/j.1469-7793.1998.211br.x
Kohda K., Inoue T., Mikoshiba K. (1995). Ca2+ release from Ca2+ stores, particularly from ryanodine-sensitive Ca2+ stores, is required for the induction of LTD in cultured cerebellar Purkinje cells. J. Neurophysiol. 74, 2184–2188. doi:10.1152/jn.1995.74.5.2184
Kovacs L., Rios E., Schneider M. F. (1983). Measurement and modification of free calcium transients in frog skeletal muscle fibres by a metallochromic indicator dye. J. Physiol. 343, 161–196. doi:10.1113/jphysiol.1983.sp014887
Kushmerick M. J., Podolsky R. J. (1969). Ionic mobility in muscle cells. Science 166, 1297–1298. doi:10.1126/science.166.3910.1297
Lanner J. T., Georgiou D. K., Joshi A. D., Hamilton S. L. (2010). Ryanodine receptors: structure, expression, molecular details, and function in calcium release. Cold Spring Harb. Perspect. Biol. 2, a003996. doi:10.1101/cshperspect.a003996
Lei M., Salvage S., Jackson A., Huang C.-H. (2024). Cardiac arrhythmogenesis: roles of ion channels and their functional modification. Front. Physiol. 15, 1342761. doi:10.3389/fphys.2024.1342761
Li T., Liu T., Yang B., Jiang Q., Zhou Y., Wang J., et al. (2023). Small-conductance calcium-activated potassium channels in the heart: expression, regulation and pathological implications. Philos. Trans. R. Soc. Lond. B. Biol. Sci. 378, 20220171. doi:10.1098/rstb.2022.0171
Lipkow K., Odde D. J. (2008). Model for protein concentration gradients in the cytoplasm. Cell. Mol. Bioeng. 1, 84–92. doi:10.1007/s12195-008-0008-8
Liu S. X., Matthews H. R., Huang C. L.-H. (2021). Sarcoplasmic reticular Ca2+-ATPase inhibition paradoxically upregulates murine skeletal muscle Nav1.4 function. Sci. Rep. 11, 2846. doi:10.1038/s41598-021-82493-w
Loussouarn G., Sternberg D., Nicole S., Marionneau C., Le Bouffant F., Toumaniantz G., et al. (2016). Physiological and pathophysiological insights of Nav1.4 and Nav1.5 comparison. Front. Pharmacol. 6, 314. doi:10.3389/fphar.2015.00314
Manoury B., Tamuleviciute A., Tammaro P. (2010). TMEM16A/anoctamin 1 protein mediates calcium-activated chloride currents in pulmonary arterial smooth muscle cells. J. Physiol. 588, 2305–2314. doi:10.1113/JPHYSIOL.2010.189506
Martin C. A., Petousi N., Chawla S., Hockaday A. R., Burgess A. J., Fraser J. A., et al. (2003). The effect of extracellular tonicity on the anatomy of triad complexes in amphibian skeletal muscle. J. Muscle Res. Cell Motil. 24, 407–415. doi:10.1023/A:1027356410698
Marx S. O., Ondrias K., Marks A. R. (1998). Coupled gating between individual skeletal muscle Ca2+ release channels (ryanodine receptors). Sci. (80-. ). 281, 818–821. doi:10.1126/science.281.5378.818
Matthews H. R., Tan S. R. X., Shoesmith J. A., Ahmad S., Valli H., Jeevaratnam K., et al. (2019). Sodium current inhibition following stimulation of exchange protein directly activated by cyclic-3′,5′-adenosine monophosphate (Epac) in murine skeletal muscle. Sci. Rep. 9, 1927. doi:10.1038/s41598-018-36386-0
McCarthy M. R., Savich Y., Cornea R. L., Thomas D. D. (2020). Resolved structural states of calmodulin in regulation of skeletal muscle calcium release. Biophys. J. 118, 1090–1100. doi:10.1016/j.bpj.2020.01.010
McLaughlin S. (1989). The electrostatic properties of membranes. Annu. Rev. Biophys. Biophys. Chem. 18, 113–136. doi:10.1146/annurev.bb.18.060189.000553
McLaughlin S., Mulrine N., Gresalfi T., Vaio G., McLaughlin A. (1981). Adsorption of divalent cations to bilayer membranes containing phosphatidylserine. J. Gen. Physiol. 77, 445–473. doi:10.1085/jgp.77.4.445
Meissner G. (2010). Regulation of ryanodine receptor ion channels through posttranslational modifications. Curr. Top. Membr. 66, 91–113. doi:10.1016/S1063-5823(10)66005-X
Melcrová A., Pokorna S., Pullanchery S., Kohagen M., Jurkiewicz P., Hof M., et al. (2016). The complex nature of calcium cation interactions with phospholipid bilayers. Sci. Rep. 6, 38035. doi:10.1038/srep38035
Meredith A. L., Wu Y., Gao Z., Anderson M. E., Dalziel J. E., Lai M. H. (2014). BK channels regulate sinoatrial node firing rate and cardiac pacing in vivo. Am. J. Physiol. - Hear. Circ. Physiol. 307, H1327–H1338. doi:10.1152/ajpheart.00354.2014
Morinaga A., Ito J., Niimi T., Maturana A. D. (2019). RBM20 regulates CaV1.2 surface expression by promoting exon 9* Inclusion of CACNA1C in neonatal rat cardiomyocytes. Int. J. Mol. Sci. 20, 5591. doi:10.3390/ijms20225591
Morris J., Bardsley O., Salvage S., Jackson A., Matthews H., Huang C.-H. (2024). Nernst-Planck-Gaussian modelling of electrodiffusional recovery from ephaptic excitation between mammalian cardiomyocytes. Front. Physiol. Sect. Card. Electrophysiol. 14, 1280151. doi:10.3389/fphys.2023.1280151
Mullins L., Noda K. (1963). The influence of sodium-free solutions on the membrane potential of frog muscle fibers. J. Gen. Physiol. 47, 117–132. doi:10.1085/jgp.47.1.117
Nathan S., Gabelli S. B., Yoder J. B., Srinivasan L., Aldrich R. W., Tomaselli G. F., et al. (2021). Structural basis of cytoplasmic NaV1.5 and NaV1.4 regulation. J. Gen. Physiol. 153, e202012722. doi:10.1085/jgp.202012722
Neelands T. R., Herson P. S., Jacobson D., Adelman J. P., Maylie J. (2001). Small-conductance calcium-activated potassium currents in mouse hyperexcitable denervated skeletal muscle. J. Physiol. 536, 397–407. doi:10.1111/j.1469-7793.2001.0397c.xd
Olivotto M., Arcangeli A., Carlà M., Wanke E. (1996). Electric fields at the plasma membrane level: a neglected element in the mechanisms of cell signalling. BioEssays News Rev. Mol. Cell. Dev. Biol. 18, 495–504. doi:10.1002/bies.950180612
Ouyang L., Shaik R., Xu R., Zhang G., Zhe J. (2021). Mapping surface charge distribution of single-cell via charged nanoparticle. Cells 10, 1519. doi:10.3390/cells10061519
Ouyang Y., Martone M. E., Deerinck T. J., Airey J. A., Sutko J. L., Ellisman M. H. (1997). Differential distribution and subcellular localization of ryanodine receptor isoforms in the chicken cerebellum during development. Brain Res. 775, 52–62. doi:10.1016/S0006-8993(97)00840-8
Pagala M. K. D., Taylor S. R. (1998). Imaging caffeine-induced Ca2+transients in individual fast-twitch and slow-twitch rat skeletal muscle fibers. Am. J. Physiol. Physiol. 274, C623–C632. doi:10.1152/ajpcell.1998.274.3.C623
Parekh A. B. (2008). Ca2+ microdomains near plasma membrane Ca2+ channels: impact on cell function. J. Physiol. 586, 3043–3054. doi:10.1113/jphysiol.2008.153460
Passiniemi P. (1983). Accurate tracer diffusion coefficients of Na+ and Cl− ions in dilute aqueous sodium chloride solutions measured with the closed capillary method. J. Solut. Chem. 12, 801–813. doi:10.1007/BF00653183
Pertille A., de Carvalho C. L. T., Matsumura C. Y., Neto H. S., Marques M. J. (2010). Calcium-binding proteins in skeletal muscles of the mdx mice: potential role in the pathogenesis of Duchenne muscular dystrophy. Int. J. Exp. Pathol. 91, 63–71. doi:10.1111/j.1365-2613.2009.00688.x
Pineda S., Nikolova-Krstevski V., Leimena C., Atkinson A. J., Altekoester A. K., Cox C. D., et al. (2021). Conserved role of the large conductance calcium-activated potassium channel, KCa1.1, in sinus node function and arrhythmia risk. Circ. Genomic Precis. Med. 14, e003144. doi:10.1161/CIRCGEN.120.003144
Pizarro G., Csernoch L., Uribe I., Rodríguez M., Ríos E. (1991). The relationship between Q gamma and Ca release from the sarcoplasmic reticulum in skeletal muscle. J. Gen. Physiol. 97, 913–947. doi:10.1085/jgp.97.5.913
Potet F., Chagot B., Anghelescu M., Viswanathan P. C., Stepanovic S. Z., Kupershmidt S., et al. (2009). Functional interactions between distinct sodium channel cytoplasmic domains through the action of calmodulin. J. Biol. Chem. 284, 8846–8854. doi:10.1074/jbc.M806871200
Robertson S. P., Johnson J. D., Potter J. D. (1981). The time-course of Ca2+ exchange with calmodulin, troponin, parvalbumin, and myosin in response to transient increases in Ca2+. Biophys. J. 34, 559–569. doi:10.1016/S0006-3495(81)84868-0
Rodney G. G., Williams B. Y., Strasburg G. M., Beckingham K., Hamilton S. L. (2000). Regulation of RYR1 activity by Ca2+ and calmodulin. Biochemistry 39, 7807–7812. doi:10.1021/bi0005660
Sacchetto R., Margreth A., Pelosi M., Carafoli E. (1996). Colocalization of the dihydropyridine receptor, the plasma-membrane calcium ATPase isoform 1 and the sodium/calcium exchanger to the junctional-membrane domain of transverse tubules of rabbit skeletal muscle. Eur. J. Biochem. 237, 483–488. doi:10.1111/j.1432-1033.1996.0483k.x
Sage S. O., Pugh N., Farndale R. W., Harper A. G. S. (2013). Pericellular Ca2+ recycling potentiates thrombin-evoked Ca2+ signals in human platelets. Physiol. Rep. 1, e00085. doi:10.1002/phy2.85
Salvage S., Dulhunty A., Jeevaratnan K., Jackson A., Huang C. L.-H. (2023). Feedback contributions to excitation-contraction coupling in native functioning striated muscle. Philos. Trans. R. Soc. Lond. B. Biol. Sci. 378, 20220162. doi:10.1098/rstb.2022.0162
Salvage S. C., Habib Z. F., Matthews H. R., Jackson A. P., Huang C. L.-H. (2021). Ca2+-dependent modulation of voltage-gated myocyte sodium channels. Biochem. Soc. Trans. 49, 1941–1961. doi:10.1042/bst20200604
Sanabria H., Digman M. A., Gratton E., Waxham M. N. (2008). Spatial diffusivity and availability of intracellular calmodulin. Biophys. J. 95, 6002–6015. doi:10.1529/biophysj.108.138974
Sanchez C., Berthier C., Tourneur Y., Monteiro L., Allard B., Csernoch L., et al. (2021). Detection of Ca2+transients near ryanodine receptors by targeting fluorescent Ca2+ sensors to the triad. J. Gen. Physiol. 153, e202012592. doi:10.1085/JGP.202012592
Sanchez J. A., Stefani E. (1978). Inward calcium current in twitch muscle fibres of the frog. J. Physiol. 283, 197–209. doi:10.1113/jphysiol.1978.sp012496
Sánchez J. A., Stefani E. (1983). Kinetic properties of calcium channels of twitch muscle fibres of the frog. J. Physiol. 337, 1–17. doi:10.1113/jphysiol.1983.sp014607
Sancho M., Kyle B. D. (2021). The large-conductance, calcium-activated potassium channel: a big key regulator of cell physiology. Front. Physiol. 12, 750615. doi:10.3389/fphys.2021.750615
Sarbjit-Singh S., Matthews H., Huang C. L.-H. (2020). Ryanodine receptor modulation by caffeine challenge modifies Na+ current properties in intact murine skeletal muscle fibres. Sci. Rep. 2199. doi:10.1038/s41598-020-59196-9
Satoh H., Delbridge L. M., Blatter L. A., Bers D. M. (1996). Surface:volume relationship in cardiac myocytes studied with confocal microscopy and membrane capacitance measurements: species-dependence and developmental effects. Biophys. J. 70, 1494–1504. doi:10.1016/S0006-3495(96)79711-4
Saucerman J. J., Bers D. M. (2012). Calmodulin binding proteins provide domains of local Ca2+ signaling in cardiac myocytes. J. Mol. Cell. Cardiol. 52, 312–316. doi:10.1016/j.yjmcc.2011.06.005
Seidler N. W., Jona I., Vegh M., Martonosi A. (1989). Cyclopiazonic acid is a specific inhibitor of the Ca2+-ATPase of sarcoplasmic reticulum. J. Biol. Chem. 264, 17816–17823. doi:10.1016/s0021-9258(19)84646-x
Sekiguchi F., Shimamura K., Kawata K., Nakazawa Y., Saitoh R., Yanagitani Y., et al. (1999). Effects of cyclopiazonic acid on contraction and intracellular Ca2+ in oesophageal striated muscle of normotensive and spontaneously hypertensive rats. Br. J. Pharmacol. 128, 961–968. doi:10.1038/sj.bjp.0702867
Singh P., Salih M., Leddy J. J., Tuana B. S. (2004). The muscle-specific calmodulin-dependent protein kinase assembles with the glycolytic enzyme complex at the sarcoplasmic reticulum and modulates the activity of glyceraldehyde-3-phosphate dehydrogenase in a Ca2+/calmodulin-dependent manner. J. Biol. Chem. 279, 35176–35182. doi:10.1074/jbc.M402282200
Soeller C., Cannell M. B. (1997). Numerical simulation of local calcium movements during L-type calcium channel gating in the cardiac diad. Biophys. J. 73, 97–111. doi:10.1016/S0006-3495(97)78051-2
Spencer D., Morgan H. (2020). High-speed single-cell dielectric spectroscopy. ACS Sensors 5, 423–430. doi:10.1021/acssensors.9b02119
Swaminathan P. D., Purohit A., Hund T. J., Anderson M. E. (2012). Calmodulin-dependent protein kinase II: linking heart failure and arrhythmias. Circ. Res. 110, 1661–1677. doi:10.1161/CIRCRESAHA.111.243956
Tanskanen A. J., Greenstein J. L., Chen A., Sun S. X., Winslow R. L. (2007). Protein geometry and placement in the cardiac dyad influence macroscopic properties of calcium-induced calcium release. Biophys. J. 92, 3379–3396. doi:10.1529/biophysj.106.089425
Tedoldi A., Ludwig P., Fulgenzi G., Takeshima H., Pedarzani P., Stocker M. (2020). Calcium-induced calcium release and type 3 ryanodine receptors modulate the slow afterhyperpolarising current, sIAHP, and its potentiation in hippocampal pyramidal neurons. PLoS One 15, e0230465. doi:10.1371/journal.pone.0230465
Usher-Smith J. A., Fraser J. A., Huang C. L.-H., Skepper J. N. (2007). Alterations in triad ultrastructure following repetitive stimulation and intracellular changes associated with exercise in amphibian skeletal muscle. J. Muscle Res. Cell Motil. 28, 19–28. doi:10.1007/s10974-007-9100-2
Valli H., Ahmad S., Sriharan S., Dean L. D., Grace A. A., Jeevaratnam K., et al. (2018). Epac-induced ryanodine receptor type 2 activation inhibits sodium currents in atrial and ventricular murine cardiomyocytes. Clin. Exp. Pharmacol. Physiol. 45, 278–292. doi:10.1111/1440-1681.12870
Van Nispen Tot Pannerden H., De Haas F., Geerts W., Posthuma G., Van Dijk S., Heijnen H. F. G. (2010). The platelet interior revisited: electron tomography reveals tubular alpha-granule subtypes. Blood 116, 1147–1156. doi:10.1182/blood-2010-02-268680
Vaughan-Jones R. D. (1982). Chloride activity and its control in skeletal and cardiac muscle. Philos. Trans. R. Soc. Lond. B. Biol. Sci. 299, 537–548. doi:10.1098/rstb.1982.0150
Weisbrod D. (2020). Small and intermediate calcium activated potassium channels in the heart: role and strategies in the treatment of cardiovascular diseases. Front. Physiol. 11, 590534. doi:10.3389/FPHYS.2020.590534
Wennerström H., Vallina Estrada E., Danielsson J., Oliveberg M. (2020). Colloidal stability of the living cell. Proc. Natl. Acad. Sci. 117, 10113–10121. doi:10.1073/pnas.1914599117
Witherspoon J. W., Meilleur K. G. (2016). Review of RyR1 pathway and associated pathomechanisms. Acta Neuropathol. Commun. 4, 121. doi:10.1186/s40478-016-0392-6
Woo J. S., Hwang J.-H., Ko J.-K., Weisleder N., Kim D. H., Ma J., et al. (2010). S165F mutation of junctophilin 2 affects Ca2+ signalling in skeletal muscle. Biochem. J. 427, 125–134. doi:10.1042/BJ20091225
Wu X., Bers D. M. (2007). Free and bound intracellular calmodulin measurements in cardiac myocytes. Cell Calcium 41, 353–364. doi:10.1016/j.ceca.2006.07.011
Wu Y., Whiteus C., Xu C. S., Hayworth K. J., Weinberg R. J., Hess H. F., et al. (2017). Contacts between the endoplasmic reticulum and other membranes in neurons. Proc. Natl. Acad. Sci. U. S. A. 114, E4859-E4867–E4867. doi:10.1073/pnas.1701078114
Yang B., Jiang Q., He S., Li T., Ou X., Chen T., et al. (2021). Ventricular SK2 upregulation following angiotensin II challenge: modulation by p21-activated kinase-1. J. Mol. Cell. Cardiol. 164, 110–125. doi:10.1016/J.YJMCC.2021.11.001
Yang H., Zhang G., Cui J. (2015). BK channels: multiple sensors, one activation gate. Front. Physiol. 6, 29. doi:10.3389/fphys.2015.00029
Yoder J. B., Ben-Johny M., Farinelli F., Srinivasan L., Shoemaker S. R., Tomaselli G. F., et al. (2019). Ca2+ -dependent regulation of sodium channels NaV 1.4 and NaV 1.5 is controlled by the post-IQ motif. Nat. Commun. 10, 1514. doi:10.1038/s41467–019–09570–7
Young K. A., Caldwell J. H. (2005). Modulation of skeletal and cardiac voltage-gated sodium channels by calmodulin. J. Physiol. 565, 349–370. doi:10.1113/jphysiol.2004.081422
Zeng X. H., Xia X. M., Lingle C. J. (2005). Divalent cation sensitivity of BK channel activation supports the existence of three distinct binding sites. J. Gen. Physiol. 125, 273–286. doi:10.1085/jgp.200409239
Zhang Y., Fraser J. A., Jeevaratnam K., Hao X., Hothi S. S., Grace A. A., et al. (2011). Acute atrial arrhythmogenicity and altered Ca2+homeostasis in murine RyR2-P2328S hearts. Cardiovasc. Res. 89, 794–804. doi:10.1093/cvr/cvq229
Keywords: skeletal muscle, excitation–contraction coupling, triad junction, calcium microdomains, Nernst–Planck equation, electrodiffusion
Citation: Rodríguez MD, Morris JA, Bardsley OJ, Matthews HR and Huang CL-H (2024) Nernst–Planck–Gaussian finite element modelling of Ca2+ electrodiffusion in amphibian striated muscle transverse tubule–sarcoplasmic reticular triadic junctional domains. Front. Physiol. 15:1468333. doi: 10.3389/fphys.2024.1468333
Received: 21 July 2024; Accepted: 22 October 2024;
Published: 05 December 2024.
Edited by:
Brad Palmer, University of Vermont, United StatesReviewed by:
Mohsin Saleet Jafri, George Mason University, United StatesNicolae Moise, The Ohio State University, United States
Copyright © 2024 Rodríguez, Morris, Bardsley, Matthews and Huang. This is an open-access article distributed under the terms of the Creative Commons Attribution License (CC BY). The use, distribution or reproduction in other forums is permitted, provided the original author(s) and the copyright owner(s) are credited and that the original publication in this journal is cited, in accordance with accepted academic practice. No use, distribution or reproduction is permitted which does not comply with these terms.
*Correspondence: Christopher L.-H. Huang, Y2xoMTFAY2FtLmFjLnVr
 Marco D. Rodríguez
 Joshua A. Morris
 Oliver J. Bardsley
 Hugh R. Matthews1
 Christopher L.-H. Huang