- Department of Otorhinolaryngology, Medical School, Division of Phoniatrics and Pediatric Audiology, Friedrich-Alexander-Universität Erlangen-Nürnberg (FAU), Head and Neck Surgery, University Hospital Erlangen, Erlangen, Waldstrasse, Germany
Introduction: The human voice is generated by the oscillation of the vocal folds induced by exhalation airflow. Consequently, the characteristics of these oscillations and the primary sound signal are controlled by the longitudinal tension of the vocal folds, the flow rate, and their prephonatoric position. To facilitate independent control of these parameters, a synthetic larynx model was developed, as detailed in a previous publication.
Methods: This study aims to statistically analyze the influence of airflow and fiber tension on phonation characteristics, such as periodicity and symmetry, glottis closure during vocal fold oscillations, as well as tissue elasticity and generated sound. A total of 76 experiments were conducted and statistically analyzed with a systematic variation of flow rate and longitudinal tension within the vocal folds.During these experiments, vocal fold motion, subglottal pressure, and emitted sound were meticulously measured and analyzed.
Results: Groupwise statistical testing identified the flow rate as the main influencing parameter on nearly all phonation characteristics. However, the fundamental frequency, stiffness parameters, and quality parameters of the primary sound signal are predominantly controlled by the longitudinal tension within the vocal folds.
Discussion: The results demonstrated a complex interplay between the flow rate and tension, resulting in different characteristics of the produced sound signal.
1 Introduction
The human voice plays a crucial role in social communication (Tiwari and Tiwari, 2012; Stewart et al., 2020; Kraus, 2017) and mental health (Bashshur and Oc, 2015; Rubin et al., 2019; Fagherazzi et al., 2021). In particular, the study of the physiology of the larynx, vocal folds, and acoustic voice production has made considerable progress in recent decades to gain a deeper understanding of this complex process and to develop new approaches for the diagnosis and therapy of vocal fold pathologies, such as vocal atrophy (Nguyen et al., 2009; Choi et al., 2012; Morrison et al., 1983; Van Den and Tan, 1959; Martins et al., 2015). The primary acoustic voice signal is generated and controlled deep in the larynx due to the fluid-structure interaction between the exhalation airflow from the lungs and the hyperelastic vocal folds (Mohri et al., 1998; Iwarsson et al., 1998).
Due to the significant ethical and practical limitations associated with experimental analysis of the phonation process in living humans or animals, synthetic larynx models have been developed to serve as a controlled and reproducible test environment. These models enable the investigation of all aspects of the biomechanical phonation process, as they are scientifically valid (Scherer et al., 2001; Barney et al., 1999; Deverge et al., 2003; Cisonni et al., 2008; Kniesburges et al., 2020) classified vocal-fold models into three main groups according to their experimental strategy: static, driven, and fully coupled models. By integrating fibers into the model, the biomechanical properties of the human larynx can be simulated, allowing for a more comprehensive exploration of the interactions among airflow, tension, and the resulting response during phonation (Vahabzadeh-Hagh et al., 2018; Xuan and Zhang, 2014; Shaw et al., 2012; Murray and Thomson, 2012). In that context, this study focused on the statistical evaluation of data measured from a synthetic silicone laryngeal model with integrated fibers, as described by Tur et al. (2023). This model not only includes fibers in the ligament layers but can also reproduce laryngeal movements, such as adduction and elongation.
This study aimed to investigate the complex relationships between airflow, prephonatory tension, and motion of the vocal folds within the synthetic larynx based on glottal and acoustic parameters. Statistical analysis was performed to identify the effects of flow rate and tension on periodicity, symmetry, and glottis closure during oscillation, as well as tissue elasticity and produced sound.
2 Methods
2.1 The synthetic larynx model
The artificial larynx model introduced by Tur et al. (2023) was investigated concerning the impact of the flow rate and fiber tension in integrated fibers on different dynamic, acoustic, and mechanical parameters related to voice production. The exact geometry, fabrication procedure, and material composition of the model are presented in Figure 1.
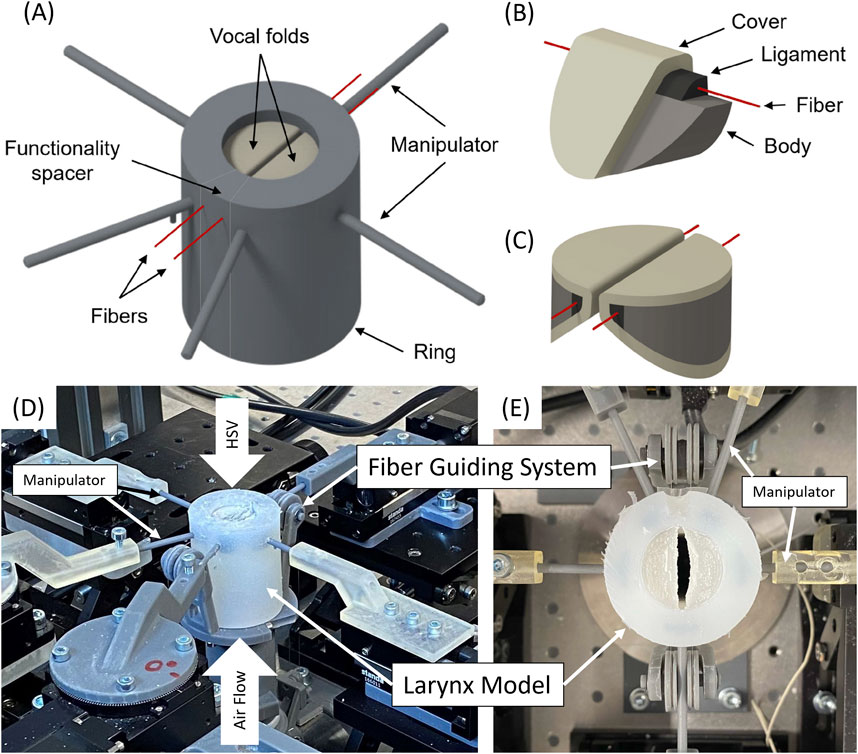
Figure 1. (A) 3D CAD model of the entire larynx, including the manipulators, the vocal folds (based on the M5 model), the ring, and the fibers (B) Detailed view of the individual layers in the vocal fold model, showing the body, ligament, fiber, and cover. (C) 3D perspective of the vocal folds arranged within the larynx model. (D) Perspective view of the measurement setup with the mounted model showing air flow supply, highspeed video (HSV) camera positioning. (E) Top view of the model showing the fiber guiding system.
The synthetic vocal folds possess the M5 geometry described by Scherer et al. (Barney et al., 1999) and consist of three silicone layers that reproduce the anatomical structures of human vocal folds, including the vocalis muscle, ligament, and lamina propria (Scherer et al., 2001). Additionally, fibers have been integrated into the ligament to vary the longitudinal tension in vocal fold models. In the experiment, the fibers were stretched to a certain length without explicitly measuring the tension.
Synthetic vocal folds were embedded within a silicone cylinder, which additionally included manipulators to control the prephonatory position of the vocal folds.
The integrated fibers had a diameter of 0.108 mm and a breaking resistance of 1.18 kg. They consisted of polyvinylidene fluoride (PVDF) with the following dynamic mechanical properties: E′-modulus of 2.91 GPa (0.07 standard deviation), E´´-modulus of 0.08 GPa (0.01 GPa standard deviation) and loss-tangent tanδ of 0.03 (0.00 standard deviation). Detailed information regarding the manufacturing process can be found in Tur et al. (2023).
2.2 Measurement setup
To control longitudinal tension in the ligament fibers, a 7T67-25 Stab. A Steel Translation Stage (Standa Ltd., Vilnius, Lithuania) with a linear travel range of 25 mm is used. To reduce friction, a customized guiding system was developed to direct the fibers parallelly through the two vocal folds.
The flow rate was controlled using a 1578 A/B mass flow controller (MKS, Andover, MA, United States) and a 4000 B 154 digital power supply (MKS) (Birk et al., 2017a; Semmler et al., 2021; Jakubaß et al., 2023; Peters et al., 2022). The flow rate amounted to 30–200 standard liters per minute (SLM), with the lower value being the flow rate for oscillation onset. Subglottal pressure was measured using an XCS-93-5PSISG pressure sensor (Kulite Semiconductor Products, Inc., Leonia, NJ, United States) positioned approximately 130 mm below the glottal plane connected to a PXle-4330 bridge module (National Instruments, Austin, TX, United States) with a sampling frequency of 44.1 kHz.
High-speed videos of glottal dynamics were captured using a Phantom V2511 high-speed digital camera (Vision Research, Wayne, NJ), United States) at a frame rate of 4,000 frames/s (fps) with an image resolution of 768 × 768 pixels and a recording time of a minimum of 600 ms. A Canon EF 180 mm f/3.5 L macro lens (Canon Inc., Tokyo, Japan) projected the vocal folds on a camera chip.
Acoustic signals were recorded in the supraglottal region using two 4,189 1/2-inch free-field microphones (Brüel and Kjær, Nærum, Denmark) at 30 cm from the model and sampled with a frequency of 44.1 kHz for a duration of 1s using a PXLe-4492 sound and vibration module (National Instruments, Austin, TX).
Acoustic and pressure data were acquired simultaneously using a LabVIEW script.
The model was mounted on an artificial trachea, and the fibers were secured to a linear translation stage. The translation stage, with a range of 0–25 mm, was initially set at 5 mm to represent minimal tension.
It was ensured that the fibers were in a completely tension-free state by setting the translation stage to 0 mm. The vocal folds were then adducted to achieve complete glottal closure. The flow rate was gradually increased until the synthetic vocal folds began to oscillate stably, at which point measurement was started. The flow rate was then increased in increments of 10 SLM, taking measurements at each step until reaching the maximum flow rate of 200 SLM.
After completing these measurements on one fiber tensioning level, the flow was turned off, and the fiber tension was increased by elongating the fibers by 5 mm. The glottal closure was reestablished if necessary, and the measurement process was repeated starting from the onset flow level of oscillation. This protocol was repeated at six different tension levels, with the maximum fiber elongation set at 20 mm, representing the highest tension level. This resulted in a total of N = 76 measurements for the flow ranges between 30 SLM and 200 SLM for fiber tensioning levels from 0 mm to 25 mm (Tur et al., 2023).
2.3 Data acquisition
Table 1 shows 13 key phonation parameters (glottal dynamic, mechanical, acoustic) evaluated within this study. Additionally, the fundamental frequency and subglottal pressure are considered to represent general phonation parameters (Semmler et al., 2021).
1. Subglottal Pressure
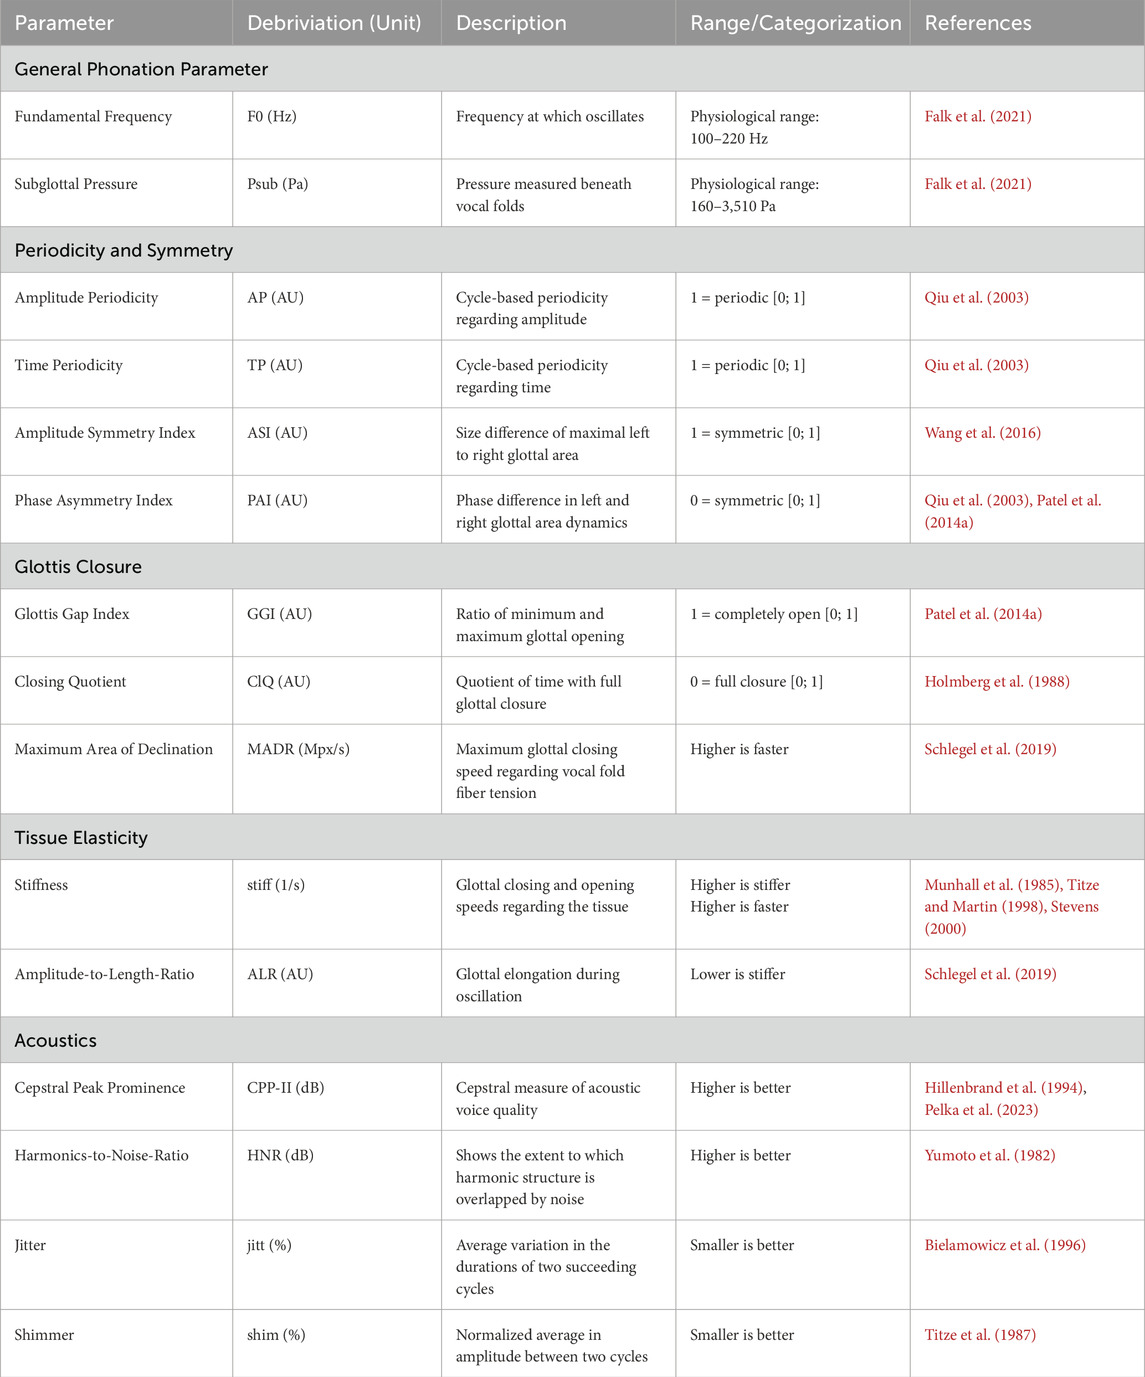
Table 1. Overview of all considered parameters in this publication. The term “higher/smaller is better” refers to physiological modal phonation regarding efficiency, regularity, harmony, and noise (Titze and for, 1995).
Based on the subglottal pressure signal, the mean subglottal pressure and fundamental frequency of vocal-fold oscillation were computed using MATLAB R2021b (The MathWorks, Inc., Natick, MA, United States).
2. GAW Dynamic and Mechanical Parameters
For the analysis of vocal fold dynamics, glottal segmentation, and subsequent analysis were performed using the in-house program Glottis-Analysis-Tool 2020 (GAT) (Maryn et al., 2020; Kist et al., 2021) by extracting the glottal area waveform (GAW), which is the glottis area as a function of time. A minimum of 20 consecutive cycles were used to ensure stable results (Schlegel et al., 2018; Karnell et al., 1995). Based on the GAW, parameters that can be divided into three categories were computed:
- Periodicity and Symmetry
Amplitude Periodicity (AP), Time Periodicity (TP), Amplitude Symmetry Index (ASI) and Phase Asymmetry Index (PAI).
- Glottis closure characteristics:
Parameters: Glottis Gap Index (GGI) Closing Quotient (ClQ) and maximum area of decline (MADR).
- Tissue elasticity:
Parameters: Stiffness (stiff) and Amplitude-to-Length-Ratio (ALR).
The stiffness parameter as a measure of tissue elasticity is a pure quantity derived from motion characteristics of the vocal folds recorded by the high speed camera, see Equation 1 (Munhall et al., 1985)
The stiff quantifies the maximum closing and opening speed of the glottis relative to the dynamic range Ai of the glottal area waveform (GAW) for the ith cycle. Here, s(t) represents the absolute magnitude of the first derivative of the GAW for the ith cycle, with Ti being the duration of that cycle (Munhall et al., 1985). A lower stiff value indicates a slower glottal opening and closing speed. Generally, this parameter is interpreted as follows: a higher stiff value suggests increased tissue stiffness, as the vocal folds move faster under tension, thereby reducing their flexibility during rapid movement (Kist et al., 2021; Pelka et al., 2023; Titze and Martin, 1998; Roy, 2003).
3. Acoustic Parameters
The acoustic signals were analyzed for 100 oscillation cycles within the GAT (Alipour et al., 1997; Mehta et al., 2011). 2 parameter categories were focused on:
- Sound quality measures:
Parameters: Cepstral Peak Prominence (CPP) and Harmonics-to-Noise-Ratio (HNR).
- Regularity:
Parameters: Jitter (jitt) and Shimmer (shim).
2.4 Statistical data analysis
The statistical analysis was carried out with respect to the following questions:
1. What influence does the flow rate have on the parameters?
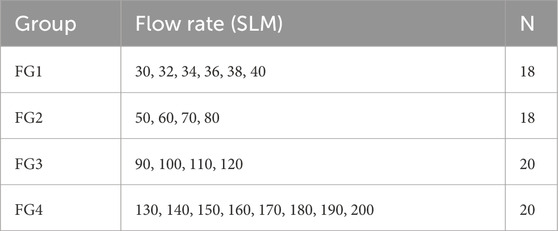
To analyze the impact of the flow rate, the experimental dataset was divided into four flow groups, as shown in Table 2. FG1 and FG2 represent the physiological range of flow rates typically observed during exhalation ranging from 48 to 112 L/min (Scheinherr et al., 2015), while FG3 and FG4 correspond to non-physiological conditions. These non-physiological flow ranges were still considered, as they potentially show important relationships. The flow groups contain a similar number of measurements, ensuring that the statistical analysis is not biased by unequal sample sizes. N indicates the number of data points within each respective flow rate range.
2. What influence does the fiber tension have on the parameters?
To determine the influence of longitudinal fiber tension, five different stretching lengths (SL) were compared, indicating fiber tension using a pairwise test. Fiber elongation was performed in the total range of 0 mm–20 mm in 5 mm increments. This resulted in the pairwise comparisons presented in Table 3.
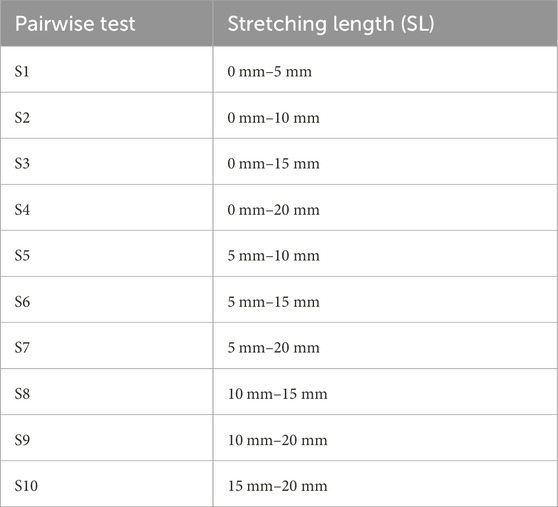
Table 3. Overview of the comparison tests regarding the fiber tension. The fiber tension level is indicated by the stretching lengths.
All statistical analyses were performed using SPSS version 29 (IBM Corp., Armonk, NY, United States). Kruskal-Wallis tests were performed at a significance level of p < 0.05. Nonparametric Mann-Whitney-U-Tests were applied post hoc for pairwise comparisons. According to the Bonferroni correction, the significance level was calculated as p < 0.0083 for the flow rate groups FG1-FG4 and p < 0.005 for the comparison of stretching length S1-S10.
3 Results
3.1 Global statistical overview
The results of the statistical analysis are presented in combination with classical boxplots, which show the distribution of measurements for each group. The horizontal line within the box represents the median value across all measurements in the group, while the cross indicates the mean value. Outliers are additionally depicted by circles.
3.1.1 Flow rate impact
The statistical analysis, in combination with Figures 2–6 indicates that the flow rate influences nearly all parameter groups, most prominently the General Phonation Parameters, Symmetry, and Acoustics groups, as listed in Table 4.
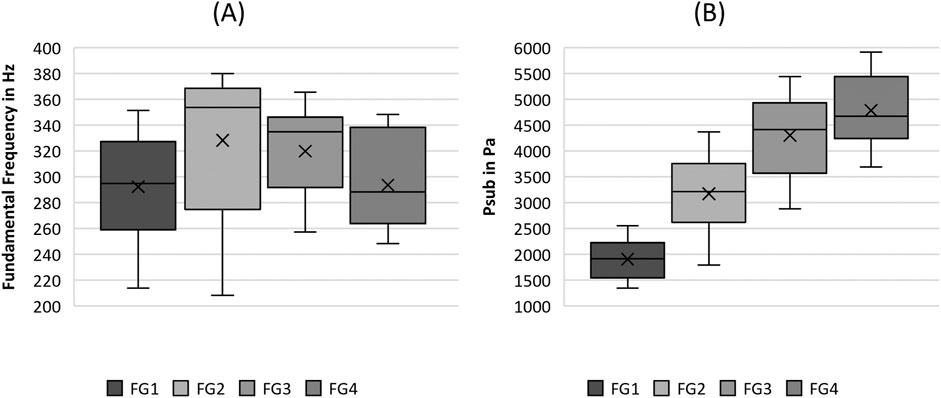
Figure 2. Boxplot representation of the (A) fundamental frequency and the (B) subglottal pressure as function of flow rate. The horizontal line within the box corresponds to the median, the cross to the mean value. Outliers are indicated by circles.
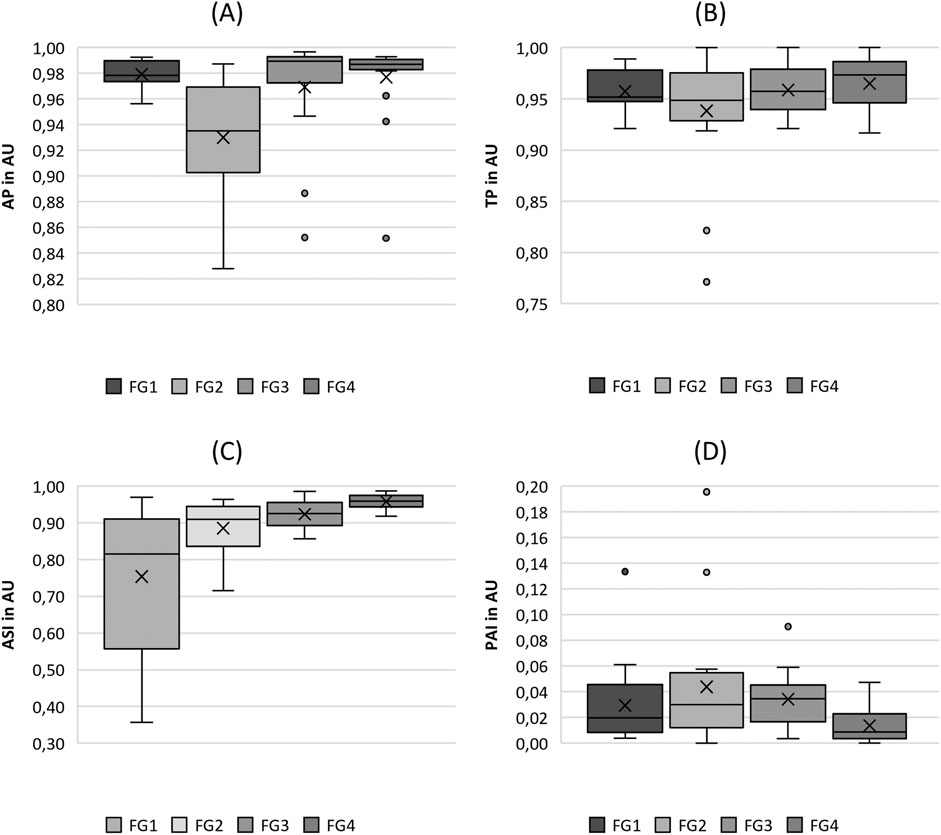
Figure 3. Boxplot representation of the (A) amplitude periodicity (AP), (B) time periodicity (TP), (C) amplitude symmetry index (ASI) and (D) phase asymmetry index (PAI) as function of flow rate. The horizontal line within the box corresponds to the median, the cross to the mean value. Outliers are indicated by circles.
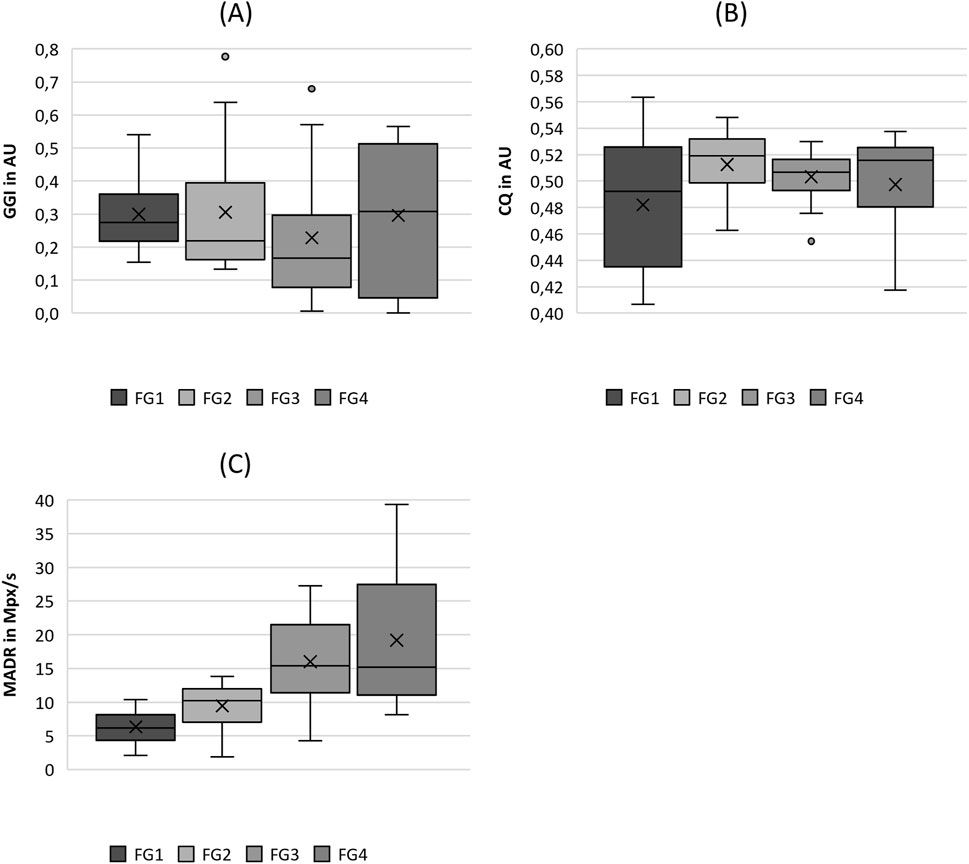
Figure 4. Boxplot representation of the (A) glottis gap index (GGI), (B) closing quotient (CIQ) and (C) maximum area of declination (MADR) as function of flow rate. The horizontal line within the box corresponds to the median, the cross to the mean value. Outliers are indicated by circles.
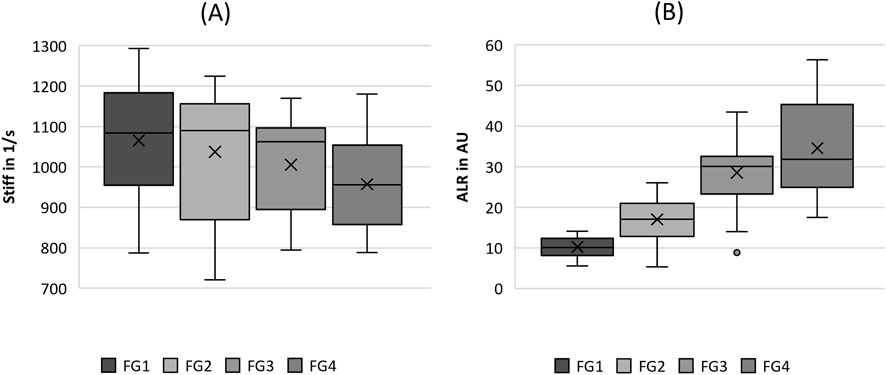
Figure 5. Boxplot representation of the (A) stiffness (stiff) and (B) amplitude-to-length-ratio (ALR) as function of flow rate. The horizontal line within the box corresponds to the median, the cross to the mean value. Outliers are indicated by circles.
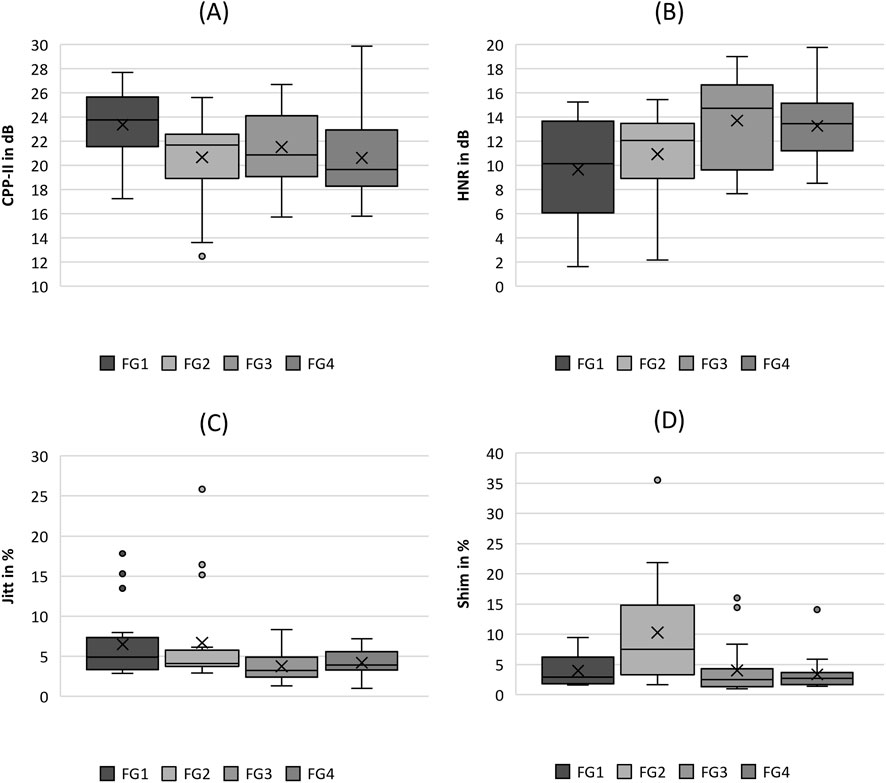
Figure 6. Boxplot representation of the (A) cepstral peak prominence (CPP), (B) harmonics-to-noise-ratio (HNR), (C) jitter (jitt) and (D) shimmer (shim) as function of flow rate. The horizontal line within the box corresponds to the median, the cross to the mean value. Outliers are indicated by circles.
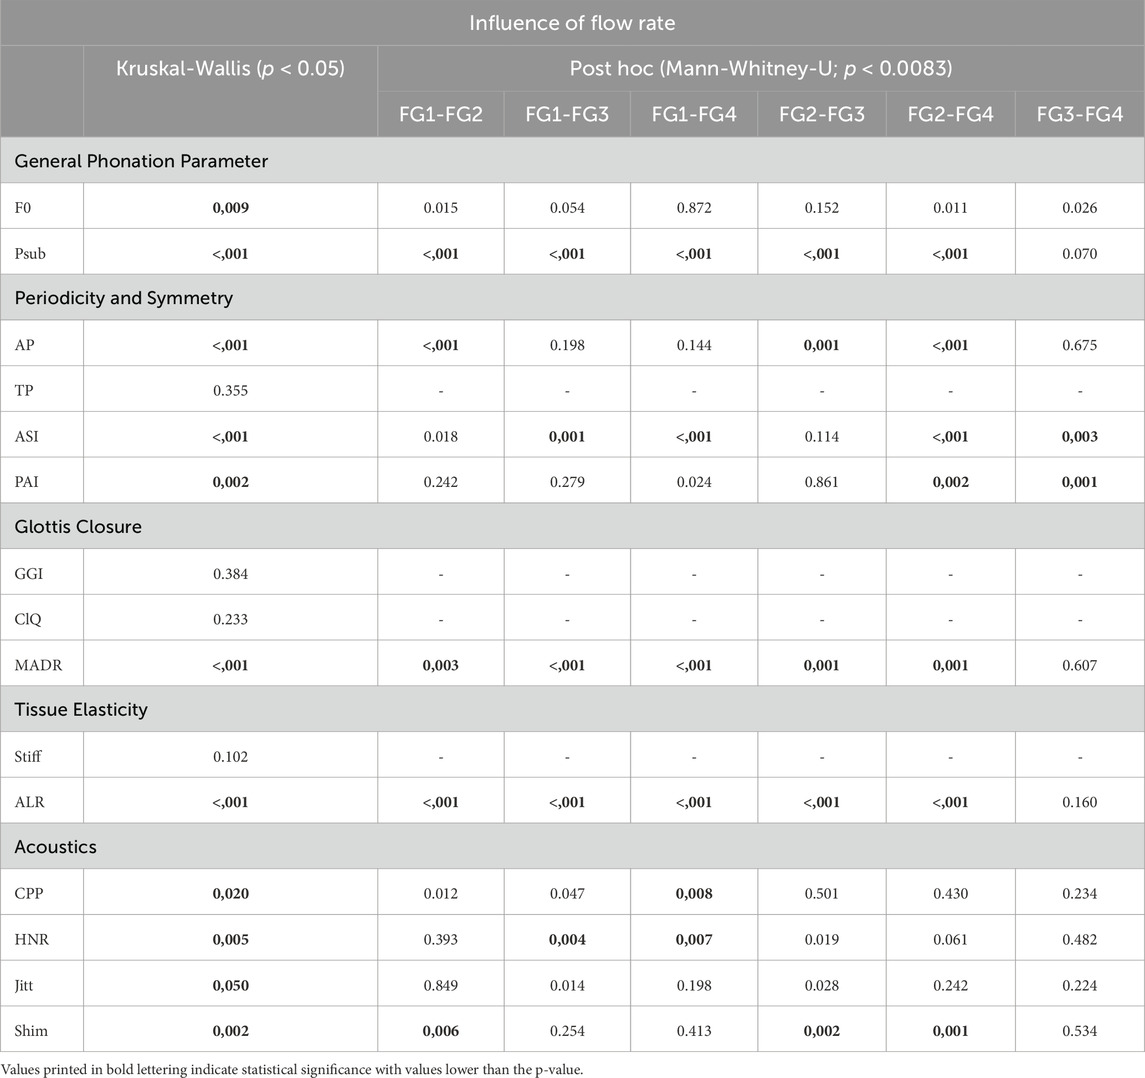
Table 4. Overview of the Kruskal-Wallis test and post hoc for the influence of flow rate on all parameters.
The post hoc tests indicated a decreasing influence with increasing flow rate, as there were only two parameters (ASI and PAI) that exhibited significant differences between flow rates FG3 and FG4.
Thus, changes in the flow rate from 90SLM SLM to 200SLM (FG3 and FG4) rarely generated significant differences in the parameters.
For all other pairwise comparisons, the proportions of significant differences in the parameters were approximately equally distributed.
3.1.2 Fiber tension impact
The main influence of fiber tension was observed in F0, Stiffness, GGI, and CPP. One parameter group with no significant differences between the Periodicity and Symmetry of the fiber tension was found. Furthermore, it is noticeable that for S8, S9, and S10, there are no longer significant changes in any of the parameters, indicating that increasing the stretching length from 10 to 20 mm no longer affects the evaluated parameters.
3.2 Influence of flow rate on phonation parameters
3.2.1 General phonation parameters
The analysis demonstrated lower F0 values for flow rates FG1 and FG4, whereas FG2 and FG3 show higher values of F0 as displayed in Figure 2A. Although F0 demonstrated significant differences in flow rate in Table 4, all pairwise comparisons of the single flow rate groups were not significant.
The Psub was found to increase with increasing flow rate, as illustrated in Figure 2B. According to Table 4, this increase is indicated by the significance in the Kruskal-Wallis test as well as in most pairwise tests, except for the comparison between FG3 and FG4.
3.2.2 periodicity and symmetry
Looking at the periodicity parameters in Figure 3, fairly constant values for both AP and TP were observed, ranging from 0.828 to 0.997 (mean: 0.964) for AP and from 0.771 to 1.000 (mean: 0.956) for TP, indicating a high level of periodicity. An exception was the flow rate group FG2 for the Amplitude Periodicity (AP), which demonstrated slightly lower values (mean: 0.93) than the other flow rates (0.975). Thus, the statistical tests yielded only statistical differences for comparisons with FG2, as listed in Table 4.
In Figure 3C, the ASI shows an increasing trend with increasing flow rate, indicating a larger symmetry of the vocal fold oscillations at larger flow rates. The statistical significance of the parameters also indicated this trend, although the pairwise tests between FG2, FG1, and FG3 were computed as insignificant (see Table 4). The PAI (Figure 3D) did not exhibit a clear trend. However, it indicated a decrease in asymmetry at higher flow rates, which was statistically significant for the comparison of FG2 with FG3 and FG4, as listed in Table 4.
3.2.3 Closure
As depicted in Figure 4A, there is a slight tendency for the GGI to decline with increasing flow rate, with the exception of FG4, which exhibits a wider range including GGI = 0, representing complete glottis closure. However, this trend was not indicated by the significant differences between the flow rate groups, as listed in Table 4. The same holds for ClQ, which does not show any reasonable trend, as illustrated in Figure 4B. In contrast, as illustrated in Figure 4C, the MADR revealed a statistically significant difference in increasing values with increasing flow rate, with the only exception being the pairwise comparison between FG3 and FG4.
3.2.4 Tissue elasticity
Regarding the tissue elasticity-related parameters in Figure 5, the stiffness seemed to decrease with increasing flow rate; however, no statistical difference between the flow rate groups was observed, as listed in Table 4. However, ALR exhibited a clear rising trend with increasing flow rate, as illustrated in Figure 5B. Similarly, for the MADR, the significant trend was only violated by the non-significant difference between FG3 and FG4, although the basic trend was still visible.
3.2.5 Acoustics
In the acoustic group, the CPP and HNR parameters demonstrated a clear trend with increasing flow rate, as displayed in Figures 6A, B, with statistically significant differences according to the Kruskal-Wallis test, as listed in Table 4. The trends were opposite, that is CPP decreased and HNR increased with increasing flow rate. Evaluating the pairwise tests in Table 4, however, this relationship is weak because only the comparison between FG1, FG3, and FG4 was statistically significant in the pairwise tests.
In contrast, the two parameters Jitter and Shimmer do not show a reasonable trend for increasing flow rate, as illustrated in Figures 6C, D, although both demonstrated significant differences with increasing flow rate (see Table 4). Furthermore, the pairwise comparisons were not significant, except for Shimmer, which exhibited a larger range and median value for FG2, similar to the AP parameter from the periodicity group.
3.3 Influence of fiber tension indicated by the stretching length on phonation parameters
3.3.1 General phonation parameters
A clear rising trend in F0 can be observed with increasing stretching length (SL), as illustrated in Figure 7A. This trend holds up to a 10 mm elongation of the fibers. For higher stretching, F0 remained constant, which is also obvious in the pairwise tests demonstrating non-significant differences for the comparisons of SL of 10, 15, and 20 mm (S8-S10), as listed in Table 5.
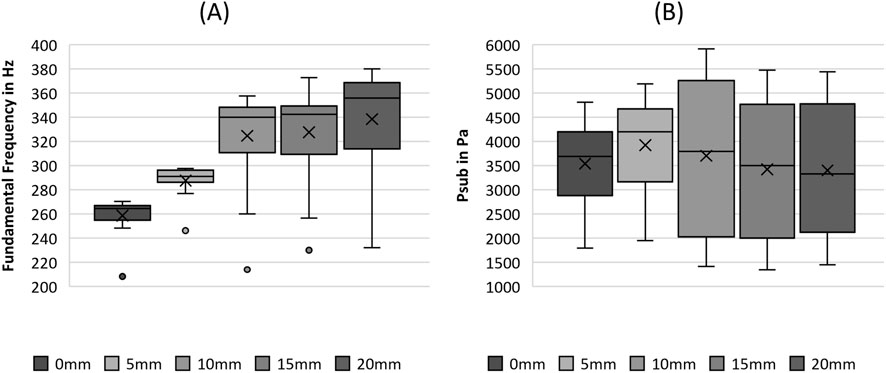
Figure 7. Boxplot representation of the (A) fundamental frequency and the (B) subglottal pressure as function of flow rate. The horizontal line within the box corresponds to the median, the cross to the mean value. Outliers are indicated by circles.
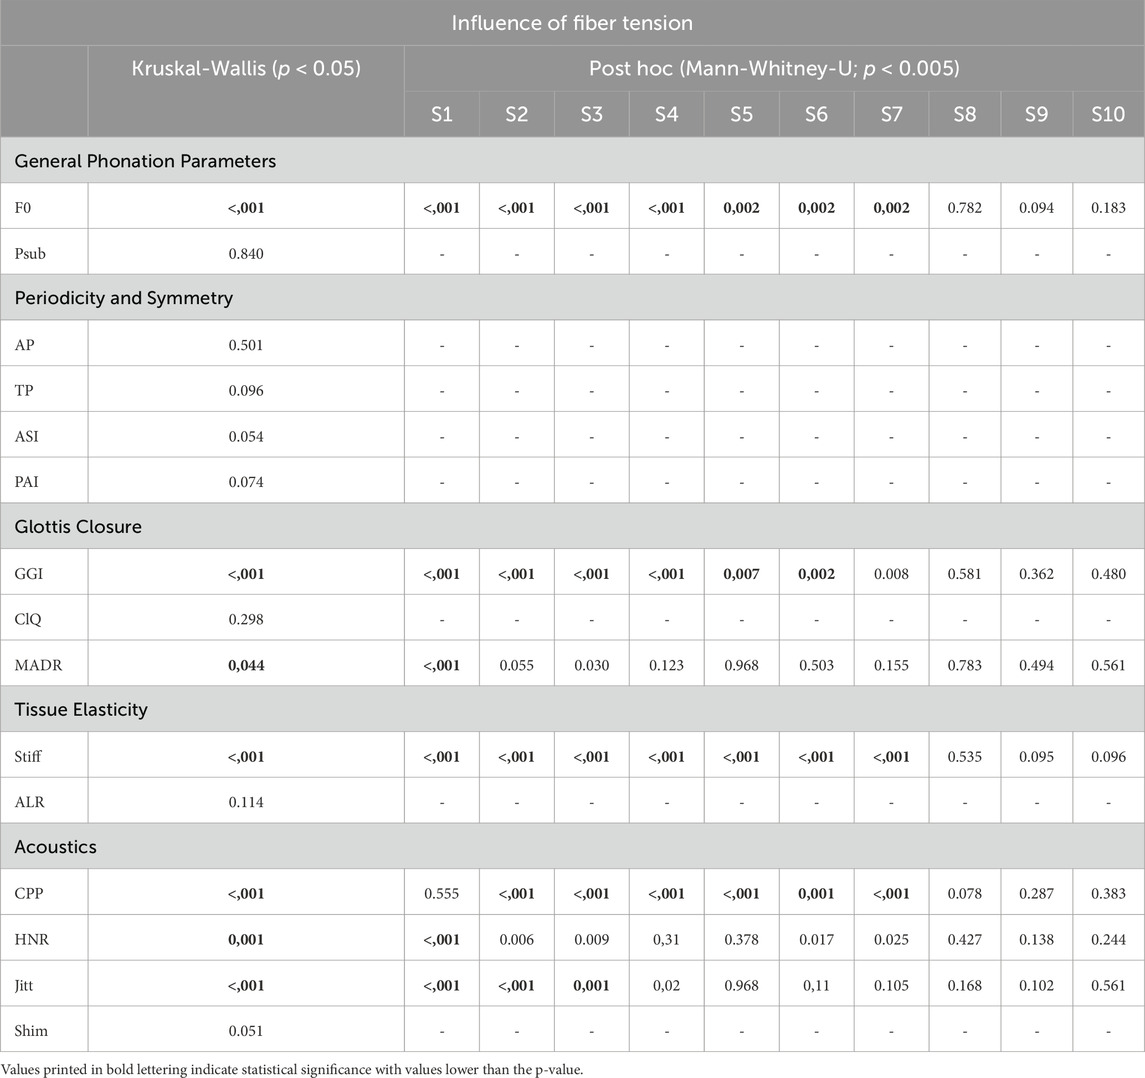
Table 5. Overview of the Kruskal-Wallis test and post hoc for the influence of fiber tension on all parameters.
Psub seemed to increase until a stretching length of 5 mm was reached, followed by an overall decrease, as depicted in Figure 7B. However, the statistical analysis revealed that Psub displayed no significant differences between the different fiber tensions, as listed in Table 5.
3.3.2 Periodicity and symmetry
Both periodicity-related parameters, AP and TP, exhibit extremely high values, indicating the high periodicity of vocal fold oscillations, as displayed in Figures 8A, B. The apparent decreasing trend with increasing fiber stretching length was not statistically significant owing to the nonsignificant occurrences, as listed in Table 5. Interestingly, the range of values for the AP explicitly increased for the two largest stretching levels: 15 and 20 mm.
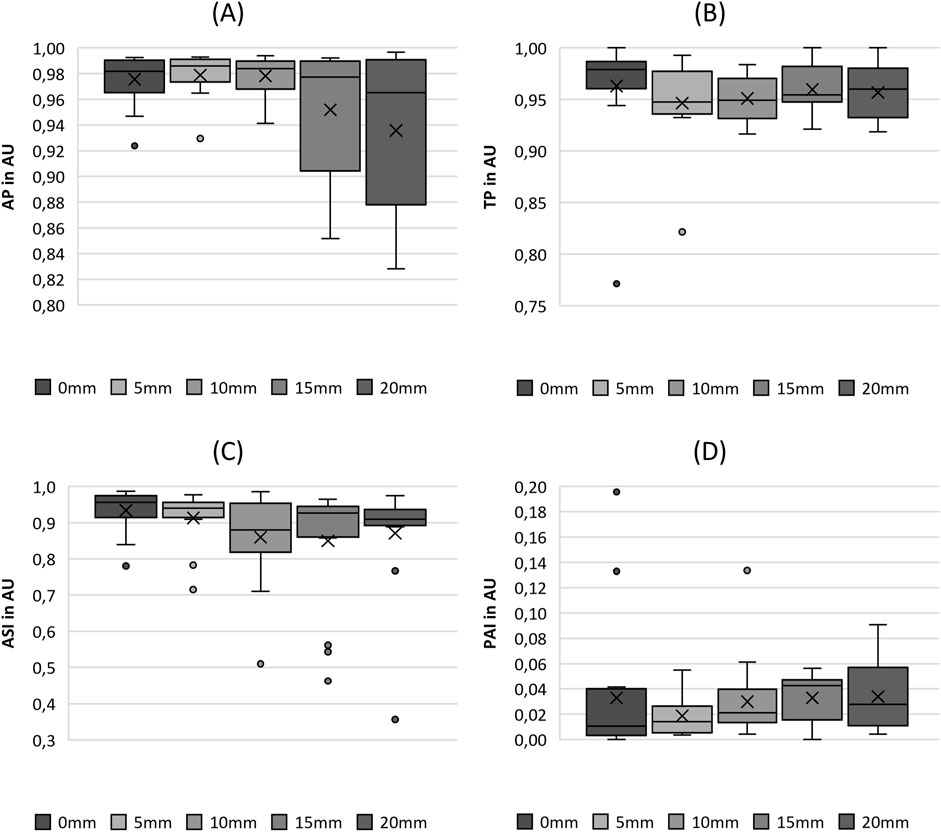
Figure 8. Boxplot representation of the (A) amplitude periodicity (AP), (B) time periodicity (TP), (C) amplitude symmetry index (ASI) and (D) phase asymmetry index (PAI) as function of fiber tension. The horizontal line within the box corresponds to the median, the cross to the mean value. Outliers are indicated by circles.
Similar to the Periodicity parameters, the ASI and PAI parameters demonstrate extremely high and low values, respectively, as depicted in Figures 8C, D. They indicated highly symmetric motion of the two vocal folds. Accordingly, the statistical tests demonstrated no significant differences between the stretching levels and symmetry, as listed in Table 5.
3.3.3 Closure
The GGI shows a range between 0.00 and 0.78 with the highest value (0.78) at SL 0 mm and the lowest value (0.00) at SL 10 mm. It decreased with increasing fiber stretching until a value of 10 mm was reached. For larger stretching, the GGI remained fairly constant, as depicted in Figure 9A, with no statistical differences between the fiber stretching levels, as illustrated by the pairwise test in Table 5.
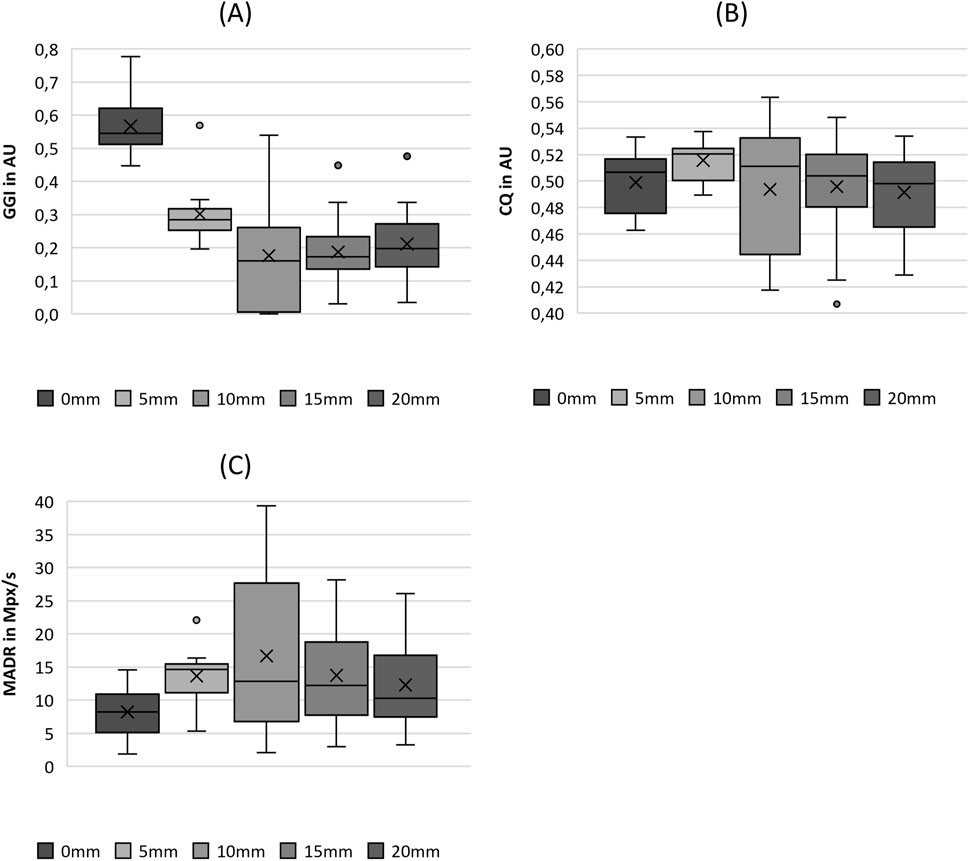
Figure 9. Boxplot representation of the (A) glottis gap index (GGI), (B) closing quotient (CIQ) and (C) maximum area of declination (MADR) as function of fiber tension. The horizontal line within the box corresponds to the median, the cross to the mean value. Outliers are indicated by circles.
The Closing Quotient showed no systematic trend, as indicated by the insignificant Kruskal-Wallis test in Table 5.
Although MADR showed statistically significant differences in the fiber stretching length, the distribution in Figure 9C was similar to that of ClQ in Figure 9B, with an initial increase in the median values followed by a decrease.
3.3.4 Tissue elasticity
The increase in fiber tension, as indicated by the stretching length, increased the stiffness up to an SL of 15 mm, as illustrated in Figure 10A. For larger stretching levels, the stiffness did not change significantly, as revealed by the pairwise tests in Table 5. The ALR displayed in Figure 10B illustrates a similar non-significant variation, with an initial increase in the median up to an SL of 10 mm, followed by a decrease for further fiber elongation, as reported previously for parameters such as MADR, ClQ, and Psub.
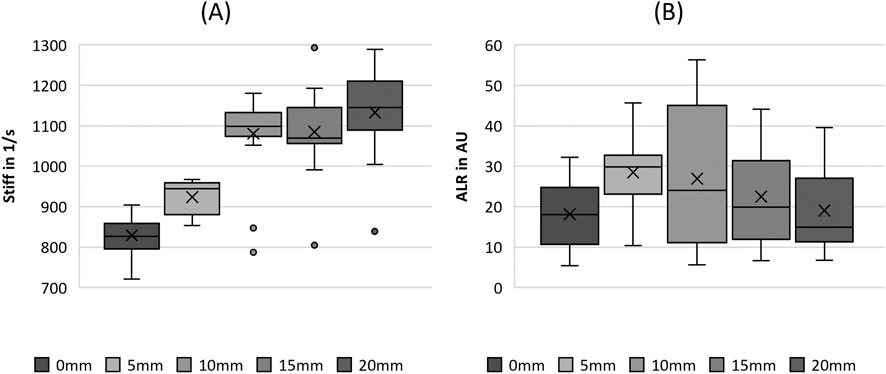
Figure 10. Boxplot representation of the (A) stiffness (stiff) and (B) amplitude-to-length-ratio (ALR) as function of fiber tension. The horizontal line within the box corresponds to the median, the cross to the mean value. Outliers are indicated by circles.
3.3.5 Acoustics
CPP exhibited a trend of increasing with increasing fiber stretching length up to an SL of 10 mm and followed by a decrease in values with further stretching, as depicted in Figure 11A. Therefore, the increase showed statistically significant differences, as shown in the pairwise post hoc tests in Table 5. Only the change in the values from 0 mm to 5 mm was not significant. A further decrease in CPP was not analogous to the parameters Stiff, GGI, and F0.
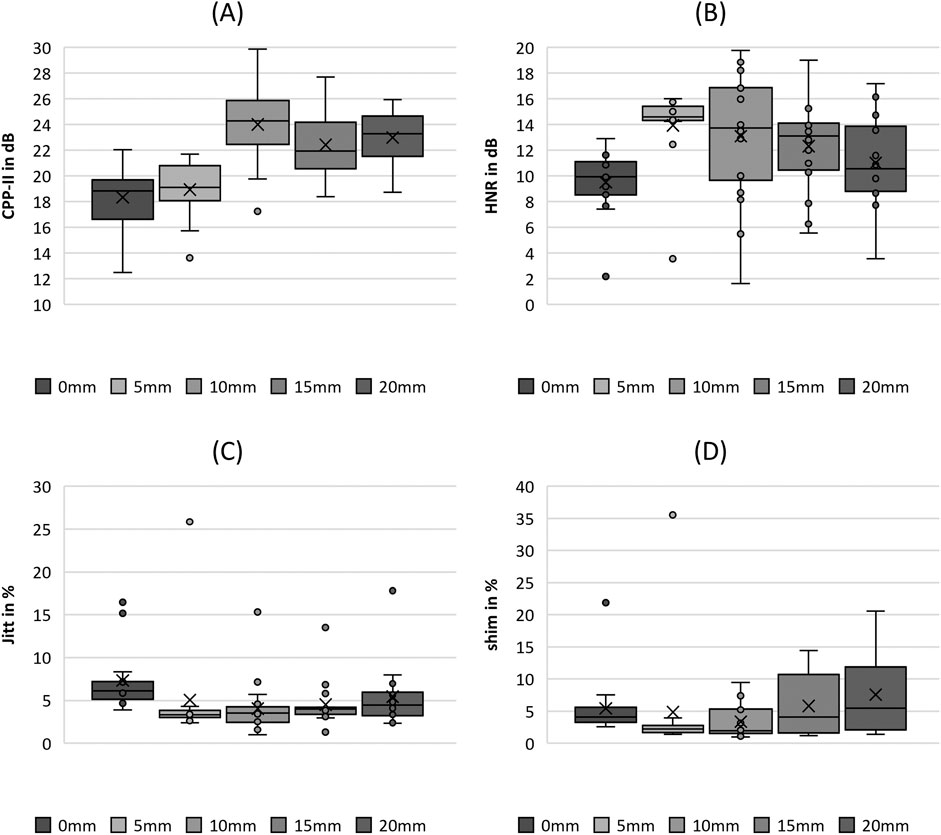
Figure 11. Boxplot representation of the (A) cepstral peak prominence (CPP), (B) harmonics-to-noise-ratio (HNR), (C) jitter (jitt) and (D) shimmer (shim) as function of fiber tension. The horizontal line within the box corresponds to the median, the cross to the mean value. Outliers are indicated by circles.
The HNR also showed a tendency to increase with increasing fiber stretching until it reached a value of 10 mm, as depicted in Figure 11B. This increase is indicated as well by statistical significance, as listed in Table 5. A further decrease in the HNR was not significant.
The values for jitter decrease in Figure 11C as the fiber stretching length increases up to an SL of 10 mm, which is statistically significant. In contrast, Shimmer did not show statistical significance with increasing fiber stretching levels. However, as illustrated in Figure 10D, the range increases for stretching levels up to 20 mm.
4 Discussion
4.1 Impact of flow rate on phonation parameters
Considering the flow rate, it was found that its influence could be clearly observed in all six parameter groups, as listed in Table 4. However, there were groups in which the influence of the flow rate was greater than that in other groups.
The flow rate has a significant influence on the Psub. According to physiological conditions, as well as to previous measurements on synthetic larynx models and excised larynges described in previous studies, the Psub is linearly related to the airflow (Semmler et al., 2021; Alipour et al., 1997; Döllinger et al., 2012; Birk et al., 2017b). This linearity can be found in the data and agrees with the findings of the statistical analysis performed, proving the flow-rate controlled model to be oscillating in a physiological manner. Although the values of Psub are higher than the physiological values in the range of approximately 350–3,510 Pa (Falk et al., 2021; Holmberg et al., 1988; Sundberg et al., 1993; Sundberg et al., 2005; Baken, 1987), the trend is still similar to an Psub increase with an increasing flow rate (Alipour et al., 1997; Sundberg et al., 1993; Zhang, 2015). Thus, the larger the flow rate, the higher is Psub (Chhetri and Park, 2016; Guzman et al., 2019). In contrast, the fundamental frequency demonstrated no trend that would be systematically related to the flow rate, as statistical tests revealed (Semmler et al., 2021; Tong and Sataloff, 2022; Asnaashari et al., 2012). The trend demonstrated a short increase in the F0 median and range, followed by a decrease.
Regarding the oscillation characteristics of the vocal folds, a significant influence of the flow rate only on the AP can be observed. However, this was the result of an increase in the range of AP, with a decrease in the median only for the second flow rate group FG2. This mechanism can also be observed in the Shimmer for the acoustic signal, which shows a strong relationship between the oscillation pattern of the vocal folds and the resulting sound production (Farrús et al., 2007). It can be suspected that FG2 has a certain flow rate range that leads to instability in the oscillations of the amplitude sequences.
For the other flow rate groups, there were fairly constant high values for AP, indicating oscillation characteristics similar to those of regularly oscillating human vocal folds (Jakubaß et al., 2023; Peters et al., 2022). The same trend was observed for TP.
Vocal fold oscillations demonstrated a high level of symmetry, as both the ASI and PAI lie in the physiological range of regular human vocal fold oscillations (Schlegel et al., 2020; Bonilha et al., 2012; Schützenberger et al., 2016). Based on the statistically significant relationship between symmetry parameters and flow rate, the model reproduces the stabilizing effect of increasing the flow rate to maintain symmetrical oscillations of the vocal folds (Semmler et al., 2021).
The oscillation of the vocal folds showed a pattern with and without glottic closure, as shown by the GGI. Therefore, glottis closure was only achieved for higher flow rates that produced larger oscillation amplitudes (Semmler et al., 2021). ClQ has a physiological value (Semmler et al., 2023; Verdolini et al., 1998; Patel et al., 2014a). However, a strong relationship between flow rate and glottic closure could not be found in the model. This agrees with recent studies, where Taylor et al. have shown through a synthetic vocal fold model, that glottis closure is in fact mainly controlled by the vocal fold geometry, such as thickness, rather than flow rate or fiber tension (Taylor and Thomson, 2022).
In contrast, the MADR increased with increasing flow rate, which has also been reported previously (Laukkanen et al., 2008; Titze and Palaparthi, 2016). As the MADR has been reported to correlate with the strength of discrete acoustic tones produced by the oscillations of the vocal folds (Titze, 2006; Kniesburges et al., 2020), the harmonic-to-noise ratio (HNR) of the acoustic signal also increases with the flow rate. Simultaneously, the CPP demonstrated a slight decrease with increasing flow rate, which seems to contradict this observation. However, this trend must be considered with caution, as only a few pairwise post hoc tests demonstrated statistically significant differences in the CPP for different flow rates. In addition, both HNR and CPP showed reasonable values compared with those reported in the literature (Verdolini et al., 1998; Patel et al., 2014b; Taylor and Thomson, 2022; Laukkanen et al., 2008). The same holds for Jitter and Shimmer, computed based on sound signal (Bielamowicz et al., 1996; Teixeira et al., 2013).
Finally, regarding the group of tissue elasticity parameters, the flow rate was found to have a significant influence on the ALR, which represents a characteristic increase in oscillation amplitude for an increasing flow rate (Patel et al., 2022).
In summary, while the flow rate influenced all evaluated oscillation characteristics (represented by the parameter groups), it appeared to have a stronger association with parameters that represent the amplitude of the vocal fold oscillation, such as AP, ASI, MADR, and ALR. The time-based or stiffness-related parameters F0, TP, PAI, and Stiff were only weak or even not at all, depending on the flow rate.
4.2 Impact of fiber tension on phonation parameters
Compared with the flow rate, the influence of fiber tension, represented by fiber stretching, on the parameter is more specific to certain parameter groups. One group (periodicity and symmetry) with no statistically significant differences was identified. However, the influence is stronger and more distinct in those parameters that demonstrate statistical significance, such as F0, Stiff, GGI, and CPP.
The most obvious impact was detected for stiffness, which is an alternative measure of elastic properties based on the glottal area waveform (Patel et al., 2022). Commonly, it is interpreted that higher values in stiffness resulting in a faster opening or closing of the glottis due to higher stiffness in the tissue, as the vocal folds oscillate with a higher frequency under applied pretension (Kist et al., 2021; Pelka et al., 2023; Titze and Martin, 1998; Roy, 2003). The two parameters regarding tissue elasticity indicate a statistically significant increase in the stiffness of the vocal folds with increasing fiber tension, reflecting physiological behavior (Zhang, 2015), where a higher stiffness is related to higher fundamental frequencies (Zhang, 2016). However, the pairwise tests revealed that the stretching levels from 10 to 20 mm were not significantly different, which appears to be a saturation effect due to excessive damping of fiber tension levels and suppression of vocal fold oscillations.
The model demonstrated fundamental frequencies in the range between 208.4 Hz and 380 Hz which reflects physiological conditions well. The physiological range of the fundamental frequency in men is approximately 100–220 Hz (Sundberg et al., 2005), whereas women have a slightly higher normal range of approximately 190–260 Hz (Cristina Oliveira et al., 2021; Jones and Garrett, 2016). In the model, the fundamental frequency had a maximum value of 380 Hz, which captured the frequency range of the vocally trained singers quite well. In professional female singers, the fundamental frequency can reach 1,500 Hz (Graham et al., 2016; Echternach et al., 2011). Furthermore, F0 increases with increasing fiber tension, which is also a characteristic of human phonation because the fundamental frequency is highly influenced by vocal fold tension during phonation (Tong and Sataloff, 2022; Jiang et al., 2000; Colton, 1988; Luizard et al., 2023). Based on the individual’s anatomical characteristics, this interaction results in characteristic voice pitches from person to person (Cavalcanti et al., 2021).
The periodicity and symmetry parameters (AP, TP, ASI, and PAI) were not significantly affected by an increase in symmetrically applied fiber tension. However, asymmetrical tension conditions may significantly influence periodicity and symmetry, as described by Xue et al. (2010) They found asymmetrical and non-periodic vocal fold oscillations in pathologies such as unilateral vocal fold paralysis, which highly affected the elastic characteristics of the vocal fold tissue.
The parameters describing the closing behavior of the vocal folds (GGI, ClQ, and MADR) demonstrated reasonable values. In most cases, the glottis does not fully close during the oscillation, starting with a high median GGI of 0.545 for the fiber stretching length of 0 mm, and decreasing to more physiological values for higher stretching length, which are statistically significant until the stretching length of 10 mm is reached. In previous in vivo and ex vivo studies the GGI has been reported to physiologically approach values close to 0 as this represents complete glottis closure (Semmler et al., 2021; Jakubaß et al., 2023; Peters et al., 2022; Semmler et al., 2023; Kniesburges et al., 2020; Graham et al., 2016; Zhang, 2019; Schlegel et al., 2019; Patel et al., 2012; Södersten et al., 1995). Many synthetic larynx models have faced limitations regarding glottis closure (Kniesburges et al., 2020; Zhang et al., 2006; Zhang et al., 2009). The model shows, that with higher elongation of the fibers, the glottis closure increases. Incomplete glottis closure, however, also takes place in physiological human phonation as it has been shown in females and children (Patel et al., 2012; Schneider and Bigenzahn, 2003; Cielo et al., 2019). The ClQ was not statistically significant; however, its values were reasonable compared to those found in previous studies (Semmler et al., 2023; Verdolini et al., 1998).
Although the overall variation of the MADR was statistically significant in the Kruskal-Wallis test with regard to the increase in fiber tension, the pairwise tests revealed only a significant increase in the MADR from 0 mm to 5 mm stretching length increase. With a further increase in tension, the range and median values decreased within the range of values found in the literature (Semmler et al., 2021).
Considering the acoustic parameters, an increase in fiber tension seems to increase the tonal content in the generated sound, as indicated by an increase in CPP and HNR, which is statistically significant for both parameters obtained from the Kruskal-Wallis test. Furthermore, the jitter also decreased with increasing tension, indicating an increase in the periodicity of the sound signal. The values of the acoustic parameters are comparable to those found in human phonation (Falk et al., 2021; Ferrand, 2002; Gaur et al., 2023; Heller Murray et al., 2022; Fraile and Godino-Llorente, 2014; Sørensen et al., 2016). Based on these results, it is clear that pathological or age-related changes in tissue elasticity play a major role in negatively affecting voice quality (Forero et al., 2016).
As mentioned earlier, the effect of saturation on high-tension levels was detected for various parameters: F0, GGI, MADR, Stiff, CPP, HNR, and Jitter. This effect appeared in the boxplots as constant or slightly decreasing ranges and median values for stretching levels of 10–20 mm. Furthermore, pairwise tests showed no significant differences between the value groups for the relevant tension levels, as listed in Table 5. The reason for this saturation is the potentially excessively high applied stretching levels in this range (10 mm–20 mm) which certainly exceed the physiological range of tension in collagen and elastin fibers.
4.3 Summary and conclusion
The model introduced by Tur et al. (2023) produces physiological oscillation patterns of the vocal folds and sound characteristics similar to those of human phonation. This study evaluated the model using parameters that commonly represent periodicity and symmetry, glottis closure, tissue elasticity, and acoustics commonly used in human phonation research. Therefore, the flow rate and tension in the fibers embedded in the synthetic vocal folds varied, which constituted the two laryngeal tuning factors controlling the fundamental frequency, loudness, and quality of the voice.
The data demonstrate the highly complex interaction between flow rate and longitudinal tension in the vocal folds and the large range of sound characteristics that can be adjusted by these two factors. The flow rate shows a large impact on nearly all phonatory characteristics, such as periodicity and symmetry, glottis closure, tissue elasticity, and acoustics. In contrast, the longitudinal tension within the vocal folds represented in the fiber tension model specifically influenced the fundamental frequency, glottis closing behavior, and production of tonal sound components in the sound signal. In particular, the acoustic parameters commonly used to analyze the sound quality produced during phonation increased, indicating a higher strength of tonal sound.
For pathological conditions, the flow rate is assumed to have larger potentials to compensate disorders in the neurological control and biomechanical conditions in the larynx as the flow rate is controlled by conditions in the lungs, the trachea and the muscles contraction of the thorax. However, this compensation strategy is limited as the air volume available for phonation is limited due to the individual lungs volume. Influencing laryngeal control mechanisms as pretension/stiffness in the larynx or vocal folds’ posturing for compensating pathological mechanisms in the larynx directly is, however, not simply to establish and requires surgical, conservative and logopedic therapy.
Data availability statement
The datasets presented in this article are not publicly available due to ongoing research. Requests to access the datasets should be directed to the corresponding author.
Author contributions
LG: Conceptualization, Data curation, Formal Analysis, Investigation, Methodology, Software, Validation, Visualization, Writing–original draft. BT: Conceptualization, Data curation, Investigation, Methodology, Resources, Validation, Writing–review and editing. MS: Software, Writing–review and editing. AS: Validation, Writing–review and editing. SK: Conceptualization, Funding acquisition, Investigation, Methodology, Project administration, Supervision, Writing–review and editing.
Funding
The author(s) declare that no financial support was received for the research, authorship, and/or publication of this article.
Acknowledgments
The present work was performed in (partial) fulfillment of the requirements for obtaining the degree “Med. Dent.”.
Conflict of interest
The authors declare that the research was conducted in the absence of any commercial or financial relationships that could be construed as a potential conflict of interest.
Publisher’s note
All claims expressed in this article are solely those of the authors and do not necessarily represent those of their affiliated organizations, or those of the publisher, the editors and the reviewers. Any product that may be evaluated in this article, or claim that may be made by its manufacturer, is not guaranteed or endorsed by the publisher.
References
Alipour F., Scherer R. C., Finnegan E. (1997). Pressure-flow relationships during phonation as a function of adduction. J. Voice Off. J. Voice Found. 11 (2), 187–194. doi:10.1016/s0892-1997(97)80077-x
Asnaashari A. M. H., Rezaei S., Babaeian M., Taiarani M., Shakeri M. T., Fatemi S. S., et al. (2012). The effect of asthma on phonation: a controlled study of 34 patients. Ear Nose Throat J. 91 (4), 168–171. doi:10.1177/014556131209100409
Barney A., Shadle C. H., Davies POAL (1999). Fluid flow in a dynamic mechanical model of the vocal folds and tract. I. Measurements and theory. J. Acoust. Soc. Am. 105 (1), 444–455. doi:10.1121/1.424504
Bashshur M. R., Oc B. (2015). When voice matters: a multilevel review of the impact of voice in organizations. J. Manag. 41 (5), 1530–1554. doi:10.1177/0149206314558302
Bielamowicz S., Kreiman J., Gerratt B. R., Dauer M. S., Berke G. S. (1996). Comparison of voice analysis systems for perturbation measurement. J. Speech Hear Res. 39 (1), 126–134. doi:10.1044/jshr.3901.126
Birk V., Döllinger M., Sutor A., Berry D. A., Gedeon D., Traxdorf M., et al. (2017a). Automated setup for ex vivo larynx experiments. J. Acoust. Soc. Am. 141 (3), 1349. doi:10.1121/1.4976085
Birk V., Kniesburges S., Semmler M., Berry D. A., Bohr C., Döllinger M., et al. (2017b). Influence of glottal closure on the phonatory process in ex vivo porcine larynges. J. Acoust. Soc. Am. 142 (4), 2197–2207. doi:10.1121/1.5007952
Bonilha H. S., Deliyski D. D., Whiteside J. P., Gerlach T. T. (2012). Vocal fold phase asymmetries in patients with voice disorders: a study across visualization techniques. Am. J. Speech Lang. Pathol. 21 (1), 3–15. doi:10.1044/1058-0360(2011/09-0086)
Cavalcanti J. C., Eriksson A., Barbosa P. A. (2021). Multiparametric analysis of speaking fundamental frequency in genetically related speakers using different speech materials: some forensic implications. J. Voice Off. J. Voice Found. S0892-1997 (21), 00292. doi:10.1016/j.jvoice.2021.08.013
Chhetri D. K., Park S. J. (2016). Interactions of subglottal pressure and neuromuscular activation on fundamental frequency and intensity. Laryngoscope 126 (5), 1123–1130. doi:10.1002/lary.25550
Choi J., Son Y. I., So Y. K., Byun H., Lee E. K., Yun Y. S. (2012). Posterior glottic gap and age as factors predicting voice outcome of injection laryngoplasty in patients with unilateral vocal fold paralysis. J. Laryngol. Otol. 126 (3), 260–266. doi:10.1017/S0022215111002702
Cielo C. A., Schwarz K., Finger L. S., Lima J. M., Christmann M. K. (2019). Glottal closure in women with No voice complaints or laryngeal disorders. Int. Arch. Otorhinolaryngol. 23 (04), e384–e388. doi:10.1055/s-0038-1676108
Cisonni J., Van Hirtum A., Pelorson X., Willems J. (2008). Theoretical simulation and experimental validation of inverse quasi-one-dimensional steady and unsteady glottal flow models. J. Acoust. Soc. Am. 124 (1), 535–545. doi:10.1121/1.2931959
Colton R. H. (1988). Physiological mechanisms of vocal frequency control: the role of tension. J. Voice. 2 (3), 208–220. doi:10.1016/s0892-1997(88)80079-1
Cristina Oliveira R., Gama A. C. C., Magalhães M. D. C. (2021). Fundamental voice frequency: acoustic, electroglottographic, and accelerometer measurement in individuals with and without vocal alteration. J. Voice Off. J. Voice Found. 35 (2), 174–180. doi:10.1016/j.jvoice.2019.08.004
Deverge M., Pelorson X., Vilain C., Lagrée P. Y., Chentouf F., Willems J., et al. (2003). Influence of collision on the flow through in-vitro rigid models of the vocal folds. J. Acoust. Soc. Am. 114 (6), 3354–3362. doi:10.1121/1.1625933
Döllinger M., Berry D. A., Luegmair G., Hüttner B., Bohr C. (2012). Effects of the epilarynx area on vocal fold dynamics and the primary voice signal. J. Voice Off. J. Voice Found. 26 (3), 285–292. doi:10.1016/j.jvoice.2011.04.009
Echternach M., Sundberg J., Baumann T., Markl M., Richter B. (2011). Vocal tract area functions and formant frequencies in opera tenors’ modal and falsetto registers. J. Acoust. Soc. Am. 129 (6), 3955–3963. doi:10.1121/1.3589249
Fagherazzi G., Fischer A., Ismael M., Despotovic V. (2021). Voice for health: the use of vocal biomarkers from research to clinical practice. Digit. Biomark. 5 (1), 78–88. doi:10.1159/000515346
Falk S., Kniesburges S., Schoder S., Jakubaß B., Maurerlehner P., Echternach M., et al. (2021). 3D-FV-FE aeroacoustic larynx model for investigation of functional based voice disorders. Front. Physiol. 12, 616985. doi:10.3389/fphys.2021.616985
Farrús M., Hernando J., Ejarque P. (2007). “Jitter and shimmer measurements for speaker recognition,” in Interspeech 2007 (USA: ISCA), 778–781. Available at: https://www.isca-speech.org/archive/interspeech_2007/farrus07_interspeech.html.
Ferrand C. T. (2002). Harmonics-to-noise ratio: an index of vocal aging. J. Voice 16 (4), 480–487. doi:10.1016/s0892-1997(02)00123-6
Forero M. L. A., Kohler M., Vellasco MMBR, Cataldo E. (2016). Analysis and classification of voice pathologies using glottal signal parameters. J. Voice Off. J. Voice Found. 30 (5), 549–556.
Fraile R., Godino-Llorente J. I. (2014). Cepstral peak prominence: a comprehensive analysis. Biomed. Signal Process Control 14, 42–54. doi:10.1016/j.bspc.2014.07.001
Gaur S., Kalani P., Mohan M. (2023). Harmonic-to-noise ratio as speech biomarker for fatigue: K-nearest neighbour machine learning algorithm. Med. J. Armed Forces India, S0377123722002088. doi:10.1016/j.mjafi.2022.12.001
Graham E., Angadi V., Sloggy J., Stemple J. (2016). Contribution of glottic insufficiency to perceived breathiness in classically trained singers. Med. Probl. Perform. Art. 31 (3), 179–184. doi:10.21091/mppa.2016.3032
Guzman M., Acevedo K., Leiva F., Ortiz V., Hormazabal N., Quezada C. (2019). Aerodynamic characteristics of growl voice and reinforced falsetto in metal singing. J. Voice 33 (5), 803.e7–803. doi:10.1016/j.jvoice.2018.04.022
Heller Murray E. S., Chao A., Colletti L. (2022). A practical guide to calculating cepstral peak prominence in praat. J Voice, S0892199722002752. doi:10.1016/j.jvoice.2022.09.002
Hillenbrand J., Cleveland R. A., Erickson R. L. (1994). Acoustic correlates of breathy vocal quality. J. Speech Lang. Hear Res. 37 (4), 769–778. doi:10.1044/jshr.3704.769
Holmberg E. B., Hillman R. E., Perkell J. S. (1988). Glottal airflow and transglottal air pressure measurements for male and female speakers in soft, normal, and loud voice. J. Acoust. Soc. Am. 84 (2), 511–529. doi:10.1121/1.396829
Iwarsson J., Thomasson M., Sundberg J. (1998). Effects of lung volume on the glottal voice source. J. Voice 12 (4), 424–433. doi:10.1016/s0892-1997(98)80051-9
Jakubaß B., Peters G., Kniesburges S., Semmler M., Kirsch A., Gerstenberger C., et al. (2023). Effect of functional electric stimulation on phonation in an ex vivo aged ovine model. J. Acoust. Soc. Am. 153 (5), 2803. doi:10.1121/10.0017923
Jiang J., Lin E., Hanson D. G. (2000). VOCAL FOLD PHYSIOLOGY. Otolaryngol. Clin. North Am. 33 (4), 699–718. doi:10.1016/s0030-6665(05)70238-3
Karnell M. P., Hall K. D., Landahl K. L. (1995). Comparison of fundamental frequency and perturbation measurements among three analysis systems. J. Voice Off. J. Voice Found. 9 (4), 383–393. doi:10.1016/s0892-1997(05)80200-0
Kist A. M., Gómez P., Dubrovskiy D., Schlegel P., Kunduk M., Echternach M., et al. (2021). A deep learning enhanced novel software tool for laryngeal dynamics analysis. J. Speech Lang. Hear Res. JSLHR 64 (6), 1889–1903. doi:10.1044/2021_JSLHR-20-00498
Kniesburges S., Lodermeyer A., Semmler M., Schulz Y. K., Schützenberger A., Becker S. (2020). Analysis of the tonal sound generation during phonation with and without glottis closure. J. Acoust. Soc. Am. 147 (5), 3285. doi:10.1121/10.0001184
Kraus M. W. (2017). Voice-only communication enhances empathic accuracy. Am. Psychol. 72 (7), 644–654. doi:10.1037/amp0000147
Laukkanen A. M., Titze I. R., Hoffman H., Finnegan E. (2008). Effects of a semioccluded vocal tract on laryngeal muscle activity and glottal adduction in a single female subject. Folia Phoniatr. Logop. Off. Organ Int. Assoc. Logop. Phoniatr. IALP. 60 (6), 298–311. doi:10.1159/000170080
Luizard P., Bailly L., Yousefi-Mashouf H., Girault R., Orgéas L., Henrich Bernardoni N. (2023). Flow-induced oscillations of vocal-fold replicas with tuned extensibility and material properties. Sci. Rep. 13 (1), 22658. doi:10.1038/s41598-023-48080-x
Martins R. H. G., Benito Pessin A. B., Nassib D. J., Branco A., Rodrigues S. A., Matheus S. M. M. (2015). Aging voice and the laryngeal muscle atrophy. Laryngoscope 125 (11), 2518–2521. doi:10.1002/lary.25398
Maryn Y., Verguts M., Demarsin H., Van Dinther J., Gomez P., Schlegel P., et al. (2020). Intersegmenter variability in high-speed laryngoscopy-based glottal area waveform measures. Laryngoscope 130 (11), E654-E661. doi:10.1002/lary.28475
Mehta D. D., Zañartu M., Quatieri T. F., Deliyski D. D., Hillman R. E. (2011). Investigating acoustic correlates of human vocal fold vibratory phase asymmetry through modeling and laryngeal high-speed videoendoscopy. J. Acoust. Soc. Am. 130 (6), 3999–4009. doi:10.1121/1.3658441
Mohri M., Kinishi M., Amatsu M. (1998). Dynamics of subneoglottic lumen in tracheoesophageal phonation. Ann. Otol. Rhinol. Laryngol. 107 (11), 974–976. doi:10.1177/000348949810701113
Morrison M. D., Rammage L. A., Belisle G. M., Pullan C. B., Nichol H. (1983). Muscular tension dysphonia. J. Otolaryngol. 12 (5), 302–306.
Munhall K. G., Ostry D. J., Parush A. (1985). Characteristics of velocity profiles of speech movements. J. Exp. Psychol. Hum. Percept. Perform. 11 (4), 457–474. doi:10.1037//0096-1523.11.4.457
Murray P. R., Thomson S. L. (2012). Vibratory responses of synthetic, self-oscillating vocal fold models. J. Acoust. Soc. Am. 132 (5), 3428–3438. doi:10.1121/1.4754551
Nguyen D. D., Kenny D. T., Tran N. D., Livesey J. R. (2009). Muscle tension dysphonia in Vietnamese female teachers. J. Voice 23 (2), 195–208. doi:10.1016/j.jvoice.2007.09.003
Patel R., Dubrovskiy D., Döllinger M. (2014a). Characterizing vibratory kinematics in children and adults with high-speed digital imaging. J. Speech Lang. Hear Res. JSLHR 57 (2), S674–S686. doi:10.1044/2014_JSLHR-S-12-0278
Patel R. R., Dixon A., Richmond A., Donohue K. D. (2012). Pediatric high speed digital imaging of vocal fold vibration: a normative pilot study of glottal closure and phase closure characteristics. Int. J. Pediatr. Otorhinolaryngol. 76 (7), 954–959. doi:10.1016/j.ijporl.2012.03.004
Patel R. R., Dubrovskiy D., Döllinger M. (2014b). Measurement of glottal cycle characteristics between children and adults: physiological variations. J. Voice 28 (4), 476–486. doi:10.1016/j.jvoice.2013.12.010
Patel R. R., Sundberg J., Gill B., Lã F. M. B. (2022). Glottal airflow and glottal area waveform characteristics of flow phonation in untrained vocally healthy adults. J. Voice Off. J. Voice Found. 36 (1), 140.e1–140.e21. doi:10.1016/j.jvoice.2020.07.037
Pelka F., Ensthaler M., Wendler O., Kniesburges S., Schützenberger A., Semmler M. (2023). Mechanical parameters based on high-speed videoendoscopy of the vocal folds in patients with ectodermal dysplasia. J. Voice Off. J. Voice Found. S0892-1997 (23). 00084-X. doi:10.1016/j.jvoice.2023.02.027
Peters G., Jakubaß B., Weidenfeller K., Kniesburges S., Böhringer D., Wendler O., et al. (2022). Synthetic mucus for an ex vivo phonation setup: creation, application, and effect on excised porcine larynges. J. Acoust. Soc. Am. 152 (6), 3245. doi:10.1121/10.0015364
Qiu Q., Schutte H. K., Gu L., Yu Q. (2003). An automatic method to quantify the vibration properties of human vocal folds via videokymography. Folia Phoniatr. Logop. Off. Organ Int. Assoc. Logop. Phoniatr. IALP. 55 (3), 128–136. doi:10.1159/000070724
Roy N. (2003). Functional dysphonia. Curr. Opin. Otolaryngol. Head. Neck Surg. 11 (3), 144–148. doi:10.1097/00020840-200306000-00002
Rubin J. S., Epstein R. (2019). “The healthy voice, lifestyle, and voice protection (including exercise, body work, and diet),” in The oxford handbook of singing. Editors G. F. Welch, D. M. Howard, and J. Nix (Oxford: Oxford University Press), 52–66. Available at: https://academic.oup.com/edited-volume/35194/chapter/299586241.
Scheinherr A., Bailly L., Boiron O., Lagier A., Legou T., Pichelin M., et al. (2015). Realistic glottal motion and airflow rate during human breathing. Med. Eng. Phys. 37 (9), 829–839. doi:10.1016/j.medengphy.2015.05.014
Scherer R. C., Shinwari D., De Witt K. J., Zhang C., Kucinschi B. R., Afjeh A. A. (2001). Intraglottal pressure profiles for a symmetric and oblique glottis with a divergence angle of 10 degrees. J. Acoust. Soc. Am. 109 (4), 1616–1630. doi:10.1121/1.1333420
Schlegel P., Kniesburges S., Dürr S., Schützenberger A., Döllinger M. (2020). Machine learning based identification of relevant parameters for functional voice disorders derived from endoscopic high-speed recordings. Sci. Rep. 10 (1), 10517. doi:10.1038/s41598-020-66405-y
Schlegel P., Kunduk M., Stingl M., Semmler M., Döllinger M., Bohr C., et al. (2019). Influence of spatial camera resolution in high-speed videoendoscopy on laryngeal parameters. PloS One 14 (4), e0215168. doi:10.1371/journal.pone.0215168
Schlegel P., Semmler M., Kunduk M., Döllinger M., Bohr C., Schützenberger A. (2018). Influence of analyzed sequence length on parameters in laryngeal high-speed videoendoscopy. Appl. Sci. 8 (12), 2666. doi:10.3390/app8122666
Schneider B., Bigenzahn W. (2003). Influence of glottal closure configuration on vocal efficacy in young normal-speaking women. J. Voice 17 (4), 468–480. doi:10.1067/s0892-1997(03)00065-1
Schützenberger A., Kunduk M., Döllinger M., Alexiou C., Dubrovskiy D., Semmler M., et al. (2016). Laryngeal high-speed videoendoscopy: sensitivity of objective parameters towards recording frame rate. Biomed. Res. Int. 2016, 4575437. doi:10.1155/2016/4575437
Semmler M., Berry D. A., Schützenberger A., Döllinger M. (2021). Fluid-structure-acoustic interactions in an ex vivo porcine phonation model. J. Acoust. Soc. Am. 149 (3), 1657. doi:10.1121/10.0003602
Semmler M., Kniesburges S., Pelka F., Ensthaler M., Wendler O., Schützenberger A. (2023). Influence of reduced saliva production on phonation in patients with ectodermal dysplasia. J. Voice Off. J. Voice Found. 37 (6), 913–923. doi:10.1016/j.jvoice.2021.06.016
Shaw S. M., Thomson S. L., Dromey C., Smith S. (2012). Frequency response of synthetic vocal fold models with linear and nonlinear material properties. J. Speech Lang. Hear Res. 55 (5), 1395–1406. doi:10.1044/1092-4388(2012/11-0153)
Södersten M., Hertegård S., Hammarberg B. (1995). Glottal closure, transglottal airflow, and voice quality in healthy middle-aged women. J. Voice 9 (2), 182–197. doi:10.1016/s0892-1997(05)80252-8
Sørensen M. K., Durck T. T., Bork K. H., Rasmussen N. (2016). Normative values and interrelationship of MDVP voice analysis parameters before and after endotracheal intubation. J. Voice 30 (5), 626–630. doi:10.1016/j.jvoice.2015.06.014
Stevens K. N. (2000). Acoustic phonetics. 1. paperback. Cambridge, Mass: MIT Press, 607. (Current studies in linguistics series).
Stewart L., Oates J., O’Halloran P. (2020). “My voice is my identity”: the role of voice for trans women’s participation in sport. J. Voice 34 (1), 78–87. doi:10.1016/j.jvoice.2018.05.015
Sundberg J., Fahlstedt E., Morell A. (2005). Effects on the glottal voice source of vocal loudness variation in untrained female and male voices. J. Acoust. Soc. Am. 117 (2), 879–885. doi:10.1121/1.1841612
Sundberg J., Titze I., Scherer R. (1993). Phonatory control in male singing: a study of the effects of subglottal pressure, fundamental frequency, and mode of phonation on the voice source. J. Voice 7 (1), 15–29. doi:10.1016/s0892-1997(05)80108-0
Taylor C. J., Thomson S. L. (2022). Optimization of synthetic vocal fold models for glottal closure. J. Eng. Sci. Med. Diagn Ther. 5 (3), 031106. doi:10.1115/1.4054194
Teixeira J. P., Oliveira C., Lopes C. (2013). Vocal acoustic analysis – jitter, shimmer and HNR parameters. Procedia Technol. 9, 1112–1122. doi:10.1016/j.protcy.2013.12.124
Titze I. R. (2006). Theoretical analysis of maximum flow declination rate versus maximum area declination rate in phonation. J. Speech Lang. Hear Res. 49 (2), 439–447. doi:10.1044/1092-4388(2006/034)
Titze I. R., for V. N. C. (1995). Workshop on acoustic voice analysis: summary statement. Natl. Cent. Voice Speech. Available at: https://books.google.de/books?id=POk2HQAACAAJ.
Titze I. R., Horii Y., Scherer R. C. (1987). Some technical considerations in voice perturbation measurements. J. Speech Hear Res. 30 (2), 252–260. doi:10.1044/jshr.3002.252
Titze I. R., Martin D. W. (1998). Principles of voice production. J. Acoust. Soc. Am. 104 (3), 1148. doi:10.1121/1.424266
Titze I. R., Palaparthi A. (2016). Sensitivity of source-filter interaction to specific vocal tract shapes. IEEEACM Trans. Audio Speech Lang. Process 24 (12), 2507–2515. doi:10.1109/taslp.2016.2616543
Tiwari M., Tiwari M. (2012). Voice - how humans communicate? J. Nat. Sci. Biol. Med. 3 (1), 3–11. doi:10.4103/0976-9668.95933
Tong J. Y., Sataloff R. T. (2022). Respiratory function and voice: the role for airflow measures. J. Voice Off. J. Voice Found. 36 (4), 542–553. doi:10.1016/j.jvoice.2020.07.019
Tur B., Gühring L., Wendler O., Schlicht S., Drummer D., Kniesburges S. (2023). Effect of ligament fibers on dynamics of synthetic, self-oscillating vocal folds in a biomimetic larynx model. Bioengeneering 10 (10), 1130. doi:10.3390/bioengineering10101130
Vahabzadeh-Hagh A. M., Zhang Z., Chhetri D. K. (2018). Hirano’s cover–body model and its unique laryngeal postures revisited. Laryngoscope 128 (6), 1412–1418. doi:10.1002/lary.27000
Van Den B. J., Tan T. S. (1959). Results of experiments with human larynxes. ORL 21 (6), 425–450. doi:10.1159/000274240
Verdolini K., Chan R., Titze I. R., Hess M., Bierhals W. (1998). Correspondence of electroglottographic closed quotient to vocal fold impact stress in excised canine larynges. J. Voice 12 (4), 415–423. doi:10.1016/s0892-1997(98)80050-7
Wang S. G., Park H. J., Lee B. J., Lee S. M., Ko B., Lee S. M., et al. (2016). A new videokymography system for evaluation of the vibration pattern of entire vocal folds. Auris Nasus Larynx 43 (3), 315–321. doi:10.1016/j.anl.2015.10.002
Xuan Y., Zhang Z. (2014). Influence of embedded fibers and an epithelium layer on the glottal closure pattern in a physical vocal fold model. J. Speech Lang. Hear Res. 57 (2), 416–425. doi:10.1044/2013_JSLHR-S-13-0068
Xue Q., Mittal R., Zheng X., Bielamowicz S. (2010). A computational study of the effect of vocal-fold asymmetry on phonation. J. Acoust. Soc. Am. 128 (2), 818–827. doi:10.1121/1.3458839
Yumoto E., Gould W. J., Baer T. (1982). Harmonics-to-noise ratio as an index of the degree of hoarseness. J. Acoust. Soc. Am. 71 (6), 1544–1549. doi:10.1121/1.387808
Zhang Z. (2015). Regulation of glottal closure and airflow in a three-dimensional phonation model: implications for vocal intensity control. J. Acoust. Soc. Am. 137 (2), 898–910. doi:10.1121/1.4906272
Zhang Z. (2016). Cause-effect relationship between vocal fold physiology and voice production in a three-dimensional phonation model. J. Acoust. Soc. Am. 139 (4), 1493–1507. doi:10.1121/1.4944754
Zhang Z. (2019). Compensation strategies in voice production with glottal insufficiency. J. Voice 33 (1), 96–102. doi:10.1016/j.jvoice.2017.10.002
Zhang Z., Neubauer J., Berry D. A. (2006). The influence of subglottal acoustics on laboratory models of phonation. J. Acoust. Soc. Am. 120 (3), 1558–1569. doi:10.1121/1.2225682
Keywords: biomimetic larynx model, flow-induced vocal folds’ oscillations, fluid-structure-acoustic-interaction, physiological phonation characteristics, integrated fibers in synthetic larynx model
Citation: Gühring L, Tur B, Semmler M, Schützenberger A and Kniesburges S (2024) Influence of flow rate and fiber tension on dynamical, mechanical and acoustical parameters in a synthetic larynx model with integrated fibers. Front. Physiol. 15:1455360. doi: 10.3389/fphys.2024.1455360
Received: 12 July 2024; Accepted: 04 November 2024;
Published: 19 November 2024.
Edited by:
Kathy Huet, University of Mons, BelgiumReviewed by:
Xudong Zheng, University of Maine, United StatesZhaoyan Zhang, UCLA Head and Neck Surgery, United States
Copyright © 2024 Gühring, Tur, Semmler, Schützenberger and Kniesburges. This is an open-access article distributed under the terms of the Creative Commons Attribution License (CC BY). The use, distribution or reproduction in other forums is permitted, provided the original author(s) and the copyright owner(s) are credited and that the original publication in this journal is cited, in accordance with accepted academic practice. No use, distribution or reproduction is permitted which does not comply with these terms.
*Correspondence: Stefan Kniesburges, c3RlZmFuLmtuaWVzYnVyZ2VzQHVrLWVybGFuZ2VuLmRl
 Lucia Gühring
 Bogac Tur
 Marion Semmler
 Anne Schützenberger
 Stefan Kniesburges