 Xianfeng Guo
 Xuchao Zhang
 Min Li2
 Yuanliang Peng
 Zi Wang
- 1Department of Hematology, The Second Xiangya Hospital, Molecular Biology Research Center, Center for Medical Genetics, School of Life Sciences, Hunan Province Key Laboratory of Basic and Applied Hematology, Central South University, Changsha, China
- 2Department of medical laboratory college, Changsha Medical University, Changsha, China
Background: β-thalassemia (β-TH) is a hereditary hemolytic anemia that results in deficient hemoglobin (Hb) synthesis. It is characterized by ineffective erythropoiesis, anemia, splenomegaly, and systemic iron overload. Exploration new potential biomarkers and drug candidates is important to facilitate the prevention and treatment of β-TH.
Methods: We applied quasi-targeted metabolomics between wild type (Wt) and heterozygous β-TH mice (Th3/+), a model of non-transfusion-dependent β-TH intermedia, in plasma and peripheral blood (PB) cells. Futher data was deeply mined by Kyoto Encyclopedia of Genomes (KEGG) and machine algorithms methods.
Results: Using KEGG enrichment analysis, we found that taurine and hypotaurine metabolism disorders in plasma and alanine, aspartate and glutamate metabolism disorders in PB cells. After systematically anatomize the metabolites by machine algorithms, we confirmed that alpha-muricholic acidUP and N-acetyl-DL-phenylalanineUP in plasma and Dl-3-hydroxynorvalineUP, O-acetyl-L-serineUP, H-abu-OHUP, S-(Methyl) glutathioneUP, sepiapterinDOWN, and imidazoleacetic acidDOWN in PB cells play key roles in predicting the occurrence of β-TH. Furthermore, Sepiapterin, Imidazoleacetic acid, Methyl alpha-D-glucopyranoside and alpha-ketoglutaric acid have a good binding capacity to hemoglobin E through molecular docking and are considered to be potential drug candidates for β-TH.
Conclusion: Those results may help in identify useful molecular targets in the diagnosis and treatment of β-TH and lays a strong foundation for further research.
1 Introduction
β-thalassemia (β-TH) is a hereditary hemolytic anemia that results in deficient hemoglobin (Hb) synthesis due to reduced or complete absence of synthesis of the β peptide chain of β-Hb (Taher et al., 2018; Thein, 2018). β-TH carriers comprise approximately 3% of the total global population (Jaing et al., 2021). It is estimated that about 300,000 to 500,000 children, the vast majority of whom are from developing countries, are born each year with severe hemoglobin abnormalities. Europe, Africa, the Mediterranean basin, the Middle East, continental India, Southeast Asia, and the Pacific Islands are severely affected. The prevalence of β-TH carriers in these regions ranges from 1% to 20%. Europe has the highest prevalence of about 35%, followed by Asia at 24%. Australia and South America have almost equal prevalence at 20% (Jaing et al., 2021).
The three provinces with the highest β-TH carriage rates in China are Guangxi (6.66%), Hainan (5.11%), and Guizhou (4.63%) (Shang et al., 2017). Guangdong, Yunnan, Hong Kong, Hunan, and Jiangxi also had high rates of carriage. According to the data of the China Thalassemia Blue Book (2020), there are about 30 million thalassemia gene carriers and about 300,000 patients with thalassemia major and intermedia in mainland China, and the number of affected people is increasing at a rate of approximately 10% per year.
There are several techniques for screening and diagnosing hemoglobin variants and thalassemia (Hartwell et al., 2005). Determining a patient’s genetic makeup and characteristics by complete blood count (CBC) is the most reliable method of diagnosing thalassemia (Birndorf et al., 1996). However, these methods do not provide insights into changes in metabolite patterns in biological material, which can provide valuable phenotypic information and mechanistically reveal the disease process and associated abnormal biochemical processes. Several studies have demonstrated that metabolic disorders are prevalent in patients with β-thalassemia (De Sanctis et al., 2013; De Sanctis et al., 2016), but to date, metabolic disorders remain unrecognized.
In the present study, we conducted quasi-targeted metabolomic analyses in β-TH and found metabolic disorders in plasma and peripheral blood (PB) cells. Analyzing the differential metabolites of Th3/+ mice in parallel with Wt mice led us to discover novel potential biomarkers and drug candidates for β-TH.
2 Materials and methods
2.1 Mice
Wild-type C57BL/6 (Wt) mice were obtained from the Hunan SJA. Laboratory Animal Co. Ltd. β-TH (Th3/+) mice with a C57BL/6 background were originally purchased from Jackson Laboratories. Male Th3/+ and female wild-type C57BL/6 mice were cross-bred to produce β-TH and wild-type littermates at Central South University Laboratory Animal Center.
2.2 Quasi-targeted metabolomic analysis
Using the eyeball removal method, we collected PB in EP tubes containing heparin (50 U/mL) and centrifuged it at 200 × g for 5 min at 4°C. The upper layer of fluid was plasma, and the lower layer of cells was PB cells. The plasma and PB cells were separated. PB cells (100 μL, about 1×10⁹–5×10⁹ cells) were ground separately with liquid nitrogen and resuspended in prechilled 80% methanol and 0.1% formic acid by vortexing. Samples were incubated on ice for 5 min and then centrifuged at 15,000 × g for 20 min at 4°C. Quasi-targeted metabolomics profiling was performed on the prepared samples using the XploreMET platform (Novogene, China) following previously reported procedures with minor modifications (Lin et al., 2023).
2.3 Biomarker screening
The random forest (RF) machine learning method was selected to construct the prediction model. Differential biomarkers in the top 15 positions that had a key role in the grouping were screened. Then, we performed Pearson’s correlation coefficient analysis of hemoglobin concentration and metabolite abundance in each mouse to further screen biomarkers by correlation coefficient (R2), p-values, and receiver operating characteristic curve.
2.4 Molecular docking
The crystal structure of the candidate protein targets of hemoglobin was downloaded from the RCSB Protein Data Bank (Th) and modified using the Autodock Tools 1.5.6 software. These targets include ligand and water removal, hydrogen addition, and amino acid optimization and patching. The files were saved in pdbqt format. Discovery Studio2019 Client was used to visualize the docking results.
2.5 Statistical analysis
The statistical analysis of each plot is described above or in the corresponding figure legend. All grouped data values are presented as the mean ± SD. p-values were calculated using Student’s t-test or Kruskal–Wallis ANOVA with GraphPad Prism software.
3 Results
3.1 Basic characteristics of Th3/+ mice
Female Wt C57BL/6 mice and Male Th3/+ mice were crossed to produce β-TH and Wt littermates. Five male Th3/+ mice and five male Wt mice were selected by genotype. Routine blood tests revealed that Hb, red blood cells (RBC), hematocrit (HCT), mean corpuscular volume (MCV), mean corpuscular hemoglobin (MCH), and mean corpuscular hemoglobin concentration (MCHC) were significantly lower, while reticulocyte percentage (ret%) was significantly higher in Th3/+ mice (Table 1). The results illustrate that the genotypic identification results were consistent with the phenotypic results, which lays the foundation for the accuracy of the subsequent experimental results.
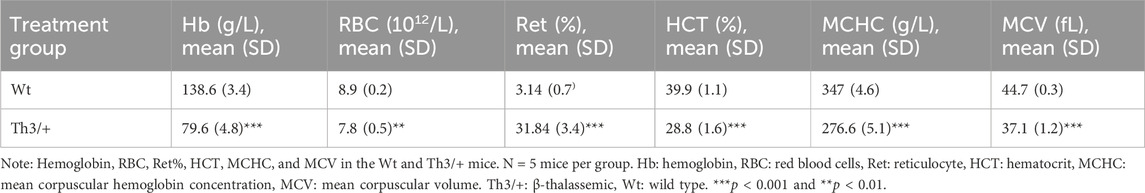
Table 1. Mouse red blood cell parameters.
For preliminary screening of biomarkers and drug candidates in Th3/+ mice, we selected PB cells and plasma for metabolomic analysis. The combined analysis of plasma and PB cells could reflect the metabolic status inside and outside the cells. In addition, compared with erythrocytes, PB cells have a wider detection range, which can provide more options for screening markers and drug candidates.
3.2 Analysis of the metabolome data
3.2.1 QC analysis
The kernel density estimation plot (Kdeplot) reveals that the plasma distribution of metabolites is good (Figure 1A). The Pearson correlation coefficients of QC samples calculated by the relative quantitative values of metabolites are between 0.99 and 1.00 (Figure 1B). The Kdeplot of PB cell distribution of metabolites is also good (Figure 1C), while the Pearson correlation coefficients of QC samples were between 0.61 and 1.00 (Figure 1D). The above data indicate that the quality of these data is high, laying the foundation for subsequent research.
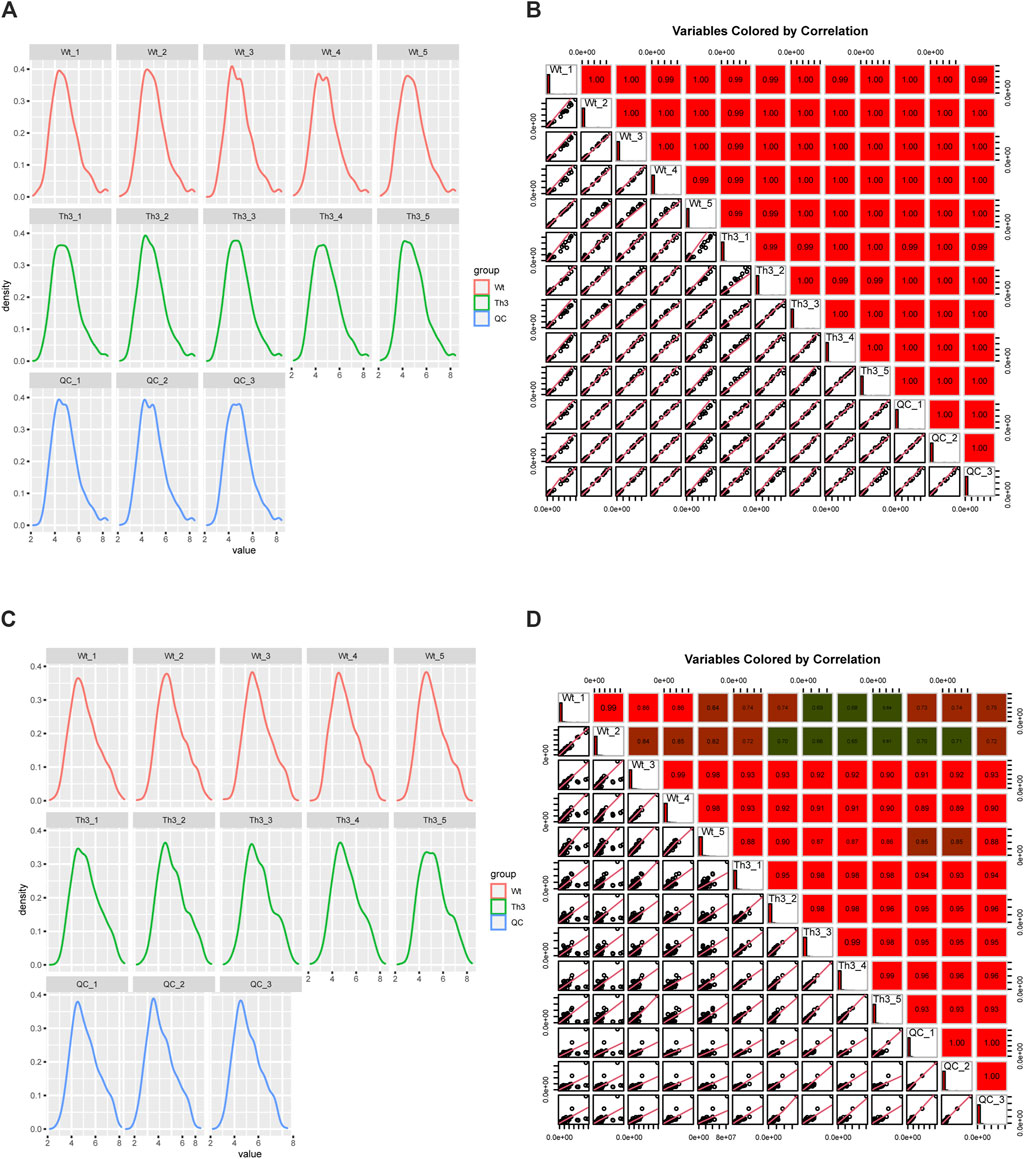
Figure 1. QC analysis of the metabolome data. (A, B) were plasma, and (C, D) were peripheral blood cells (PB cells).
3.2.2 Differential metabolite analysis of PB cells and plasma between Th3/+ mice and Wt mice
We applied OPLS-DA to plasma (Figures 2A,B) and PB cells (Figures 2C,D) for statistical analysis. We obtained model evaluation parameters R2 and Q2 by 7-fold cross-validation, with the results suggesting that the models were good, and we could proceed to the next analysis step. After analyzing the targeted metabolic data, we found that the difference in plasma metabolites between groups was obvious among the 649 metabolites tested (Figure 2E). In PB cells, the differential metabolite expressions between groups were also obvious among the 752 metabolites tested (Figure 2F).
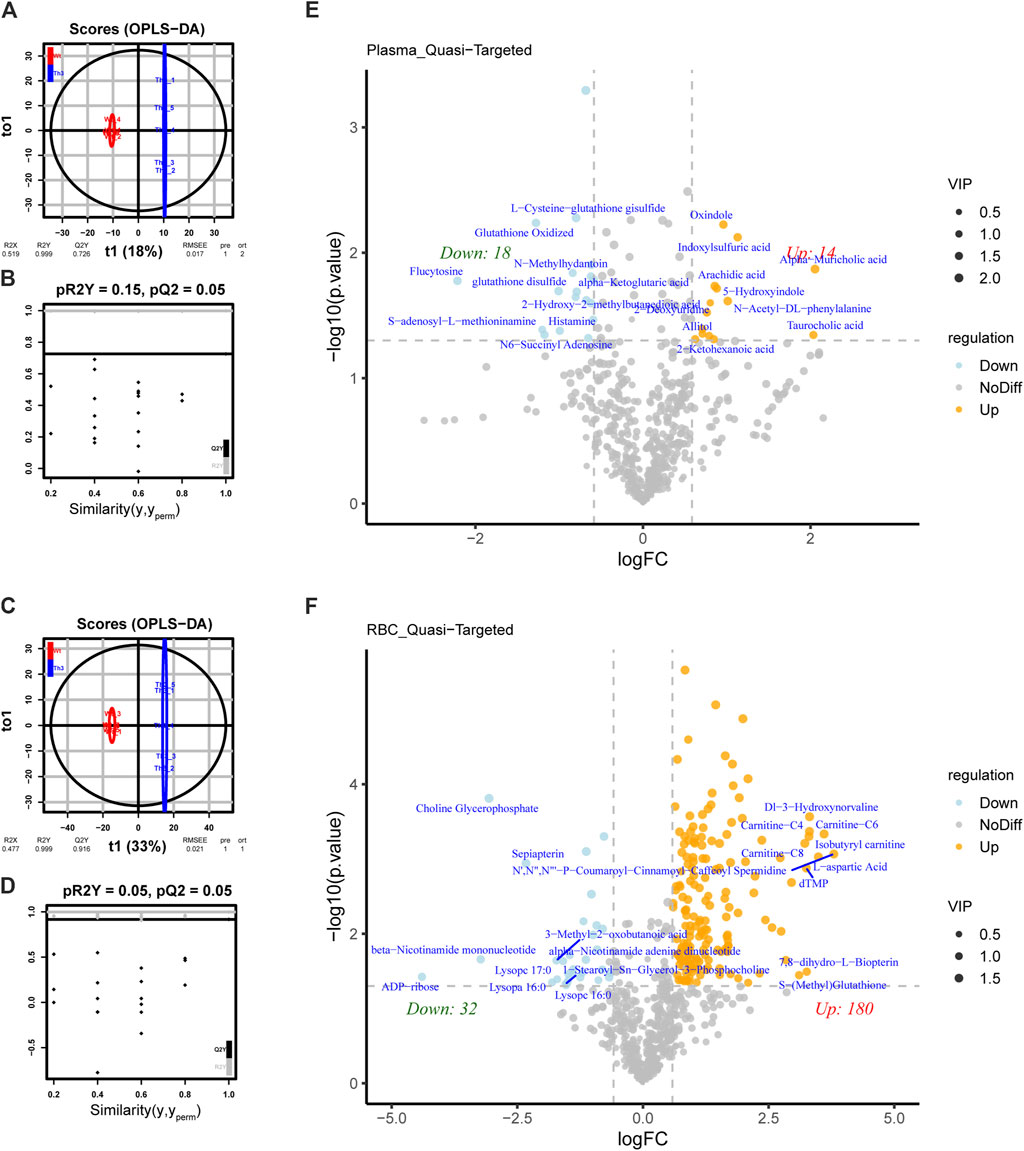
Figure 2. Differential metabolite analysis of PB cells and plasma between Th3/+ mice and Wt mice. (A) Orthogonal partial least squares discriminant analysis (OPLS-DA) of plasma. (B) OPLS-DA score plots from the Wt mice and Th3/+ mice in plasma (pR2 = 0.15, pQ2 = 0.05). (C) OPLS-DA of PB cells. (D) OPLS-DA score plots from the Wt mice and Th3/+ mice in PB cells (pR2 = 0.05, pQ2 = 0.05). Volcano plot of differentially abundant metabolites in plasma (E) and PB cells (F). The horizontal coordinate indicates the variation in the differential multiplicity of metabolites in different subgroups (log2FC), and the vertical coordinate indicates the level of differential significance (−log10(p-value)). Each point in the volcano plot represents a metabolite. Significantly upregulated metabolites are represented by yellow dots, significantly downregulated metabolites are represented by blue dots, and the size of the dots represents the VIP value.
Thirty-two metabolites in plasma were differentially expressed between Th3/+ mice and Wt mice, of which 18 metabolites showed an upward trend and 14 metabolites showed a downward trend. In PB cells, 212 metabolites were differentially expressed, of which 180 metabolites showed an upward trend and 32 metabolites showed a downward trend. The differences among groups were further clarified.
3.2.3 Hierarchical clustering analysis of the differential metabolites
Compared to Wt mice, the main upward-trending metabolites were concentrated in bile acids, while the main downward-trending metabolites were concentrated in amino acids in plasma. In PB cells, the main upward-trending metabolites were concentrated in amino acids, while the main downward-trending metabolites were concentrated in phospholipids.
Hierarchical clustering showed a clearer picture of the detailed clustering of the top 25 differential metabolites. In plasma, the top upregulated metabolites were 2-deoxyuridine, oxindole, indoxylsulfuric acid, and 3-(2-hydroxyphenyl) propionic acid, while the top downregulated metabolites were S-adenosyl-L-methioninamine, 2-hydroxy-2-methylbutanedioic acid, flucytosine, and L-cysteine-glutathione disulfide (Figure 3A). In PB cells, the top upregulated metabolites were 1,4-diaminobutane, DI-3-hydroxynorvaline, adenylic acid, and pyrrole-2-carboxylic acid, while the top downregulated metabolites were alpha-nicotinamide adenine dinucleotide, methyl alpha-D-glucopyranoside, 3-methyl-2-oxobutanoic acid, and lysoPC 20:0 (Figure 3B).
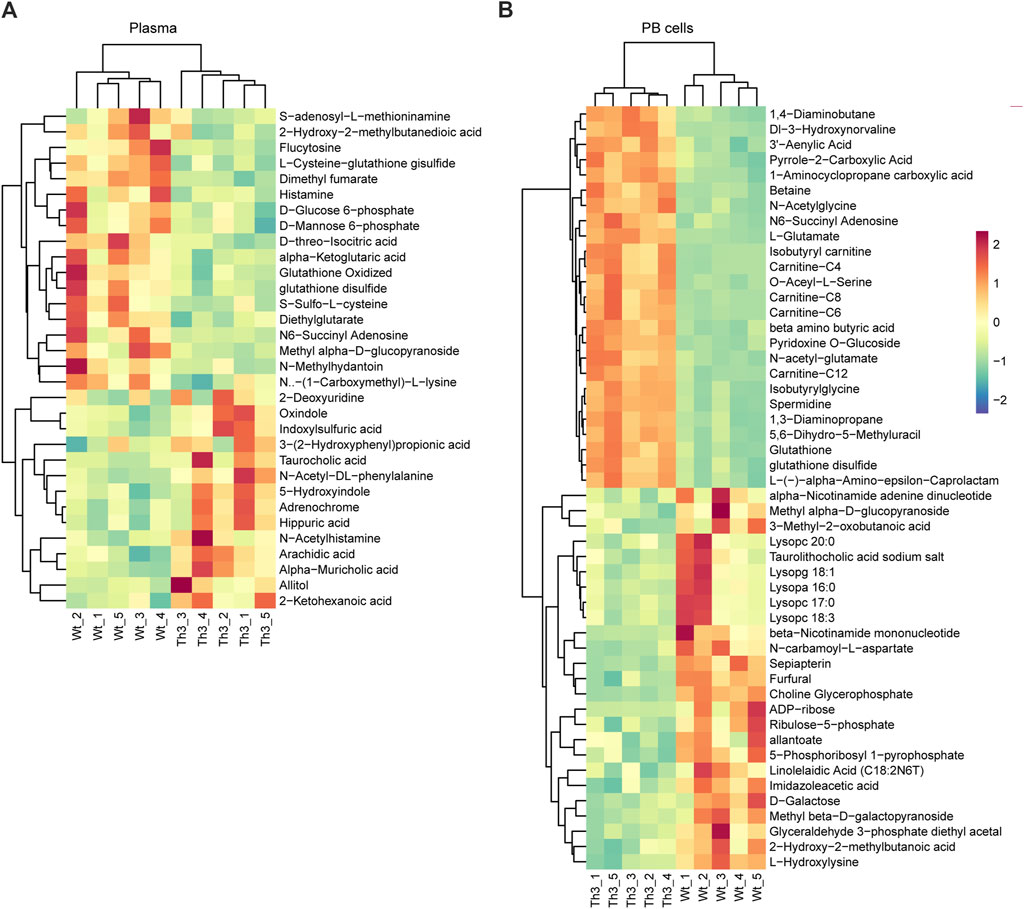
Figure 3. Hierarchical clustering analysis of the differential metabolites: heat map analysis of plasma (A) and PB cells (B).
Although the number of results is substantial, there are still differences between mice of the same type, especially in plasma. Therefore, we need other methods to better analyze metabolites.
3.2.4 KEGG enrichment analysis in different groups
KEGG enrichment analysis of the differential metabolites showed that plasma of Th3/+ mice and Wt groups were mainly enriched in taurine and hypotaurine metabolism (p = 0.025) (Figure 4A), while PB cells were mainly enriched in alanine, aspartate, and glutamate metabolism (p < 0.001) and glutathione metabolism (p < 0.001) (Figure 4B). In taurine and hypotaurine metabolisms, the differential metabolites were 3-sulfino-L-alanineDOWN, taurocholateUP, and alpha-ketoglutaric acidDOWN(Figure 4C). In alanine, aspartate, and glutamate metabolism, the differential metabolites were L-alanineUP, citrateUP, L-aspartateUP, L-glutamateUP, 4-aminobutanoateUP, fumarateUP, D-glucosamine 6-phosphateUP, and succinateUP(Figure 4D). In glutathione metabolism, the differential metabolites were cadaverineUP, glycineUP, putrescineUP, spermidineUP, glutathione disulfideUP (GSH), L-glutamateUP, gamma-L-glutamyl-L-cysteineUP, and 5-oxoprolineUP(Figure 4E).
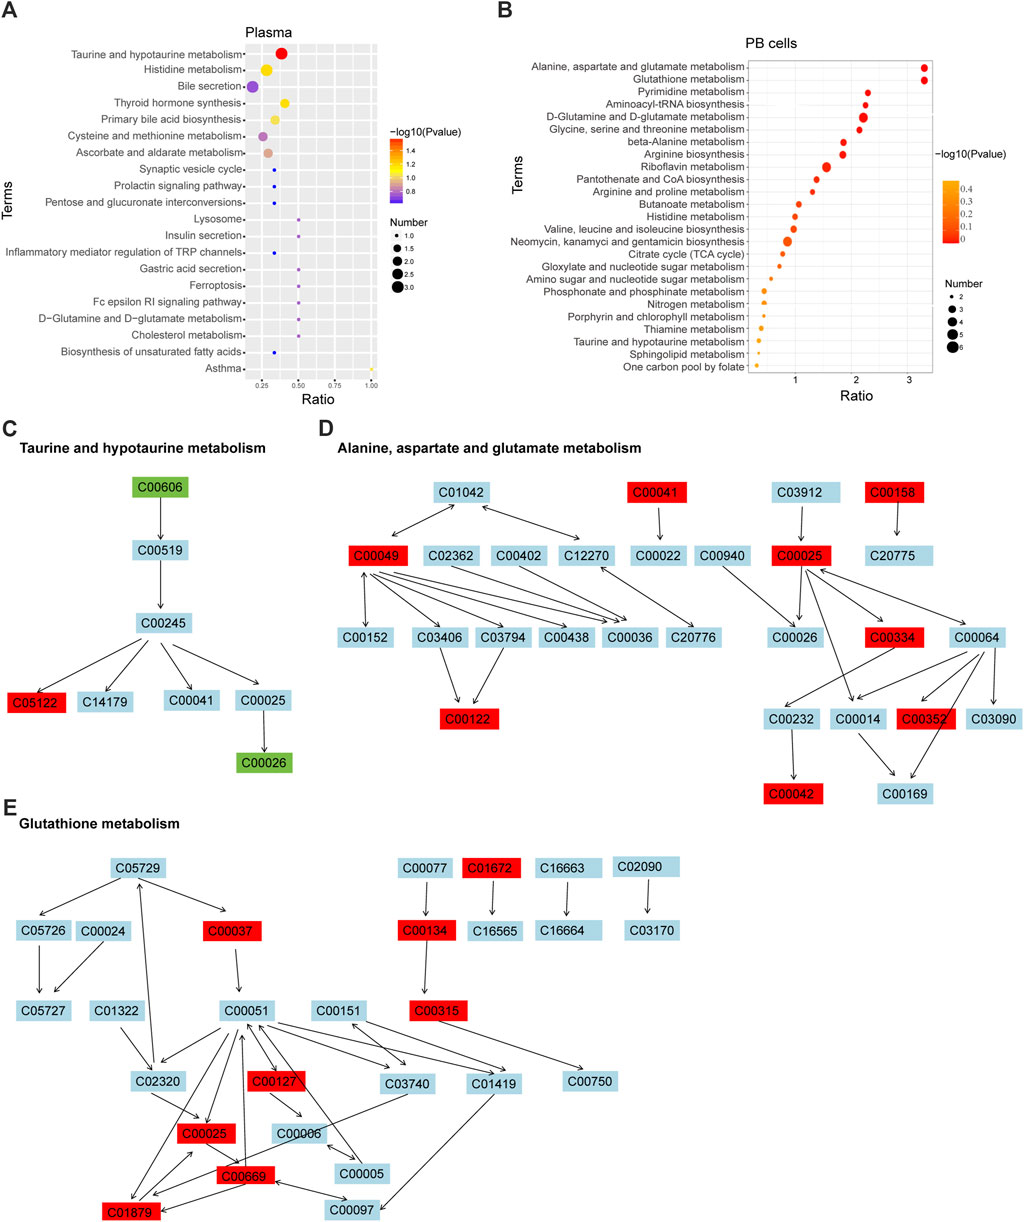
Figure 4. KEGG enrichment analysis in different groups. Bubble diagram of KEGG enrichment of plasma (A) and PB cells (B). The color of the dot represents the p-value, and the size of the dot represents the number of differential metabolites in the corresponding pathway. Schematic diagram of metabolic pathways of taurine and hypotaurine metabolism (C); alanine, aspartate, and glutamate metabolism (D); and glutathione metabolism (E).
In addition to these top-ranked metabolic pathways, pyrimidine metabolism, aminoacyl-tRNA biosynthesis, and D-glutamine and D-glutamate metabolism were strengthened in the PB cells of Th3/+ mice, with the levels of related metabolites significantly higher than those in normal controls. From the metabolic pathways, we can speculate that the large number of upregulated metabolites in Th3/+ mice is closely related to the enhancement of metabolism. These increased metabolites also offer the possibility of searching for biomarkers associated with anemia in Th3/+ mice.
3.3 Biomarker prediction of β-TH
3.3.1 Machine learning algorithms for β-TH biomarker prediction
The metabolites with variable importance in projection (VIP) > 1.0 and p-value < 0.05 were chosen, and comparisons were made among each group using RF to screen the top 15 metabolites. After combined analysis of the machine learning algorithms, the representative difference products between Th3/+ mice and Wt mice in plasma were N-acetyl- DL-phenylalanine, indoxylsulfuric acid, oxindole, flucytosine, alpha-muricholic acid, oxidized glutathione, arachidic acid, and glutathione disulfide (mean decrease accuracy>0.01, Figure 5A).
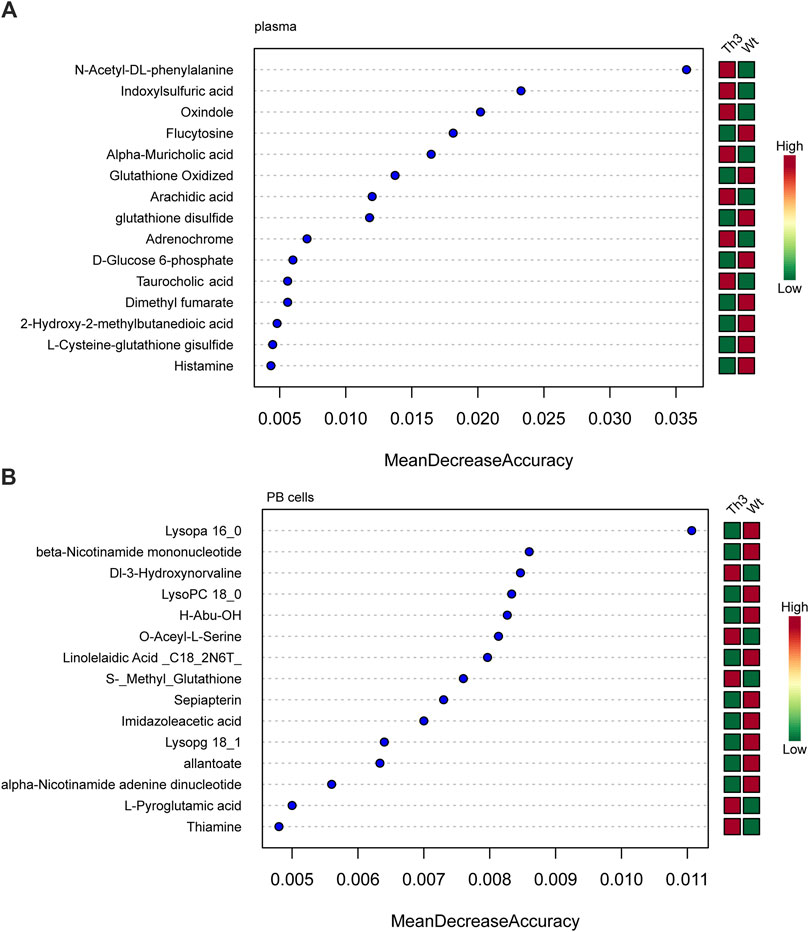
Figure 5. Machine learning algorithms for β-TH biomarker prediction: random forest (RF) analysis of plasma (A) and PB cells (B).
The combined analysis of the machine learning algorithms revealed that the representative differential products in the PB cells of Th3/+ mice and Wt mice were lysoPA 16:0, beta-nicotinamide mononucleotide, DI-3-hydroxynorvaline, LysoPC 18:0, H-abu-oh, O-acetyl-L-serine, linolelaidic acid, S-methyl glutathione, sepiapterin, and imidazoleacetic acid (mean decrease accuracy > 0.007, Figure 5B).
3.3.2 Further screening of predicted biomarkers
We performed Pearson’s correlation coefficient analysis of RF-screened biomarkers with mice Hb and found that in plasma, the alpha-muricholic acid (R = 0.84, p = 0.002) and N-acetyl-DL-phenylalanine (R = 0.81, p = 0.004) were highly correlated with hemoglobin (Figures 6A,B). In PB cells, Dl-3-hydroxynorvaline (R = 0.96, p < 0.001), sepiapterin (R = 0.95, p < 0.001), O-acetyl-L-serine (R = 0.94, p < 0.001), H-abu-OH (R = 0.90, p < 0.001), imidazoleacetic acid (R = 0.88, p < 0.001) and S-(methyl) glutathione (R = 0.8, p = 0.005) were highly correlated with mice hemoglobin (Figures 6C–H). In addition, the area under the curve (AUC) values of the above metabolites were estimated, and the results showed that all metabolites had an AUC value of 1 (Table 2).
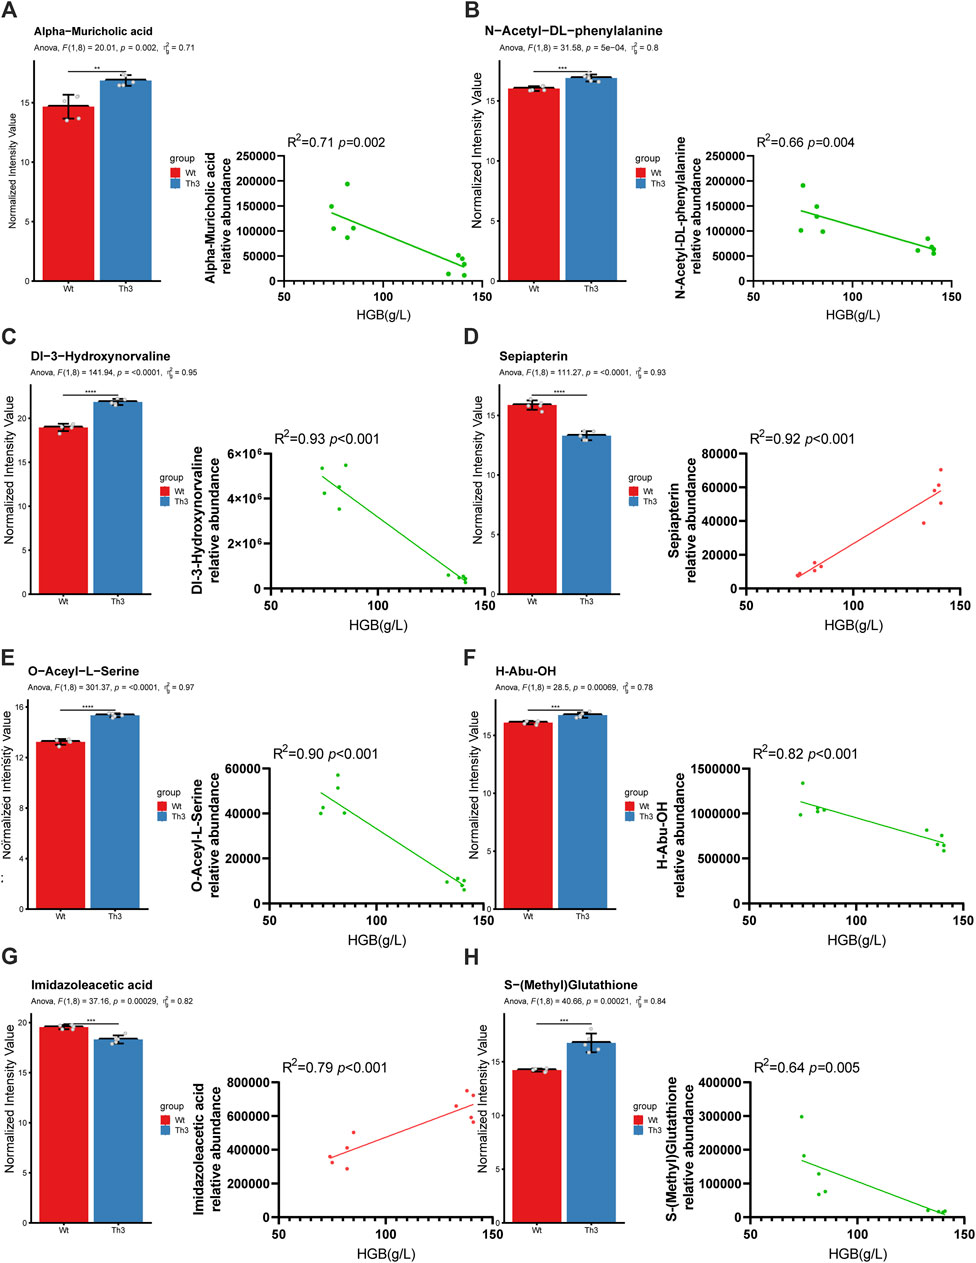
Figure 6. Further screening of predicted biomarkers. Relative abundance and correlation coefficient of alpha-muricholic acid (A), N-acetyl-DL-phenylalanine (B), Dl-3-hydroxynorvaline (C), sepiapterin (D), O-acetyl-L-serine (E), H-abu-OH (F), imidazoleacetic acid (G), and S-(methyl) glutathione (H). Comparisons between the two groups were evaluated with a 2-tailed t-test, *p < 0.05; **p < 0.01; ***p < 0.001.
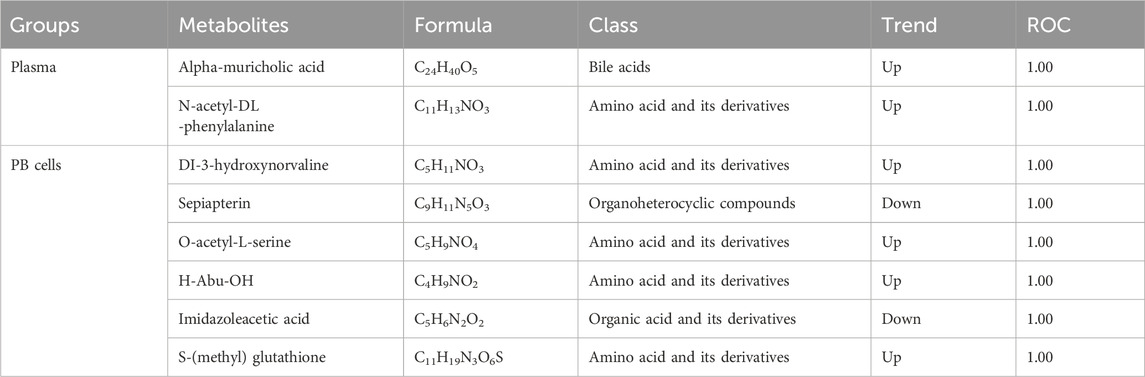
Table 2. Information of predicted biomarkers.
From the above results, we found that the screened serum metabolic markers alpha-muricholic acid and N-acetyl-DL-phenylalanine were elevated. In PB cells, Dl-3-hydroxynorvaline, O-acetyl-L-serine, H-abu-OH, and S-(methyl) glutathione were elevated while sepiapterin and imidazoleacetic acid were decreased. We speculate that alpha-muricholic acidUP, N-acetyl-DL-phenylalanineUP, Dl-3-hydroxynorvalineUP, O-acetyl-L-serineUP, H-abu-OHUP, S-(methyl) glutathioneUP, sepiapterinDOWN, and imidazoleacetic acidDOWN play key roles in predicting the occurrence of β-TH.
3.4 Drug candidate prediction of β-TH
A combined analysis of the differential metabolites in plasma and PB cells revealed 21 common differential metabolites, of which eight were co-upregulated, and three were co-downregulated. The three co-downregulated metabolites were methyl alpha-D-glucopyranoside, alpha-ketoglutaric acid, and 2-hydroxy-2-methylbutanoic acid. Together with sepiapterin and imidazoleacetic acid, the above five metabolites were selected as drug candidates for β-TH.
The interaction of hemoglobin E (1NQP) isolated from blood samples of β-TH predictive candidate targets was validated by molecular docking. The 2D and 3D structures of the ligands are shown in Figure 7. The estimated free energy of binding is summarized in Table 3. Electrostatic and van der Waals forces are the main forces between ligand and target proteins. The binding energies of the ligands and receptors of sepiapterin, imidazoleacetic acid, methyl alpha-D-glucopyranoside, and alpha-ketoglutaric acid were less than −5.366 kcal/mol with 1NQP, indicating good binding stability between the above compounds and the 1NQP target.
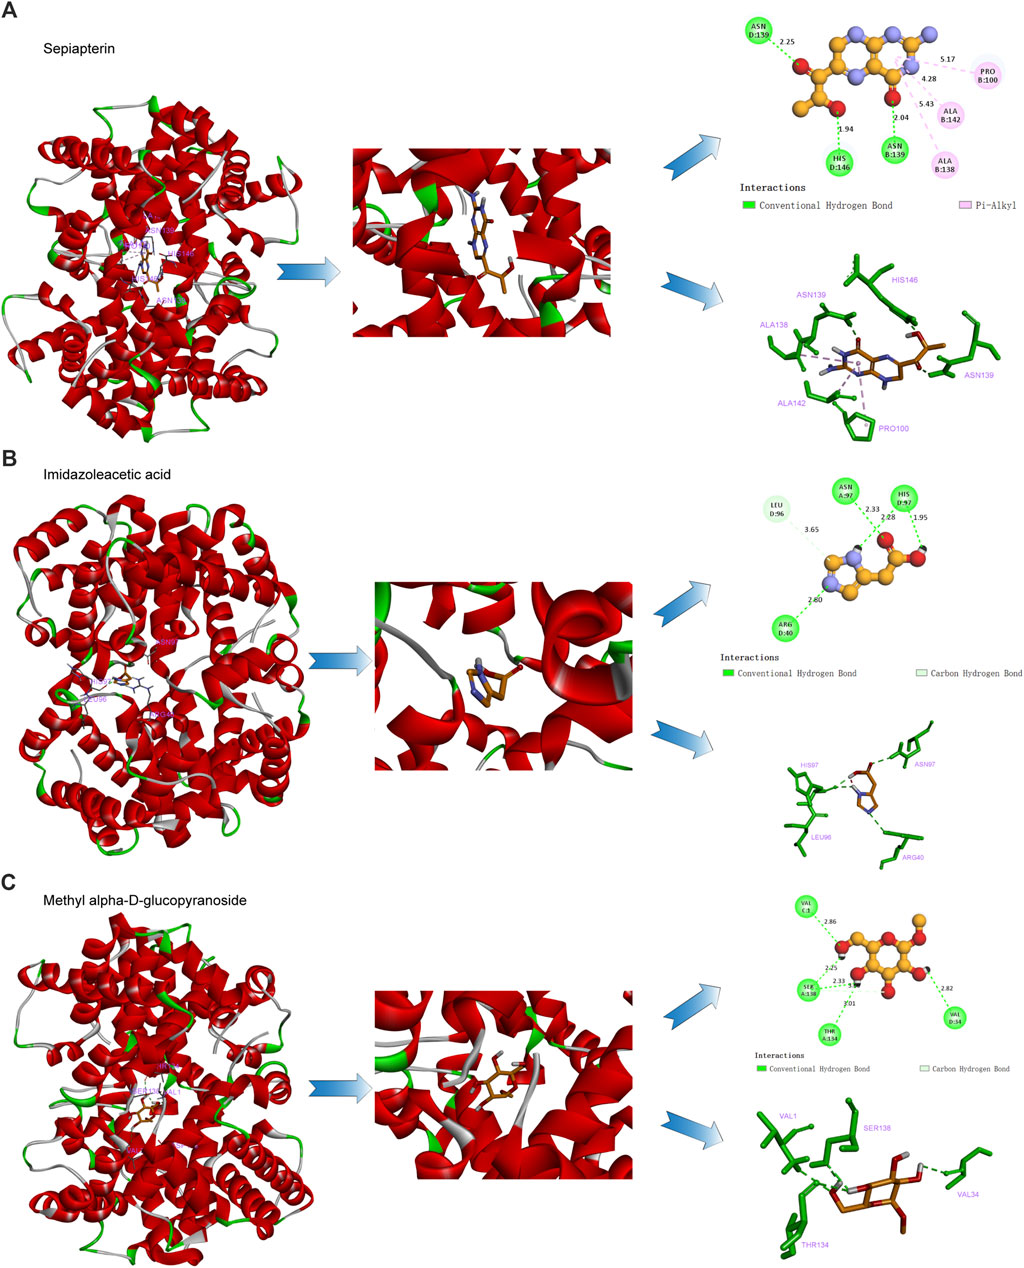
Figure 7. β-TH drug candidate prediction. Molecular docking analysis of the interaction of the hemoglobin E with sepiapterin (A), imidazoleacetic acid (B), and methyl alpha-D-glucopyranoside (C).
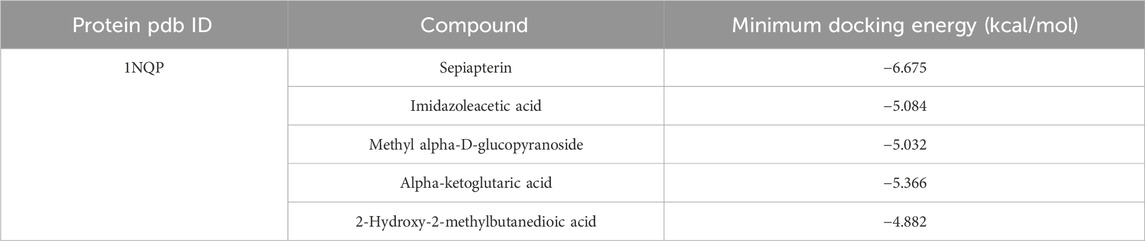
Table 3. Molecular docking energy results.
4 Discussion
Metabolites serve as direct signatures of biochemical activity and provide a readout of the cell state. Metabolomic analysis has identified 40 serum metabolites that are significantly differently expressed between β-TH patients and healthy controls, and metabolic pathway analysis revealed multiple alterations (Musharraf et al., 2017). A metabolomic study in the serum of 40 β-thalassemia patients before and after administration of hydroxyurea (HU) revealed that the levels of 25 metabolites, which were altered before the patients received HU therapy, started to revert toward the levels of the healthy group after HU treatment. As HU shifts body metabolism toward normal, this study suggested that HU is a good treatment option and can ameliorate disease complications (Iqbal et al., 2018). Most previous studies were single-sample studies. We designed plasma and PB cells for joint metabolomic analysis. In addition, we selected quasi-targeted metabolomics methods, which are a new technology integrating sequencing breadth and accuracy (Wang et al., 2022; Wu et al., 2023; Peng et al., 2024) and discovered many new metabolic biomarkers and drug candidate metabolites.
Using KEGG analysis, we found disturbed metabolism of alanine, aspartate, and glutamate in PB cells with nine metabolite changes, most of which were related to energy metabolism, such as citrate, fumarate, and succinate. Matte A et al. demonstrated a significant reduction of ATP in the bone marrow and splenocytes of Th3/+ mice (Matte et al., 2021). The reduction of ATP in erythrocytes affects the stability of the cell membrane and leads to hemolysis. This is the first time we have focused on metabolite changes in energy supply, prompting us to explore the new pathogenesis of β-TH. Another metabolism disorder in PB cells is glutathione metabolism, and GSH plays a core role. GSH is essential for cellular redox homeostasis (Seo et al., 2004), and the glutathione redox system is the first line of defense against oxidative stress in thalassemia patients (Kalpravidh et al., 2013). In terms of pathogenesis, loss of HBB gene function in human erythroid progenitor cells leads to increased ROS generation and oxidative stress, causing increased apoptosis. Therefore, by metabolomics assay, we speculate that the increase of ROS in Th3/+ mice was related to glutathione metabolism.
We identified eight potential metabolic markers for the diagnosis of thalassemia, most of which were derived from amino acids and derivatives (62.5%). A study of the amino acid metabolism of β-TH major patients in the United Arab Emirates found that glutamate, serine, and proline were significantly higher, which was consistent with our results (Abdulrazzaq et al., 2005). According to KEGG analysis, amino acids represented by glycine were significantly increased in the glutathione metabolism disorder in PB cells. In erythroblasts, glycine uptake via the glycine carrier system, GlyT1, is a rate determiner of heme biosynthesis and bioavailability (Eulenburg et al., 2005; Wolosker, 2007), and an oral selective inhibitor of GlyT1 was developed to treat negative symptoms of patients with schizophrenia (Black et al., 2009; Roberts et al., 2010; Umbricht et al., 2014; Winter et al., 2016) and also had a good treatment effect in a mouse model of β-TH (Matte et al., 2019). Developing drugs that reduce these upregulated metabolites is a new approach to drug discovery.
Hemoglobin E [HbE; Glu26(B8) → Lys], a result of splice site mutation (GAG → AAG) in exon 1 of the β-globin gene (Orkin et al., 1982; Shirohzu et al., 2000), is prevalent in Southeast Asia (Weatherall and Clegg, 1996) and the most common hemoglobin variant. HbE combined with β-thalassemia leads to E/β-thalassemia, with severe clinical consequences. E/β-thalassemics and homozygous HbE showed the instability of HbE in a higher temperature; in particular, any change that reduces the contacts between the subunits that compose the hemoglobin would generate its instability (Rees et al., 1998; Sen et al., 2004). Using molecular docking, we found that sepiapterin, imidazoleacetic acid, methyl alpha-D-glucopyranoside, and alpha-ketoglutaric acid have good binding forces, suggesting that those metabolites might increase HbE stability by increasing contacts between the subunits.
Among them, sepiapterin was predicted to be the first candidate metabolic drug. Tetrahydrobiopterin plays an important role in functional and metabolic cellular homeostasis, with additional effects on proliferation (Tanaka et al., 1989; Anastasiadis et al., 1997), immune responsiveness (Huber et al., 1984; Fukuda et al., 1985), and neuronal activity (Mataga et al., 1991; Koshimura et al., 1995; Koshimura et al., 2000). Sepiapterin, an analog of tetrahydrobiopterin, has shown good therapeutic effects in many diseases (Tarpey, 2002). Sepiapterin has been reported to diminish eNOS-derived superoxide in human vascular segments (Guzik et al., 2002). Spontaneously diabetic BB rats have diminished GTP-cyclohydrolase 1 activity and decreased BH4 levels, while sepiapterin treatment normalized BH4 levels for 48 h and increased NO production from endothelial cells isolated from diabetic BB rats (Meininger et al., 2000). Vasquez-Vivar et al. found a 6 h influence of sepiapterin incubation on vascular BH4 levels and endothelial function in vessels isolated from rabbits fed a high-cholesterol diet (Vasquez-Vivar et al., 2002). From the above results, we speculated that sepiapterin might be beneficial to β-TH and need further investigation.
In this study, we chose plasma and PB cells for metabolomic analysis. However, due to the large differences in circulating cells in Th3/+ mice compared to WT mice, it is necessary to isolate these cells and analyze individual cell populations so that the metabolic status of each cell population can be more accurately reflected. In addition, as a preliminary study for screening biomarkers and drug candidates, these results must be confirmed by further analysis using human cells.
5 Conclusion
In the present study, we conducted quasi-targeted metabolomics analyses and found dysfunctional metabolism in Th3/+ mice plasma and PB cells. The complex pathogenesis of Th3/+ remains unclear. This study systematically analyzed the metabolites further preliminarily confirming that alpha-muricholic acidUP and N-acetyl-DL-phenylalanineUP in plasma and Dl-3-hydroxynorvalineUP, O-acetyl-L-serineUP, H-abu-OHUP, S-(methyl) glutathioneUP, sepiapterinDOWN, and imidazoleacetic acidDOWN in PB cells play key roles in predicting the occurrence of β-TH. Furthermore, sepiapterin, imidazoleacetic acid, methyl alpha-D-glucopyranoside, and alpha-ketoglutaric acid are drug candidates with a good binding capacity to hemoglobin E, laying a strong foundation for further investigation. Our findings may help identify useful molecular targets in the diagnosis and treatment of β-TH. However, owing to the complexity of metabolomics data, not all metabolites were systematically analyzed in this study. In subsequent studies, specimens from β-TH patients will be collected for targeted metabolomics analysis, and the above initial screening results will be validated in human cells.
Data availability statement
The original contributions presented in the study are included in the article/Supplementary Material; further inquiries can be directed to the corresponding author.
Ethics statement
The animal study was approved by the Animal Ethics Committee of Central South University (2019sydw00010) and conformed to relevant regulatory standards at the Central South University Laboratory Animal Center. The study was conducted in accordance with the local legislation and institutional requirements.
Author contributions
XG: conceptualization, data curation, investigation, writing–original draft, and writing–review and editing, ZX: formal analysis, software, and writing–original draft. ML: funding acquisition, investigation, and writing–original draft. YP: methodology and writing–original draft. ZW: methodology and writing–review and editing. JL: funding acquisition, supervision, validation, and writing–review and editing.
Funding
The author(s) declare that financial support was received for the research, authorship, and/or publication of this article from the National Natural Science Foundation of China (Grant numbers 81920108004 and 82270127 to JL), the Hunan Provincial Department of Education (Grant number 21B0827 to ML), the Hunan Provincial Health Commission (Grant number 202201065317 to ML), and the Changsha Science and Technology Bureau (Grant number kq2004076 to ML).
Conflict of interest
The authors declare that the research was conducted in the absence of any commercial or financial relationships that could be construed as a potential conflict of interest.
Publisher’s note
All claims expressed in this article are solely those of the authors and do not necessarily represent those of their affiliated organizations, or those of the publisher, the editors, and the reviewers. Any product that may be evaluated in this article, or claim that may be made by its manufacturer, is not guaranteed or endorsed by the publisher.
References
Abdulrazzaq Y. M., Ibrahim A., Al-Khayat A. I., Dawson K. (2005). Beta-thalassemia major and its effect on amino acid metabolism and growth in patients in the United Arab Emirates. Clin. Chim. Acta. 352 (1-2), 183–190. doi:10.1016/j.cccn.2004.09.017
Anastasiadis P. Z., Bezin L., Imerman B. A., Kuhn D. M., Louie M. C., Levine R. A. (1997). Tetrahydrobiopterin as a mediator of PC12 cell proliferation induced by EGF and NGF. Eur. J. Neurosci. 9 (9), 1831–1837. doi:10.1111/j.1460-9568.1997.tb00749.x
Birndorf N. I., Pentecost J. O., Coakley J. R., Spackman K. A. (1996). An expert system to diagnose anemia and report results directly on hematology forms. Comput. Biomed. Res. 29 (1), 16–26. doi:10.1006/cbmr.1996.0002
Black M. D., Varty G. B., Arad M., Barak S., De Levie A., Boulay D., et al. (2009). Procognitive and antipsychotic efficacy of glycine transport 1 inhibitors (GlyT1) in acute and neurodevelopmental models of schizophrenia: latent inhibition studies in the rat. Psychopharmacol. Berl. 202 (1-3), 385–396. doi:10.1007/s00213-008-1289-2
De Sanctis V., Soliman A. T., Elsedfy H., Pepe A., Kattamis C., El K. M., et al. (2016). Diabetes and glucose metabolism in thalassemia major: an update. Expert Rev. Hematol. 9 (4), 401–408. doi:10.1586/17474086.2016.1136209
De Sanctis V., Soliman A. T., Elsedfy H., Skordis N., Kattamis C., Angastiniotis M., et al. (2013). Growth and endocrine disorders in thalassemia: the international network on endocrine complications in thalassemia (I-CET) position statement and guidelines. Indian J. Endocrinol. Metab. 17 (1), 8–18. doi:10.4103/2230-8210.107808
Eulenburg V., Armsen W., Betz H., Gomeza J. (2005). Glycine transporters: essential regulators of neurotransmission. Trends biochem. Sci. 30 (6), 325–333. doi:10.1016/j.tibs.2005.04.004
Fukuda K., Tanaka T., Hyodo S., Kobayashi Y., Usui T. (1985). Hyperphenylalaninaemia due to impaired dihydrobiopterin biosynthesis: leukocyte function and effect of tetrahydrobiopterin therapy. J. Inherit. Metab. Dis. 8 (2), 49–52. doi:10.1007/BF01801661
Guzik T. J., Mussa S., Gastaldi D., Sadowski J., Ratnatunga C., Pillai R., et al. (2002). Mechanisms of increased vascular superoxide production in human diabetes mellitus: role of NAD(P)H oxidase and endothelial nitric oxide synthase. Circulation 105 (14), 1656–1662. doi:10.1161/01.cir.0000012748.58444.08
Hartwell S. K., Srisawang B., Kongtawelert P., Christian G. D., Grudpan K. (2005). Review on screening and analysis techniques for hemoglobin variants and thalassemia. Talanta 65 (5), 1149–1161. doi:10.1016/j.talanta.2004.09.013
Huber C., Batchelor J. R., Fuchs D., Hausen A., Lang A., Niederwieser D., et al. (1984). Immune response-associated production of neopterin. Release from macrophages primarily under control of interferon-gamma. J. Exp. Med. 160 (1), 310–316. doi:10.1084/jem.160.1.310
Iqbal A., Ansari S. H., Parveen S., Khan I. A., Siddiqui A. J., Musharraf S. G. (2018). Hydroxyurea treated β-thalassemia children demonstrate a shift in metabolism towards healthy pattern. Sci. Rep. 8 (1), 15152. doi:10.1038/s41598-018-33540-6
Jaing T. H., Chang T. Y., Chen S. H., Lin C. W., Wen Y. C., Chiu C. C. (2021). Molecular genetics of β-thalassemia: a narrative review. Med. Baltim. 100 (45), e27522. doi:10.1097/MD.0000000000027522
Kalpravidh R. W., Tangjaidee T., Hatairaktham S., Charoensakdi R., Panichkul N., Siritanaratkul N., et al. (2013). Glutathione redox system in β -thalassemia/Hb E patients. ScientificWorldJournal 2013, 543973. doi:10.1155/2013/543973
Koshimura K., Murakami Y., Tanaka J., Kato Y. (2000). The role of 6R-tetrahydrobiopterin in the nervous system. Prog. Neurobiol. 61 (4), 415–438. doi:10.1016/s0301-0082(99)00059-3
Koshimura K., Takagi Y., Miwa S., Kido T., Watanabe Y., Murakami Y., et al. (1995). Characterization of a dopamine-releasing action of 6R-L-erythro-tetrahydrobiopterin: comparison with a 6S-form. J. Neurochem. 65 (2), 827–830. doi:10.1046/j.1471-4159.1995.65020827.x
Lin X., Dai C., Chen Z., Zhang T., Pu X. (2023). Preliminary screening of biomarkers in HAPE based on quasi-targeted metabolomics. Front. Physiol. 14, 1122026. doi:10.3389/fphys.2023.1122026
Mataga N., Imamura K., Watanabe Y. (1991). 6R-tetrahydrobiopterin perfusion enhances dopamine, serotonin, and glutamate outputs in dialysate from rat striatum and frontal cortex. Brain Res. 551 (1-2), 64–71. doi:10.1016/0006-8993(91)90914-h
Matte A., Federti E., Kung C., Kosinski P. A., Narayanaswamy R., Russo R., et al. (2021). The pyruvate kinase activator mitapivat reduces hemolysis and improves anemia in a β-thalassemia mouse model. J. Clin. Invest. 131 (10), e144206. doi:10.1172/JCI144206
Matte A., Federti E., Winter M., Koerner A., Harmeier A., Mazer N., et al. (2019). Bitopertin, a selective oral GLYT1 inhibitor, improves anemia in a mouse model of β-thalassemia. JCI Insight 4 (22), e130111. doi:10.1172/jci.insight.130111
Meininger C. J., Marinos R. S., Hatakeyama K., Martinez-Zaguilan R., Rojas J. D., Kelly K. A., et al. (2000). Impaired nitric oxide production in coronary endothelial cells of the spontaneously diabetic BB rat is due to tetrahydrobiopterin deficiency. Biochem. J. 349 (Pt 1), 353–356. doi:10.1042/0264-6021
Musharraf S. G., Iqbal A., Ansari S. H., Parveen S., Khan I. A., Siddiqui A. J. (2017). β-Thalassemia patients revealed a significant change of untargeted metabolites in comparison to healthy individuals. Sci. Rep. 7, 42249. doi:10.1038/srep42249
Orkin S. H., Kazazian H. J., Antonarakis S. E., Ostrer H., Goff S. C., Sexton J. P. (1982). Abnormal RNA processing due to the exon mutation of beta E-globin gene. Nature 300 (5894), 768–769. doi:10.1038/300768a0
Peng S., Shu F., Lu Y., Fan D., Zheng D., Yuan G. (2024). Quasi-targeted metabolomics revealed isoliquiritigenin and lauric acid associated with resistance to tobacco black shank. Plant Signal Behav. 19 (1), 2332019. doi:10.1080/15592324.2024.2332019
Rees D. C., Clegg J. B., Weatherall D. J. (1998). Is hemoglobin instability important in the interaction between hemoglobin E and beta thalassemia? Blood 92 (6), 2141–2146. doi:10.1182/blood.v92.6.2141.418k05_2141_2146
Roberts B. M., Shaffer C. L., Seymour P. A., Schmidt C. J., Williams G. V., Castner S. A. (2010). Glycine transporter inhibition reverses ketamine-induced working memory deficits. Neuroreport 21 (5), 390–394. doi:10.1097/WNR.0b013e3283381a4e
Sen U., Dasgupta J., Choudhury D., Datta P., Chakrabarti A., Chakrabarty S. B., et al. (2004). Crystal structures of HbA2 and HbE and modeling of hemoglobin delta 4: interpretation of the thermal stability and the antisickling effect of HbA2 and identification of the ferrocyanide binding site in Hb. Biochemistry-US 43 (39), 12477–12488. doi:10.1021/bi048903i
Seo Y. J., Lee J. W., Lee E. H., Lee H. K., Kim H. W., Kim Y. H. (2004). Role of glutathione in the adaptive tolerance to H2O2. Free Radic. Biol. Med. 37 (8), 1272–1281. doi:10.1016/j.freeradbiomed.2004.07.012
Shang X., Peng Z., Ye Y., Zhang X., Chen Y., Zhu B., et al. (2017). Rapid targeted next-generation sequencing platform for molecular screening and clinical genotyping in subjects with hemoglobinopathies. EBioMedicine 23, 150–159. doi:10.1016/j.ebiom.2017.08.015
Shirohzu H., Yamaza H., Fukumaki Y. (2000). Repression of aberrant splicing in human beta-globin pre-mRNA with HbE mutation by antisense oligoribonucleotide or splicing factor SF2/ASF. Int. J. Hematol. 72 (1), 28–33.
Taher A. T., Weatherall D. J., Cappellini M. D. (2018). Thalassaemia. Lancet 391 (10116), 155–167. doi:10.1016/S0140-6736(17)31822-6
Tanaka K., Kaufman S., Milstien S. (1989). Tetrahydrobiopterin, the cofactor for aromatic amino acid hydroxylases, is synthesized by and regulates proliferation of erythroid cells. Proc. Natl. Acad. Sci. U S A 86 (15), 5864–5867. doi:10.1073/pnas.86.15.5864
Tarpey M. M. (2002). Sepiapterin treatment in atherosclerosis. Arterioscler. Thromb. Vasc. Biol. 22 (10), 1519–1521. doi:10.1161/01.atv.0000038144.37823.bf
Thein S. L. (2018). Molecular basis of β thalassemia and potential therapeutic targets. Blood Cells Mol. Dis. 70, 54–65. doi:10.1016/j.bcmd.2017.06.001
Umbricht D., Alberati D., Martin-Facklam M., Borroni E., Youssef E. A., Ostland M., et al. (2014). Effect of bitopertin, a glycine reuptake inhibitor, on negative symptoms of schizophrenia: a randomized, double-blind, proof-of-concept study. JAMA Psychiat 71 (6), 637–646. doi:10.1001/jamapsychiatry.2014.163
Vasquez-Vivar J., Duquaine D., Whitsett J., Kalyanaraman B., Rajagopalan S. (2002). Altered tetrahydrobiopterin metabolism in atherosclerosis: implications for use of oxidized tetrahydrobiopterin analogues and thiol antioxidants. Arterioscler. Thromb. Vasc. Biol. 22 (10), 1655–1661. doi:10.1161/01.atv.0000029122.79665.d9
Wang C., Qiu J., Li G., Wang J., Liu D., Chen L., et al. (2022). Application and prospect of quasi-targeted metabolomics in age-related hearing loss. Hear Res. 424, 108604. doi:10.1016/j.heares.2022.108604
Weatherall D. J., Clegg J. B. (1996). Thalassemia--a global public health problem. Nat. Med. 2 (8), 847–849. doi:10.1038/nm0896-847
Winter M., Funk J., Korner A., Alberati D., Christen F., Schmitt G., et al. (2016). Effects of GlyT1 inhibition on erythropoiesis and iron homeostasis in rats. Exp. Hematol. 44 (10), 964–974. doi:10.1016/j.exphem.2016.07.003
Wolosker H. (2007). NMDA receptor regulation by D-serine: new findings and perspectives. Mol. Neurobiol. 36 (2), 152–164. doi:10.1007/s12035-007-0038-6
Keywords: β-thalassemia, quasi-targeted metabolomics biomarkers, drug candidates, machine learning algorithms, molecular docking
Citation: Guo X, Zhang X, Li M, Peng Y, Wang Z and Liu J (2024) Preliminary screening of biomarkers and drug candidates in a mouse model of β-thalassemia based on quasi-targeted metabolomics. Front. Physiol. 15:1452558. doi: 10.3389/fphys.2024.1452558
Received: 21 June 2024; Accepted: 06 August 2024;
Published: 23 August 2024.
Edited by:
Dimosthenis Andreas Sarigiannis, Aristotle University of Thessaloniki, GreeceReviewed by:
Serge Pissard, Hôpitaux Universitaires Henri Mondor, FranceXiuli An, New York Blood Center, United States
Copyright © 2024 Guo, Zhang, Li, Peng, Wang and Liu. This is an open-access article distributed under the terms of the Creative Commons Attribution License (CC BY). The use, distribution or reproduction in other forums is permitted, provided the original author(s) and the copyright owner(s) are credited and that the original publication in this journal is cited, in accordance with accepted academic practice. No use, distribution or reproduction is permitted which does not comply with these terms.
*Correspondence: Jing Liu, bGl1amluZzJAc2tsbWcuZWR1LmNu