 Shaocheng Sun
 Ying Yu2
- 1China Volleyball College, Beijing Sport University, Beijing, China
- 2Key Laboratory of Sport Training of General Administration of Sport of China, Beijing Sport University, Beijing, China
- 3Institute of Physical Education and Training, Capital University of Physical Education and Sports, Beijing, China
Purpose: To explore the post-activation performance enhancement (PAPE) of flywheel and traditional squats on a series of vertical jumps, the loads of the two protocols were matched based on their linear velocities. In addition, we attempted to validate the effectiveness of determining individualized recovery time (IRT) between conditioning activities and explosive movements.
Methods: Sixteen trained players participated in three main experiments: first, one-repetition maximum (1RM) assessment and intensity matching test; second, the weighted jump squat (WJS) test at baseline and at 2, 4, 6, 8, and 10 min after flywheel and traditional protocols; and third, squat jump (SJ), countermovement jump (CMJ), and approach jump (AJ) tests incorporating IRT determined in the WJS sessions into both protocols. These protocols were standardized to 8 repetitions at 80% 1RM with equivalent concentric speed matched by a linear position transducer and conducted in a random order on separate days.
Results: In the WJS tests, both protocols exhibited significant increases on jump height (JH), peak force (PF), and peak power (PP) after 2 to 6 min (all p < 0.05), and the time courses of changes in performance were in a similar trend. In the SJ, CMJ, and AJ tests, both protocols demonstrated highly significant increases on JH, PP, and reactive strength index (RSI) after incorporating IRT (all p < 0.01), with all participants exhibiting diverse improvement above the baseline levels. The potentiation percentages of the flywheel protocol on JH, PP, and RSI were higher than those of the traditional protocol across four jumping types (JH: 5.35%–9.79% vs. 4.13%–8.46%; PP: 4.16%–6.13% vs. 3.23%–4.77%; and RSI: 7.27% vs. 7.04%).
Conclusion: High-intensity flywheel squats can produce jumping potentiation in neuromechanical factors comparable to, or even surpassing, those observed in traditional squats, potentially making them a more effective option for inducing PAPE. Additionally, incorporating IRT into potentiation protocols could further optimize the PAPE effects.
1 Introduction
Post-activation performance enhancement (PAPE) is the phenomenon in which neuromuscular voluntary activities (VAs) are acutely enhanced by contractile history (conditioning activities, CAs). The mechanism of PAPE is related to physiological phosphorylation of myosin regulatory light chains, as well as increases in muscle temperature, muscle blood flow, neural drive, and muscle–tendon stiffness (Blazevich and Babault, 2019; Tillin and Bishop, 2009). PAPE becomes the premise of complex training and warm-up routines due to its significant effects on physical performance (Cuenca-Fernández et al., 2017; Robbins, 2005). Consensus is gradually emerging in some aspects of PAPE research, whereas others remain equivocal. The recommendations for the optimal rest interval between CAs and VAs showed variation from 3 to 12 min (Dobbs et al., 2019; Gouvêa et al., 2013). This discrepancy is likely attributed to participants’ intra-complex responses and the clustering of multiple effects within a single study. Higher strength level individual appears to express PAPE earlier than weaker individual (Seitz et al., 2014). If CA has sufficient intensity and relatively low volume, potentiation also may be realized earlier (Tillin and Bishop, 2009). However, Naclerio et al. (2015) examined the effects of three different volumes of CAs and revealed no significant correlation between the volume of CAs and the optimal recovery time. Such studies highlight the multifaceted and complex nature of PAPE, underscoring the need of individualized recovery time (IRT) to fully realized potential benefits of PAPE.
Vertical jump ability is crucial for success in many sports, and potentiation protocols for lower body have been frequently investigated (Dobbs et al., 2019; Suchomel et al., 2016). These protocols are designed to enhance subsequent performance in various vertical jumps, executed from a static start, countermovement action, approach, etc. However, CA generates a dual response in muscles, inducing both fatigue and PAPE (Sale, 2002). The dynamic balance between these two responses changes over recovery time, which is influenced by a series of external factors such as the intensity, volume, and motor pattern of CAs, as well as internal factors including the participant’s strength level, fiber-type distribution, and power–strength ratio (Seitz and Haff, 2016; Wilson et al., 2013). Therefore, identifying and optimizing these variables is essential for jumping potentiation.
Squat is one of the most popular and important exercises for the development of strength and vertical jump ability, and is considered an essential tool in strength and conditioning training programming. Considering the portability of devices, traditional squat might not be the preferred modality to induce PAPE. Flywheel training (FT), which provides inertial resistance and eccentric overload through spinning flywheels, has recently become increasingly popular due to its ease of use in a variety of sporting applications (Berg and Tesch, 1998; Petré et al., 2018). FT could produce greater force and muscle activation in eccentric than concentric activities through the kinetic energy stored in the flywheel (Norrbrand et al., 2010), and increase elastic energy storage in the muscle–tendon unit to amplify the potential of stretch-shortening cycle (SSC) (Komi, 1986). Nardone et al. (1989) observed the selective recruitment of high-threshold motor units during eccentric contractions. Similarly, Fang et al. (2001) found greater amplitude for the movement-related cortical potential during the eccentric phase relative to the concentric phase. It is reported that FT has been widely applied to inducing acute and chronic adaptions in numerous sports (Cuenca-Fernández et al., 2019; Tous-Fajardo et al., 2016). However, few studies compared FT to traditional exercise. This could be attributed to the difficulty in matching intensities between them, as FT uses inertial load instead of gravitational load. Nonetheless, velocity-based training (VBT) provides a means to match intensity based on speed, such as providing feedback on mean velocity during concentric and eccentric action, possibly bridging the gap in comparative research (Carroll et al., 2019; Weakley et al., 2021).
Given this context, the main purposes of this study were twofold. First, it aimed to investigate the PAPE effects of flywheel and traditional squats on vertical jump performance based on the same CA intensity and volume, with weighted jump squat (WJS) serving as the VA type. Second, it aimed to examine the effectiveness of IRT in optimizing PAPE by using the same CA and setting SJ, CMJ, and AJ as VA types. We hypothesized that flywheel squats would exhibit greater effects of jumping potentiation than traditional squats, and applying IRT to protocols would further improve the PAPE effects.
2 Methods
2.1 Participants
Sixteen elite male volleyball players from Beijing Sport University with at least 4 years of resistance training history (age: 22.3 [1.3] y; height: 188.4 [6.2] cm; body mass: 81.2 [8.1] kg) gave their written informed consent to participate in this study. Values are expressed as mean [SD]. All participants had at least 3 years of competition experience at the national level and were prominent members of the university’s elite team. The sample size was calculated using G*Power software (version 3.1). We selected the “F tests–ANOVA: repeated measures, within factors” for the statistical analysis. The a priori estimation of the minimum sample size was based on alpha, power, and effect size. Using an effect size of f = 0.3, an alpha level of 0.05, and a power of 0.8, with the number of measurements set to 6, the analysis indicated a required sample size of 14 participants. To account for potential attrition, we recruited two participants in addition. The research received approval from the Beijing Sport University Human Participants Review Board (no. 2023193H), ensuring adherence to the principles of the Declaration of Helsinki.
2.2 Design and procedures
A randomized and counterbalanced crossover design was used to compare the PAPE effects of flywheel squats and traditional squats on vertical jumps. Participants attended the laboratory on 13 separate days over a 5- to 6-week period, including 3 familiarization visits to achieve an acceptable level of technical proficiency, 1RM assessment and intensity matching test as preliminary experiments, 2 WJS sessions with the flywheel and traditional protocols, and 2 sessions for each SJ, CMJ, and AJ test with IRT implemented into both protocols (Figure 1). To minimize the sources of bias, participants were scheduled to attend the laboratory at the same time (±2 h) in each day of experiments, and they were instructed not to engage in any strenuous lower limb exercises in the preceding 48 h.
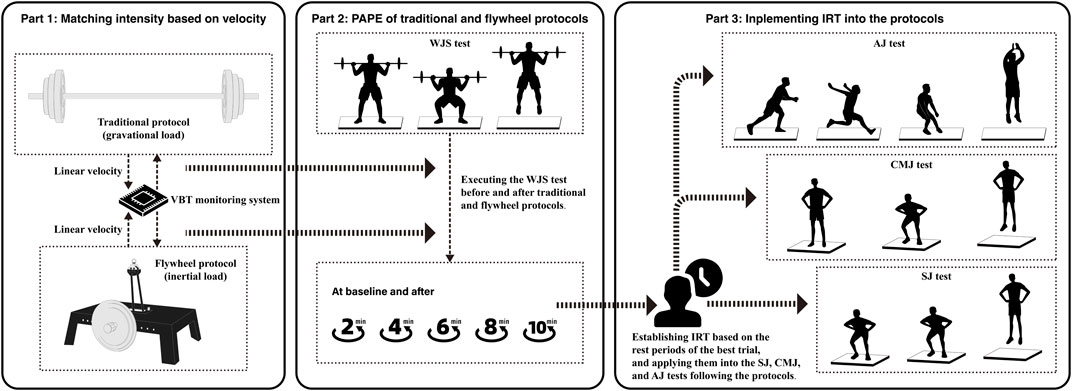
Figure 1. Experimental procedure diagram.
2.2.1 1RM assessment and intensity matching test
Once participants arrived at the laboratory, they executed a standardized warm-up procedure, including 6 min of pedaling on a cycle ergometer (Monark 828E cycle ergometer; Vansbro, Dalarna, Sweden) at 80 W and 60 revolutions per minute, 3 min of dynamic stretching, and 10 full-depth bodyweight squats. During the first session, participants commenced the 1RM assessment, comprising sets estimated at 60% 1RM (6 repetitions) and 80% 1RM (3 repetitions). Subsequently, five attempts were permitted to establish individual’s 1RM, and the barbell load was increased progressively from 5% to 10% until the 1RM was achieved (Haff and Triplett, 2015). Two minutes passive rest was allocated between all warm-up sets and 3 minutes between 1RM attempts. After the 1RM assessment, participants were given 5 min of rest. Then, they performed barbell squats with the maximal concentric effort using 80% 1RM (8 repetitions), and a linear position transducer (Tendo Unit, London, United Kingdom) was attached to the barbell, measuring the mean concentric linear velocity (MCLV)—average velocity during the propulsive phase of each lift. In the second session, after the standardized warm-up, participants performed flywheel squat (10 repetitions) on a flywheel device (Desmotec D.FULL, Biella, Italy), using four inertial loads in a randomized order (0.1176 kg·m2, 0.1568 kg·m2, 0.1960 kg·m2, and 0.2352 kg·m2), with 5 min passive recovery given between sets. A PVC pipe was placed on each participant’s shoulders, in a manner similar to that of barbell squats, and velocity data were collected using linear position transducer. In each set, the first two repetitions served solely to initiate the movement, and the MCLV was calculated from eight repetitions with the maximal concentric effort.
2.2.2 WJS sessions with IRT establishing
The intervals at which individuals reached their peak flight height were established as their IRT. Flywheel and traditional protocols were randomly arranged across two WJS sessions. Prior to the experimental trials, participants executed the standardized warm-up as previously described. Following a 5-min rest, participants executed the baseline test, consisting of two repetitions of WJS loaded with barbell weight at 15% 1RM and separated by 30 s. This approach was designed to provide sufficient load to stimulate the power output while ensuring that subsequent tests remain unaffected (Kirby et al., 2010; Zhang et al., 2023). During each repetition, participants squatted down to a self-selected depth and then immediately jumped as high as possible. The baseline value was determined by the average of repetitions. Kinetic data collection and analysis were conducted using a force plate (Kistler 9287, Winterthur, Switzerland) at a sampling frequency of 1000 Hz using BioWare software (Type 2182). After the baseline test, a 5-min rest was given, and then the participants performed either a barbell squat at 80% 1RM (8 repetitions) or flywheel squat (8 repetitions, excluding initial 2 repetitions) with the equivalent MCLV determined by individual’s load–velocity profile. The pins and seat were set to maintain the same squat depth at knee flexion of 100° across different protocols (Schoenfeld, 2010). Figures 2A,B demonstrate the experimental settings for both protocols. Visual feedback of MCLV and verbal encouragement were provided during each repetition to maintain the prescribed intensity. Following potentiation protocols, the post-test was performed in the same manner as the pre-test, repeated at intervals of 2, 4, 6, 8, and 10 min. The intervals at which individuals reached their peak flight height were established as their IRT.
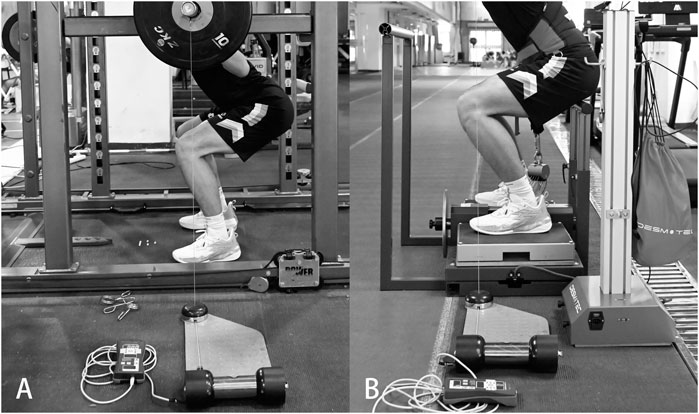
Figure 2. Experimental setups for the traditional protocol (A) and the flywheel protocol (B).
2.2.3 SJ, CMJ, and AJ sessions with IRT validating
Each session for SJ, CMJ, and AJ were similar to WJS session, maintaining consistent procedural structure in standardized warm-up, pre-test, both potentiation protocols, and post-test. However, there were altered variables in terms of jumping type and rest interval. Instead of fixed rest intervals, the IRT for each participant was utilized between potentiation protocols and jumping tests. In the SJ test, participants began in a position at 90° knee flexion and hands on the pelvic spine. From this static pose, they executed a rapid upward vertical jump as high as possible. In the CMJ test, participants started standing upright with hands on the pelvic spine and then quickly moved downward followed by an immediate upward vertical jump in a continuous motion. In the AJ test, participants took 2 to 3 steps forward, followed by a rapid upward vertical jump accompanied by a forceful arm swing. Participants were advised to execute AJ in a manner most proficient to them because of imposing further standardization in the jumping procedure could potentially hinder the fully experienced athletes’ performance.
2.2.4 Kinematic and kinetic parameters
The analysis of force–time data in jumping tests involved several neuromechanical parameters, such as jump height (JH), peak force (PF), peak power (PP), average rate of force development (ARFD), and reactive strength index (RSI). The JH for WJS, SJ, and CMJ was determined using the impulse–momentum method, identifying the movement onset as the threshold of 5 SD below bodyweight. The JH for AJ was determined using the flight time method, and the threshold was defined as 5 SD of flight force (when the force plate is unloaded) (McMahon et al., 2018). The PF was defined as the maximum force observed on the force–time curve during jumping. The PP was determined by multiplying force with velocity, where velocity was deduced by integrating the force–time trace. The ARFD was calculated as the mean tangential slope from the initial point to the peak force (RFD = ΔForce/ΔTime). The point for SJ and CMJ was set at 5 SD above bodyweight, and AJ was forced to reach 5 SD unloaded value. The RSI was calculated as the ratio of flight height to contact time. Typical errors expressed as intraclass correlation coefficients, standard errors of measurement, and coefficients of variation (CV) are reported for kinematic and kinetic variables (Table 1).
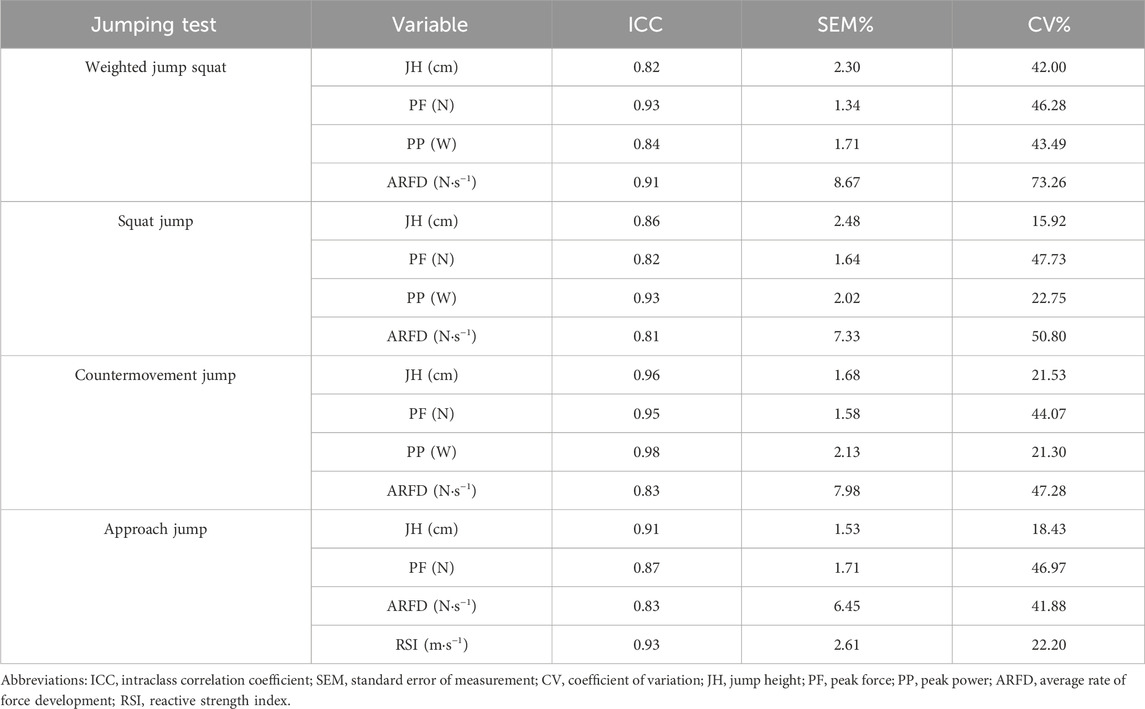
Table 1. Typical errors of jumping tests for kinematic and kinetic variables.
2.2.5 Statistical analysis
All statistical analyses were performed using SPSS v.27.0 (SPSS IBM, Chicago, IL, United States). The normality of distribution was tested using the Shapiro–Wilk test. A one-way within-subject analysis of variance (ANOVA) was employed for MCLV against the inertial load. Data variance was tested using Mauchly’s test of sphericity, and a Greenhouse–Geisser correction was applied when the assumption of sphericity was violated. A linear regression was performed using MCLV to predict the inertial load. A two-way repeated measures ANOVA was employed to compare the PAPE effects of protocols (traditional and flywheel squats) and time (baseline, 2, 4, 6, 8, and 10 min) on the performance of WJS. In cases where significant effects were observed in the ANOVAs, differences between conditions were identified using the Bonferroni post hoc pairwise comparisons. A paired-sample t-test was employed to compare differences in performance for SJ, CMJ, and AJ before and after implementing IRT into traditional and flywheel protocols. Cohen’s d effect sizes were assessed to determine meaningful differences, which are classified as trivial: <0.2, small: ≥0.2, medium: ≥0.5, and large: ≥0.8 (Cohen, 2013). The significance level was set at p < 0.05, and p < 0.01 was considered highly significant.
3 Results
The one-way ANOVA was highly significant for MCLV (p < 0.001). Post hoc analyses revealed significant differences in MCLV across all inertial loads (p ≤ 0.047; 1.02 ≤ d ≤ 3.71). Additionally, a statistically significant regression equation MCLV = −1.22 × IL + 0.87 was observed (F (3,45) = 42.321; p < 0.001) with R2 = 0.68 (Figure 3A). Based on individualizing linear regression models, each participant’s intensity was determined corresponding to the MCLV of the 80% 1RM traditional squat (Figure 3B).
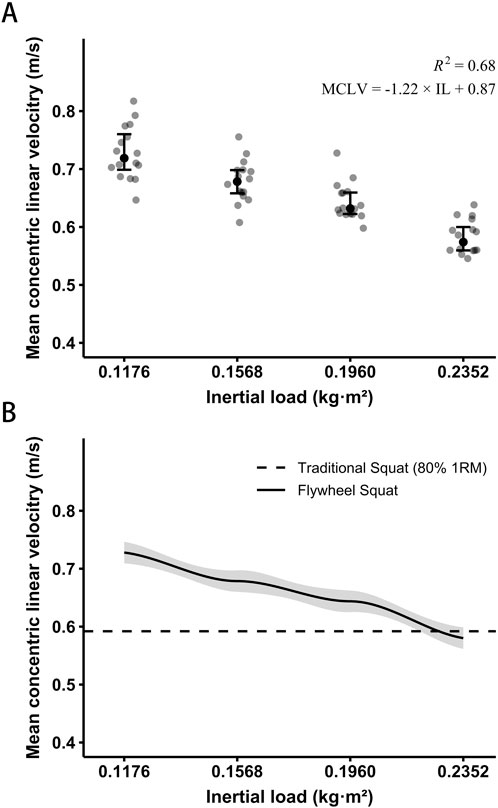
Figure 3. Mean concentric linear velocity (MCLV) of the flywheel squat at different inertial loads (IL) (A). Error bars represent the upper and lower quartiles. An individual example of matching intensity between the two protocols based on the MCLV of 80% 1RM traditional squat (B).
In the WJS tests, there were significant main effects of time on JH, PF, PP, and ARFD (3.127 ≤ F (5,75) ≤ 10.804; p ≤ 0.021; 0.l8 ≤ ηp2 ≤ 0.42). However, no significant main effects of protocols (F (1,15) ≤ 2.903; p ≥ 0.110; 0.01 ≤ ηp2 ≤ 0.16) or interactional effects of protocol × time (F (5,75) ≤ 1.405; p ≥ 0.243; 0.01 ≤ ηp2 ≤ 0.09) were found. Compared with the baselines, PAPE effects of both protocols were found on WJS (Table 2). After the flywheel protocol, significant improvements were observed in JH at 4 min (+9.13% [8.76%]; p = 0.003; d = 1.23) (Figure 4A), PF at 2 min (+3.84% [2.11%]; p < 0.001; d = 1.68) (Figure 4B), and PP at 4 min (+5.24% [5.46]; p = 0.027; d = 0.95) (Figure 4C). Following the traditional protocol, significant increases were observed in JH at 4 min (+6.59% [7.44%]; p = 0.034; d = 0.92) and 6 min (+6.05% [6.13%]; p = 0.020; d = 0.98) (Figure 4A), PF at 2 min (+3.08% [3.33%]; p = 0.040; d = 0.90) (Figure 4B), and PP at 4 min (+4.77% [4.89]; p = 0.032; d = 0.72) and 6 min (+3.84% [3.19]; p = 0.004; d = 0.92) (Figure 4C). Despite observing an upward trend in ARFD after following both protocols, the changes compared to the baselines were not statistically significant (p ≥ 0.278; −0.13 ≤ d ≤ 0.64) (Figure 4D).
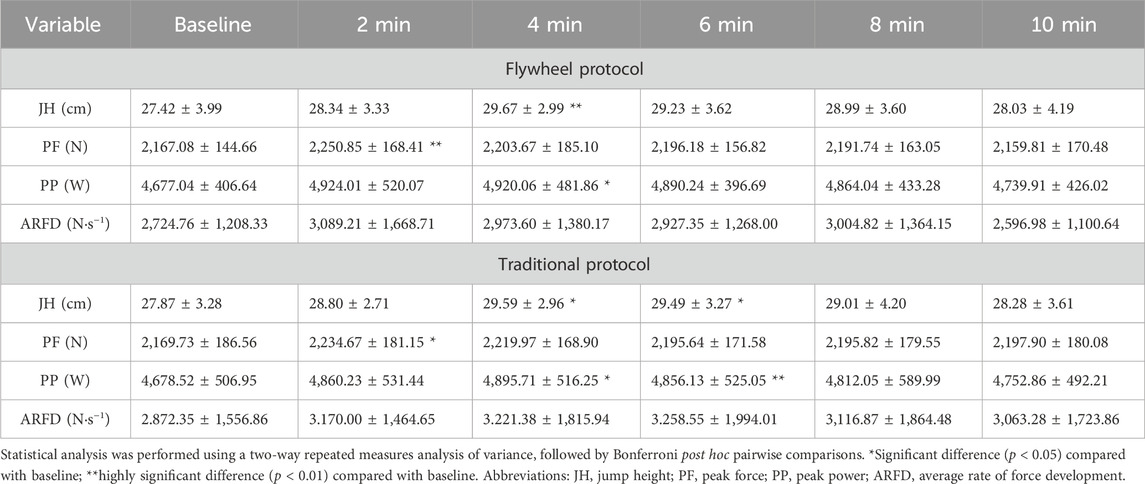
Table 2. Effects of post-activation performance enhancement on weighted jump squats after flywheel and traditional protocols (mean ± SD).

Figure 4. Percentage differences in the performance of weighted jump squats for jump height (A), peak force (B), peak power (C), and average rate of force development (RFD) (D) during continuous time course after both protocols. The error bars represent SE. *Significant difference (p < 0.05) and **highly significant difference (p < 0.01) compared with baseline within each protocol.
In the SJ, CMJ, and AJ tests, significant differences in JH, PP, and RSI were identified before and after implementing IRT into both protocols (Table 3), with all 16 participants exhibiting varying degrees of improvement above their baselines (Figures 5A–C). However, no significant differences were found between protocols (p ≥ 0.183). After the flywheel protocol, significant improvements were observed on JH in SJ, CMJ, and AJ (+9.79% [6.25%], +5.35% [5.07%], and +6.35% [4.61]; p < 0.001; 1.16 ≤ d ≤ 1.57), on PP in SJ and CMJ (+6.13% [5.16%] and +4.16% [3.60%]; p < 0.001; 1.17 ≤ d ≤ 1.23), and on RSI in AJ (+7.27% [6.22%]; p < 0.001; d = 1.19). Following the traditional protocol, significant increases were observed on JH in SJ, CMJ, and AJ (+8.46% [5.30%], +4.13% [1.91%], and +5.15% [2.68%]; p < 0.001; 1.67 ≤ d ≤ 2.26), on PP in SJ and CMJ (+4.40% [4.06%] and +3.23% [2.59%]; p ≤ 0.001; 1.10 ≤ d ≤ 1.27), and on RSI in AJ (+7.04% [6.71%]; p = 0.001; d = 1.07). No significant differences were found in PF and ARFD for both protocols when compared with baseline (p ≥ 0.08; 0.07 ≤ d ≤ 0.47).
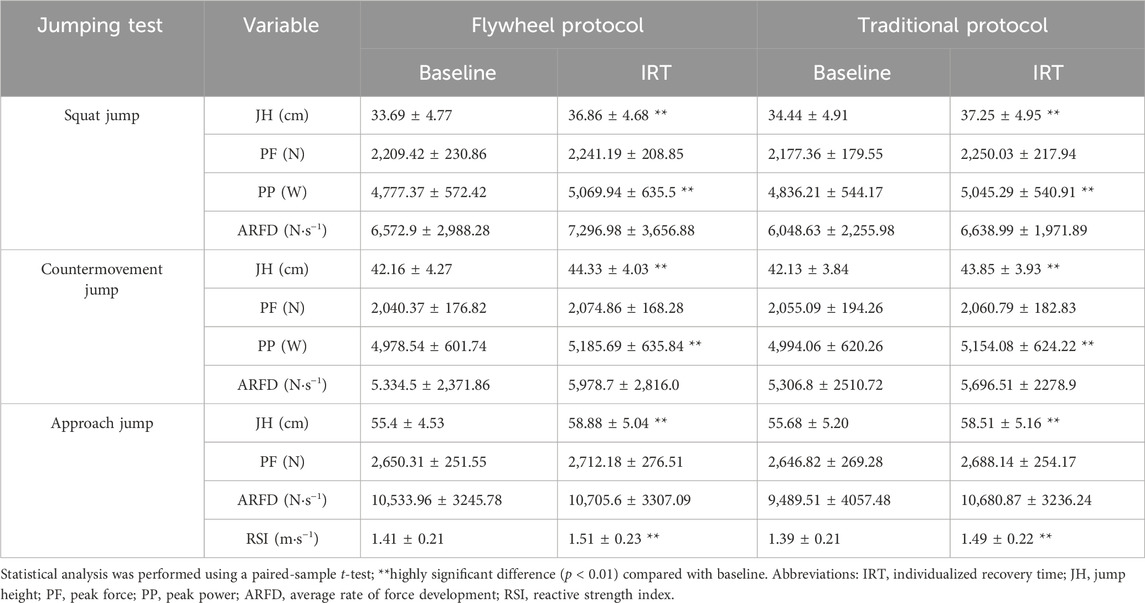
Table 3. Effects of post-activation performance enhancement on jumping tests after implementing individualized recovery time into flywheel and traditional protocols (mean ± SD).
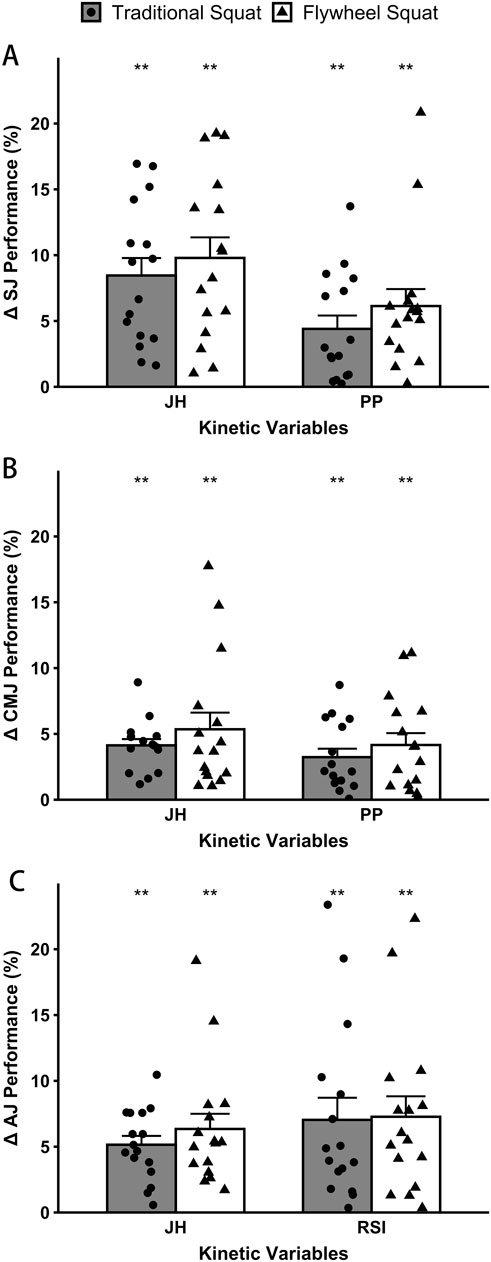
Figure 5. Percentage differences in the performance of squat jump (A), countermovement jump (B), and approach jump (C) for jump height (JH), peak power (PP), and reactive strength index (RSI) after implementing the individualized recovery time into both protocols. The error bars represent SE. **Highly significant difference (p < 0.01) compared with baseline within each protocol.
4 Discussion
We investigated the effects of PAPE elicited by flywheel and traditional squats through WJS tests at baseline and at intervals of 2, 4, 6, 8, and 10 min. We also validated the effectiveness of implementing IRT into both protocols through SJ, CMJ, and AJ tests. Our findings indicated that both flywheel and traditional squats with high intensity can produce jumping potentiation, and the time courses were in a similar trend. For JH, PP, and RSI in WJS, SJ, CMJ, and AJ, the enhancement extent of the flywheel protocol was greater than that of the traditional protocol. After incorporating IRT, both protocols resulted in optimizing PAPE, with all participants making improvements of varying degrees.
4.1 Matching intensity by mean concentric linear velocity
Given the inherent reliance of flywheel training on concentric output, matching intensity with traditional training based on load alone could become problematic. Our findings revealed a significant reduction in MCLV as the inertial load increased (all p < 0.05). Additionally, a linear regression equation between MCLV and inertial load was statistically significant (p < 0.01) and strong, R2 = 0.68 (equation: MCLV = −1.22 × IL + 0.87). To the best of our knowledge, the current study is the first to use VBT in analyzing each participant’s load–velocity profile to match the intensity of two potentiation protocols. This is in agreement with previous research supporting MCLV as an intensity prescription in FT. Carroll et al. (2019) found that the peak force, net impulse, and vastus lateralis muscle activation increased with the progressive inertial load and regressive mean concentric velocity. Similarly, Martín-Rivera et al. (2022) found that the RPE response, following a similar trend of increase, was significantly correlated with changes in inertial load and MCLV. In addition, some research workers proposed using peak concentric velocity as an intensity marker (McErlain-Naylor and Beato, 2021). However, it has shown less reliability across different devices. In contrast, the relationship between load and velocity is more linear when using mean velocity, and the between-subject variability in velocity attained during 1RM attempts may be lower (Weakley et al., 2021). Furthermore, the selection of the number of loads can also impact the validity and reliability of force–velocity outcomes in the flywheel squat. The study by Spudić et al. (2020) highlighted that employing four loads can reduce bias to 5% relative to the standard force–velocity slope. Additionally, future research is needed to adjust participants’ relative intensity in a dynamic training state.
4.2 Post-activation performance enhancement of flywheel and traditional squats
We utilized flywheel and traditional squats (8 repetitions) at 80% 1RM as potentiation protocols. In sessions involving WJS, SJ, CMJ, and AJ, significant increases were observed in JH, PF, PP, and RSI (p < 0.05; 0.90 ≤ d ≤ 2.26). The results indicated that both flywheel and traditional squats could induce a PAPE on vertical jumps with a large effect size, and flywheel squat potentially offered more benefits in specific neuromechanical metrics (JH: 5.35%–9.79% vs. 4.13%–8.46%; PP: 4.16%–6.13% vs. 3.23%–4.77%; RSI: 7.27% vs. 7.04%). In keeping with previous studies, a worthwhile increase in the vertical jump can be achieved by following a biomechanically similar squat when using an intensity ≥80% 1RM (Robbins, 2005; Suchomel et al., 2016). Given the extensive knowledge of traditional exercise on PAPE, comparing FT to such exercises could further highlight flywheel’s effectiveness in inducing PAPE. However, the correlation between the effects of PAPE and changes in physiological indicators (e.g., muscle temperature, muscle water content, and muscle–tendon mechanical properties) have not been clearly defined (Blazevich and Babault, 2019; Krzysztofik et al., 2023a). It is believed that the benefits of FT stem from the unique response of eccentric resistance training, including a greater capacity and a lower metabolic cost per unit at the same intensities as concentric action. This energetic advantage may optimize the balance between PAPE and fatigue, making it easier for PAPE to be dominant. A further advantage of FT as conditioning activities is the consistent greater eccentric force, power, and derivative outputs produced, potentially leading to more transfer effects on rapid, mixed eccentric/concentric movements (Beato et al., 2020). Moreover, the point of force application in traditional squats is the trapezius muscle and that of a flywheel squat is the lower back muscle. This implies that traditional squats would activate upper body muscles more, which may lead to unfavorable outcomes of lower body enhancement. Therefore, there is a need to use more specific and localized exercises to produce PAPE (Kolinger et al., 2024).
Similar to the role of gravitational load in traditional protocols, the size of the inertial load can influence the magnitude of the PAPE effect induced by flywheel protocols. Fu et al. (2023) demonstrated this by using three different inertial loads as CAs. Their findings showed that larger inertial loads can significantly improve acute lower limb explosive performance, particularly in CMJ test. However, it should be noted that due to the properties of flywheel devices, eccentric mechanical stress does not necessarily correlate with inertial load or MCLV, and small inertial loads can also produce significant activation effects. In contrast, using gravitational exercises to induce PAPE typically requires near-maximal loads (Seitz and Haff, 2016). Timon et al. (2019) found that performing high-power flywheel squats with relatively light loads could produce significant acute enhancement on SJ performance, whereas traditional squats did not. Thus, the flywheel squat might be particularly effective in inducing PAPE at lighter loads, offering advantages for load-compromised individuals and other special populations. This also emphasizes the versatility of implementing eccentric training. According to the research of Burgos-Jara et al. (2023), eccentric training methods can be flexibly adjusted based on training objectives (e.g., energy attenuation for protection and energy storage for potentiation), differing in movement complexity, intensity, volume, technology, and time under tension. It would be worth to explore other flywheel protocol modalities to induce PAPE, including variations in intensity, volume, and movement type (e.g., horizontal plane).
We observed no significant interactional effects between the protocol and time variables, with recovery curves after both protocols displaying a similar inverted U-shaped pattern, peaking between 2 and 6 min. According to the theoretical model of the interaction between fatigue and potentiation (Tillin and Bishop, 2009; Sale, 2002), this may be attributed to the similar trends of the two protocols on the generation of PAPE and the dissipation of fatigue. Our findings were basically identical with the research by Dobbs et al. (2019), suggesting that potentiation for trained individuals is optimal with a dynamic movement at 80% 1RM, followed by a 3- to 7-min rest period; the slight difference in the optimal window of PAPE response could be attributed to the unique physiological adaptations of our participants, who are well-trained volleyball players accustomed to quickly recovering from intense exercises. Moreover, due to the specialization of the field position in team sport athletes, the differences in specialized training experience also could lead to variations in the PAPE response. Consequently, sports with specific metabolic requirements and athletes from diverse training backgrounds often exhibit varying optimal recovery periods for PAPE (Kilduff et al., 2007; Seitz et al., 2014).
4.3 Individualizing recovery time for optimizing post-activation performance enhancement
The WSJ results showed that the peak performance enhancement on JH and PP showed a large effect size and statistical significance (0.92 ≤ d ≤ 1.23; p < 0.05; 42.00 ≤ CV% ≤ 43.49) after implementing both traditional and flywheel protocols. We observed highly significant improvements in JH, PP, and RSI using IRT in the protocols, with every participant showing varying degrees of improvement from their baseline levels. The JH and PP enhancement in SJ, CMJ, and AJ sessions showed a larger effect size, higher statistical significance, and a lower coefficient of variation (1.10 ≤ d ≤ 2.26; p < 0.01; 15.92 ≤ CV% ≤ 22.75). Our findings are in agreement with those of the previous study that recommends customizing the intra-complex recovery time for competitive athletes, likely through the trial and error method, with rest intervals from 2 to 10–12 min (Gołaś et al., 2016). Many research workers have attempted to establish theoretical frameworks that offer guidelines for manipulating factors to optimize PAPE (Dobbs et al., 2019; Gouvêa et al., 2013; Suchomel et al., 2016), yet practical applications show considerable variations in individual responses. In our study, we identified each participant’s IRT based on the rest periods of the best trials during WJS sessions and subsequently applied this IRT to SJ, CMJ, and AJ sessions. These results suggest that implementing a uniform recovery time can significantly potentiate jumping performance, reduce inter-individual variability in responses, and enhance the activation effects more substantially.
Additionally, the observed variations in the effects of IRT highlight the necessity of incorporating more customized factors. We also observed differences among participants in the force–velocity curve, indicating a requirement for targeted attention within the force–velocity spectrum (e.g., maximum strength, speed-strength, and speed) to elicit further enhancements in jumping performance (Brady et al., 2017). According to the research conducted by Krzysztofik et al. (2023b), applying plyometric CAs instead of high-loaded CAs contributes to achieving more PAPE-positive responders in athletes with low lower-muscle strength. Therefore, due to the high intra-individual and inter-individual variability of the recovery processes, optimizing performance effectively necessitates a systematic and comprehensive approach to monitor PAPE–fatigue continuum and customize training and recovery strategies.
4.4 Limitations and future perspectives
This study is not without limitations. First, we enrolled well-trained male volleyball players with a minimum of 4 years of resistance training experience. Therefore, caution should be exercised when generalizing these results to other populations and conditions. Additionally, our participants attended the laboratory over a 5- to 6-week period, during which neuromuscular adaptations could occur, potentially introducing biases or errors in the results. In addition, the ideal intensity based on velocity should be dynamically adjusted to account for fluctuations in the participants’ conditions. Lastly, future studies should include a more detailed examination of the effects of individual variability and their impact on the observed PAPE effect, especially considering that the characteristics of force–velocity profiles may imply potential improvements.
5 Conclusion
This study was the first to apply the concept of VBT to compare flywheel and traditional protocols at matching intensity. We discovered that both flywheel and traditional squats performed at high intensity could enhance acute jumping performance and displayed comparable recovery patterns. However, the flywheel squats demonstrated greater enhancement in specific neuromechanical parameters (such as JH, PP, and RSI), making them a more practical option for inducing PAPE. Meanwhile, applying IRT into potentiation protocols could further optimize the effects of PAPE, which may contribute to the development of customized training programs. Practitioners may consider dynamically monitoring athletes’ responses with VBT devices and customizing PAPE recovery time individually to optimize jumping potentiation.
Data availability statement
The raw data supporting the conclusions of this article will be made available by the authors, without undue reservation.
Ethics statement
The studies involving humans were approved by the Sports Science Experiment Ethics Committee of Beijing Sport University. The studies were conducted in accordance with the local legislation and institutional requirements. The participants provided their written informed consent to participate in this study.
Author contributions
SS: conceptualization, data curation, formal analysis, investigation, methodology, project administration, resources, software, supervision, validation, visualization, writing–original draft, and writing–review and editing. YY: formal analysis, methodology, resources, software, validation, writing–original draft, and writing–review and editing. YN: data curation, formal analysis, investigation, methodology, software, and writing–original draft. MR: formal analysis, methodology, software, visualization, and writing–review and editing. JW: methodology, resources, supervision, validation, and writing–review and editing. MZ: conceptualization, funding acquisition, investigation, project administration, resources, supervision, and writing–review and editing.
Funding
The author(s) declare that no financial support was received for the research, authorship, and/or publication of this article.
Acknowledgments
The authors gratefully acknowledge the allocation of equipment resources by the China Institute of Sport and Health Science, Beijing Sport University and the Sport Science School, Beijing Sport University in support of this study.
Conflict of interest
The authors declare that the research was conducted in the absence of any commercial or financial relationships that could be construed as a potential conflict of interest.
Publisher’s note
All claims expressed in this article are solely those of the authors and do not necessarily represent those of their affiliated organizations, or those of the publisher, the editors, and the reviewers. Any product that may be evaluated in this article, or claim that may be made by its manufacturer, is not guaranteed or endorsed by the publisher.
References
Beato M., McErlain-Naylor S. A., Halperin I., Dello I. A. (2020). Current evidence and practical applications of flywheel eccentric overload exercises as postactivation potentiation protocols: a brief review. Int. J. Sports Physiol. Perform. 15, 154–161. doi:10.1123/ijspp.2019-0476
Berg H. E., Tesch P. A. (1998). Force and power characteristics of a resistive exercise device for use in space. Acta. Astronaut. 42, 219–230. doi:10.1016/s0094-5765(98)00119-2
Blazevich A. J., Babault N. (2019). Post-activation potentiation versus post-activation performance enhancement in humans: historical perspective, underlying mechanisms, and current issues. Front. Physiol. 10, 1359. doi:10.3389/fphys.2019.01359
Brady C., Comyns T., Harrison A., Warrington G. (2017). Focus of attention for diagnostic testing of the force-velocity curve. Strength and Cond. J. 39, 57–70. doi:10.1519/SSC.0000000000000271
Burgos-Jara C., Cerda-Kohler H., Aedo-Muñoz E., Miarka B. (2023). Eccentric resistance training: a methodological proposal of eccentric muscle exercise classification based on exercise complexity, Training Objectives, Methods, and Intensity. Appl. Sci. 13 (13), 7969. doi:10.3390/app13137969
Carroll K. M., Wagle J. P., Sato K., Taber C. B., Yoshida N., Bingham G. E., et al. (2019). Characterising overload in inertial flywheel devices for use in exercise training. Sports Biomech. 18, 390–401. doi:10.1080/14763141.2018.1433715
Cuenca-Fernández F., López-Contreras G., Mourão L., de Jesus K., de Jesus K., Zacca R., et al. (2019). Eccentric flywheel post-activation potentiation influences swimming start performance kinetics. J. Sports Sci. 37, 443–451. doi:10.1080/02640414.2018.1505183
Cuenca-Fernández F., Smith I. C., Jordan M. J., MacIntosh B. R., López-Contreras G., Arellano R., et al. (2017). Nonlocalized postactivation performance enhancement (PAPE) effects in trained athletes: a pilot study. Appl. Physiol. Nutr. Metab. 42, 1122–1125. doi:10.1139/apnm-2017-0217
Dobbs W. C., Tolusso D. V., Fedewa M. V., Esco M. R. (2019). Effect of postactivation potentiation on explosive vertical jump: a systematic review and meta-analysis. J. Strength Cond. Res. 33, 2009–2018. doi:10.1519/JSC.0000000000002750
Fang Y., Siemionow V., Sahgal V., Xiong F., Yue G. H. (2001). Greater movement-related cortical potential during human eccentric versus concentric muscle contractions. J. Neurophysiol. 86, 1764–1772. doi:10.1152/jn.2001.86.4.1764
Fu K., Chen L., Poon E. T. C., Wang R., Li Q., Liu H., et al. (2023). Post-activation performance enhancement of flywheel training on lower limb explosive power performance. Front. Physiol. 14, 1217045. doi:10.3389/fphys.2023.1217045
Gołaś A., Maszczyk A., Zajac A., Mikołajec K., Stastny P. (2016). Optimizing post activation potentiation for explosive activities in competitive sports. J. Hum. Kinet. 52, 95–106. doi:10.1515/hukin-2015-0197
Gouvêa A. L., Fernandes I. A., César E. P., Silva W. A., Gomes P. S. (2013). The effects of rest intervals on jumping performance: a meta-analysis on post-activation potentiation studies. J. Sports Sci. 31, 459–467. doi:10.1080/02640414.2012.738924
Haff G. G., Triplett N. T. (2015). Essentials of strength training and conditioning. 4th edition (Champaign: Human kinetics).
Kilduff L. P., Bevan H. R., Kingsley M. I., Owen N. J., Bennett M. A., Bunce P. J., et al. (2007). Postactivation potentiation in professional rugby players: optimal recovery. J. Strength Cond. Res 21, 1134–1138. doi:10.1519/R-20996.1
Kirby T. J., Erickson T., McBride J. M. (2010). Model for progression of strength, power, and speed training. Strength and Cond. J. 32 (5), 86–90. doi:10.1519/SSC.0b013e3181f3ee5d
Kolinger D., Stastny P., Pisz A., Krzysztofik M., Wilk M., Tsoukos A., et al. (2024). High-intensity conditioning activity causes localized postactivation performance enhancement and nonlocalized performance reduction. J. Strength Cond. Res. 38, e1–e7. doi:10.1519/JSC.0000000000004590
Komi P. V. (1986). Training of muscle strength and power: interaction of neuromotoric, hypertrophic, and mechanical factors. Int. J. Sports Med. 7 (Suppl. 1), 10–15. doi:10.1055/s-2008-1025796
Krzysztofik M., Spieszny M., Trybulski R., Wilk M., Pisz A., Kolinger D., et al. (2023a). Acute effects of isometric conditioning activity on the viscoelastic properties of muscles and sprint and jumping performance in handball players. J. Strength Cond. Res. 37, 1486–1494. doi:10.1519/JSC.0000000000004404
Krzysztofik M., Wilk M., Pisz A., Kolinger D., Bichowska M., Zajac A., et al. (2023b). Acute effects of high-load vs. Plyometric conditioning activity on jumping performance and the muscle-tendon mechanical properties. J. Strength Cond. Res. 37, 1397–1403. doi:10.1519/JSC.0000000000004398
Martín-Rivera F., Beato M., Alepuz-Moner V., Maroto-Izquierdo S. (2022). Use of concentric linear velocity to monitor flywheel exercise load. Front. Physiol. 13, 961572. doi:10.3389/fphys.2022.961572
McErlain-Naylor S. A., Beato M. (2021). Concentric and eccentric inertia-velocity and inertia-power relationships in the flywheel squat. J. Sports Sci. 39, 1136–1143. doi:10.1080/02640414.2020.1860472
Mcmahon J. J., Suchomel T. J., Lake J. P., Comfort P. (2018). Understanding the key phases of the countermovement jump force-time curve. Strength and Cond. J. 40, 96–106. doi:10.1519/SSC.0000000000000375
Naclerio F., Chapman M., Larumbe-Zabala E., Massey B., Neil A., Triplett T. N. (2015). Effects of three different conditioning activity volumes on the optimal recovery time for potentiation in college athletes. J. Strength Cond. Res. 29, 2579–2585. doi:10.1519/JSC.0000000000000915
Nardone A., Romanò C., Schieppati M. (1989). Selective recruitment of high-threshold human motor units during voluntary isotonic lengthening of active muscles. J. Physiol. 409, 451–471. doi:10.1113/jphysiol.1989.sp017507
Norrbrand L., Pozzo M., Tesch P. A. (2010). Flywheel resistance training calls for greater eccentric muscle activation than weight training. Eur. J. Appl. Physiol. 110, 997–1005. doi:10.1007/s00421-010-1575-7
Petré H., Wernstål F., Mattsson C. M. (2018). Effects of flywheel training on strength-related variables: a meta-analysis. Sports Med. Open 4, 55. doi:10.1186/s40798-018-0169-5
Robbins D. W. (2005). Postactivation potentiation and its practical applicability: a brief review. J. Strength Cond. Res. 19, 453–458. doi:10.1519/R-14653.1
Sale D. G. (2002). Postactivation potentiation: role in human performance. Exerc. Sport Sci. Rev. 30, 138–143. doi:10.1097/00003677-200207000-00008
Schoenfeld B. J. (2010). Squatting kinematics and kinetics and their application to exercise performance. J. Strength Cond. Res. 24, 3497–3506. doi:10.1519/JSC.0b013e3181bac2d7
Seitz L. B., de Villarreal E. S., Haff G. G. (2014). The temporal profile of postactivation potentiation is related to strength level. J. Strength Cond. Res. 28, 706–715. doi:10.1519/JSC.0b013e3182a73ea3
Seitz L. B., Haff G. G. (2016). Factors modulating post-activation potentiation of jump, sprint, throw, and upper-body ballistic performances: a systematic review with meta-analysis. Sports Med. 46, 231–240. doi:10.1007/s40279-015-0415-7
Spudić D., Smajla D., Šarabon N. (2020). Validity and reliability of force-velocity outcome parameters in flywheel squats. J. Biomech. 107, 109824. doi:10.1016/j.jbiomech.2020.109824
Suchomel T. J., Lamont H. S., Moir G. L. (2016). Understanding vertical jump potentiation: a deterministic model. Sports Med. 46, 809–828. doi:10.1007/s40279-015-0466-9
Tillin N. A., Bishop D. (2009). Factors modulating post-activation potentiation and its effect on performance of subsequent explosive activities. Sports Med. 39, 147–166. doi:10.2165/00007256-200939020-00004
Timon R., Allemano S., Camacho-Cardeñosa M., Camacho-Cardeñosa A., Martinez-Guardado I., Olcina G. (2019). Post-activation potentiation on squat jump following two different protocols: traditional vs. Inertial flywheel. J. Hum. Kinet. 69, 271–281. doi:10.2478/hukin-2019-0017
Tous-Fajardo J., Gonzalo-Skok O., Arjol-Serrano J. L., Tesch P. (2016). Enhancing change-of-direction speed in soccer players by functional inertial eccentric overload and vibration training. Int. J. Sports Physiol. Perform. 11, 66–73. doi:10.1123/ijspp.2015-0010
Weakley J., Mann B., Banyard H., McLaren S., Scott T., Garcia-Ramos A. (2021). Velocity-based training: from theory to application. Strength and Cond. J. 43, 31–49. doi:10.1519/SSC.0000000000000560
Wilson J. M., Duncan N. M., Marin P. J., Brown L. E., Loenneke J. P., Wilson S. M., et al. (2013). Meta-analysis of postactivation potentiation and power: effects of conditioning activity, volume, gender, rest periods, and training status. J. Strength Cond. Res 27, 854–859. doi:10.1519/JSC.0b013e31825c2bdb
Keywords: flywheel training, eccentric overload, warm-up, load-velocity profile, velocity-based training, sports fatigue, jumping potentiation
Citation: Sun S, Yu Y, Niu Y, Ren M, Wang J and Zhang M (2024) Post-activation performance enhancement of flywheel and traditional squats on vertical jump under individualized recovery time. Front. Physiol. 15:1443899. doi: 10.3389/fphys.2024.1443899
Received: 04 June 2024; Accepted: 21 August 2024;
Published: 06 September 2024.
Edited by:
Shi Zhou, Southern Cross University, AustraliaReviewed by:
Jan Mieszkowski, Gdansk University of Physical Education and Sport, PolandHugo Cerda-Kohler, MEDS Clinic, Chile
Copyright © 2024 Sun, Yu, Niu, Ren, Wang and Zhang. This is an open-access article distributed under the terms of the Creative Commons Attribution License (CC BY). The use, distribution or reproduction in other forums is permitted, provided the original author(s) and the copyright owner(s) are credited and that the original publication in this journal is cited, in accordance with accepted academic practice. No use, distribution or reproduction is permitted which does not comply with these terms.
*Correspondence: Ming Zhang, MjE0N0Bic3UuZWR1LmNu