 Richard H. Clayton
 S. Sridhar
- Insigneo Institute for in-silico Medicine and Department of Computer Science, University of Sheffield, Sheffield, United Kingdom
Introduction: Fibrotic scar in the heart is known to act as a substrate for arrhythmias. Regions of fibrotic scar are associated with slowed or blocked conduction of the action potential, but the detailed mechanisms of arrhythmia formation are not well characterised and this can limit the effective diagnosis and treatment of scar in patients. The aim of this computational study was to evaluate different representations of fibrotic scar in models of 2D 10
Methods: Cellular electrophysiology was represented by the Ten Tusscher 2006 model for human ventricular cells. Fibrotic scar was represented as a spatially varying diffusion, with different models of the boundary between normal and fibrotic tissue. Dispersion of activation time and action potential duration (APD) dispersion was assessed in each sample by pacing at an S1 cycle length of 400 ms followed by a premature S2 beat with a coupling interval of 323 ms. Vulnerability to reentry was assessed with an aggressive pacing protocol. In all models, simulated fibrosis acted to delay activation, to increase the dispersion of APD, and to generate re-entry.
Results: A higher incidence of re-entry was observed in models with simulated fibrotic scar at shorter length scale, but the type of model used to represent fibrotic scar had a much bigger influence on the incidence of reentry.
Discussion: This study shows that in computational models of fibrotic scar the effects that lead to either block or propagation of the action potential are strongly influenced by the way that fibrotic scar is represented in the model, and so the results of computational studies involving fibrotic scar should be interpreted carefully.
1 Introduction
The heart is an electromechanical pump, where mechanical contraction is both initiated and synchronised by a propagating wave of electrical activation, the action potential. Action potentials originate in the heart’s natural pacemaker and propagate through the myocardium because cardiac myocytes are both electrically excitable and coupled through gap junctions. Abnormal slowing or block of action potential propagation can result in a cardiac arrhythmia. Arrhythmias sustained by re-entry, where an action potential continually propagates into recovering tissue, can be lethal if untreated (de Jong et al., 2011; Ciaccio et al., 2022).
Myocardial ischaemia and infarction are well known as an important substrate for initiating and sustaining re-entrant arrhythmias in the ventricles (Janse and Wit, 1989; Nguyen et al., 2014). A small surviving isthmus of electrically excitable tissue within the infarct region or border zone between infarct and normal myocardium can act as a re-entrant circuit (Anter et al., 2016; Pashakhanloo et al., 2018), and is a target for ablation to treat ventricular tachycardia (VT) in the human heart. Some simulation studies have shown that the structural heterogeneity of the infarct and border zone alone are sufficient to sustain re-entry when it is initiated by rapid pacing (Ten Tusscher and Panfilov, 2007; Engelman et al., 2010; Rutherford et al., 2012), while others have shown that functional remodelling may also play a role (Zahid et al., 2016; Costa et al., 2018). It is difficult to study properties of scar in-vivo (Anter et al., 2016), and studies of cultured tissue and cells may not be representative of the in-vivo setting (Nguyen et al., 2014). Computational models of infarct scar structure and function therefore have a role to play in identifying and understanding physiologically plausible mechanisms.
The task of modelling the structure of infarct and border zone is however challenging, and there is no consensus on the best way to represent the complex mixture of myocytes, fibroblasts, and collagen that compose the fibrotic scar (Calcagno et al., 2022; Simon-Chica et al., 2023). Several different approaches for modelling the structure of scar in cardiac tissue have been taken. A relatively straightforward approach to represent fibrotic scar is to designate randomly selected points within a finite difference grid as uncoupled and inexcitable, and this type of model reconstructs propagation slowing, block, and re-entry (Ten Tusscher and Panfilov, 2007; Alonso and Bär, 2013). Random removal of finite elements in models of atrial fibrosis (Roney et al., 2016), and representation of fibrotic clefts in models of diffuse ventricular fibrosis by setting some element edges to be electrically insulating (Mendonca Costa et al., 2014; Balaban et al., 2018), have also been effective in reconstructing re-entry mechanisms. More exotic approaches have used statistical models to represent different patterns and texture of tissue fibrosis (Clayton, 2018; Jakes et al., 2019; Nezlobinsky et al., 2021).
The functional effect of fibrotic scar on action potential conduction velocity and action potential duration (Amoni et al., 2023) is difficult to tease out from electrotonic effects within the altered structure (Connolly and Bishop, 2016). The electrophysiological behaviour of fibroblasts within tissue is not well understood (Simon-Chica et al., 2023), but approaches including explicit representation of the fibroblast domain using a model of fibroblast cellular electrophysiology (Sachse et al., 2009) and homogenisation of the myocyte/fibroblast mixture (Lawson et al., 2020; 2023) show promise.
The overall aims of the present study were therefore to:
• Construct a set of plausible structural models of infarct scar and border zone, with different texture and spatial scale to reflect both focal and diffuse fibrotic scar.
• Compare activation, recovery, and vulnerability to re-entry in different functional models of coupling between fibrotic scar and normal tissue.
2 Methods
Our starting point was to develop structural models of fibrotic scar representing a focal infarct surrounded by a border zone. We sought a plausible way to represent tissue with a central inexcitable region, with surrounding regions having a patchy border zone with focal and diffuse fibrosis. Evidence from tissue culture (Gaudesius et al., 2003) and experimental preparations (Ghouri et al., 2018) supports the idea of conduction slowing in regions of border zone and scar. However the distribution of scar regions within the border zone tends to be variable and irregular (Pashakhanloo et al., 2018; Amoni et al., 2023). We therefore based our approach on previous studies where spatial changes in the diffusion coefficient with different length scale are used to represent varying proportions of fibroblasts and myocytes (Jacquemet and Henriquez, 2008; Clayton, 2018).
Re-entry in ventricular myocardium is often sustained by retrograde conduction through a narrow isthmus of surviving tissue surrounded by regions of scar (Ciaccio et al., 2022). Ventricular myocardium is 3-dimensional, with a fibre-sheet structure that results in orthotropic propagation of the action potential (Clayton et al., 2011; Rutherford et al., 2012). In the present study we simplified this complex structure to a 2-dimensional (2D) tissue sheet. This approach enabled us to focus on different models of scar in a large number of samples and simulations, without the confounding effects of anisotropy, the more complex analysis of simulation output, and the additional computational burden of 3D simulations (Balaban et al., 2020).
2.1 Model of cell and tissue electrophysiology
Our model of a 2D ventricular tissue sheet had dimensions
The monodomain equation has a diffusion term to represent the spread of excitation and recovery, and a reaction term that represents local excitation and recovery Eq. 1. At a single location in 2D, the rate of change of transmembrane voltage is given by
where
2.2 Model implementation and numerical methods
The cell and tissue electrophysiology model was implemented using our own finite difference code, which has been benchmarked against other codes (Niederer et al., 2011) (https://github.com/RichardClayton/VentricularFibrosis). This code solves the monodomain equation using explicit finite differences, with Rush Larsen approximation for the cellular electrophysiology model ODEs (Rush and Larsen, 1978), a space step of
2.3 Structural representation of infarct and border zone
To produce a model of border zone and scar we used a Gaussian random field (GRF) to modulate tissue diffusion (Kroese and Botev, 2015). GRFs have a characteristic length scale, and are specified by a mean and a variance. A GRF can be sampled repeatedly to obtain a set of smoothly changing fields, each with an identical length scale, mean, and variance, but with a randomly generated pattern. In this study, we used different length scales to produce different textures to broadly represent diffuse and patchy fibrosis. We generated GRFs using circulant embedding with a squared exponential covariance function and a specified length scale (Kroese and Botev, 2015). Each GRF was then sampled to produce smoothly varying fields with fluctuations at specified length scales in a 2D tissue sheet as in a previous study (Clayton, 2018). The algorithm we used to generate GRFs was based on Matlab code provided on pages 376-377 of (Kroese and Botev, 2015), and is provided in the Supplementary Material.
We sampled GRFs at length scales of
where
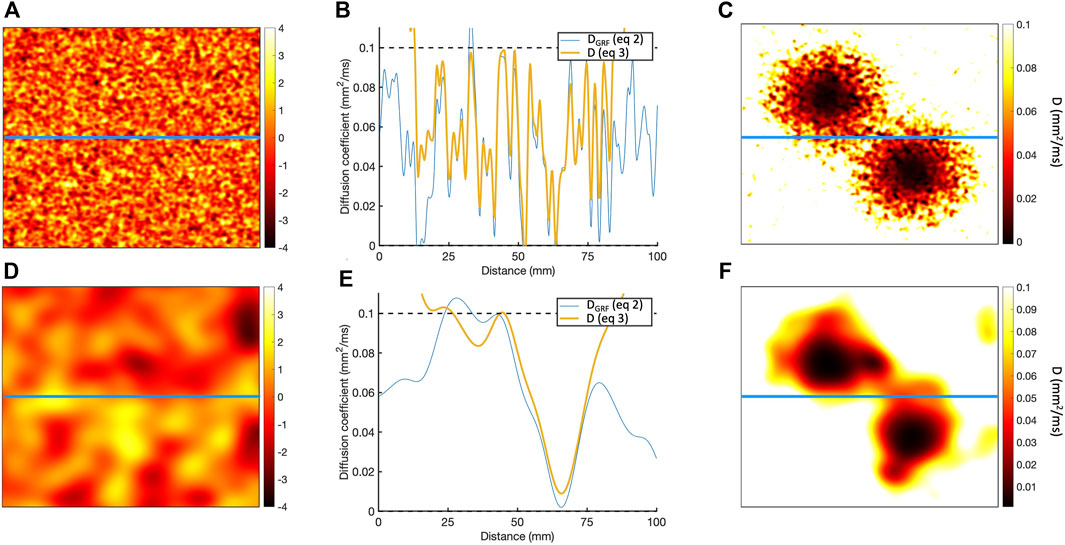
Figure 1. (A) Sample of Gaussian random field for length scale of 1.25 mm. (B) Horizontal cross-section of Gaussian random field along the blue line in A, showing the
To represent a 2D scar with a central isthmus,
where
This process is illustrated in Figure 1, which shows the diffusion fields obtained for length scales of 1.25 and
The GRF was sampled 20 times at each of the 4 length scales, giving a total of 80 structural models.
2.4 Functional models of coupling to fibrotic scar
Six different models were then used to represent the coupling between excitable tissue, border zone, and scar. Each model was based on the assumption that diffusion (tissue conductivity) within both border zone and scar is reduced. The first three models used different representations of the diffusion field and boundary between excitable and inexcitable tissue, and in the final three we introduced random elements. Each model is specified below.
• ThresholdD In this model, tissue was assumed to be either fully excitable with uniform diffusion or inexcitable and uncoupled.
• SmoothD In this model, tissue was assumed to be either fully excitable with smoothly varying diffusion, or inexcitable and uncoupled.
• ContinuousD This model was similar to SmoothD, except that regions of inexcitable tissue were assumed to be coupled.
Next, we constructed three further models with random removal of grid points around the edges of the simulated infarct to represent diffuse fibrosis.
• ThresholdD-random This model was a modification of ThresholdD, with random removal of grid points to represent small regions of diffuse fibrosis. A similar approach has been described in other studies as percolation (Roney et al., 2016) or random alterations to the connectivity matrix (Alonso and Bär, 2013). At each point
• SmoothD-random This model was a modification of SmoothD, with random removal of grid points to represent small regions of patchy fibrosis as for ThresholdD-random.
• ContinuousD-random In this model, random removal was undertaken in the same way as for SmoothD-random. However, points that were removed remained coupled but inexcitable as with the ContinuousD model.
Figure 2 illustrates the diffusion field for each model, showing long and short length scales.
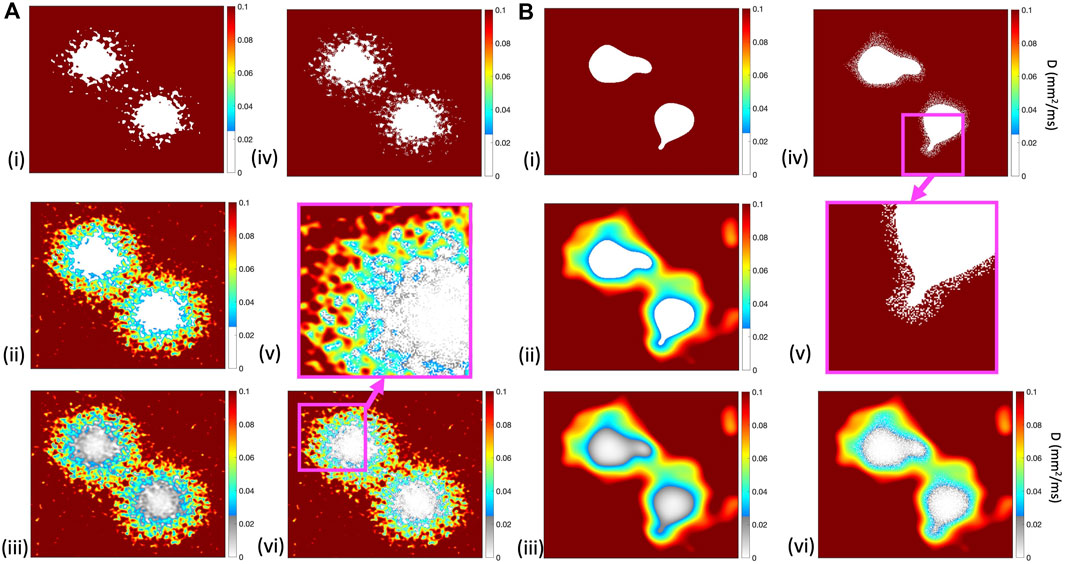
Figure 2. Diffusion fields for (i) ThresholdD, (ii) SmoothD, and (iii) ContinuousD models, with length scales of
2.5 Simulations and pacing protocol
Each tissue model was paced close to the isthmus by applying a stimulus current of
The duration of each simulation was 3.0 s. All
2.6 Post processing
The aim of post processing was to quantify the effect of simulated scar on activation and recovery during normal beats, and during the aggressive pacing protocol.
Activation and recovery times were determined at each location using a threshold crossing method with a threshold of
An additional simulation was run, with uniform tissue diffusion of
Regions of tissue in which membrane voltage increased from beneath the threshold to above the threshold during a period of
3 Results
3.1 Effect of simulated scar on activation and APD
The effect of the different models of fibrotic scar on action potential propagation in a
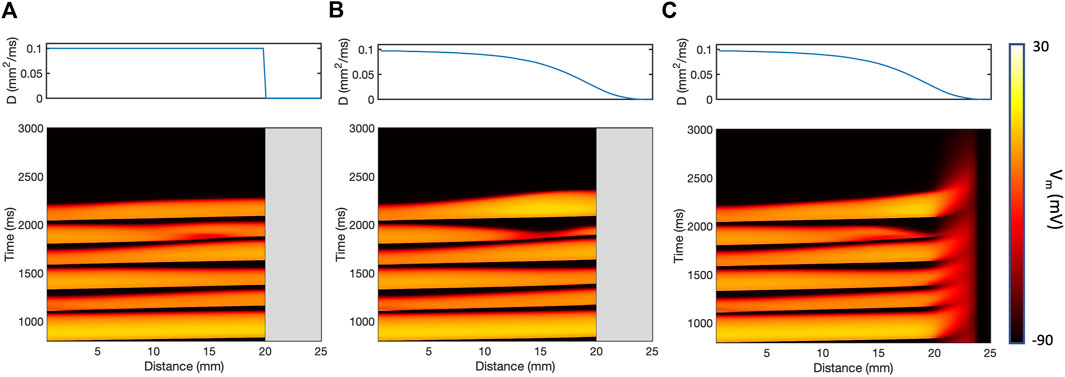
Figure 3. Action potential propagation in a thin
The presence of simulated fibrotic scar delayed activation and increased the dispersion of APD compared to a simulation without fibrotic scar. This behaviour is illustrated in Figure 4, which shows differences in LAT (Figure 4A) and APD (Figure 4B) observed in a representative sample of the ContinuousD model compared to observations in the model with uniform diffusion. LAT and APD differences are shown for an S1 beat (with cycle length of
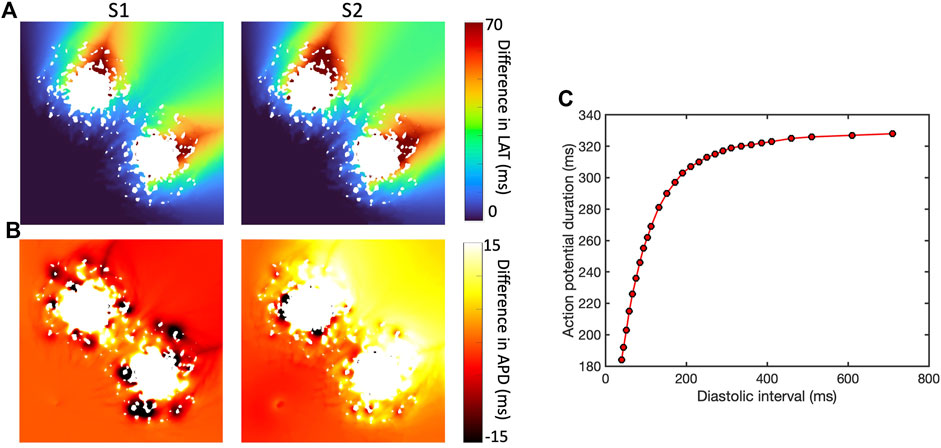
Figure 4. Effect of simulated scar on local activation time (LAT) (A) and APD (B), for S1 beat at cycle length of Regional differences in APD for final S1 beat (cycle length
In this example, the regions of short length scale scar acted to both increase and shorten APD for the S1 beat. The modest LAT delay associated with the premature S2 beat then acted to increase the diastolic interval beyond the scar, engaging APD restitution in the steep part of the curve (Figure 4C) and resulting in prolonged APD in this region.
These findings are extended and summarised across all models and simulations in Figure 5, which shows activation delay and APD for all four length scales and all six models of scar. Activation delay (Figure 5A) was calculated relative to the model with uniform diffusion
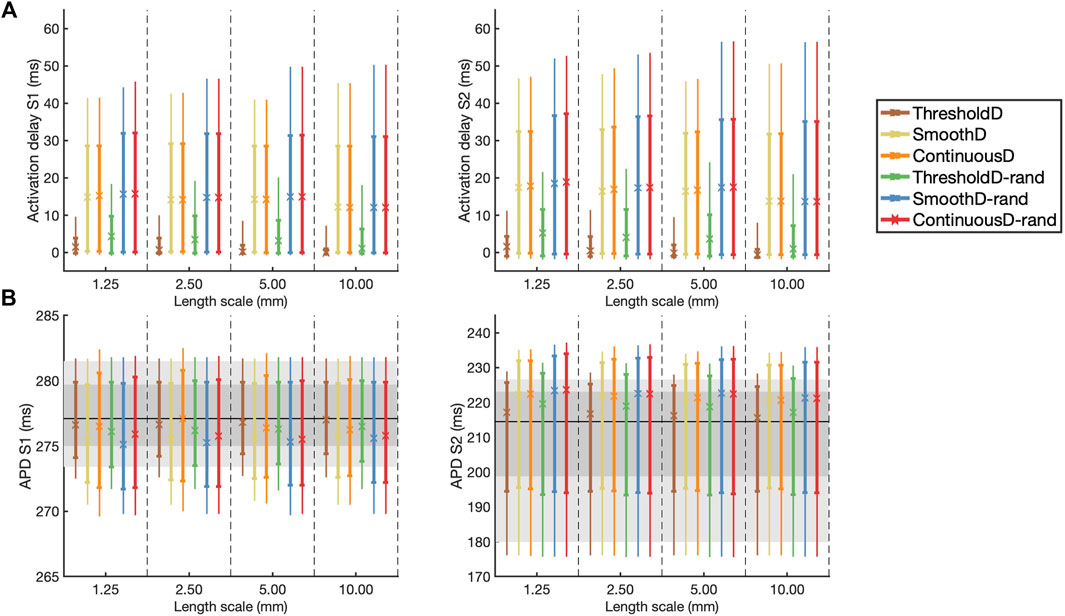
Figure 5. (A) Activation delay compared to simulation with uniform diffusion and (B) APD for the final S1 beat (left) and the initial S2 beat (right). The results are shown as median (symbol), inter-quartile range (thick line), and inter-decile range (thin line), where each measure is calculated across all 20 samples at each location. In (B) the horizontal black line indicates the median APD for simulation in uniform tissue; the dark and light grey regions show the inter-quartile and inter-decile range for this uniform simulation respectively.
Following the S1 beat, in all models median APD was slightly lower compared to uniform tissue, whereas following the S2 beat the median APD was slightly higher compared to uniform tissue (Figure 5B). In all models the inter-quartile and inter-decile ranges of APD, which are measures of APD dispersion, were greater than in uniform tissue. There were no clear effects of either length scale or fibrosis model on APD dispersion.
3.2 Vulnerability to re-entry
The incidence of re-entry in individual GRF samples depended on the both the length scale of simulated fibrosis and the scar model. Figure 6A shows the incidence of re-entry in each of the different models following aggressive pacing. In some simulations, no re-entry was elicited, in others re-entry terminated before the end of the
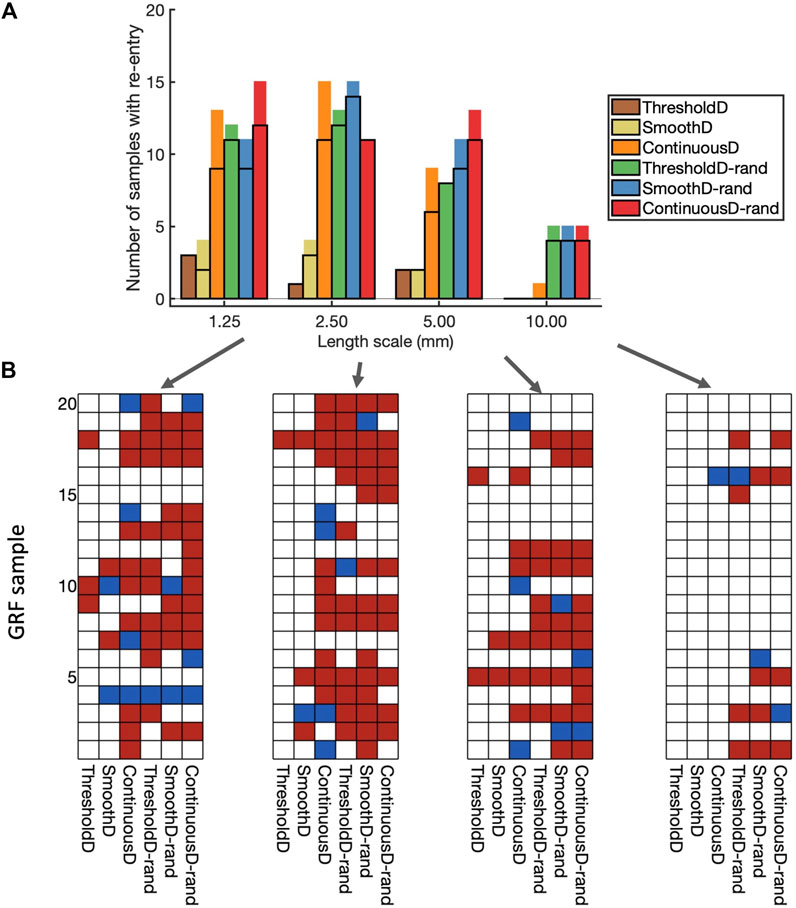
Figure 6. Incidence of re-entry in each model. (A) Overall view. Each bar shows the number of samples in which re-entry was produced by rapid pacing in each model. The part of the bar enclosed by black lines indicates the number of samples in which sustained re-entry was present at the end of the simulation (3.0 s), and the other part of the bar shows the number of samples in which transient re-entry was present at 2.6 s, but not at 3.0 s. (B) Grids showing the outcome of simulations with each of the 20 samples, and each of the nine fibrosis models. White indicates no re-entry, blue transient re-entry, and red sustained re-entry.
The type of scar model had an important effect on the incidence of re-entry. With the ThresholdD and SmoothD models the incidence of sustained re-entry was low
Introducing randomness into the regions close to the simulated scar resulted in an increased incidence of both transient and sustained re-entry for the ThresholdD-random and SmoothD-random models. For the ContinuousD-random model, there was an increase in the incidence of sustained and transient re-entry at all length scales. The randomness used in our simulations is equivalent to small obstacles at the spatial resolution of the grid, which was
Figure 6B shows a different view of these results, where the incidence of re-entry is broken down by model and GRF sample. A total of 61 of the 80 GRF samples produced either transient or sustained re-entry with at least one of the fibrosis models. Some GRF samples favoured re-entry in most of the models, for example, sample 5 with length scale
These overall findings show that important roles in initiation of simulated re-entry are played by both the length scale and the configuration of scar and border zone regions (i.e., the GRF sample). However, an even more important role is played by the way in which scar is represented in the model.
APD dispersion has long been recognised as a measure of vulnerability to re-entry (Han and Moe, 1964), and in Figure 7 we show the overall APD IQR for simulations that resulted in sustained and transient re-entry, and those that did not. Figure 7A shows results for all simulations, and Figure 7B shows results for the region of scar, within
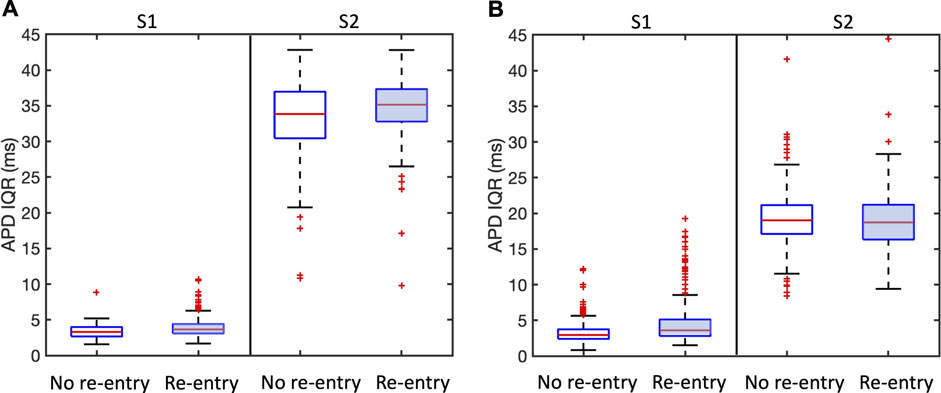
Figure 7. Association between APD dispersion measured by inter-quartile range (IQR) and incidence of sustained and transient re-entry. APD IQR was determined from the final S1 beat or the first S2 beat as shown. Plots are shown for all models. (A) shows results for the entire tissue sheet, and (B) results for the simulated infarct region alone. Each plot shows the median (red line), inter-quartile range (blue box), estimates of the extremes of the distribution (black lines), and outliers (red points).
We propose that the explanation for this observation is that APD IQR is an overall measurement of APD dispersion either locally or across the entire tissue, whereas re-entry is initiated as a result of much more local effects that may be very difficult to identify.
3.3 Mechanism and initiation of re-entry
Re-entry was often but not always sustained by retrograde activation through the isthmus between the main regions of scar, consistent with experimental and clinical evidence that highlights the importance of the isthmus (Anter et al., 2016; Pashakhanloo et al., 2018). However, we also observed re-entry around on lobe of the scar, as well as re-entry around small scale features distant from the scar. Figure 8 shows the mechanism of sustained re-entry for each of the different models at the shortest length scale. These mechanisms were determined from activation maps; examples are shown to illustrate each of the different mechanisms and all of the activation maps are included as Supplementary Material.
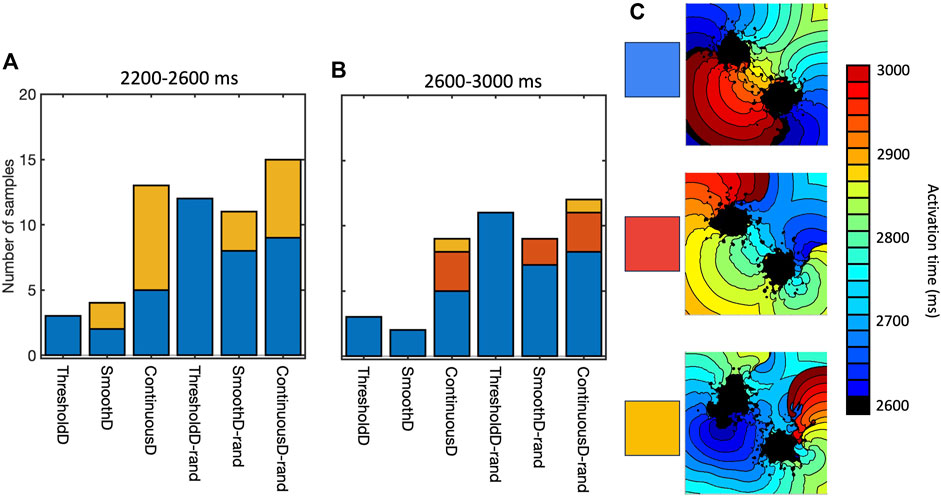
Figure 8. Mechanism of sustained re-entry in all six models with length scale of 1.25 mm. (A,B) number of samples with re-entry sustained by a figure-of-eight pattern with retrograde conduction through the isthmus (blue), re-entry around one lobe of the scar (gold), or a more complex re-entrant pattern (red), between 2,200 and 2,600 ms (A) and 2,600–3,000 ms (B). (C) Local activation time plots showing examples of each re-entry mechanism.
The prevalence of re-entry in models with the same structural representation of fibrotic scar (Figure 6), and the different mechanisms sustaining re-entry in the models of fibrosis (Figure 8) both indicate that the model of coupling between scar and normal tissue plays an important role in both initiating and sustaining re-entry.
This effect is illustrated in Figures 9A–C, which shows activation patterns in a single GRF sample where there was no re-entry, sustained re-entry, and transient re-entry in the ThresholdD, SmoothD, and ContinuousD models respectively. In the ThresholdD model, activation resulting from the final stimulus propagated around the two lobes of scar and through the isthmus as shown by the blue arrows. The activation wavefronts did not encounter recovering tissue and so there was no block and no subsequent re-entry. In the SmoothD model the activation wave propagated more slowly because the overall diffusion coefficient was lower. Propagation through the isthmus was initially blocked by recovering tissue, initiating figure-of-eight re-entry with retrograde propagation through the isthmus.
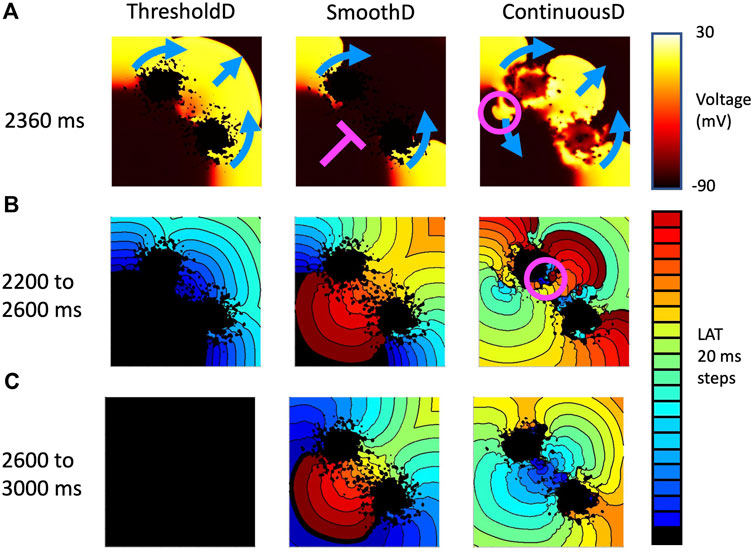
Figure 9. Example activation patterns in three fibrosis models for sample seven of tissue with a length scale of 1.25 mm. (A) Snapshot of membrane voltage in each model 2,360 ms after the start of the simulation. Propagation direction of the final premature beat (stimulus at 2059 ms) is shown by blue arrows. Pink line show where activation is blocked, and pink circle shows location of retrograde re-entry. (B) LAT between 2,200 and 2,600 s (C) LAT between 2,600 and 3,000 s.
Activation patterns for the ContinuousD model were more complex. The activation wave resulting from the final stimulus propagated around the lobes of the scar and through the isthmus. However, delayed recovery in a small feature led to retrograde re-entry shown by the pink circle. This produced antegrade activation through the isthmus, which was followed by a further re-entrant breakthrough in the isthmus indicated by the pink circle in the right hand panel of Figure 9B. The resulting activation waves collided and extinguished re-entry.
3.4 Effect of random removal
Random removal increased the incidence of re-entry, typically by block in the isthmus followed by retrograde activation through the isthmus (see Supplementary Material). An example is shown in Figure 10, which shows the behaviour of the ThresholdD model with and without random removal. In the ThresholdD-rand model the penultimate beat of the stimulus sequence propagated more slowly though the isthmus compared to the ThresholdD model. The final beat was then blocked by recovering isthmus tissue in the ThresholdD-rand model, leading to figure-of-eight re-entry.
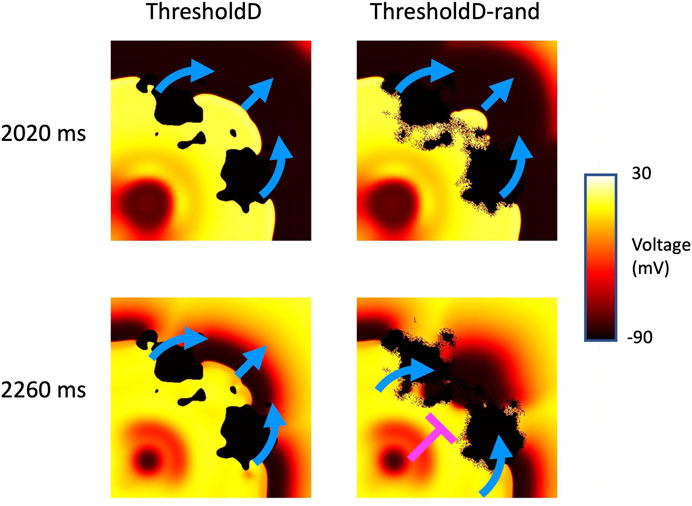
Figure 10. Block and re-entry in the ThresholdD model for sample 18 of tissue with a length scale of 10 mm. Snapshots of membrane voltage at 2020 and 2,260 ms show the penultimate and final beats of the stimulus sequence. Blue arrows show propagation, pink T shows block. See main text for details.
4 Discussion
The main finding of this study is that in models of cardiac tissue where fibrotic scar is represented by spatially varying diffusion, the conditions under which re-entry is initiated by rapid stimulation are marginal, and are strongly influenced by the spatial scale of fibrotic features as well as the coupling between excitable and inexcitable tissue. The introduction of simulated fibrotic scar acted to delay activation and to increase dispersion of APD, but the magnitude of these changes was not strongly affected by either the fibrosis model or the spatial scale of fibrosis.
The detailed electrophysiology of scar and border zone remains poorly characterised, and so we do not propose that any of these models is better than another. An important next step is to work in tandem with experiments to determine the most appropriate model, and then to undertake further work to better understand the mechanisms that promote block and re-entry. Nevertheless, we have shown that the choice of model is important and should borne in mind for simulations where scar or infarct are to be included. Fibrotic scar is a potential therapeutic target (Simon-Chica et al., 2023), and so a deeper understanding of the mechanisms underlying scar electrophysiology has important practical significance.
4.1 Representation of fibrotic scar
We used Gaussian random fields to generate diffusion fields that vary smoothly in space and have a well defined length scale. This approach enables a set of samples to be drawn with the same overall characteristics and overall texture, but with a different pattern in each sample so that a range of scar configurations can be explored. Use of GRFs has allowed us to explore the range of possible tissue/fibrosis pathways that could generate re-entry. We stress that the purpose of this study was not to find an optimum representation of fibrotic scar in computational models, but rather to highlight the fact that re-entry involving these complex structures is a marginal event that depends on many factors including how excitable and inexcitable tissue, as well as their coupling, is represented numerically. Other approaches for generating tissue texture could also be used, including Perlin noise (Jakes et al., 2019), and careful validation of these and other models against experimental images would be a valuable next step for generating representative and realistic patterns of fibrotic scar.
Our use of changes in diffusion (tissue conductivity) alone to represent the effect of fibrotic scar is based on evidence from both tissue culture (Gaudesius et al., 2003) and experimental preparations (Ghouri et al., 2018) showing that fibrotic scar acts to slow action potential propagation. However, this is a limitation because scar is a complex mixture of myocytes, fibroblasts, collagen, and other non-myocytes (Rog-Zielinska et al., 2016), and diffusion may be a rather blunt instrument to represent these. Although these structural features alone have been found to be sufficient to produce re-entry in computational models (Engelman et al., 2010), other simulations have shown that a more detailed representation of non-myocytes enables more insight into the way that action potentials can propagate through fibrotic scar (Simon-Chica et al., 2023). Explicit representation of the fibroblast space (Sachse et al., 2009), as well as recent work on homogenisation of these complex structures (Farquhar et al., 2022; Lawson et al., 2023) and myocyte-fibroblast interactions (Sridhar and Clayton, 2024) are further promising developments that will enable more representative models to be developed.
Consistent with an earlier study in simulated atrial tissue (Clayton, 2018), we found that fibrosis with a shorter length scale was in general more likely to produce and sustain re-entry. Including even smaller scale heterogeneity by random removal of grid points also tended to increase the incidence of re-entry. However, the magnitude of this effect was small relative to the differences between the different models, suggesting that the way that normal myocardium and scar is coupled plays an important role.
4.2 Limitations
Faithful representation of discrete and heterogeneous tissue in numerical and computational models is challenging because the standard models of cardiac electrophysiology assume that excitable tissue can be treated as a functional syncytium (Clayton et al., 2011). It is important to consider carefully how spatial variation in tissue conductivity and coupling in the transition zone between excitable and inexcitable regions is handled. In the present study, we have represented this transition in different ways, and have shown that different boundary conditions and coupling influence the incidence and persistence of re-entry. The reason for this finding appears to be the marginal conditions for propagation and block in regions of tissue with decreased conductivity as illustrated in Figures 9, 10. Our observations are consistent with the ideas that small variations in diffusive current flow in the different models act to tip the balance between propagation and block.
An important limitation of our study is that we have only examined behaviours in 2D tissue sheets, and the reason for this choice was the lower computational demands of 2D simulations, and the ease of interpreting the simulation outputs. Further work in 3D and whole-ventricle models incorporating anisotropic diffusion are an important next step, which will enable the way that anisotropic diffusive current flow affects the marginal conditions around propagation and block. More detailed and personalised models of scar based on clinical data are a longer term objective (Lopez-Perez et al., 2019), which will allow the effect of different ablation strategies to be explored.
The model of scar and border zone used in this study was based on superposition of spatially varying fields describing the infarct and border zone (Eqs 2, 3), with these fields being defined by a logistic function of the distance from the centre of the simulated infarct. We chose this approach because it resulted in a smooth weighting of
Furthermore, the potency of simulated fibrotic scar substrates almost certainly depend on the model of cellular electrophysiology that is used as well as the dimensions of the scar and the pacing protocol. In this study we used the TNNP06 model with a single parameter set (ten Tusscher and Panfilov, 2006) and a fixed scar size. We would expect that different parameter sets, spatial heterogeneity in parameters, different cellular electrophysiology models, different scar geometry, and different pacing protocols would all affect the inducibility and persistence of simulated re-entry. However, the purpose of this study was to investigate different representations of fibrotic scar, and so we used a single cellular electrophysiology model and parameter set to provide a consistent baseline. Nevertheless, future detailed mechanistic studies of re-entry in the presence of fibrotic scar, ideally conducted in tandem with experiments, will need to ensure that model dependent effects are carefully taken into account.
The six different models of scar used in this study embraced a range of different plausible representations. Other approaches have also been described (Connolly and Bishop, 2016). Without detailed comparison to experimental and structural data, it is not possible to judge which of the models examined in the present study is most representative of fibrotic scar in real hearts.
4.3 Basic science and potential clinical significance
In the present study we typically observed re-entry with retrograde conduction through isthmus resulting most of the time in figure-of-eight ventricular tachycardia as documented in experiments (Ciaccio et al., 2022). This was an expected finding because we chose to represent two regions of fibrotic scar with a central isthmus. Few simulations resulted in multiple wavefronts and VF despite our choice of a parameter set for the TNNP06 model that results in steep APD restitution and breakup of spiral waves (ten Tusscher and Panfilov, 2006). It is possible that breakup of the initial re-entry might have been seen in longer simulations, but another explanation may be slow conduction through the isthmus. The typical cycle of re-entry through the isthmus was
Our study highlights the possibly important role of microstructure in initiation of re-entry, and the potential value of therapeutic interventions targeted at these small scale features (Pashakhanloo et al., 2018). However, we have also found that it may be hard to identify these small scale features that act as substrates for re-entry. Figure 7 showed negligible differences in APD dispersion between samples that supported re-entry and those that did not, even when measures of APD dispersion were restricted to the neighbourhood of the infarct. More focused methods such as the re-entry vulnerability index, which is a measure of vulnerability to re-entry based on relative measurements of activation and recovery within a prescribed region (Campos et al., 2019) could provide a way to refine this approach.
Recent work on using computational models to identify the re-entrant circuits that sustain ventricular tachycardia in real patients has shown great promise (Prakosa et al., 2018; Zhang et al., 2023). It is intriguing that the present study has highlighted that the marginal conditions for re-entry can depend on the details of the model implementation, whereas the studies in patients have strong predictive power. Further studies to assess the relative importance of detailed and patient specific structural and function representations of fibrotic scar could address this interesting question.
Data availability statement
The original contributions presented in the study are included in the article/Supplementary Material, further inquiries can be directed to the corresponding author. All code used for the simulations described in this paper is publicly available at https://github.com/RichardClayton/VentricularFibrosis.
Author contributions
RC: Conceptualization, Formal Analysis, Funding acquisition, Methodology, Software, Writing–original draft. SS: Investigation, Writing–review and editing.
Funding
The author(s) declare that financial support was received for the research, authorship, and/or publication of this article. This work was primarily funded by grants from the British Heart Foundation (RG/17/3/32774 Neurocardiac interaction in malignant ventricular arrhythmias and sudden cardiac death) and EPSRC (EP/W000091/1 The SoftMech Statistical Emulation and Translation Hub).
Acknowledgments
This work was undertaken on HPC resources at the University of Sheffield (https://docs.hpc.shef.ac.uk/en/latest/).
Conflict of interest
The authors declare that the research was conducted in the absence of any commercial or financial relationships that could be construed as a potential conflict of interest.
Publisher’s note
All claims expressed in this article are solely those of the authors and do not necessarily represent those of their affiliated organizations, or those of the publisher, the editors and the reviewers. Any product that may be evaluated in this article, or claim that may be made by its manufacturer, is not guaranteed or endorsed by the publisher.
Supplementary material
The Supplementary Material for this article can be found online at: https://www.frontiersin.org/articles/10.3389/fphys.2024.1403545/full#supplementary-material
References
Alonso S., Bär M. (2013). Reentry near the percolation threshold in a heterogeneous discrete model for cardiac tissue. Phys. Rev. Lett. 110, 158101. doi:10.1103/PhysRevLett.110.158101
Amoni M., Vermoortele D., Ekhteraei-Tousi S., Doñate Puertas R., Gilbert G., Youness M., et al. (2023). Heterogeneity of repolarization and cell-cell variability of cardiomyocyte remodeling within the myocardial infarction border zone contribute to arrhythmia susceptibility. Circulation Arrhythmia Electrophysiol. 16, e011677. doi:10.1161/CIRCEP.122.011677
Anter E., Tschabrunn C. M., Buxton A. E., Josephson M. E. (2016). High-resolution mapping of postinfarction reentrant ventricular tachycardia: electrophysiological characterization of the circuit. Circulation 134, 314–327. doi:10.1161/CIRCULATIONAHA.116.021955
Balaban G., Costa C. M., Porter B., Halliday B., Rinaldi C. A., Prasad S., et al. (2020). 3D electrophysiological modeling of interstitial fibrosis networks and their role in ventricular arrhythmias in non-ischemic cardiomyopathy. IEEE Trans. Biomed. Eng. 67, 3125–3133. doi:10.1109/TBME.2020.2976924
Balaban G., Halliday B. P., Mendonca Costa C., Bai W., Porter B., Rinaldi C. A., et al. (2018). Fibrosis microstructure modulates reentry in non-ischemic dilated cardiomyopathy: insights from imaged guided 2D computational modeling. Front. Physiology 9, 1832. doi:10.3389/fphys.2018.01832
Calcagno D. M., Taghdiri N., Ninh V. K., Mesfin J. M., Toomu A., Sehgal R., et al. (2022). Single-cell and spatial transcriptomics of the infarcted heart define the dynamic onset of the border zone in response to mechanical destabilization. Nat. Cardiovasc. Res. 1, 1039–1055. doi:10.1038/s44161-022-00160-3
Campos F. O., Orini M., Taggart P., Hanson B., Lambiase P. D., Porter B., et al. (2019). Characterizing the clinical implementation of a novel activation-repolarization metric to identify targets for catheter ablation of ventricular tachycardias using computational models. Comput. Biol. Med. 108, 263–275. doi:10.1016/j.compbiomed.2019.03.018
Chilton L., Ohya S., Freed D., George E., Drobic V., Shibukawa Y., et al. (2005). K + currents regulate the resting membrane potential, proliferation, and contractile responses in ventricular fibroblasts and myofibroblasts. Am. J. Physiology-Heart Circulatory Physiology 288, H2931–H2939. doi:10.1152/ajpheart.01220.2004
Ciaccio E. J., Anter E., Coromilas J., Wan E. Y., Yarmohammadi H., Wit A. L., et al. (2022). Structure and function of the ventricular tachycardia isthmus. Heart rhythm. 19, 137–153. doi:10.1016/j.hrthm.2021.08.001
Clayton R., Bernus O., Cherry E., Dierckx H., Fenton F., Mirabella L., et al. (2011). Models of cardiac tissue electrophysiology: progress, challenges and open questions. Prog. Biophysics Mol. Biol. 104, 22–48. doi:10.1016/j.pbiomolbio.2010.05.008
Clayton R. H. (2018). Dispersion of recovery and vulnerability to re-entry in a model of human atrial tissue with simulated diffuse and focal patterns of fibrosis. Front. Physiology 9, 1052–1116. doi:10.3389/fphys.2018.01052
Connolly A. J., Bishop M. J. (2016). Computational representations of myocardial infarct scars and implications for arrhythmogenesis. Clin. Med. Insights Cardiol. 10, 27–40. doi:10.4137/CMC.S39708
Costa C. M., Plank G., Rinaldi C. A., Niederer S. A., Bishop M. J. (2018). Modeling the electrophysiological properties of the infarct border zone. Front. Physiology 9, 1–14. doi:10.3389/fphys.2018.00356
de Jong S., van Veen T. a. B., van Rijen H. V. M., de Bakker J. M. T. (2011). Fibrosis and cardiac arrhythmias. J. Cardiovasc. Pharmacol. 57, 630–638. doi:10.1097/FJC.0b013e318207a35f
Engelman Z. J., Trew M. L., Smaill B. H. (2010). Structural heterogeneity alone is a sufficient substrate for dynamic instability and altered restitution. Circulation. Arrhythmia Electrophysiol. 3, 195–203. doi:10.1161/CIRCEP.109.890459
Farquhar M. E., Burrage K., Weber Dos Santos R., Bueno-Orovio A., Lawson B. A. (2022). Graph-based homogenisation for modelling cardiac fibrosis. J. Comput. Phys. 459, 111126. doi:10.1016/j.jcp.2022.111126
Gaudesius G., Miragoli M., Thomas S. P., Rohr S. (2003). Coupling of cardiac electrical activity over extended distances by fibroblasts of cardiac origin. Circulation Res. 93, 421–428. doi:10.1161/01.RES.0000089258.40661.0C
Ghouri I. A., Kelly A., Salerno S., Garten K., Stølen T., Kemi O.-J., et al. (2018). Characterization of electrical activity in post-myocardial infarction scar tissue in rat hearts using multiphoton microscopy. Front. Physiology 9, 1454. doi:10.3389/fphys.2018.01454
Han J., Moe G. K. (1964). Nonuniform recovery of excitability in ventricular muscle. Circulation Res. 14, 44–60. doi:10.1161/01.res.14.1.44
Jacquemet V., Henriquez C. S. (2008). Loading effect of fibroblast-myocyte coupling on resting potential, impulse propagation, and repolarization: insights from a microstructure model. Am. J. physiology. Heart circulatory physiology 294, H2040–H2052. doi:10.1152/ajpheart.01298.2007
Jakes D., Burrage K., Drovandi C. C., Burrage P., Bueno-orovio A., Weber R., et al. (2019). Perlin noise generation of physiologically realistic patterns of fibrosis. bioRxiv, 668848. doi:10.1101/668848
Janse M. J., Wit A. (1989). Electrophysiological mechanisms of ventricular arrhythmias resulting from myocardial ischemia and infarction. Physiol. Rev. 69, 1049–1169. doi:10.1152/physrev.1989.69.4.1049
Kohl P., Gourdie R. G. (2014). Fibroblast–myocyte electrotonic coupling: does it occur in native cardiac tissue? J. Mol. Cell. Cardiol. 70, 37–46. doi:10.1016/j.yjmcc.2013.12.024
Kroese D. P., Botev Z. I. (2015). “Spatial process simulation,” in Stochastic geometry, spatial statistics and random fields: models and algorithms. Editor V. Schmidt (Cham: Springer International Publishing), 369–404. doi:10.1007/978-3-319-10064-7_12
Lawson B. A., dos Santos R. W., Turner I. W., Bueno-Orovio A., Burrage P., Burrage K. (2023). Homogenisation for the monodomain model in the presence of microscopic fibrotic structures. Commun. Nonlinear Sci. Numer. Simul. 116, 106794. doi:10.1016/j.cnsns.2022.106794
Lawson B. A. J., Oliveira R. S., Berg L. A., Silva P. A. A., Burrage K., dos Santos R. W. (2020). Variability in electrophysiological properties and conducting obstacles controls re-entry risk in heterogeneous ischaemic tissue. Philosophical Trans. R. Soc. A Math. Phys. Eng. Sci. 378, 20190341. doi:10.1098/rsta.2019.0341
Lopez-Perez A., Sebastian R., Izquierdo M., Ruiz R., Bishop M., Ferrero J. M. (2019). Personalized cardiac computational models: from clinical data to simulation of infarct-related ventricular tachycardia. Front. Physiology 10, 580. doi:10.3389/fphys.2019.00580
Mendonca Costa C., Campos F. O., Prassl A. J., Weber Dos Santos R., Sanchez-Quintana D., Ahammer H., et al. (2014). An efficient finite element approach for modeling fibrotic clefts in the heart. IEEE Trans. Biomed. Eng. 61, 900–910. doi:10.1109/TBME.2013.2292320
Nezlobinsky T., Okenov A., Panfilov A. V. (2021). Multiparametric analysis of geometric features of fibrotic textures leading to cardiac arrhythmias. Sci. Rep. 11, 21111. doi:10.1038/s41598-021-00606-x
Nguyen T. P., Qu Z., Weiss J. N. (2014). Cardiac fibrosis and arrhythmogenesis: the road to repair is paved with perils. J. Mol. Cell. Cardiol. 70, 83–91. doi:10.1016/j.yjmcc.2013.10.018
Niederer S., Kerfoot E., Benson A., Bernabeu M., Bernus O., Bradley C., et al. (2011). Verification of cardiac tissue electrophysiology simulators using an N-version benchmark. Philosophical Trans. R. Soc. A Math. Phys. Eng. Sci. 369, 4331–4351. doi:10.1098/rsta.2011.0139
Pashakhanloo F., Herzka D. A., Halperin H., McVeigh E. R., Trayanova N. A. (2018). Role of 3-dimensional architecture of scar and surviving tissue in ventricular tachycardia: insights from high-resolution ex vivo porcine models. Circulation Arrhythmia Electrophysiol. 11, 0061311–e6212. doi:10.1161/CIRCEP.117.006131
Prakosa A., Arevalo H. J., Deng D., Boyle P. M., Nikolov P. P., Ashikaga H., et al. (2018). Personalized virtual-heart technology for guiding the ablation of infarct-related ventricular tachycardia. Nat. Biomed. Eng. 2, 732–740. doi:10.1038/s41551-018-0282-2
Qu Z., Garfinkel A. (1999). An advanced algorithm for solving partial differential equation in cardiac conduction. IEEE Trans. Biomed. Eng. 46, 1166–1168. doi:10.1109/10.784149
Rog-Zielinska E. A., Norris R. A., Kohl P., Markwald R. (2016). The living scar – cardiac fibroblasts and the injured heart. Trends Mol. Med. 22, 99–114. doi:10.1016/j.molmed.2015.12.006
Roney C. H., Bayer J. D., Zahid S., Meo M., Boyle P. M., Trayanova N. A., et al. (2016). Modelling methodology of atrial fibrosis affects rotor dynamics and electrograms. Eur. Eur. pacing, Arrhythm. cardiac Electrophysiol. J. Work. groups cardiac pacing, Arrhythm. cardiac Cell. Electrophysiol. Eur. Soc. Cardiol. 18, iv146–iv155. doi:10.1093/europace/euw365
Rush S., Larsen H. (1978). A practical algorithm for solving dynamic membrane equations. IEEE Trans. Biomed. Eng. 25, 389–392. doi:10.1109/TBME.1978.326270
Rutherford S. L., Trew M. L., Sands G. B., LeGrice I. J., Smaill B. H. (2012). High-resolution 3-dimensional reconstruction of the infarct border zone: impact of structural remodeling on electrical activation. Circulation Res. 111, 301–311. doi:10.1161/CIRCRESAHA.111.260943
Sachse F. B., Moreno A. P., Seemann G., Abildskov J. A. (2009). A model of electrical conduction in cardiac tissue including fibroblasts. Ann. Biomed. Eng. 37, 874–889. doi:10.1007/s10439-009-9667-4
Simon-Chica A., Wülfers E. M., Kohl P. (2023). Nonmyocytes as electrophysiological contributors to cardiac excitation and conduction. Am. J. Physiology-Heart Circulatory Physiology 325, H475–H491. doi:10.1152/ajpheart.00184.2023
Sridhar S., Clayton R. H. (2024). Fibroblast mediated dynamics in diffusively uncoupled myocytes: a simulation study using 2-cell motifs. Sci. Rep. 14, 4493. doi:10.1038/s41598-024-54564-1
Sridhar S., Vandersickel N., Panfilov A. V. (2017). Effect of myocyte-fibroblast coupling on the onset of pathological dynamics in a model of ventricular tissue. Sci. Rep. 7, 40985–41012. doi:10.1038/srep40985
Ten Tusscher K. H., Panfilov A. V. (2007). Influence of diffuse fibrosis on wave propagation in human ventricular tissue. Eur. Eur. pacing, Arrhythm. cardiac Electrophysiol. J. Work. groups cardiac pacing, Arrhythm. cardiac Cell. Electrophysiol. Eur. Soc. Cardiol. 9 (Suppl. 6), 38–45. doi:10.1093/europace/eum206
ten Tusscher K. H. W. J., Panfilov A. (2006). Alternans and spiral breakup in a human ventricular tissue model. Am. J. Physiology (Heart Circulatory Physiology) 291, 1088–1100. doi:10.1152/ajpheart.00109.2006
Zahid S., Cochet H., Boyle P. M., Schwarz E. L., Whyte K. N., Vigmond E. J., et al. (2016). Patient-derived models link re-entrant driver localization in atrial fibrillation to fibrosis spatial pattern. Cardiovasc. Res. 110, 443–454. doi:10.1093/cvr/cvw073
Keywords: cardiac electrophysiology, computer model, cardiac arrhythmia, human ventricles, fibrosis, Gaussian random field, re-entry
Citation: Clayton RH and Sridhar S (2024) Re-entry in models of cardiac ventricular tissue with scar represented as a Gaussian random field. Front. Physiol. 15:1403545. doi: 10.3389/fphys.2024.1403545
Received: 19 March 2024; Accepted: 10 June 2024;
Published: 28 June 2024.
Edited by:
Fabien Brette, Institut National de la Santé et de la Recherche Médicale (INSERM), FranceReviewed by:
Gernot Plank, Medical University of Graz, AustriaAlexander Panfilov, Ghent University, Belgium
Copyright © 2024 Clayton and Sridhar. This is an open-access article distributed under the terms of the Creative Commons Attribution License (CC BY). The use, distribution or reproduction in other forums is permitted, provided the original author(s) and the copyright owner(s) are credited and that the original publication in this journal is cited, in accordance with accepted academic practice. No use, distribution or reproduction is permitted which does not comply with these terms.
*Correspondence: Richard H. Clayton, ci5oLmNsYXl0b25Ac2hlZmZpZWxkLmFjLnVr