
94% of researchers rate our articles as excellent or good
Learn more about the work of our research integrity team to safeguard the quality of each article we publish.
Find out more
ORIGINAL RESEARCH article
Front. Physiol., 04 January 2024
Sec. Exercise Physiology
Volume 14 - 2023 | https://doi.org/10.3389/fphys.2023.1337170
 Yuting Zhang
 Mengtong Chen
 Hongxiu LiuYanan He
 Yuanchao LiPeifeng ShenYiming Chen
 Jiapeng Huang*
 Chunlong Liu*
Purpose: To investigate the effect of isometric prone trunk extension (IPTE) contraction intensity on the stiffness of erector spinae (ES), semitendinosus (ST), biceps femoris (BF), and gastrocnemius muscles to understand the overall muscle mechanical behavior during IPTE and to explore the mechanisms of oordinated contraction of the body kinetic chain.
Methods: Twenty healthy females were recruited, and participants underwent IPTE at three contraction intensities, i.e., 0% maximum voluntary isometric contraction (MVIC), 30% MVIC, and 60% MVIC, and muscle stiffness was measured using MyotonPRO.
Results: Muscle stiffness was moderately to strongly positively correlated with contraction intensity (r = 0.408–0.655, p < 0.001). The percentage increase in stiffness at low intensity was much greater in ES than in lower limb muscles and greater in ST and BF than in gastrocnemius, whereas at moderate intensity, the percentage increase in stiffness decreased in all muscles, and the percentage increase in stiffness in ES was lower than that in ST. There was a moderate to strong positive correlation between ES stiffness variation and ST (r = 0.758–0.902, p < 0.001), BF (r = 0.454–0.515, p < 0.05), MG (r = 0.643–0.652, p < 0.01), LG (r = 0.659–0.897, p < 0.01).
Conclusion: IPTE significantly affected the stiffness of lumbar and lower limb muscles, and low-intensity IPTE activated the ES more efficiently. There were significant coordinated muscle contractions between ES, ST, and LG. This provides preliminary evidence for exploring the overall modulation pattern of the lumbar and lower limb muscles’ kinetic chains. In future studies, we will combine other stiffness assessment methods (such as Magnetic Resonance Elastography, Shear Wave Elastography, or electromyography) to corroborate our findings.
Core strength plays a supportive and protective role in the human body and allows for optimal force production, transmission, and control throughout the body’s kinetic chain during movement (Kibler et al., 2006). Research has shown that there is a kinetic chain between the trunk and the lower extremities (Waiteman et al., 2022) and that the trunk is the basis for the transmission and dissipation of the entire lower extremity kinetic chain during movement. Trunk stabilization is a prerequisite for effective transmission of the spine-pelvis-leg mechanism (Snijders et al., 1993), and the ES is an essential muscle for maintaining upright posture and assisting lumbar spine movement (Sánchez-Zuriaga et al., 2010), and it is the main provider of trunk stability (Guo et al., 2012). The thoracolumbar fascia covers the muscles of the lower trunk (Vleeming et al., 1995), and plays an important role in trunk rotation, lateral flexion, extension, and stabilization of the lower lumbar spine and pelvis. The gluteus maximus (GMax) is a strong hip extensor muscle that is tightly connected to the ES through the thoracolumbar fascia and to the hamstrings through the sacrococcygeal ligament (Vleeming et al., 1995), and the ST in the hamstrings is connected to the gastrocnemius muscle through the fascial bands at the knee joint (Tuncay et al., 2009). Maintaining stability during human movement requires co-activation across muscle groups (Ippersiel et al., 2023). It has been documented that the abdominal and pelvic floor muscles are co-activated during functional activities such as lifting the head and shoulders (Bø and Stien, 1994). During walking or horseback riding (Luzum et al., 2023), co-contraction of the lumbar and lower limb muscles is also required. Muscle co-activation, or co-contraction, is a biomechanical index that quantifies the level of muscle activation around a joint (Rosa et al., 2014), and this coordinated or muscle-activation relationship is defined as coordinated muscle contraction (Sapsford et al., 2001). Altered motor control and coordinated muscular contraction are fundamental to normal body function. Functional activities such as trunk extension require trunk stability (Smith et al., 2021), so the muscle groups that make up the functional unit of trunk extension must contract or co-activate simultaneously, thereby triggering a whole-body muscular response (Kocyigit et al., 2023). However, fewer articles have been published examining the mechanical behavior of trunk and lower limb muscles and the mechanisms of coordinated muscle contraction. Therefore, there is a need for clinical trials on the coordinated contraction of the kinetic chain of the human trunk and lower limb muscles.
Weakened trunk muscle function can lead to overcompensation of other muscles, which can impair athletic performance and even increase the risk of overall musculoskeletal injury (De Blaiser et al., 2018). The third lumbar vertebra (L3), the pivot of lumbar spine movement in all directions, is subject to the greatest stresses, and the muscles attached around it, such as the ES, are among the most vulnerable of the lumbar muscles (Yang et al., 2023). Lumbar muscle conditioning exercises (Clark et al., 2002) can improve the stability of the lumbar structure, effectively enhance the strength and flexibility of the lumbar muscles (San Juan et al., 2005), and enable the lumbar structure to obtain a new balance to compensate for the dysfunction caused by low back pain. Exercises for the lumbar extensors are usually based on isometric exercises to maximize the recruitment of the lumbar muscles (Skibski et al., 2023). An activity level of 60% MVIC is sufficient for basic strength training (Andersson et al., 1998). Muscle activity levels of 20%–30% MVIC have been reported for trunk extensors in daily life (Sawai et al., 2004), and the average intensity of ES contractions is usually moderate or mild (Cuesta-Vargas and Gonzalez-Sanchez, 2013). After pre-experimentation, three contraction intensities of 0%, 30%, and 60% MVIC were selected in this study to explore the optimal intensity for effective ES activation. Trunk flexion produces greater lumbar extension forces than the neutral trunk position, but this is primarily a force produced by the hip extensors with less force being generated by the lumbar muscles (CHOLEWICKI and VANVLIET, 2002; Kocjan and Sarabon, 2014) also found that the lumbar back muscles contributed most to spinal stability in neutral isometric extension exercises compared to flexion tests. In combination with our previous experiment (Zhang et al., 2023), lumbar extension strength in the trunk hyperextension position was not as strong as in the trunk neutral position, and therefore we chose to perform IPTE in the trunk neutral position to assess lumbar extensor strength.
The core is the basis for stabilization and force production in all physical activities, and assessment of core strength allows assessment of muscle functional status (Jubany et al., 2015), which is valuable in the prevention of primary and secondary injuries. Portable ergometers are highly reliable and valid, and they are a suitable method for the rapid assessment of muscle strength in a clinical setting (Stark et al., 2011). Studies have shown that the strength of the tester affects the reliability of hand-held ergometers (Mentiplay et al., 2015), which require the tester to exert a greater force than the muscle being assessed and to apply constant resistance throughout the test (Stark et al., 2011). To eliminate the effect of inter-tester differences in upper limb strength, this study utilized an adjustable fixation device to hold the ergometer in place. Muscle stiffness reflects the resistance to external perturbations, and compared to shear wave elastography MyotonPRO can provide stiffness parameters of individual muscles during isometric contractions of varying intensities with excellent reliability (Lam et al., 2015). Rapid quantification of overall spatially distributed muscle stiffness at rest and at different contraction intensities can help us better understand muscle recruitment strategies and provide new insights into the mechanisms of coordinated contraction of the kinetic chain between the lumbar and lower limb muscles.
The purpose of this study was to quantify the changes in stiffness of the right ES, ST, BF, medial gastrocnemius head (MG), and lateral gastrocnemius head (LG) during non-fatiguing IPTE of varying intensities in healthy participants by using MyotonPRO.
To set the required sample size for the study, five participants were first screened according to the inclusion and exclusion criteria for the pre-experiment, which showed that the stiffness of erector spinae at 0% of the contraction intensity of trunk extension was 270.53 ± 2.79 N/m, that of erector spinae at 30% of the contraction intensity was 348.93 ± 11.69 N/m and that of erector spinae at 60% of the contraction intensity was 380.33 ± 15.99 N/m. Requiring bilateral α = 0.05 and power = 0.95, the software G*Power3.1.9.7 (Heinrich-Heine-Universität, Düsseldorf, Germany) calculated the effect size of ES to be 2.89, with a minimum sample size of 9. Adequate consideration was given to the existence of the possibility of participant refusal and loss, and a total of 20 participants were recruited for this study.
This study received approval from the ethics committee of the Guangdong Provincial Hospital of Chinese Medicine (YF 2021-223-01). This study followed the principles of the Declaration of Helsinki. All participants were fully informed about the safety of the ergometer and MyotonPRO, their basic rights, the purpose of the trial, and the procedure before the start of the trial, and they signed an informed consent form in writing.
The researchers recruited 20 healthy females (mean age: 19.95 ± 0.95 years; mean height: 1.60 ± 0.05 m; mean weight: 50.75 ± 6.14 kg; BMI: 19.69 ± 1.83 kg/m2; MVIC: 134.53 ± 5.85N) from Guangzhou University of Chinese Medicine in June 2023. Inclusion criteria were 1) right hand and foot were the dominant sides; 2) 18.5 kg/m2 < BMI <24 kg/m2; 3) being in good health without neuromuscular disease or joint disease and history of spinal or pelvic surgery; and 4) not having pain or trauma in the shoulder and neck, low back, lower limbs, or feet of those who had not had pain or trauma that interfered with normal life and work for at least the past 6 months. Exclusion criteria were: 1) those with broken skin or bleeding tendency in the lumbar and lower limbs; 2) cognitive impairment; 3) pregnancy, breastfeeding, menstruation, and women with prolonged dysmenorrhea; and 4) scoliosis. Participants were asked to avoid strenuous activity for 48 h before the start of the trial.
This study was conducted using MyotonPRO (produced by MyotonPRO AS in Estonia). The operator places the probe vertically against the skin surface of the marking point, presses the body gently until the green light at the end of the probe illuminates, and stabilizes the instrument until the probe automatically impacts the measurement and the muscle dynamic hardness, i.e., S-Dynamic Stiffness (N/m), is displayed on the screen of the device. The ergometer is a HOGGAN Scientific microFET2 (Hoggan Scientific, Salt Lake City, UT, United States) used to measure ES contraction strength, which is converted from a pressure signal into pounds by a pressure transducer and displayed on the screen.
In this test, MyotonPRO was used to measure the stiffness of the right ES, ST, BF, MG, and LG. The operator marked the muscles to be measured with an oil pen, palpated the spinous process of the fourth lumbar vertebra (L4) according to the body markers, palpated L3 upward, and marked the ES measurement point 2.5 cm to the right lateral paracentesis of L3. The measurement point of the ST was the midpoint of the line connecting the sciatic tubercle to the medial tibial condyle; that of the BF was the midpoint of the line connecting the sciatic tubercle to the lateral tibial condyle; the MG was located at 30% of the line connecting the medial popliteal stripe with the lateral ankle; and the LG was located at 30% of the line connecting the lateral popliteal stripe with the medial ankle (Figure 1).
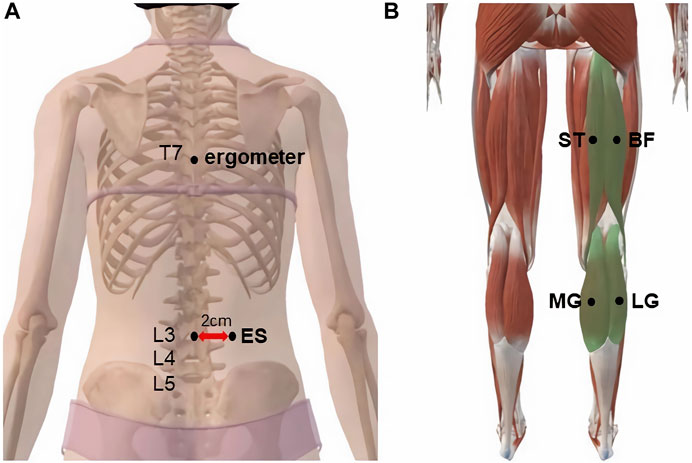
FIGURE 1. MyotonPRO probe monitoring point: (A) erector spine; (B) semitendinosus, biceps femoris, medial gastrocnemius, and lateral gastrocnemius.
The test steps were as follows: 1) During the measurement period, the participant lay prone on a full-length padded manipulative bed with the arms parallel to the body axis, the lower limbs straight and relaxed, and the ankles extended outside the bed in a naturally drooping position. Two immobilization belts secured the participant to the manipulative bed. The band that immobilized the pelvis was located at the level of the greater trochanter of the hip, and the band that immobilized the lower extremities was placed at the level of the popliteal fossa. The adjustable fixtures secured the ergometer (Figure 2) at the seventh thoracic spine spinous process (T7) to assess the strength of the ES during IPTE. A towel was used between the ergometer and the T7 spinous process to minimize participant discomfort. After 5 min of rest in the prone position, the operator measured the ES, ST, BF, MG, and LG stiffness on the dominant side of the participant using a MyotonPRO; 2) the participant was asked to perform three voluntary movements of maximal isometric trunk extension, each of which was 5 s with a 45 s rest period, and the three times were recorded to take the average ergometer value, which was 100% MVIC. The resistance required for contraction was calculated as follows: 30% MVIC = 0.3 MVIC and 60% MVIC = 0.6 MVIC; 3) after 10 min of rest, the participant was asked to maintain isometric trunk extension at 30% and 60% MVIC, respectively, and the operator took 3 repetitive measurements and averaged the values of the ES, ST, BF, MG, and LG using the MyotonPRO with the order of the muscle measurements randomized. During each contraction, the MicroFET2’s display shows the resistance value and the operator verbally instructs the participant to remain at the target resistance value. The target value threshold ranges from +/- 2.5% to account for variance observed in contraction control. The operator measures two to three muscle positions at a time for approximately 20–30 s. As soon as the MicroFET2 real-time muscle strength data showed a wide range of fluctuations in the participant’s muscle strength (more than +/- 2.5%), we stopped collecting data and asked the participant to rest appropriately between measurements to recover from fatigue and to monitor muscle stiffness using MyotonPRO until it returned to its initial state.
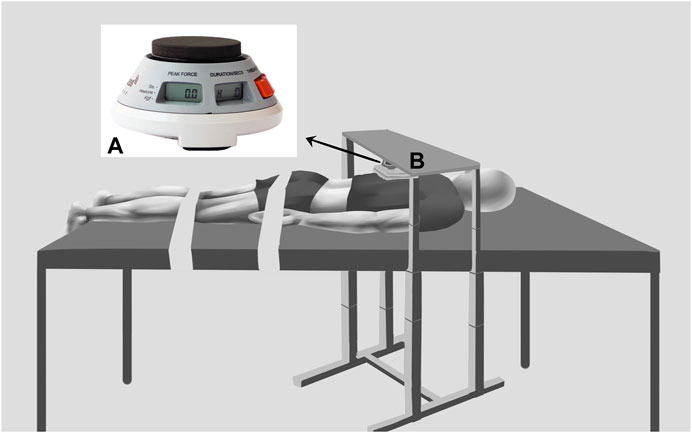
FIGURE 2. The posture and equipment used for measurement: (A) ergometer, (B) Adjustable fixtures.
SPSS 25.0 (version 25.0, Chicago, IL, United States) was used for statistical analysis. All data collected were tested for normality using the Shapiro-Wilk test, and all data conformed to a normal distribution and are expressed as mean ± standard deviation (SD). One-way analysis of variance (ANOVA) was performed with 0% MVIC, 30% MVIC, and 60% MVIC as independent variables and muscle stiffness (same measurement position) as the dependent variable. When ANOVA results were significant, Tukey’s multiple comparisons were performed to determine whether there was a difference in the stiffness of the same muscle at different contraction intensities (Figure 3). The statistical significance level was set at p = 0.05.
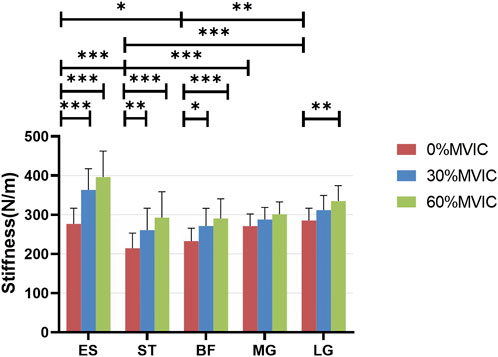
FIGURE 3. Stiffness variation of each muscle under different contraction intensities. ***, significant intergroup difference (p < 0.001); **, significant intergroup difference (p < 0.01); *, significant intergroup difference (p < 0.05); NS, non-significant intergroup difference (p > 0.05).
Pearson correlation analysis was used to verify the correlation between muscle hardness and isometric contraction strength, as well as the correlation between the value of the percentage change in muscle hardness of the lower limbs and ES. The correlation strength of the correlation coefficient r-value was set as |r| < 0.3 for weak correlation, 0.3 ≤ |r| ≤ 0.6 for moderate correlation, and |r| > 0.6 for strong correlation. Considering the individual differences in subjects and the stiffness properties of the muscles themselves, localized muscle stiffness percentage changes were used to more accurately characterize the differences in stiffness during contraction and force production. Percentage change in stiffness (%) = (measured stiffness—initial stiffness) ÷ initial stiffness × 100%. The percent change in muscle hardness at each measurement location was compared to the percent change in ES hardness under the same test conditions. The statistical significance level was set at p = 0.05.
Table 1 lists the Sum of Squares, Mean Square, F-values, and p-values for ES, ST, BF, MG, and LG stiffnesses at different isometric trunk extension contraction intensities (0%, 30%, and 60% MVIC). The ANOVA test showed extremely statistically significant differences in ES, ST, BF, and LG stiffness at different trunk extension intensities (p < 0.001), as well as statistically significant differences in MG stiffness as well (p = 0.012). Figure 3 shows the relationship between muscle stiffness and the intensity of contraction for different isometric trunk extensions. Post-hoc Türkiye test showed that different muscles had different stiffness in a relaxed state: ES differed from ST (p = 0.002) and BF (p = 0.0182), ST differed significantly from MG (p = 0.0009) and LG (p < 0.0001), and BF differed from LG (p = 0.0025). The same muscle also differed in stiffness at different contraction intensities, with ES, ST, and BF stiffness all differing significantly at both 0% MVIC and 30% MVIC, and 0% MVIC and 60% MVIC (p < 0.0001, p < 0.0001, p = 0.0001, p = 0.0038, p < 0.0001, p = 0.0196, and p = 0.002), and LG stiffness differing between 0% MVIC and 60% MVIC (p = 0.0016), and there was no significant difference in muscle hardness at the remaining contraction intensities (p > 0.05). The same tester performed all stiffness measurements, and the reliability analysis resulted in excellent intragroup reliability (intra-class correlation = 0.985–0.993 for 5 muscle sites).
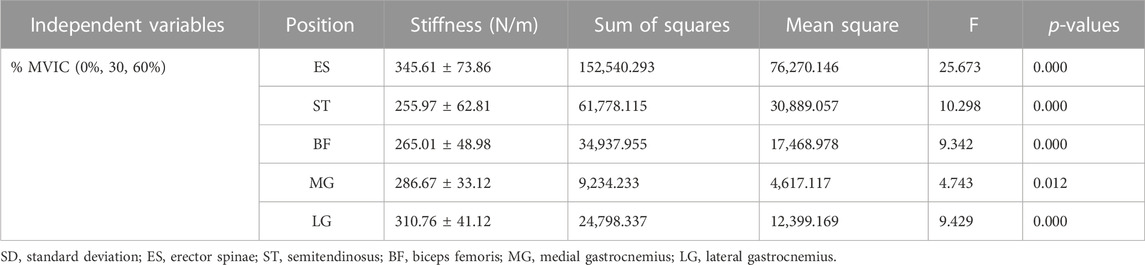
TABLE 1. One-way ANOVA results of muscle stiffness at different isometric trunk extension contraction intensities (mean ± SD, n = 20).
A moderate to strong positive correlation between muscle stiffness and isometric contraction intensity (r = 0.408–0.655, p < 0.001) is shown in Table 2. The stiffness of ES, ST, BF, MG, and LG contractions of the participants increased with increasing intensity of trunk extension (Table 3; Figure 3).
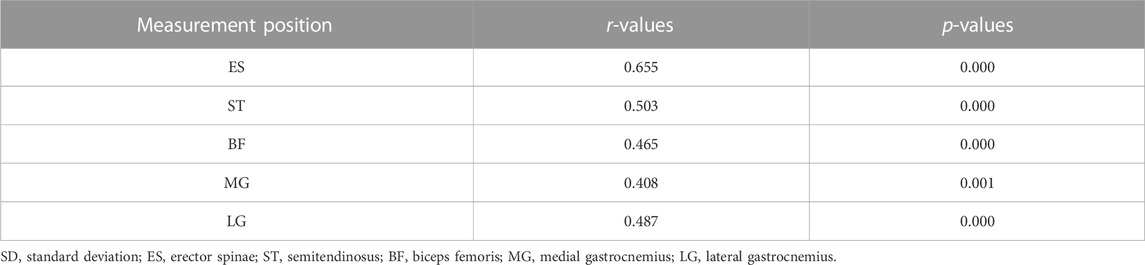
TABLE 2. The correlation between muscle stiffness and isometric contraction intensity.
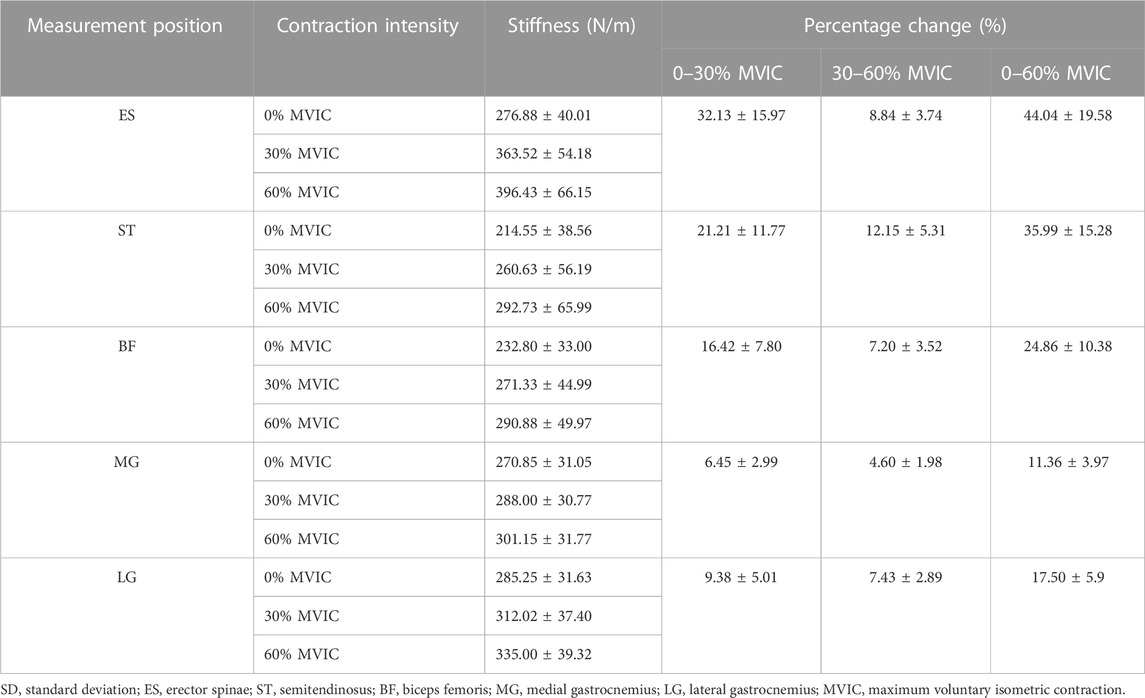
TABLE 3. Changes in muscle stiffness and percentage changes in stiffness of lumbar and lower limb muscles under different isometric contraction intensities (mean ± SD, %).
The characteristics of muscle stiffness percentage change are shown in Table 3; Figure 4. When the contraction intensity was 0%–30% MVIC, the values of percentage change of muscle stiffness increased in both lumbar and lower limbs, and the degree of increase of percentage change values was ES > ST > BF > LG > MG; when the contraction intensity was 30%–60% MVIC, the percentage growth of stiffness decreased in all muscles, and the value of percentage change of stiffness growth in ES decreased sharply, and the degree of increase of percentage change values was ST > ES > LG > BF > MG.
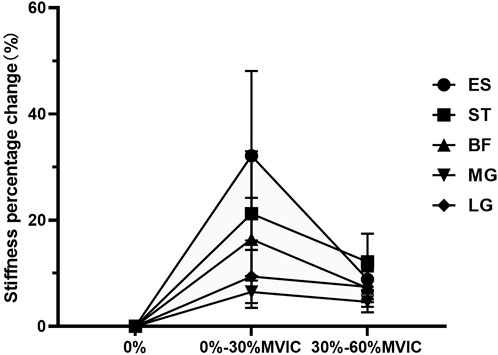
FIGURE 4. The change in stiffness percentage changes value of each muscle under different contraction intensities.
The percentage of muscle stiffness at each measurement position was compared to the percentage of stiffness at the ES under the same test conditions (Table 4). The results showed that ST (r = 0.758–0.902, p < 0.001), LG (r = 0.659–0.897, p < 0.01), and MG (r = 0.643–0.652, p < 0.01) showed strong correlations with the values of percent change in stiffness of the ES at different contraction intensities. bf (r = 0.454–0.515, p < 0.05) was moderately correlated with the value of the percent change in stiffness of ES.
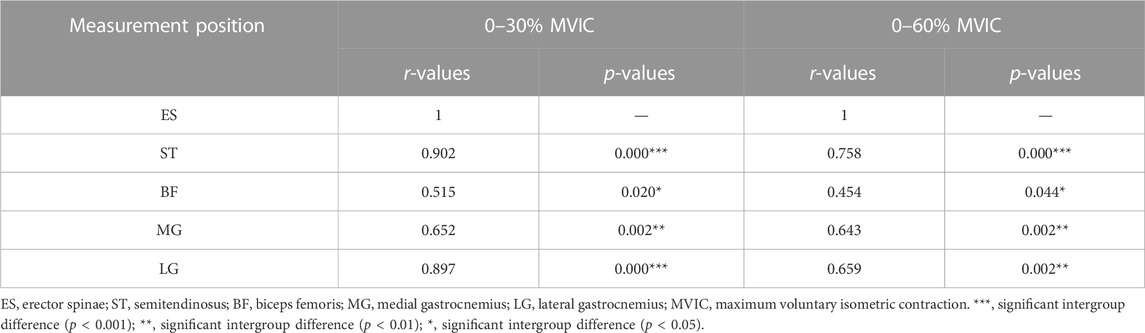
TABLE 4. The correlation between the stiffness percentage changes of each muscle (%).
To the best of our knowledge, this is the first study to observe the mechanical behavior and kinetic chain coordinated contraction mechanisms of the lumbar and lower limb muscles during IPTE of different intensities and to correlate the percentage change in muscle stiffness of the lumbar and lower limb muscles. This study found the following characteristics of muscle stiffness and percent stiffness change: 1) muscle stiffness was moderately to strongly positively correlated with contraction intensity; 2) there was an inverted U-shaped relationship percentage change in muscle stiffness growth and contraction intensity, the percent increase in stiffness of ES was much greater than that of the lower limb muscles during low-intensity contraction, the percent increase in stiffness of hamstring muscle was greater than that of gastrocnemius muscle, and the percent increase in stiffness of ES was less than that of ST during medium-intensity contraction; 3) there was a moderate to strong correlation between the value of percent change in stiffness of lower limb muscles and ES to strong correlation; 4) there were significant coordinated muscle contractions between ES, ST, and LG.
Skeletal muscle is usually cross-linked with myosin (contractile properties) and actin and connective tissue (passive elastic) components to produce force. The biomechanical properties of muscle can reflect the physiological changes of muscle during relaxation and contraction (Wang et al., 2017). This study used MyotonPRO quantitatively produced in stiffness change of muscle contraction and local muscle stiffness of noninvasive quantitative measurements to estimate individual muscle’s contribution to the overall joint hardness (Nordez et al., 2009). The results showed that there was a moderate to strong positive correlation between skeletal muscle stiffness and non-fatigue contraction strength (0–60% MVIC), which was consistent with the results of many previous studies (Bensamoun et al., 2008; Nordez et al., 2009; NORDEZ and Hug, 2010). Therefore, muscle stiffness can be used to estimate the relative change in muscle strength and degree of contraction.
Core muscles provide proximal stability for the spine and are the stable basis for upper and lower limb movements (Guo et al., 2012). Studying the effect of IPTE on muscle stiffness may clarify the regulation strategies of different muscles. This study found that different muscles have different stiffness in the relaxed state, which may be related to the direction of muscle fibers (Bensamoun et al., 2006). By analyzing the percentage changes in the stiffness of each muscle under different contraction intensities, we found that the stiffness of different muscles increased unevenly with the increase in contraction intensity. During low-intensity contraction, the percent increase in stiffness of ES, ST, and BF was much higher than that of MG and LG, which indicates that ES is the main generating site of the lumbar extensor muscle, ST is the main generating muscle of the hip extensor muscle, and it is also the lower limb muscle most affected by changes in lumbar tension. This finding also supports the hypothesis of Arokoski et al. (1999). However, during moderate-intensity contraction, the percentage increase in ST stiffness was greater than that of ES, indicating that the synergistic relationship between the lumbar extensor and hip extensor also changed with the increase in load. Clark et al. (2002) used surface electromyography to observe the effects of multiple sets of dynamic PTE at 40%, 50%, and 70% MVIC exercise intensities on the electromyography activities of the para-spinal area, GMax, and BF. The results showed that when the exercise intensity was greater than 40% MVIC, the contribution of the hip extensor muscle to the force was greater than that of the lumbar extensor muscle, and the hip extensor muscle was more adaptable to high loads than the lumbar muscle tissue. Saunders et al. (2020) found that continuous IPTE produced less head movement than multi-group dynamic PTE and that head movement was linearly related to ES contraction intensity, with the least head movement and the most stable ES contraction at 30% MVIC. The above findings are consistent with the results of the present study, in which the output strategies of the lumbar and hip extensors were redistributed at 60% MVIC and the ST contributed more to trunk extension force generation than the ES. Therefore, to activate the lumbar extensor muscle more effectively and minimize the synergistic effect of the lower limb muscles, we should choose low-intensity IPTE to train ES, that is, 30% MVIC.
Our study found an inverted “U”-shaped relationship between percentage change in muscle stiffness growth and contraction intensity. It has been shown (Taylor et al., 2003) that at low loads, motor units are largely inactive, so any change in the recruitment of motor units causes high fluctuations. The relative increments in the recruitment of each motor unit decreased with increasing contraction intensity, and the fluctuations reached a plateau with further increases in the force level. Compared with low-intensity contraction, the percentage increase in ES stiffness decreases sharply during medium-intensity contraction. This is due to the relatively high proportion of slow fibers, i.e., type I muscle fibers, in the lumbar muscles (Mannion et al., 1997), which mainly provide spinal stability (Panjabi et al., 1989). Synergistic muscles such as hip extensors are activated to prevent overloading of the lumbar spine region (Clark et al., 2002). With the increase in contraction intensity, the percentage increase in stiffness in ST was always greater than that in BF, mainly because ST is a fusiform muscle with longer muscle fiber length (Eleftherios, 2018), and fusiform muscle is considered to be beneficial for muscle contraction (WOODLEY and SUSAN, 2005). The fascicle length/muscle length ratio of ST is almost doubly normalized (relative to sarcomere length), and ST has greater offset capacity and compliance compared to BF (Kellis et al., 2012). Moreover, compared with BF, ST has a relatively high proportion of fast fibers, namely, type II fibers (Smith et al., 2011), so ST can achieve faster contraction. The percentage increase in stiffness of LG was also consistently greater than that of MG, and may also be related to the type of fiber that makes up the muscle. MG usually consists of a higher proportion of type I fibers (Johnson et al., 1973), and LG consists of more type II fibers, so LG can achieve faster contraction.
In the kinetic chain theory, when we move a certain part of the body, the parts adjacent to it or far away from it will be affected to some extent, and the cooperation of many joint and muscle movements produces an overall complex movement. If muscle tension can change depending on the characteristics of a particular movement, then this may be a manifestation of the synergistic contraction of adjacent or distant muscle groups required to accomplish that movement (Krause et al., 2016). Wilke J et al. (2016) have shown that this applies to muscles in the longitudinal series of superficial back line. The superficial back line increases trunk stability by integrating tension in the body’s core and the limbs, promoting coordinated muscle contraction (Krause et al., 2016). Studies have shown that local tissue stretching generates substantial force transmission between adjacent parts that are parallel (such as the gastrocnemius and soleus) or in series (such as the hamstring and gastrocnemius) (Vleeming A et al., 1995; Thorstensson and Carlson, 1987) found in an in vivo study that the deep fascia of the gastrocnemius muscle could be displaced during pelvic movement. The study by (Vleeming et al., 1995) pointed out that GMax is anatomically connected to the ES via TLF, forming a kinetic chain that results in co-contraction of the lumbar and pelvic muscles during trunk movements. Stecco et al. (2013) extended the load transfer from the pelvis to the knee because the fascia of GMax inserts into the iliotibial band and lateral muscle septum. In this way, there may be kinetic chains between the lumbar and pelvic regions up to the knee joints. Wilke et al. (2020) found that moving the ankle during knee extension caused caudal displacement of the hamstring muscle. Snoeck et al. (2014) found that ST and gracilis (G) were crucial in forming the body kinetic chain and causing the displacement of the calf muscles. In addition, anatomical studies found that there was a fascial connection between the gastrocnemius muscle and the ST (Wilke et al., 2016). These non-local changes may be the result of coordinated muscle contractions along the kinetic chain, and the extent of long-distance motion effects caused by coordinated muscle contractions may depend on the stiffness of the continuity of the affected tissue, studying the correlation of stiffness changes can be used as an alternative test of force transmission (Mohr et al., 2023). It can be seen from the above situation that there is tissue continuity in the major muscle groups activated during IPTE training with different contraction strengths, and there is a coordinated contraction of the kinetic chain between ES, hamstring, and gastrocnemius, which is mainly manifested as ES, ST, and LG, which is consistent with the results of our previous experiment (Zhang et al., 2023).
This study explored the changes and correlations of lumbar and lower limb muscle stiffness under different IPTE contraction intensities, which provided a reference for us to understand how to train lumbar muscles more effectively and prevent injury, elucidated the coordinated contraction effect of the human kinetic chain, and clarified the adjustment strategy and mechanical behavior of muscles during trunk extension.
This study has some limitations. Firstly, because the depth of GMax exceeded the measurement threshold of MyotonPRO, we were unable to measure the hardness of GMax in this study, and we were not able to observe in vivo the role of GMax in coordinated contraction in the waist and lower limbs. Secondly, although MyotonPRO has excellent reliability in measuring muscle stiffness, its validity has not been supported by evidence. Thirdly, the current experimental results only apply to the muscle stiffness properties of young females and cannot determine the mechanical properties of muscle contraction in other populations. Future experiments will be repeated with different age and gender groups. Finally, only healthy people were included in this study, and related studies on people with low back pain will be gradually carried out in the future.
In this study, we found that ES and lower limb muscles exhibited different muscle mechanical behaviors at different contraction intensities of IPTE. Muscle stiffness showed a moderate to strong positive correlation with contraction intensity, with 30% MVIC being the optimal intensity for effective ES activation. ES and lower limb muscle have a moderate to strong correlation between the stiffness percentage change, and there were significant coordinated muscle contractions between ES, ST, and LG. In this study, we provided preliminary evidence that coordinated contraction of the lumbar and lower limb muscles occurs during isometric prone trunk extensions, which provides a further reference for us to understand the overall regulation mode of the muscle kinetic chain. In future studies, we will combine the use of other stiffness assessment methods (e.g., Magnetic Resonance Elastography, Shear Wave Elastography, or electromyography) to corroborate our findings.
The raw data supporting the conclusion of this article will be made available by the authors, without undue reservation.
The studies involving humans were approved by the ethics committee of the Guangdong Provincial Hospital of Chinese Medicine. The studies were conducted in accordance with the local legislation and institutional requirements. The participants provided their written informed consent to participate in this study. Written informed consent was obtained from the individual(s) for the publication of any potentially identifiable images or data included in this article.
YZ: Writing–original draft, Writing–review and editing. MC: Conceptualization, Investigation, Supervision, Writing–review and editing. HL: Conceptualization, Supervision, Writing–review and editing. YH: Data curation, Investigation, Writing–review and editing. YL: Data curation, Investigation, Writing–review and editing. PS: Data curation, Writing–review and editing. YC: Data curation, Writing–review and editing. JH: Supervision, Writing–review and editing. CL: Supervision, Writing–review and editing.
The author(s) declare that no financial support was received for the research, authorship, and/or publication of this article.
MyotonPro, ergometer equipment, and the experimental site used in this study were provided by the Guangzhou University of Chinese Medicine. We are grateful to the Guangzhou University of Chinese Medicine students for participating in the study as the subject.
The authors declare that the research was conducted in the absence of any commercial or financial relationships that could be construed as a potential conflict of interest.
All claims expressed in this article are solely those of the authors and do not necessarily represent those of their affiliated organizations, or those of the publisher, the editors and the reviewers. Any product that may be evaluated in this article, or claim that may be made by its manufacturer, is not guaranteed or endorsed by the publisher.
ANOVA, analysis of variance; BF, biceps femoris; ES, erector spinae; Gmax, gluteus maximus; IPTE, isometric prone trunk extension; L3, the spinous process of the third lumbar vertebra; L4, the spinous process of the fourth lumbar vertebra; LG, the lateral head of the gastrocnemius; MG, the medial head of the gastrocnemius; MVIC, maximum voluntary isometric contraction; SD, standard deviation; ST, semitendinosus; T7, the spinous process of the seventh thoracic vertebra.
Andersson E. A., Ma Z., Thorstensson A. (1998). Relative EMG levels in training exercises for abdominal and hip flexor muscles. Scand. J. rehabilitation Med. 30, 175–183. doi:10.1080/003655098444110
Arokoski J. P., Kankaanpää M., Valta T., Juvonen I., Partanen J., Taimela S., et al. (1999). Back and hip extensor muscle function during therapeutic exercises. Archives Phys. Med. Rehabilitation 80, 842–850. doi:10.1016/s0003-9993(99)90237-x
Bensamoun S. F., Glaser K. J., Ringleb S. I., Chen Q., Ehman R. L., Kn A. (2008). Rapid magnetic resonance elastography of muscle using one-dimensional projection. J. Magnetic Reson. Imaging 27, 1083–1088. doi:10.1002/jmri.21307
Bensamoun S. F., Ringleb S. I., Littrell L., Chen Q., Brennan M., Ehman R. L., et al. (2006). Determination of thigh muscle stiffness using magnetic resonance elastography. J. Magnetic Reson. Imaging 23, 242–247. doi:10.1002/jmri.20487
Bø K., Stien R. (1994). Needle EMG registration of striated urethral wall and pelvic floor muscle activity patterns during cough, Valsalva, abdominal, hip adductor, and gluteal muscle contractions in nulliparous healthy females. Neurourol. Urodyn. 13, 35–41. doi:10.1002/nau.1930130106
Cholewicki J., Vanvliet J. J. (2002). Relative contribution of trunk muscles to the stability of the lumbar spine during isometric exertions. Clin. Biomech. 17, 99–105. doi:10.1016/s0268-0033(01)00118-8
Clark B. C., Manini T. M., Mayer J. M., Ploutz-Snyder L. L., Je G. (2002). Electromyographic activity of the lumbar and hip extensors during dynamic trunk extension exercise. Archives Phys. Med. Rehabilitation 83, 1547–1552. doi:10.1053/apmr.2002.34828
Cuesta-Vargas A. I., Gonzalez-Sanchez M. (2013). Relationship of moderate and low isometric lumbar extension through architectural and muscular activity variables: a cross sectional study. BMC Med. Imaging 13, 38. doi:10.1186/1471-2342-13-38
De Blaiser C., Roosen P., Willems T., Danneels L., Bossche L. V., De Ridder R. (2018). Is core stability a risk factor for lower extremity injuries in an athletic population? A systematic review. Phys. Ther. Sport 30, 48–56. doi:10.1016/j.ptsp.2017.08.076
Eleftherios K. (2018). Intra- and inter-muscular variations in hamstring architecture and mechanics and their implications for injury: a narrative review. Sports Med. 48, 2271–2283. doi:10.1007/s40279-018-0975-4
Guo L. Y., Wang Y. L., Huang Y. H., Yang C. H., Hou Y. Y., Harn H. I., et al. (2012). Comparison of the electromyographic activation level and unilateral selectivity of erector spinae during different selected movements. Int. J. Rehabilitation Res. 35, 345–351. doi:10.1097/MRR.0b013e32835641c0
Ippersiel P., Dussault-Picard C., Mohammadyari S., De Carvalho G., Chandran V., Pal S., et al. (2023). Muscle coactivation during gait in children with and without cerebral palsy. Gait posture 108, 110–116. doi:10.1016/j.gaitpost.2023.11.012
Johnson M. A., Polgar J., Weightman D., Appleton D. (1973). Data on the distribution of fibre types in thirty-six human muscles. An autopsy study. J. Neurological Sci. 18, 111–129. doi:10.1016/0022-510x(73)90023-3
Jubany J., Busquets A., Marina M., Cos F. (2015). Reliability and validity of a custom-made instrument including a hand-held dynamometer for measuring trunk muscle strength. J. Back Musculoskelet. Rehabilitation 28, 317–326. doi:10.3233/BMR-140522
Kellis E., Galanis N., Kapetanos G. (2012). Architectural differences between the hamstring muscles. J. Electromyogr. Kinesiol. 22, 520–526. doi:10.1016/j.jelekin.2012.03.012
Kibler W. B., Press J., Sciascia A. (2006). The role of core stability in athletic function. Sports Med. 36, 189–198. doi:10.2165/00007256-200636030-00001
Kocjan A., Sarabon N. (2014). Assessment of isometric trunk strength – the relevance of body position and relationship between planes of movement. J. Sports Sci. Med. 13, 365–370.
Kocyigit B. F., Adilbekov E., Zharmenov S., Akyol A., Yessirkepov M. (2023). Evaluating the efficacy of hippotherapy: a promising intervention in rheumatology, pain medicine, and geriatrics. Rheumatol. Int. 43, 2185–2191. doi:10.1007/s00296-023-05451-x
Krause F., Wilke J., Vogt L. (2016). Intermuscular force transmission along myofascial chains: a systematic review. J. Anat. 228, 910–918. doi:10.1111/joa.12464
Lam G. W. K., Damon M., Lee W. C. C., Chen B. (2015). Reliability and asymmetry profiles of myotonometric measurements in healthy skeletal muscles. J. Nov. Physiother. 5, 245. doi:10.4172/2165-7025.1000245
Luzum N. R., Severyn A. M. H., Cassidy G., Desjardins J. D. (2023). Biomechanical comparison of human trunk and thigh muscle activity during walking and horseback riding activity. J. Bodyw. Mov. Ther. 36, 386–392. doi:10.1016/j.jbmt.2023.05.017
Mannion A. F., Dumas G. A., Cooper R. G., Espinosa F. J., Faris M. W., Stevenson J. M. (1997). Muscle fibre size and type distribution in thoracic and lumbar regions of erector spinae in healthy subjects without low back pain: normal values and sex differences. J. Anat. 190, 505–513. doi:10.1046/j.1469-7580.1997.19040505.x
Mentiplay B. F., Perraton L. G., Bower K. J., Adair B., Pua Y. H., Williams G. P., et al. (2015). Assessment of lower limb muscle strength and power using hand-held and fixed dynamometry: a reliability and validity study. Plos One 10, e0140822. doi:10.1371/journal.pone.0140822
Mohr L., Vogt L., Thiel C., Behringer M., Wilke J. (2023). Myofascial force transmission between the calf and the dorsal thigh is dependent on knee angle: an ultrasound study. Sci. Rep. 13, 3738. doi:10.1038/s41598-023-30407-3
Nordez A., GuéVEL A., Casari P., Catheline S., Cornu C. (2009). Assessment of muscle hardness changes induced by a submaximal fatiguing isometric contraction. J. Electromyogr. Kinesiol. 19, 484–491. doi:10.1016/j.jelekin.2007.11.005
Nordez A., Hug F. (2010). Muscle shear elastic modulus measured using supersonic shear imaging is highly related to muscle activity level. J. Appl. Physiology 108, 1389–1394. doi:10.1152/japplphysiol.01323.2009
Panjabi M., Abumi K., Duranceau J., Oxland T. (1989). Spinal stability and intersegmental muscle forces. A biomechanical model. Spine 14, 194–200. doi:10.1097/00007632-198902000-00008
Rosa M., Marques A., Demain S., Metcalf C., Rodrigues J. (2014). Methodologies to assess muscle co-contraction during gait in people with neurological impairment - a systematic literature review. J. Electromyogr. Kinesiol. official J. Int. Soc. Electrophysiol. Kinesiol. 24, 179–191. doi:10.1016/j.jelekin.2013.11.003
SáNCHEZ-Zuriaga D., Adams M. A. (2010). Is activation of the back muscles impaired by creep or muscle fatigue? Spine 35, 517–525. doi:10.1097/BRS.0b013e3181b967ea
San Juan J. G., Yaggie J. A., Levy S. S., Mooney V., Udermann B. E., Mayer J. M. (2005). Effects of pelvic stabilization on lumbar muscle activity during dynamic exercise. J. Strength Cond. Res. 19, 903–907. doi:10.1519/R-15684.1
Sapsford R., Hodges P., Richardson C., Cooper D., Markwell S., Jull G. (2001). Co-activation of the abdominal and pelvic floor muscles during voluntary exercises. Neurourol. urodynamics 20, 31–42. doi:10.1002/1520-6777(2001)20:1<31::aid-nau5>3.0.co;2-p
Saunders E., Clark B. C., Clark L. A., Dr G. (2020). Development of a trunk motor paradigm for use in neuroimaging. Transl. Neurosci. 11, 193–200. doi:10.1515/tnsci-2020-0116
Sawai S., Sanematsu H., Kanehisa H. (2004). Evaluation of muscular activity in daily actions. Jpn. J. Phys. Fit. Sports Med. 53, 93–106.
Skibski A., Devorski L., Orfield N., Lc M. (2023). Relationship between muscle activity and force during suspended bridge exercises. J. sport rehabilitation 32, 624–629. doi:10.1123/jsr.2022-0307
Smith L. R., Lee K. S., Ward S. R., Chambers H. G., Rl L. (2011). Hamstring contractures in children with spastic cerebral palsy result from a stiffer extracellular matrix and increasedin vivosarcomere length. J. Physiology 589, 2625–2639. doi:10.1113/jphysiol.2010.203364
Smith S., Rush J., Glaviano N. R., Murray A., Bazett-Jones D., Bouillon L., et al. (2021). Sex influences the relationship between hamstrings-to-quadriceps strength imbalance and co-activation during walking gait. Gait Posture 88, 138–145. doi:10.1016/j.gaitpost.2021.05.019
Snijders C. J., Vleeming A. (1993). Transfer of lumbosacral load to iliac bones and legs Part 1: biomechanics of self-bracing of the sacroiliac joints and its significance for treatment and exercise. Clin. Biomech. 8, 285–294. doi:10.1016/0268-0033(93)90002-Y
Snoeck O., Beyer B., Feipel V., Salvia P., Sterckx J. L., Rooze M., et al. (2014). Tendon and fascial structure contributions to knee muscle excursions and knee joint displacement. Clin. Biomech. 29, 1070–1076. doi:10.1016/j.clinbiomech.2014.08.003
Stark T., Walker B., Phillips J. K., Fejer R. (2011). Hand-held dynamometry correlation with the gold standard isokinetic dynamometry: a systematic review. Pm&R 3, 472–479. doi:10.1016/j.pmrj.2010.10.025
Stecco A., Gilliar W., Hill R., Fullerton B., Robert H. (2013). The anatomical and functional relation between gluteus maximus and fascia lata. J. Bodyw. Mov. Ther. 17, 512–517. doi:10.1016/j.jbmt.2013.04.004
Taylor A. M., Christou E. A., Enoka R. M. (2003). Multiple features of motor-unit activity influence force fluctuations during isometric contractions. J. Neurophysiology 90, 1350–1361. doi:10.1152/jn.00056.2003
Thorstensson A., Carlson H. (1987). Fibre types in human lumbar back muscles. Acta Physiol. Scand. 131, 195–202. doi:10.1111/j.1748-1716.1987.tb08226.x
Tuncay I., Kucuker H., Uzun I. (2009). The fascial band from semitendinosus to gastrocnemius: the critical point of hamstring harvesting an anatomical study of 23 cadavers. Acta Orthop. 78, 361–363. doi:10.1080/17453670710013933
Vleeming A., Pool-Goudzwaard A. L., Stoeckart R., Van Wingerden J. P., Cj S. (1995). The posterior layer of the thoracolumbar Fascia|Its function in load transfer from spine to legs. Spine 20, 753–758. doi:10.1097/00007632-199504000-00001
Waiteman M. C., Chia L., Ducatti M. H. M., Bazett-Jones D. M., Pappas E., De Azevedo F. M., et al. (2022). Trunk biomechanics in individuals with knee disorders: a systematic review with evidence gap map and meta-analysis. Sports Med. - Open 8, 145. doi:10.1186/s40798-022-00536-6
Wang C. Z., Guo J. Y., Li T. J., Zhou Y., Shi W., Yp Z. (2017). Age and sex effects on the active stiffness of vastus intermedius under isometric contraction. BioMed Res. Int. 2017, 9469548–9469616. doi:10.1155/2017/9469548
Wilke J., Debelle H., Tenberg S., Dilley A. (2020). Ankle motion is associated with soft tissue displacement in the dorsal thigh: an in vivo investigation suggesting myofascial force transmission across the knee joint. Front. Physiology 11, 180. doi:10.3389/fphys.2020.00180
Wilke J., Krause F., Vogt L. (2016). What is evidence-based about myofascial chains: a systematic review. Archives Phys. Med. Rehabilitation 97, 454–461. doi:10.1016/j.apmr.2015.07.023
Woodley S. J., Susan R. M. (2005). Hamstring muscles: architecture and innervation. Cells Tissues Organs 179, 125–141. doi:10.1159/000085004
Yang Z. D., Hua Y. F. (2023). Confirmation of the third lumbar transverse process syndrome by clinical treatment and magnetic resonance imaging: a case description. Quantitative Imaging Med. Surg. 13, 1260–1263. doi:10.21037/qims-22-520
Keywords: MyotonPRO, erector spinae, stiffness, isometric prone trunk extension, coordinated contraction
Citation: Zhang Y, Chen M, Liu H, He Y, Li Y, Shen P, Chen Y, Huang J and Liu C (2024) Effect of different isometric trunk extension intensities on the muscle stiffness of the lumbar and lower limbs. Front. Physiol. 14:1337170. doi: 10.3389/fphys.2023.1337170
Received: 12 November 2023; Accepted: 15 December 2023;
Published: 04 January 2024.
Edited by:
Francis Degache, AudioVitality, SwitzerlandCopyright © 2024 Zhang, Chen, Liu, He, Li, Shen, Chen, Huang and Liu. This is an open-access article distributed under the terms of the Creative Commons Attribution License (CC BY). The use, distribution or reproduction in other forums is permitted, provided the original author(s) and the copyright owner(s) are credited and that the original publication in this journal is cited, in accordance with accepted academic practice. No use, distribution or reproduction is permitted which does not comply with these terms.
*Correspondence: Jiapeng Huang, a2ZoanBAZ3p1Y20uZWR1LmNu; Chunlong Liu, bGNsMDVtcHRAZ3p1Y20uZWR1LmNu
Disclaimer: All claims expressed in this article are solely those of the authors and do not necessarily represent those of their affiliated organizations, or those of the publisher, the editors and the reviewers. Any product that may be evaluated in this article or claim that may be made by its manufacturer is not guaranteed or endorsed by the publisher.
Research integrity at Frontiers
Learn more about the work of our research integrity team to safeguard the quality of each article we publish.