 Charlotte Tacke
 Anne M. Bischoff
 Ali Harb
 Behnam Vafadari
 Swen Hülsmann
- Department of Anesthesiology, University Medical Center Göttingen, Göttingen, Germany
The neuronal activity in the respiratory network strongly depends on a variety of different neuromodulators. Given the essential role of astrocytes in stabilizing respiratory network activity generated by neurons in the preBötzinger complex (preBötC), our aim was to investigate astrocytic calcium signaling in the working heart brainstem preparation using fiber-optical imaging. By using transgenic mice that express GCaMP6s specifically in astrocytes, we successfully recorded astrocytic calcium signals in response to norepinephrine from individual astrocytes.
Introduction
Respiratory neurons in the ventrolateral medulla are closely intertwined with astrocytes that play an important role in stabilizing the autonomous activity of this network (Hulsmann et al., 2000; Grass et al., 2004; Schnell et al., 2011; Sheikhbahaei et al., 2018; Tacke et al., 2023). Astrocytes provide essential support to the neuronal network by controlling neurotransmitter homeostasis, ensuring proper neurotransmission (Gomeza et al., 2003; Szoke et al., 2006; Eulenburg and Hülsmann, 2022). Furthermore, various neuromodulators evoke intracellular calcium elevations in astrocytes, which may impact respiratory activity in turn (Funk et al., 2008; Härtel et al., 2009; Huxtable et al., 2010; Schnell et al., 2016). However, whether spontaneous calcium activity influences or drives respiratory neuronal activity is still a subject of ongoing discussion (Schnell et al., 2011; Okada et al., 2012; Oku et al., 2016; Tacke et al., 2023). Here, we built and tested a fiber optical setup to record and analyze astrocytic calcium signaling in the intact respiratory network of the working heart brainstem preparation. One aim of the study was to test whether calcium signals from individual astrocytes can be recorded with an imaging fiber.
Materials and methods
Breeding of mice
Animals were hosted and bred in the animal facilities of the University Hospital Göttingen. This study was carried out in accordance with the guidelines for the welfare of experimental animals issued by the European Communities Council Directive (2010/63/EU) and with the German Protection of Animals Act (Tierschutzgesetz; TierSchG). All procedures were approved by the Niedersächsische Landesamt für Verbraucherschutz und Lebensmittelsicherheit (LAVES).
Induction of GCaMP6s expression in astrocytes
For calcium imaging, we used Aldh1l1-GCaMP6s mice [Tg (Aldhll1-cre/ERT2)02Kan; 129S-B6J.Cg-Gt (ROSA)26SorTM96(CAG−GCaMP6s)He/MwarJ], which allow for conditional and tamoxifen-inducible expression of GCaMP6s in astrocytes (Madisen et al., 2015; Winchenbach et al., 2016; Tacke et al., 2023). These mice were crossbred to receive double transgenic offsprings. Mice were between 9 and 20 months old, either heterozygous or homozygous for the Cre-recombinase and homozygous for the floxed-GCaMP6s-gene. For induction of GCaMP6s expression mice were intraperitoneally injected with tamoxifen (10 mg/mL dissolved in corn oil, 100 mg/kg body weight) once a day for two to five consecutive days at least 14 days prior to experiments. Additionally, mice that express EGFP under the control of the hGFAP-promoter (TgN (GFAP-EGFP)GFEC-FKi) were used for initial tests of the resolution and quality of the imaging system.
Working heart brainstem preparation
Experiments were performed in the acute working heart brainstem preparation (WHBP, Paton, 1996; Paton et al., 2022). After an overdose of isoflurane anesthesia, confirmation of apnea and the absence of the nociceptive withdrawal reflex, they were bisected below the diaphragm for exsanguination. Furthermore, the cerebellum was removed and a decerebration at the parafollicular level was performed. The descending aorta was cannulated and retrogradely perfused at a flow rate of 16–20 mL/min using a peristaltic pump (Watson Marlow) with carbogen-saturated (95% O2, 5% CO2) artificial perfusion medium: The composition of the solution was (in mM): 125 NaCl; 25 NaHCO3; 2.5 CaCl2; 1.25 MgSO4; 1.25 KH2PO4; 5 KCl; 10 glucose, pH 7.4 at 32°C. For the optimization of the osmotic pressure the oncotic agent Ficoll (1.25%; Sigma–Aldrich) was supplemented. The perfusion pressure was monitored using the second lumen of the double-lumen perfusion catheter. The preparation was placed in a recording chamber and at the beginning of the experiment, the flow of the perfusate was adjusted to observe uniform phrenic nerve discharges. Thereafter, no further adjustment was allowed. A thoracic phrenic nerve (PN) was prepared and phrenic nerve activity (PNA) was recorded using a custom-made borosilicate glass suction electrode. PNA signals were amplified and band-pass filtered (0.25–2 kHz) using a custom-made amplifier (electronic workshop of the department of physiology, Göttingen). Signals were digitized by a PowerLab 8/30 (AdInstruments) and stored on a windows 10 PC.
Design of the fiber optical imaging setup and calcium measurements
The fiber scope was assembled from parts of the LINOS® Microbench system (Excelitas Technologies), the Thorlabs 30 mm Cage and SM1 Lens tube systems (Thorlabs; see Figure 1; Table 1). Two collimated LEDs, 470 nm (KSL-70; Rapp Optoelectronics) and 405 nm (M405L4–405 nm; LA1951-A; Thorlabs) were coupled to the scope via a Compact 30 mm Cage Cube (Thorlabs) using a long pass dichroic mirror (425 nm Cut-On; DMLP425R Thorlabs). Excitation light was filtered by bandpass filters BP470-40 (Zeiss) and FB410-10 (Thorlabs), respectively and coupled into the emission path via a HC BS 495 Beamsplitter (Semrock) mounted in a kinematic 30 mm Cage Cube (Thorlabs). The emitted light was band pass filtered (525/50 ET Bandpass; Chroma). The image of the fiber was projected to an emCCD camera with 128 × 128 pixels (Ixon 860, Andor) via a tube lens (Thorlabs, L1608-A; f = 75.0 mm) and a zoomable video adapter (0.5x to 2.4x; Zeiss; 452984-0000-000, Zoom 44, ENG 1/2”). The mechanical adapter for connecting the camera to the zoom was custom made by the workshop of the university medical center. The imaging fiber FIGH-016-160S (Fujikura) with 1,600 picture elements (Figure 1C) was focused with ×20 objective (EC Plan-Neofluar ×20/0,50, Zeiss) using a LINOS® Microbench Z-Fine adjustment Tool M and centered to the optical path through a fiber optic adapter (N12.5 FC) and a fle.X-plate XY Steel (Excelitas Technologies).
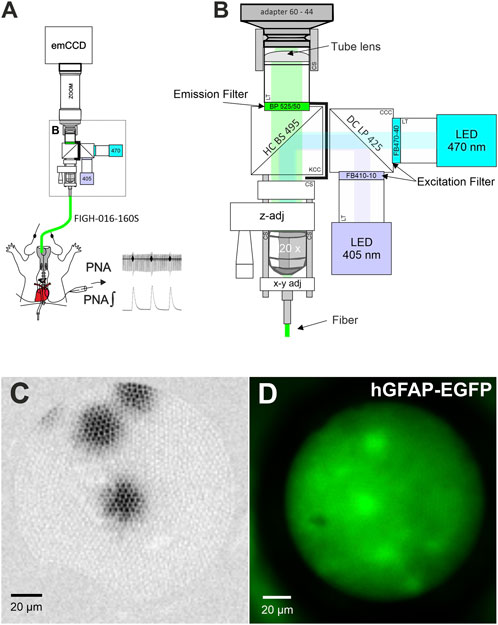
FIGURE 1. A fiber optical setup for imaging. (A) Schematic drawing of the fiber scope setup used with the working heart brainstem preparation. (B) Magnified view of core of the fiber scope. z-adj: The LINOS Microbench Z-Fine adjustment Tool is used to focus just above the surface of the imaging core of the fiber. y-x adj: The fiber can be centered on the CCD-chip using a fle.X-plate (Excelitas Technologies). See Table 1 for details of major parts. Adapter 60–44: video adapter (Zeiss); LT: lens tube system parts; CS: 30 mm cage system component; HC BS 495 and DC LP 425: Dichroic mirrors (beam splitter); CS: Lens Tube Flexure Sleeve Coupler; CCC: compact cage cube; KCC: kinematic cage cube (Thorlabs). Graphic is not to scale. (C) Image from three 10 µm fluorescent microspheres for demonstration of the image quality. (D) Image of astrocytes in a WHBP from a transgenic mouse expressing EGFP under the control of the human GFAP promotor [Tgn (hGFAP-EGFP)].
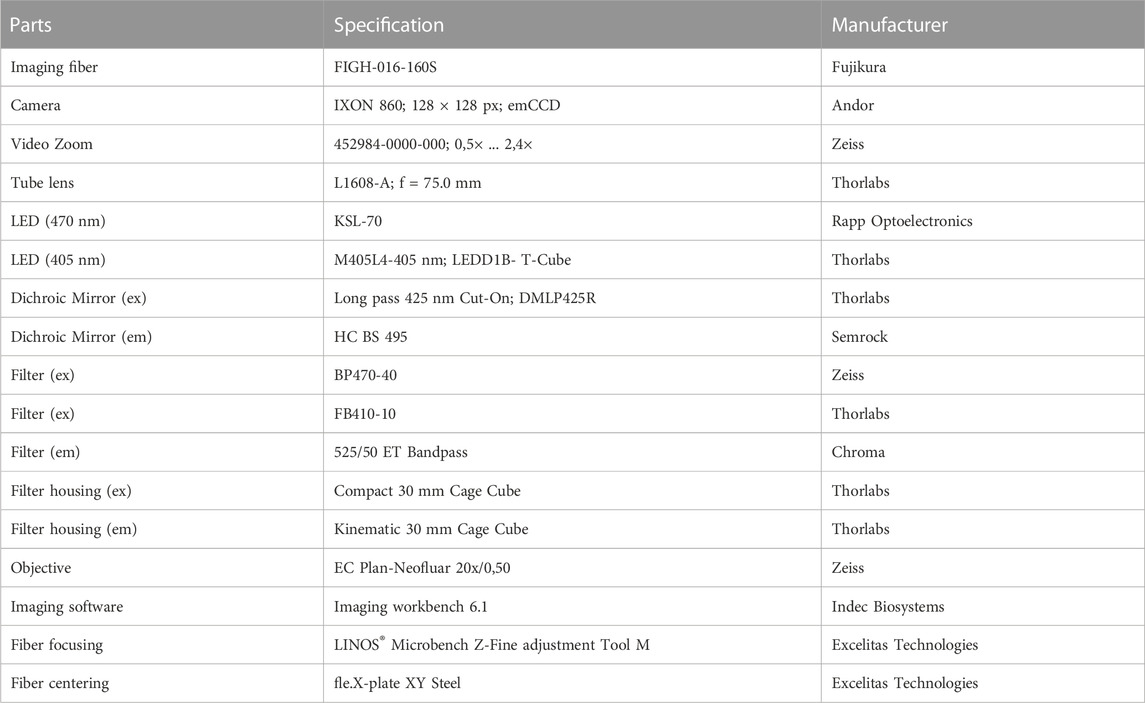
TABLE 1. List of major parts that were used to assemble the fiber scope.
GCaMP6s was excited with two wavelengths: 470 nm was used for the Ca2+-dependent signal and 405 nm for the Ca2+-independent isosbestic control measurements (Kim et al., 2016). For wavelength control and image acquisition, Imaging Workbench 6.1 (Indec Biosystems) was used and ratio image pairs were captured at approximately 8 Hz. The Software controlled the LED drivers (KSL-70 for the 470 nm LED and LEDD1B-T-Cube for the 405 nm LED, respectively) via a TTL signal provided by the parallel out of a Windows 10 PC. Image sampling time was set to 40 ms.
For positioning the bare end of the fiber in the ventral respiratory column (VRC), we used a modified “InVivo Neuro Pixels Junior unit” micromanipulator (Luigs&Neumann). Since the cerebellum was removed, the fourth ventricle and the obex were used as landmarks for navigating the fiber to the VRC based on the information from the mouse brain atlas (Paxinos et al., 1985). First the fiber was placed on the surface of the dorsal medulla (1-1.5 µm rostral to the obex, 1.2-1.5 µm lateral to the midline) and then carefully advanced vertically into tissue to find fluorescence (1-1.5 µm).
Fiber size determination
For infinity corrected ×20 Zeiss objectives, the magnification of the objective is 20 if the focal length (f) of the tube lens is 164.5 mm. However, we used a tube lens with a focal length of 75 mm, therefore the magnification of the objective was ×9.1. The total magnification of the system further depends on the magnification of zoomable video adapter, which can be changed from 0.5x to 2.4x. Thus, the range of the magnification of the system can be changed between ×4.6 and ×21.9. The IXON camera has 128 × 128 pixel with a pixel size of 24 × 24 µm. Therefore, the field of view of the camera can be changed stepless between 140.4 × 140.4 µm and 673.8 × 673.8 µm. Based on this information, image circle diameter of the fiber can be measured. The fiber in our experiment had an image circle diameter of 143 µm.
We used Fluoresbrite® Yellow Green Microspheres (10 μm; Polysciences) to confirm that the illumination spot was sufficiently large to fill the entire fiber (Figure 1C). Additionally, we tested the system with EGFP-labeled astrocytes to confirm single cell resolution. (Figure 1D).
Drugs
Electrolytes for perfusion solution (see above) were purchased from Sigma-Aldrich (Taufkirchen, Germany) or Merck chemicals (Darmstadt, Germany), Tamoxifen, Ficoll® 70 and norepinephrine from Sigma-Aldrich.
Data analysis
Image series were stored on a PC in the original format (.axi) of the imaging workbench software (Indec Biosystems). The ratio images were exported to tiff-format and 3D median filtered (3x 3x 5x) using the Fiji distribution of ImageJ (Schindelin et al., 2012). The ROI-manager tool was used to analyze the fluorescent signal from the entire image core of the fiber (regions of interest (ROI) diameter = 143 µm) or from individual cells (ROI diameter <20 µm). Ratio image data is given as arbitrary units (a.u.). For graphical presentation, the timing of image acquisition was exported to txt-format from the statistics window of imaging workbench and imported to IGOR Pro software (WaveMetrics). Figures were assembled using CorelDraw (Corel Corporation).
Data are expressed as mean ± SD. Statistical comparison was performed with the SigmaPlot software (Systat). Statistical significance (Mann-Whitney Rank Sum Test) was assumed if p < 0.05.
Results
To induce reliable calcium signals in astrocytes, 10 µM norepinephrine (NE) was added to the perfusion. NE induced an increase of the apparent perfusion pressure (aPP) of 49.4 ± 26.3 mmHg (n = 11). Additionally, there was also a variable increase of the phrenic nerve activity (PNA) with larger amplitudes and an increase of the respiratory rate (Figures 2, 3). The peak of the PNA-response followed the initial increase of the aPP after 104.7 ± 5.2 s (n = 11). In four recordings, the increase of the aPP was accompanied by a short period of reduced PN activity (Figure 2).
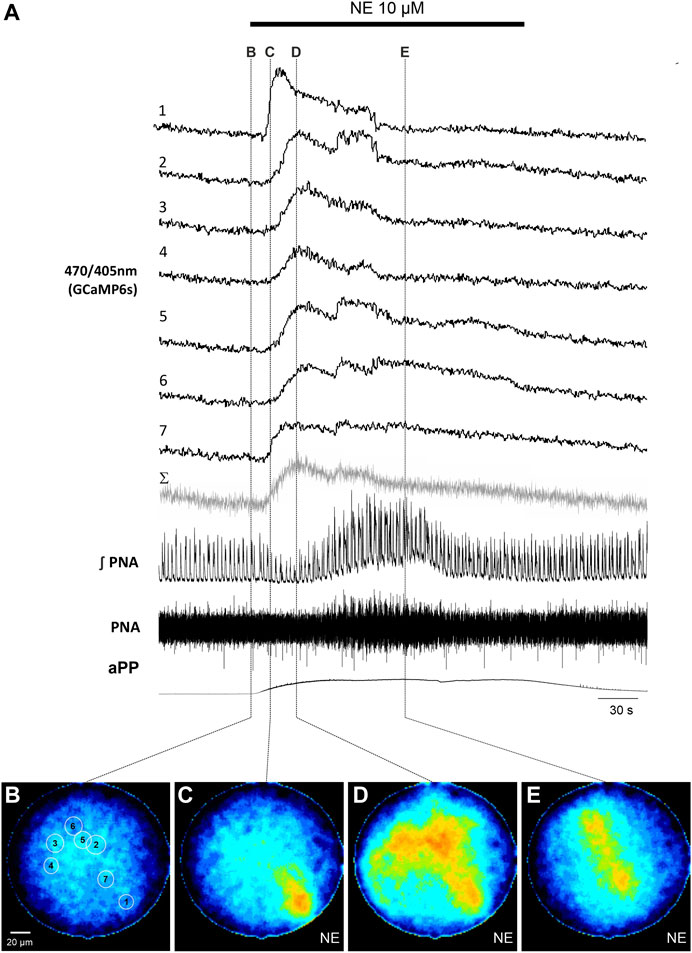
FIGURE 2. Norepinephrine (NE)-induced calcium signals in astrocytes in the WHBP. (A) Original traces from the 7 cells [circular ROI, see (B)] together with phrenic signal (integral and raw) and the apparent perfusion pressure (aPP). The gray trace (Σ) represents the summated signal across the entire fiber. The bar indicates the time NE was applied to the perfusate. (B–E) False color coded 470/405 nm ratio images at different time points before (B) and after (C–E) the application of NE (10 µM). Note: The withdrawal of NE from the circulation can be nicely monitored by the drop of the perfusion pressure.
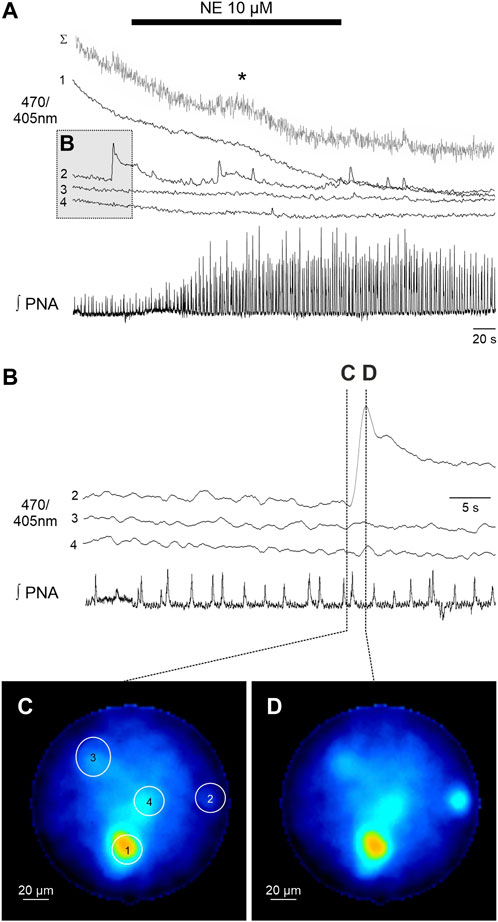
FIGURE 3. Spontaneous calcium signals in astrocytes recorded with the fiber microscope in the WHBP. (A) Original GCaMP6s measurements of 4 individual astrocytes (470/405 nm) together with phrenic signal (integral). The gray trace (Σ) represents the summated signal across the entire fiber. Cell 2 shows spontaneous calcium signals, while in summated signal a delayed response (*) to norepinephrine (NE 10 µM) is visible. (B) Detailed representation of the calcium signal of cells two to four prior to the administration of NE. Note that there are no calcium signals in phase with the PNA inspiratory burst. (C,D) False color coded 470/405 nm ratio images at different time points before (C) and during (D) the spontaneous calcium signal of cell 2.
Analysis of the emission of the full image core of the fiber revealed an increase of the calcium activity of the 470/405 nm ratio signal in 10 out of 11 recordings/preparations. Interestingly, the astrocytic calcium rise preceded the increase of PNA in 8 preparations (average delay 57.1 ± 21.0 s; p = 0.008; Mann-Whitney Rank Sum Test).
In a second step we analyzed the calcium responses in more detail. In 4 of the preparations individual cells could be identified by their individual, non-uniform calcium signaling (Figures 2, 3). Since the individual signals show different timing and duration, we assume that these signals represent the calcium response of individual cells. It is important to note that these individual signals are clearly distinguishable from the integrated emission of the full fiber (gray trace in Figures 2A, 3A). Furthermore, in 2 preparations the analysis of the different cells revealed spontaneous calcium signals in individual cells (Figure 3). Calcium signals that were phase locked to the inspiratory phrenic bursts were not observed (Figure 3).
Discussion
In this paper, we were able to prove that calcium imaging of astrocytes in the working heart brainstem preparation is possible by using a commercially available imaging fiber and a custom-made fiber-coupled microscope. It was possible to discern NE-induced and spontaneous calcium signals from individual cells. Furthermore, we also showed that NE-induced calcium signals in astrocytes precede the NE-induced increase of the respiratory network activity, which has been described in rodents (Viemari, 2008).
Recording calcium signals from individual cells represents a clear advantage compared to the classical fiber photometry, which can only capture ‘bulk’ or population-level calcium (Ca2+) activity (Gunaydin et al., 2014). This is particularly important when analyzing spontaneous astrocytic signals, which might not be detected in the bulk signal (see Figure 3).
Interestingly, in four of the experiments there was a short period of a reduced PNA, which started simultaneously with the NE-induced increase of the perfusion pressure (aPP). Activation of arterial baroreceptors by the elevated aPP or directly by NE (Holmes and Ledsome, 1984), would negatively modulate the network in the VRC (Simms et al., 2007; Barnett et al., 2021). After adaptation of the baroreflex, the neuron-mediated stimulation of the network by NE will become dominant (Zanella et al., 2014; Tacke et al., 2023). Further experiments are required to test if the depression is eventually a response of the network to the astrocytic calcium rise and release of an inhibitory gliotransmitter (Gourine et al., 2010; Forsberg et al., 2017).
In response to NE, individual cells showed different delay and signal duration. These signals result most likely from the soma of the astrocyte, since it is known that NE induces strong somatic calcium-signals (Schnell et al., 2016). However, with the fiber imaging system we were not able to discriminate between different parts of the cells, thus making it impossible to distinguish calcium signals of processes from somata of individual cells. Thus, during the peak of the NE-response (Figure 2D), we observe a rather blurred image consisting of the overlapping calcium signals in somata and processes of neighboring astrocytes. Indeed, subcellular structures were not visible in the hGFAP-EGFP mice, in which high baseline fluorescence usually allows this discrimination using epifluorescence or 2P-imaging (Grass et al., 2004; Hirrlinger et al., 2004). Norepinephrine was applied to the perfusate and therefore reached the medulla via the blood stream. We cannot exclude that the perfusion with the artificial solution is altering the blood brain barrier (BBB) integrity, but even if this was intact, it is known that brain capillary endothelial cells and astrocytes express norepinephrine transporter that allow NE to enter the brain (Wakayama et al., 2002; Inazu et al., 2003; Schnell et al., 2016). The apparent delay between the vascular response and the astrocytic calcium signal is in favor of an intact BBB.
We used a ratiometric approach for the calcium imaging with two wavelengths for excitation. 470 nm allows the detection of calcium-induced fluorescence change and 405 nm, which is very close to the isosbestic point of GCaMP6s (Dana et al., 2019). Under baseline condition, individual cells, however, were not always distinguishable (Figure 2B) but appeared only after application of NE (Figure 2). One reason is probably that the lateral resolution is limited by the size of the fiber cores (2 µm). Since at its isosbestic point the emission of GCaMP6s (Ca2+-free or Ca2+-saturated) is below 10% of the maximal fluorescence of the Ca2+-saturated GCaMP6 at 470 nm (Dana et al., 2019), low baseline calcium levels might not be detectable. Thus, it can be concluded that the fiber imaging setup requires a higher signal to noise ratio for the detection of (baseline) calcium levels as e.g., two-photon imaging, where most astrocytes are visible at rest (Tacke et al., 2023). One possible source of noise is autofluorescence of the imaging fiber (Udovich et al., 2008). The transmissibility (t) of the fiber and the objective (t @410 nm 83.8% vs. t @470 nm 89.9%), however, should not be a limitation. Nevertheless, we could prove that NE-induced as well as spontaneous calcium signals can be recorded with the setup.
The imaging fiber has a relatively short working distance <100 µm (Feng et al., 2022), thus, the fiber has to be inserted into the tissue and could potentially damage critical structures. We cannot exclude that this manipulation induces calcium signals in astrocytes (see high baseline signal in cell 1, Figure 3A) in response to the mechanical stimulus (Lee et al., 2015). For this project, we limited the size of the imaging fiber to an outer diameter of about 200 µm to minimize the impact of the fiber when inserting into the tissue to reach the ventral respiratory column. Further trials with larger fibers and a higher number of cores need to be tested.
Conclusion
Utilizing an imaging fiber enables the measurement of calcium signals from individual astrocytes. This is particularly valuable when analyzing spontaneous calcium signals, which can be very heterogeneous in astrocytes (Schnell et al., 2011). Although the spatial resolution of the imaging fiber system is not as high as that for our two-photon microscope in acute brains slices (Schnell et al., 2016; Tacke et al., 2023), it allows deep tissue recordings in a complex preparation, such as the WHBP, where the complex intricate circuitry of the respiratory network remains intact.
Data availability statement
The raw data supporting the conclusion of this article will be made available by the authors, without undue reservation.
Ethics statement
The animal study was approved by Niedersächsische Landesamt für Verbraucherschutz und Lebensmittelsicherheit (LAVES). The study was conducted in accordance with the local legislation and institutional requirements.
Author contributions
SH designed the experiments. CT, AB, and SH performed experiments. SH analyzed the data, prepared the figures, and wrote the main manuscript. CT, SH, AH, and BV interpreted and discussed the data, edited, and revised the manuscript. SH supervised the project. All authors contributed to the article and approved the submitted version.
Funding
The work was supported by the “Deutsche Forschungsgemeinschaft” through personal grants to SH (Hu797/12-1 and 13-1). We acknowledge support by the Open Access Publication Funds of the Göttingen University.
Acknowledgments
We especially thank A.-A. Grützner for technical help and mouse genotyping. The authors are grateful to G.G. Hanekop for support and G. Saher (Göttingen) for providing mice that founded the breeding of the transgenic mice used for our experiments.
Conflict of interest
The authors declare that the research was conducted in the absence of any commercial or financial relationships that could be construed as a potential conflict of interest.
Publisher’s note
All claims expressed in this article are solely those of the authors and do not necessarily represent those of their affiliated organizations, or those of the publisher, the editors and the reviewers. Any product that may be evaluated in this article, or claim that may be made by its manufacturer, is not guaranteed or endorsed by the publisher.
References
Barnett, W. H., Baekey, D. M., Paton, J. F. R., Dick, T. E., Wehrwein, E. A., and Molkov, Y. I. (2021). Heartbeats entrain breathing via baroreceptor-mediated modulation of expiratory activity. Exp. Physiol. 106, 1181–1195. doi:10.1113/EP089365
Dana, H., Sun, Y., Mohar, B., Hulse, B. K., Kerlin, A. M., Hasseman, J. P., et al. (2019). High-performance calcium sensors for imaging activity in neuronal populations and microcompartments. Nat. Methods 16, 649–657. doi:10.1038/s41592-019-0435-6
Eulenburg, V., and Hülsmann, S. (2022). Synergistic control of transmitter turnover at glycinergic synapses by GlyT1, GlyT2, and ASC-1. Int. J. Mol. Sci. 23, 2561. doi:10.3390/ijms23052561
Feng, H., Zhu, R., Chen, Y., and Xu, F. (2022). Lensless fiber imaging with long working distance based on active depth measurement. IEEE Trans. Instrum. Meas. 71, 1–7. doi:10.1109/tim.2022.3160530
Forsberg, D., Ringstedt, T., and Herlenius, E. (2017). Astrocytes release prostaglandin E2 to modify respiratory network activity. Elife 6, e29566. doi:10.7554/eLife.29566
Funk, G. D., Huxtable, A. G., and Lorier, A. R. (2008). ATP in central respiratory control: a three-part signaling system. Respir. Physiol. Neurobiol. 164, 131–142. doi:10.1016/j.resp.2008.06.004
Gomeza, J., Hulsmann, S., Ohno, K., Eulenburg, V., Szoke, K., Richter, D., et al. (2003). Inactivation of the glycine transporter 1 gene discloses vital role of glial glycine uptake in glycinergic inhibition. Neuron 40, 785–796. doi:10.1016/s0896-6273(03)00672-x
Gourine, A. V., Kasymov, V., Marina, N., Tang, F., Figueiredo, M. F., Lane, S., et al. (2010). Astrocytes control breathing through pH-dependent release of ATP. Science 329, 571–575. doi:10.1126/science.1190721
Grass, D., Pawlowski, P. G., Hirrlinger, J., Papadopoulos, N., Richter, D. W., Kirchhoff, F., et al. (2004). Diversity of functional astroglial properties in the respiratory network. J. Neurosci. 24, 1358–1365. doi:10.1523/JNEUROSCI.4022-03.2004
Gunaydin, L. A., Grosenick, L., Finkelstein, J. C., Kauvar, I. V., Fenno, L. E., Adhikari, A., et al. (2014). Natural neural projection dynamics underlying social behavior. Cell 157, 1535–1551. doi:10.1016/j.cell.2014.05.017
Härtel, K., Schnell, C., and Hülsmann, S. (2009). Astrocytic calcium signals induced by neuromodulators via functional metabotropic receptors in the ventral respiratory group of neonatal mice. Glia 57, 815–827. doi:10.1002/glia.20808
Hirrlinger, J., Hulsmann, S., and Kirchhoff, F. (2004). Astroglial processes show spontaneous motility at active synaptic terminals in situ. Eur. J. Neurosci. 20, 2235–2239. doi:10.1111/j.1460-9568.2004.03689.x
Holmes, A. E., and Ledsome, J. R. (1984). Effect of norepinephrine and vasopressin on carotid sinus baroreceptor activity in the anesthetized rabbit. Experientia 40, 825–827. doi:10.1007/BF01951973
Hulsmann, S., Oku, Y., Zhang, W., and Richter, D. W. (2000). Metabolic coupling between glia and neurons is necessary for maintaining respiratory activity in transverse medullary slices of neonatal mouse. Eur. J. Neurosci. 12, 856–862. doi:10.1046/j.1460-9568.2000.00973.x
Huxtable, A. G., Zwicker, J. D., Alvares, T. S., Ruangkittisakul, A., Fang, X., Hahn, L. B., et al. (2010). Glia contribute to the purinergic modulation of inspiratory rhythm-generating networks. J. Neurosci. 30, 3947–3958. doi:10.1523/JNEUROSCI.6027-09.2010
Inazu, M., Takeda, H., and Matsumiya, T. (2003). Functional expression of the norepinephrine transporter in cultured rat astrocytes. J. Neurochem. 84, 136–144. doi:10.1046/j.1471-4159.2003.01514.x
Kim, C. K., Yang, S. J., Pichamoorthy, N., Young, N. P., Kauvar, I., Jennings, J. H., et al. (2016). Simultaneous fast measurement of circuit dynamics at multiple sites across the mammalian brain. Nat. Methods 13, 325–328. doi:10.1038/nmeth.3770
Lee, J., Chun, Y. E., Han, K. S., Lee, J., Woo, D. H., and Lee, C. J. (2015). Ca(2+) entry is required for mechanical stimulation-induced ATP release from astrocyte. Exp. Neurobiol. 24, 17–23. doi:10.5607/en.2015.24.1.17
Madisen, L., Garner, A. R., Shimaoka, D., Chuong, A. S., Klapoetke, N. C., Li, L., et al. (2015). Transgenic mice for intersectional targeting of neural sensors and effectors with high specificity and performance. Neuron 85, 942–958. doi:10.1016/j.neuron.2015.02.022
Okada, Y., Sasaki, T., Oku, Y., Takahashi, N., Seki, M., Ujita, S., et al. (2012). Preinspiratory calcium rise in putative pre-Botzinger complex astrocytes. J. Physiol. 590, 4933–4944. doi:10.1113/jphysiol.2012.231464
Oku, Y., Fresemann, J., Miwakeichi, F., and Hulsmann, S. (2016). Respiratory calcium fluctuations in low-frequency oscillating astrocytes in the pre-Botzinger complex. Respir. Physiol. Neurobiol. 226, 11–17. doi:10.1016/j.resp.2015.02.002
Paton, J. F. (1996). A working heart-brainstem preparation of the mouse. J. Neurosci. Methods 65, 63–68. doi:10.1016/0165-0270(95)00147-6
Paton, J. F. R., Machado, B. H., Moraes, D. J. A., Zoccal, D. B., Abdala, A. P., Smith, J. C., et al. (2022). Advancing respiratory-cardiovascular physiology with the working heart-brainstem preparation over 25 years. J. Physiol. 600, 2049–2075. doi:10.1113/JP281953
Paxinos, G., Watson, C., Pennisi, M., and Topple, A. (1985). Bregma, lambda and the interaural midpoint in stereotaxic surgery with rats of different sex, strain and weight. J. Neurosci. Methods 13, 139–143. doi:10.1016/0165-0270(85)90026-3
Schindelin, J., Arganda-Carreras, I., Frise, E., Kaynig, V., Longair, M., Pietzsch, T., et al. (2012). Fiji: an open-source platform for biological-image analysis. Nat. Methods 9, 676–682. doi:10.1038/nmeth.2019
Schnell, C., Fresemann, J., and Hulsmann, S. (2011). Determinants of functional coupling between astrocytes and respiratory neurons in the pre-Botzinger complex. PLoS One 6, e26309. doi:10.1371/journal.pone.0026309
Schnell, C., Negm, M., Driehaus, J., Scheller, A., and Hulsmann, S. (2016). Norepinephrine-induced calcium signaling in astrocytes in the respiratory network of the ventrolateral medulla. Respir. Physiol. Neurobiol. 226, 18–23. doi:10.1016/j.resp.2015.10.008
Sheikhbahaei, S., Turovsky, E. A., Hosford, P. S., Hadjihambi, A., Theparambil, S. M., Liu, B., et al. (2018). Astrocytes modulate brainstem respiratory rhythm-generating circuits and determine exercise capacity. Nat. Commun. 9, 370. doi:10.1038/s41467-017-02723-6
Simms, A. E., Paton, J. F., and Pickering, A. E. (2007). Hierarchical recruitment of the sympathetic and parasympathetic limbs of the baroreflex in normotensive and spontaneously hypertensive rats. J. Physiol. 579, 473–486. doi:10.1113/jphysiol.2006.124396
Szoke, K., Hartel, K., Grass, D., Hirrlinger, P. G., Hirrlinger, J., and Hulsmann, S. (2006). Glycine transporter 1 expression in the ventral respiratory group is restricted to protoplasmic astrocytes. Brain Res. 1119, 182–189. doi:10.1016/j.brainres.2006.08.089
Tacke, C., Bischoff, A. M., Harb, A., Vafadari, B., and Hulsmann, S. (2023). Angiotensin II increases respiratory rhythmic activity in the preBotzinger complex without inducing astroglial calcium signaling. Front. Cell Neurosci. 17, 1111263. doi:10.3389/fncel.2023.1111263
Udovich, J. A., Kirkpatrick, N. D., Kano, A., Tanbakuchi, A., Utzinger, U., and Gmitro, A. F. (2008). Spectral background and transmission characteristics of fiber optic imaging bundles. Appl. Opt. 47, 4560–4568. doi:10.1364/ao.47.004560
Viemari, J. C. (2008). Noradrenergic modulation of the respiratory neural network. Respir. Physiol. Neurobiol. 164, 123–130. doi:10.1016/j.resp.2008.06.016
Wakayama, K., Ohtsuki, S., Takanaga, H., Hosoya, K., and Terasaki, T. (2002). Localization of norepinephrine and serotonin transporter in mouse brain capillary endothelial cells. Neurosci. Res. 44, 173–180. doi:10.1016/s0168-0102(02)00120-7
Winchenbach, J., Duking, T., Berghoff, S. A., Stumpf, S. K., Hulsmann, S., Nave, K. A., et al. (2016). Inducible targeting of CNS astrocytes in Aldh1l1-CreERT2 BAC transgenic mice. F1000Res 5, 2934. doi:10.12688/f1000research.10509.1
Zanella, S., Doi, A., Garcia, A. J., Elsen, F., Kirsch, S., Wei, A. D., et al. (2014). When norepinephrine becomes a driver of breathing irregularities: how intermittent hypoxia fundamentally alters the modulatory response of the respiratory network. J. Neurosci. 34, 36–50. doi:10.1523/JNEUROSCI.3644-12.2014
Keywords: glia, catecholaminergic signaling, neuronal control of breathing, norephinephrine, brainstem
Citation: Tacke C, Bischoff AM, Harb A, Vafadari B and Hülsmann S (2023) Fiber optical imaging of astroglial calcium signaling in the respiratory network in the working heart brainstem preparation. Front. Physiol. 14:1237376. doi: 10.3389/fphys.2023.1237376
Received: 09 June 2023; Accepted: 10 August 2023;
Published: 24 August 2023.
Edited by:
Alfredo J. Garcia, The University of Chicago, United StatesReviewed by:
Robert Timothy Richard Huckstepp, University of Warwick, United KingdomDavi J. A. Moraes, University of São Paulo, Brazil
Copyright © 2023 Tacke, Bischoff, Harb, Vafadari and Hülsmann. This is an open-access article distributed under the terms of the Creative Commons Attribution License (CC BY). The use, distribution or reproduction in other forums is permitted, provided the original author(s) and the copyright owner(s) are credited and that the original publication in this journal is cited, in accordance with accepted academic practice. No use, distribution or reproduction is permitted which does not comply with these terms.
*Correspondence: Swen Hülsmann, c2h1ZWxzbTJAdW5pLWdvZXR0aW5nZW4uZGU=