 Yaohui Huang
 Zhikai Ni3
- 1College of Electronic Information, Guangxi Minzu University, Nanning, China
- 2Laboratory of Intelligent Information Processing and Intelligent Medical, Guangxi Minzu University, Nanning, China
- 3Department of Electronic Science, Xiamen University, Xiamen, China
Background and aims: Blood glucose prediction (BGP) has increasingly been adopted for personalized monitoring of blood glucose levels in diabetic patients, providing valuable support for physicians in diagnosis and treatment planning. Despite the remarkable success achieved, applying BGP in multi-patient scenarios remains problematic, largely due to the inherent heterogeneity and uncertain nature of continuous glucose monitoring (CGM) data obtained from diverse patient profiles.
Methodology: This study proposes the first graph-based Heterogeneous Temporal Representation (HETER) network for multi-patient Blood Glucose Prediction (BGP). Specifically, HETER employs a flexible subsequence repetition method (SSR) to align the heterogeneous input samples, in contrast to the traditional padding or truncation methods. Then, the relationships between multiple samples are constructed as a graph and learned by HETER to capture global temporal characteristics. Moreover, to address the limitations of conventional graph neural networks in capturing local temporal dependencies and providing linear representations, HETER incorporates both a temporally-enhanced mechanism and a linear residual fusion into its architecture.
Results: Comprehensive experiments were conducted to validate the proposed method using real-world data from 112 patients in two hospitals, comparing it with five well-known baseline methods. The experimental results verify the robustness and accuracy of the proposed HETER, which achieves the maximal improvement of 31.42%, 27.18%, and 34.85% in terms of MAE, MAPE, and RMSE, respectively, over the second-best comparable method.
Discussions: HETER integrates global and local temporal information from multi-patient samples to alleviate the impact of heterogeneity and uncertainty. This method can also be extended to other clinical tasks, thereby facilitating efficient and accurate capture of crucial pattern information in structured medical data.
1 Introduction
Diabetes mellitus is a chronic metabolic disorder that afflicts over 463 million adultsworldwide, posing significant health risks and economic burdens (Bellary et al., 2021; Flood et al., 2021). Hyperglycemia is the hallmark symptom of diabetes mellitus and can lead to serious complications such as cardiovascular disease, blindness, and heart failure (Cole and Florez, 2020). Blood glucose levels are crucial health indicators for patients with diabetes (Leelarathna et al., 2022). Continuous Glucose Monitoring (CGM) is a medical device that enables patients to regularly track their blood glucose levels (Battelino et al., 2022; Jin et al., 2022; Johnson et al., 2021). CGM data can provide valuable insights into the dynamics of glucose metabolism, which can assist in optimizing the treatment strategies for both patients and clinicians (Visser et al., 2023). However, CGM data inherently exhibit heterogeneity and uncertainty, as they vary depending on the type of diabetes, duration of monitoring, and individual characteristics of each patient (Martens et al., 2021; Elbalshy et al., 2022). Therefore, developing effective blood glucose prediction (BGP) methods based on CGM data from multiple patients remains challenging.
Data-driven methods have received significant attention from researchers in recent years (Qiao et al., 2023; Wang et al., 2023), which learn potential patterns from historical observations and make inferences for the future. These methods are widely applied in healthcare, including disease prediction and diagnosis (Zhang P. et al., 2022; Huang et al., 2022; Cai et al., 2019), treatment decision support (Wang et al., 2022), medical image analysis Cai et al. (2020), and health monitoring (such as CGM, blood pressure monitoring, body temperature monitoring, and others) (Wang et al., 2021; Zhang H. et al. 2022). Previous studies on CGM have proposed a variety of machine learning and deep learning models for predicting blood glucose levels (Wadghiri et al., 2022; Zhang P. et al., 2022; Ye et al., 2022) employed the swallow machine learning method, such as random forester (RF) and support vector machine (SVM), to achieve efficient glucose monitoring. Zhu et al. (2023) proposed an attention-based recurrent neural network to BGP for type 1 diabetes mellitus (T1DM) patients. Both Rabby et al. (2021) and Yang et al. (2022) have designed a hybrid long short-term memory network (LSTM) and demonstrated promising performance for T1DM patients. Aliberti et al. (2019) attempted to use the glucose signal by multiple patients to infer a new patient glucose-level through RNN, LSTM, and auto-regressive model; Deng et al. (2021) presented an improved generative adversarial network to capture the temporal patterns from type 2 diabetes mellitus (T2DM) patients. Similar works also can be found from (Xie and Wang, 2020; Nemat et al., 2022; Lee et al., 2023; Mhaskar et al., 2017). Nevertheless, the preponderance of these approaches is concentrated on personalized Blood Glucose Prediction (BGP) and lacks the capacity to be generalized to multi-patient forecasting scenarios.
There are three major challenges that limit the prediction accuracy. 1) Heterogeneity: Monitoring durations vary among patients, attributable to individual differences in diagnosis, treatment, and lifestyle choices. This variation undermines the effectiveness of a one-size-fits-all approach to multi-patient blood glucose prediction (Espinoza et al., 2023; Hollander and Roep, 2022), thereby exerting a significant impact on the performance of predictive models in multi-patient monitoring scenarios. 2) Uncertainty: The uncertainty regarding the specific type of diabetes (T1DM or T2DM) can impact the accuracy of CGM predictions in multi-patient scenarios, given the significant potential divergence in the progression of these two types Eizirik et al. (2020). Moreover, coordinating continuous glucose monitoring (CGM) data from multi-patients introduces additional uncertainties, especially during overlapping, partially overlapping, or non-overlapping periods. These discrepancies can influence data consistency and model reliability Karges et al. (2023). 3) Correlation: The prediction model must account for potential correlations that exist across both temporal and spatial dimensions among the samples or periods Zhang P. et al. (2022). These correlations could stem from shared environmental factors, similar treatment plans, or communal lifestyle habits. Neglecting these correlations can impact the accuracy of predictions Zale and Mathioudakis (2022).
To address the aforementioned challenges, we propose a novel heterogeneous representation learning model for diabetic blood glucose prediction, called HETER (heterogeneous temporal representation network). This model can be applied to multiple patients with various monitoring durations and different types of diabetes. Compared to conventional BGP models, our proposed model structure employs the subsequence repetition (SSR) method to process the heterogeneous CGM data. This approach avoids the information loss and meaningless incorporation often experienced with traditional truncation and padding methods Ahmed et al. (2023). To discover the potential correlation in both spatial and temporal dimensions within heterogeneous and uncertain CGM data, we employ a dynamic time-warping (DTW) approach. This approach measures the similarity among diverse samples and reconstructs the CGM data input from multiple patients into a directed graph. Subsequently, a graph learning component grounded on graph convolutional networks (GCNs) is devised to capture the spatial characteristics embedded in the temporal information of the graph. These characteristics are frequently neglected by traditional recurrent learning-based approaches. This is the first work to leverage a graph neural network for multi-patient BGP to the best of our knowledge. In addition, HETER integrates a combination of attention and recurrent learning mechanisms to enhance the discrimination of distinct trends and patient types, thereby improving the robustness and generalizability for heterogeneous multi-patient BGP.
The major contributions can be summarized below.
1) The use of the SSR method for aligning heterogeneous CGM data is first applied in multi-patient blood glucose prediction. This approach presents a promising solution for processing heterogeneous medical time series data without the need for data truncation or interpolation.
2) A novel graph-based representation learning method is proposed to extract crucial temporal information from multiple CGM time series subsequences. To address the limitations of graph neural networks in capturing continuous temporal dynamics, we incorporate a representation enhancement module, further mining pattern information across both temporal and spatial dimensions.
3) The proposed HETER has been comprehensively evaluated by comparing it with five well-established prediction methods using a real-world heterogeneous CGM dataset. The results demonstrate the superiority of HETER in blood glucose prediction.
The rest of this paper is organized as follows: Section 2 introduces the materials and methods used in this study, including the dataset, problem definition, and methodology. Experimental results and analysis are presented in Section 3. Section 4 concludes the study by discussing its implications, limitations, and future research directions.
2 Materials and methods
2.1 Datasets
The patients of experimental data were recruited from Shanghai East Hospital (from September 2019 to March 2021), and Shanghai Fourth Peopleś Hospital (from June 2021 to November 2021) in Shanghai, China Zhao et al. (2023). The concise overview of the dataset is visually represented in Figures 1A,B. This dataset comprises 125 CGM records from 112 patients, including 12 individuals with Type 1 Diabetes Mellitus (T1DM) and 100 individuals with Type 2 Diabetes Mellitus (T2DM). Patient sample lengths are inconsistent, as shown in Figure 1C. The maximum, mean, and minimum lengths of the T1DM samples stand at 1,339, 981, and 357, respectively, while for the T2DM samples, these values are 1,339, 1,031, and 247. The resolution of the data is 15 min.
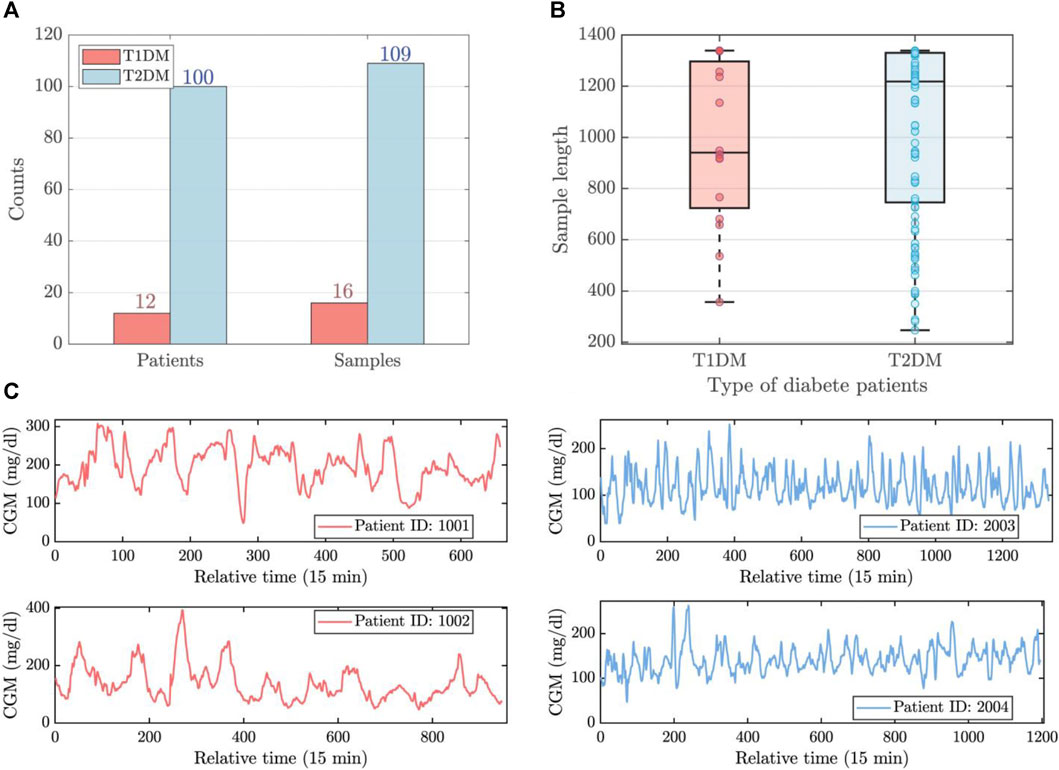
FIGURE 1. The brief visualization of experimental data. (A) The number of patients and samples for T1DM and T2DM. (B) The length distribution of T1DM and T2DM samples. (C) The time series observations of T1DM (left) and T2DM (right) samples.
Given these diabetes samples, three types of uncertainties arise: 1) sample length uncertainty: the lengths of each sample are inconsistent. 2) disease type uncertainty: this dataset comprises data from two types of patients, and predictions need to be made simultaneously for both types. 3) sample correlation uncertainty: potential temporal pattern associations may exist asynchronously among the various samples. These inherent uncertainties inevitably limit the accuracy of prior prediction methods, particularly when applied to the simultaneous tracing of multiple patients. In this study, we aim to build the complex relationship between subsequences for accurate prediction, utilizing a combination of graph neural networks, attention mechanisms, and recurrent learning components.
2.2 Problem definition
This section covers preliminaries of heterogeneous time series (HTS) and describes the problem of HTS prediction problems. The frequently used symbols are listed inSupplementary Table S1.
The continuous glucose monitoring data, collected from diverse patients at consistent intervals, demonstrates variation in relation to both monitoring durations and the specific initiation and termination timestamps. These data can be called the heterogeneous time series (HTS) in clinical glucose monitoring Duchêne et al. (2007); Zhang et al. (2017), denoted as
In this study, we consider both single-step and multi-step blood glucose prediction problems within the framework of HTS, which can be formulated as follows:
where
2.3 Methodology
2.3.1 Overview
Figure 2 illustrates the general framework of the diabetic blood glucose prediction methods for multiple patients in clinical applications. First, heterogeneous CGM signals are aggregated into a raw data stream and delivered into the learning structure. Then, the learning structure employs data cleaning and fusion techniques to reorganize the input data. The processed data are then fed into learning methods for predictive modeling or other analytical purposes. Finally, the predictive outcomes and analytical findings can support clinical diagnosis, treatment strategies, and the implementation of precision medicine.
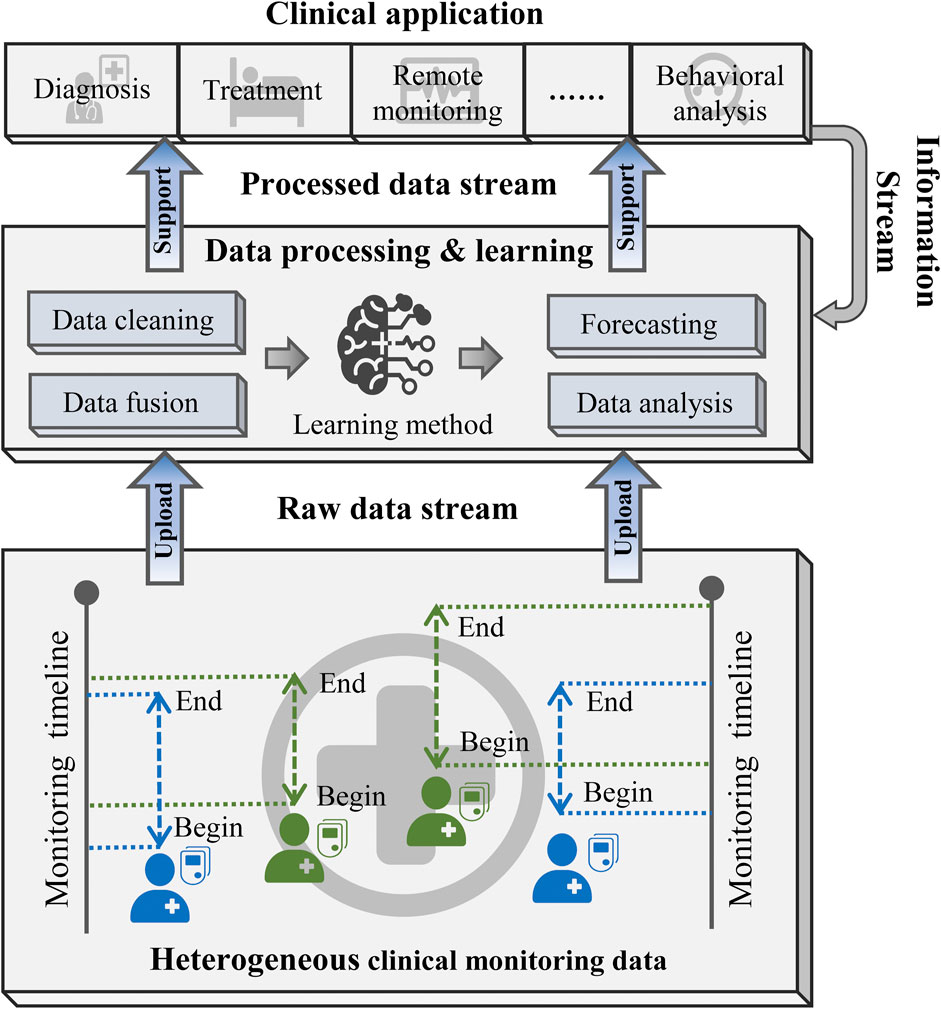
FIGURE 2. The workflow of clinical diabetic blood glucose prediction.
2.3.2 Data alignment
The heterogeneity and uncertainty are inherent in CGM data samples present a significant challenge to traditional personalized prediction models, impeding their generalization to multi-patient tasks Capobianco (2017). Consequently, the alignment of sample lengths becomes a necessity. Truncation (TRA) and padding (PAD) are two prevalent techniques employed to ensure uniformity in sample lengths Chen et al. (2020); Hammad et al. (2021). Truncation, which involves reducing data to a pre-determined length, inevitably leads to the loss of potentially crucial information. On the other hand, padding, which necessitates adding artificial data to attain a specified length, risks incorporating extraneous and meaningless data, potentially reducing the accuracy of predictions.
To address these issues, we proposed a subsequence repetition (SSR) method to align and reconstruct the heterogeneous CGM data, as illustrated in Figure 3. First, the input data are individually normalized to scalar values using the min-max normalization technique in order to minimize the impact of magnitude differences. The process of normalization and de-normalization is formulated as follows:
where
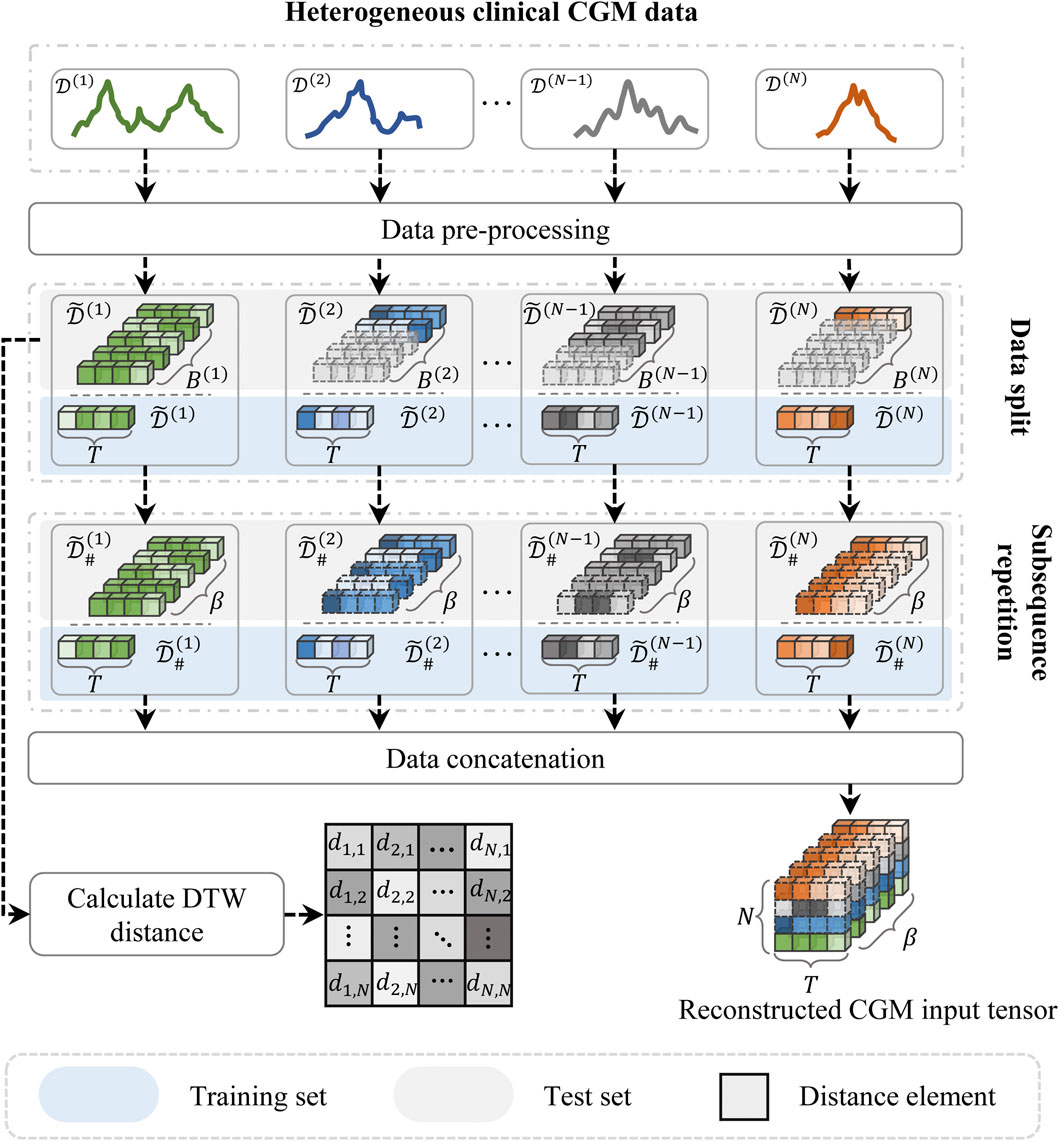
FIGURE 3. The schematic illustration of subsequence repetition (SSR) method.
Subsequently, the normalized time series data are segmented into fixed-length subsequences, each representing a continuous time period consisting of T steps (i.e., window size). The generations after segmentation can be denoted as
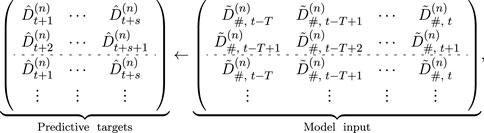
where s denotes the prediction steps, and T is the window size. The known subsequence segments are sequentially replicated until the total segment count equals β, where β represents the maximum number of segments within the training set. The reconstructed training data can be denoted as
The SSR method aligns the heterogeneous input data by utilizing the known data samples to fill the null subsequences. This method might increase redundant subsequence information, but it avoids losing the original temporal dependencies of the time series data. Both padding and truncation can easily affect the distribution of raw data.
2.3.3 Graph construction
The model architecture of the proposed HETER is illustrated in Figure 4. In HETER, we initially calculate the distance between each heterogeneous CGM record in the training set, then construct a sparse relation graph (SRGraph) based on the obtained distance matrix. SRGraph is capable of capturing the intricate relationships among patients by arranging the input data in a graph structure. This is particularly crucial when considering the heterogeneity of individuals’ blood glucose levels influenced by varying lifestyle choices, treatment regimens, and genetic factors. Additionally, SRGraph excels in uncovering latent correlations between samples or periods across both spatial and temporal dimensions. This makes SRGraph particularly suitable for multiple patients’ BGP, where correlations may exist but are not explicitly evident in the data.
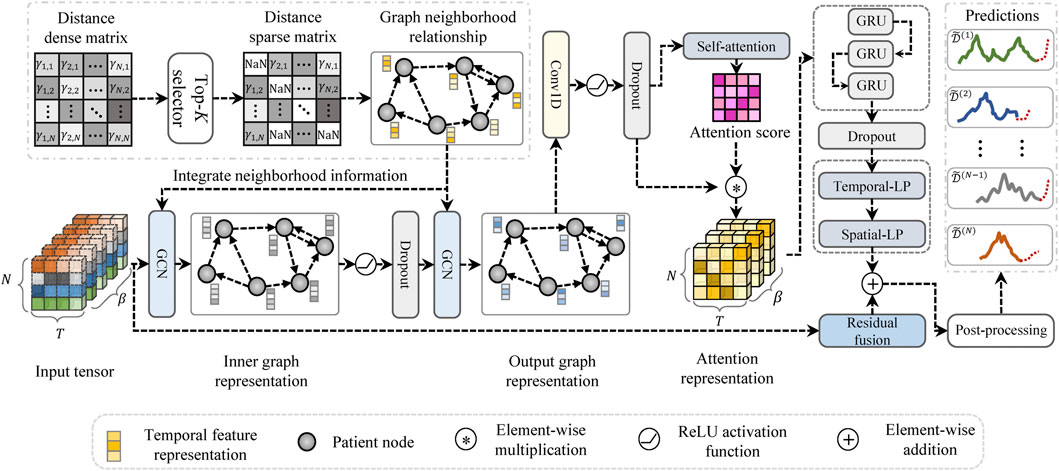
FIGURE 4. The architecture of the proposed heterogeneous temporal representation (HETER) network.
Due to the inconsistent sample length among patients, the distance cannot be calculated on a point-to-point basis. Consequently, we employ the dynamic time-warping (DTW) approach to align the sample lengths of the raw input data Li et al. (2020). This method is a widely used approach for measuring similarity between time series Li (2021). It aims to minimize the distance between two time series while aligning their sample lengths. The process can be expressed as follows:
where γi,j represents the calculated distance between samples i and j. Λ = [λ1, … , λκ] denotes the optimal alignment path between two samples. The alignment path λ = (s1, s2) must satisfy 1 ≤ s1 ≤ Li and 1 ≤ s2 ≤ Lj, where s1 and s2 represent the time points of the samples, and Li and Lj denote the sample lengths of D(i) and D(j), respectively. The path begins at λ1 = (0, 0) and ends at λκ = (Li−1, Lj−1). Both di ∈ D(i) and dj ∈ D(j) represent observations from the CGM record. The distance matrix for the input time series can be expressed as Γ = [γ1,2, … , γN,N−1].
Then, the formal definition of the proposed SRGraph can be described below.
Definition 1 (SRGraph). The SRGraph is formulated as
Definition 2 (Node Neighborhood). Let vi, vj ∈ V denote nodes in the graph, and
Definition 3 (Adjacency Matrix). The adjacency matrix is a mathematical representation of a graph. This study sorts the distances and selects the top-K minimal distances for each sample to construct the adjacency matrix. This matrix is denoted as
In general, CGM samples are treated as nodes in the graphs. The edges of the graph are constructed based on the distance relationships between these samples. With the information about nodes and edges, we generate the graph adjacency matrix, which is subsequently learned by the graph structure learning module.
2.3.4 Graph learning module
The proposed graph learning module intends to integrate the information of a node with that of its neighboring nodes to capture the temporal dependencies in a graph. Two stacked graph convolutional networks (GCNs) Zhang et al. (2019) are employed in the proposed HETER to embed the information of the SAGraph. This can be expressed as follows:
where symbol ⋆ indicates the graph convolution operation.
2.3.5 Representation enhancement module
The potential topological characteristics between patients are extracted by the graph learning module Wu et al. (2020). The representation enhancement module is designed to exploit further the key information in both the temporal and spatial dimensions.
First, a convolution component is employed to filter out the useless information in spatial dimensions, the Dropout technique also be integrated to prevent overfitting:
where Wco is the learnable convolution kernel,
A limitation of graph convolutional networks is their inability to capture the continuous dynamical patterns from input CGM data. This is because the information propagation of graph convolutional networks occurs merely through nodes, ignoring the continuity of temporal features within nodes. To address this issue, temporal attention (TA) and a recurrent learning component are incorporated into the proposed HETER. Temporal attention is applied to highlight the key time steps in a period:
where
HETER utilizes the attention score to reweight the output of the convolution component, which is then delivered to the gated recurrent unit (GRU)-based recurrent learning component to further extract the temporal dynamics. The information propagation processing in the recurrent learning component can be formulated as:
where ht is the hidden state at t steps of GRU unit. ut, rt, ct denotes the update gate, reset gate, and candidate hidden state of recurrent learning component, respectively. σ(⋅) indicates the sigmoid activation function. [;] represents the concatenation operation, and ⊙ is the element-wise multiplication operation.
2.3.6 Residual fusion and prediction
The output layer of the proposed HETER method consists of two multilayer perceptron networks, which are designed to encode the result into the desired output shape. To avoid the issue of vanishing or exploding gradients induced by excessive nonlinearity, the model’s linear input representation is added to the product of the output layer to yield the final prediction results:
where
3 Results and discussion
3.1 Experimental setup
3.1.1 Baseline methods
To verify the effectiveness of the proposed HETER, we select the following five methods as baselines for comparison. These methods have already achieved promising performance in personal diabetic blood glucose prediction or universal time series tasks.
1) Vanilla LSTMRabby et al. (2021) is a fundamental long short-term memory (LSTM) model that utilizes its internal gating mechanisms to capture temporal dynamics.
2) BiLSTMNemat et al. (2022) is a bi-directional recurrent neural network model that can capture both past and future temporal dynamics simultaneously.
3) TransformerLee et al. (2023) exhibits superiority in capturing global dependencies through its self-attention mechanism.
4) TPA-LSTMShih et al. (2019) incorporates attention mechanism and recurrent neural networks for processing time series data.
5) LSTNetLai et al. (2018) is an improved convolutional and recurrent architecture that is capable of capturing long-term dependencies and periodic patterns.
3.1.2 Performance criteria
We employ the mean absolute error (MAE), mean absolute percentage error (MAPE), and root mean square error (RMSE) to provide a comprehensive evaluation the performance of the predictive model. The MAE provides a straightforward metric of average error magnitude. The MAPE offers a scale-independent error measure in percentage terms, which is critical given the varying blood glucose levels across different contexts. The RMSE, emphasizing larger errors, assumes importance in our study, particularly considering the potential health consequences of substantial deviations in blood glucose levels. Moreover, these criteria are frequently adopted metrics for evaluating the accuracy of blood glucose predictions Xie and Wang (2020); Yang et al. (2023), which can be expressed as follows.
1) Mean absolute error
2) Mean absolute percentage error
3) Root mean square error
where
3.1.3 Model configurations
The experiments use the most recent 36 h (144 data points) of data for testing, while the remaining data were allocated for training. All experiments were conducted five times to improve the reliability of the results. The optimal hyperparameters were determined using the grid search method. The models were trained using the Adam optimization algorithm Kingma and Ba (2015), with mean squared error (MSE) employed as the loss function. The training epochs and learning rate are adjusted to approach their optimal states for each method. Supplementary Table S2 provides the detailed settings for the hyperparameters of each method. We implement the models using Porch (v.1.12.1) Paszke et al. (2019). The experiments for baseline methods and the proposed method were carried out on a server equipped with Intel(R) Xeon(R) Gold 6226R CPU (2.90 GHz) with 128G memory and were accelerated by two NVIDIA RTX A6000 GPUs.
3.2 Performance comparison
The experimental results comparing the performance of the baseline model and HETER across three prediction horizons H are displayed in Table 1. HETER outperforms comparable methods in terms of MAE, MAPE, and RMSE. We also observe that HETER, utilizing the SSR processing method, exhibits superior performance in most scenarios, particularly when the prediction horizon is established at 15. The TPA-LSTM with truncation (TRA) ranks second in most cases, and LSTNet shows the second-best performance in terms of RMSE when H is set to 30 and 60. This suggests the effectiveness of recurrent learning units. However, the inferior performance of Vanilla LSTM and BiLSTM, which consistently rank lower than other comparable methods, indicates that the output representations from recurrent units need additional refinement via other components, such as attention mechanisms or convolution layers. The proposed HETER improves MAE, MAPE, and RMSE by 31.42%, 27.18%, and 34.85%, over the second-best method when H = 15. When H is set to 30 and 60, the performance improvements over the second-best methods are 19.67% and 15.43% for MAE, 18.66% and 14.62% for MAPE, and 20.67% and 15.43% for RMSE, respectively.
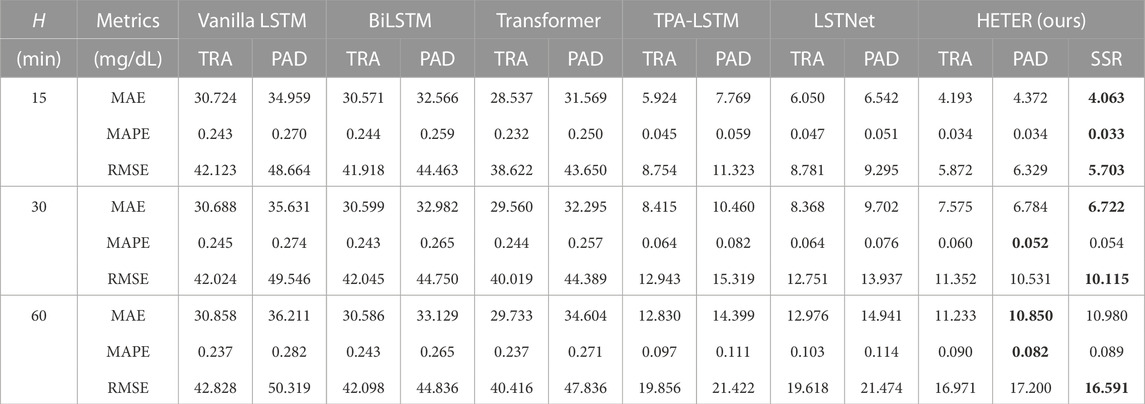
TABLE 1. The performance comparison in three metrics and three horizons on CGM observations. The best result for each metric is highlighted in bold.
When the prediction horizon H is set to 30 and 60, HETER with SSR exhibits competitive RMSE performance in comparison to HETER with padding (PAD), but it performs inferior in terms of MAPE. This can be attributed to the nature of RMSE and MAPE. Specifically, RMSE assigns greater weight to high-magnitude data points (such as sharp increases and decreases), while MAPE focuses more on the relative error between predicted and actual values. In other words, HETER with PAD generally performs well, while HETER with SSR achieves superior accuracy during periods of high volatility. Moreover, these results also demonstrate the efficacy of the proposed HETER in filtering out meaningless information.
3.3 Prediction analysis
The prediction results are illustrated in Figure 5. For illustrative purposes, we have selected the first patient samples from both the T1DM and T2DM datasets. Periods characterized by significant predictive errors are highlighted in the figure. Based on these illustrations, several key observations can be summarized as follows: 1) The progression of CGM for both T1DM and T2DM patients can be effectively tracked across all three prediction horizons. This indicates the promising accuracy of the proposed HETER in multi-patient diabetic blood glucose prediction. 2) The proposed HETER exhibits robust performance during relatively stable phases for both types of diabetic patients. This can be attributed to HETER’s ability to fuse both global and local continuous temporal information via its graph learning module and temporal enhancement module. 3) The predictive error significantly increases with the extension of prediction horizons, particularly during highlighted periods. This phenomenon highlights the challenge of capturing the temporal dynamics associated with sharp increases and decreases. The proposed method succeeds in capturing as much of the trend of short-term fluctuations as possible, particularly under shorter prediction horizons. However, there remains room for improvement during periods of intense fluctuations in longer prediction horizons.
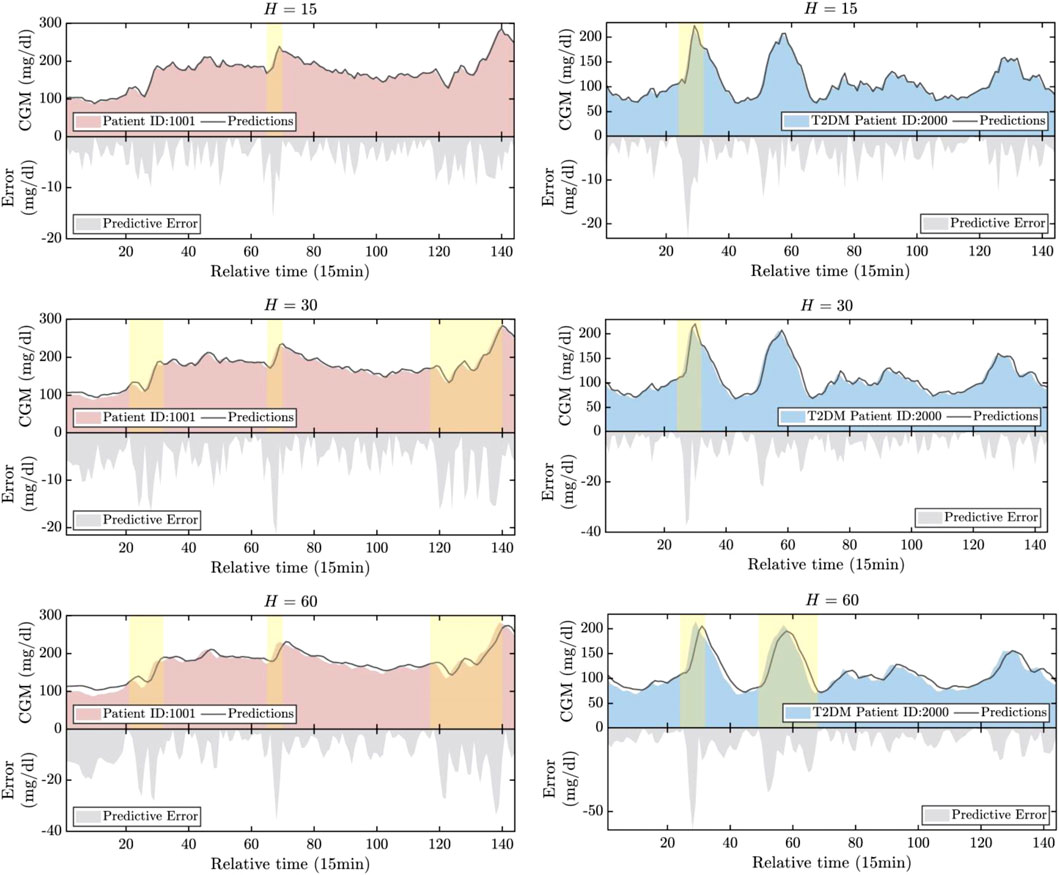
FIGURE 5. The visualization of the real values versus the predicted values.
The correlation analysis of the normalized predictive results is illustrated in Figure 6. The Pearson correlation coefficients (PCC) between actual values and predictions have also been calculated and are represented in Figure 6. Several findings were made as follows: 1) The stationarity of the data was found to be significantly different between T1DM and T2DM patients as demonstrated in the example. T1DM shows a more stable trend with the majority of data points situated in the middle range, approximating a normal distribution Eizirik et al. (2020). In contrast, the distribution of data points for T2DM patients demonstrates a significant drift, indicative of more severe fluctuations present in T2DM samples. This adds to the complexity and poses greater challenges for BGP models. 2) The proposed model exhibits strong generalization capabilities for both types of diabetic patients. While the instability of T2DM data may reduce the PCC values of the predictions, the majority of prediction errors are still confined within a 5% error bound, particularly when the prediction horizon H is small (15 or 30).
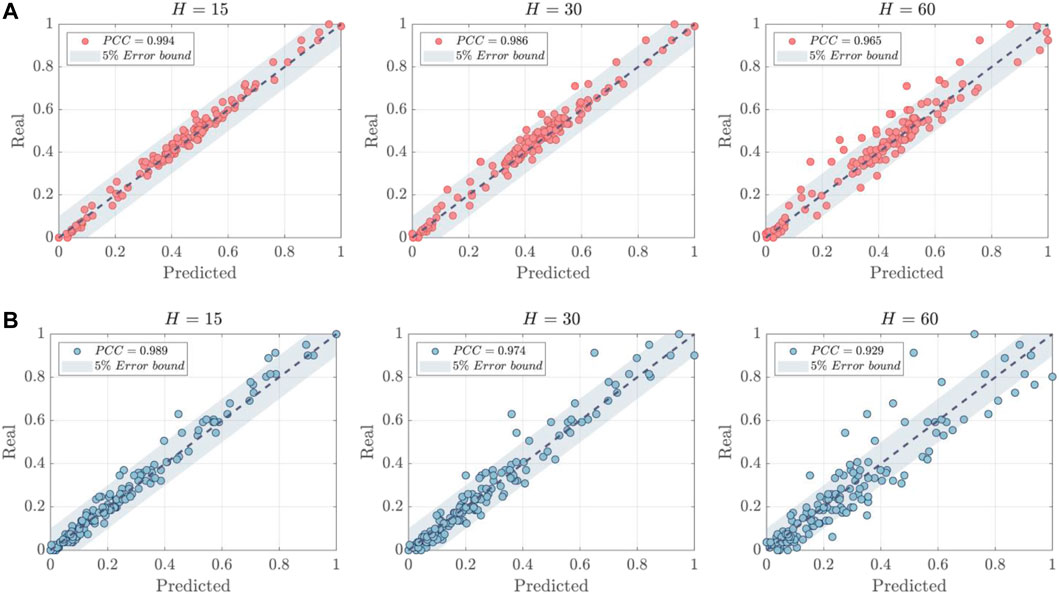
FIGURE 6. The correlation analysis of predictions. (A) T1DM Patient ID:1001. (B) T2DM Patient ID:2000.
3.4 Parameter sensitivity analysis
The impact of window sizes T and K are evaluated through parameter sensitivity analysis. The optimal results are highlighted by the red dashed lines. In this analysis, the prediction horizon H is fixed at 15. The T is varied from 4 to 64, and K is increased from 25 to 124, and their results are shown in Figures 7, 8, respectively. As depicted in Figure 7, HETER obtains optimal performance when the window size is set to 8. Beyond this point, the performance in terms of all three metrics (MAE, MAPE, and RMSE) shows a nearly linear proportionality to the window size, with performance decreasing as window size increases. This underscores the importance of selecting an appropriate window size. A smaller window size may not provide sufficient temporal information, while an excessively large window size might introduce unnecessary pattern associations and fluctuations, inevitably impacting the prediction accuracy adversely.
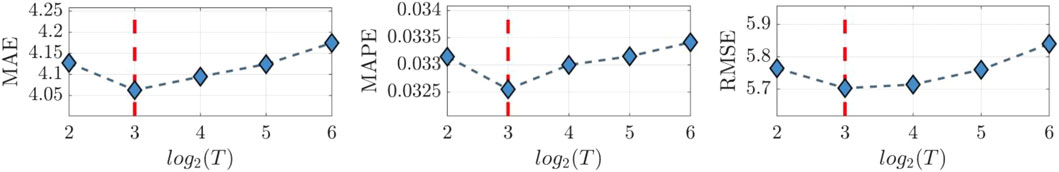
FIGURE 7. The sensitivity analysis of window size T.
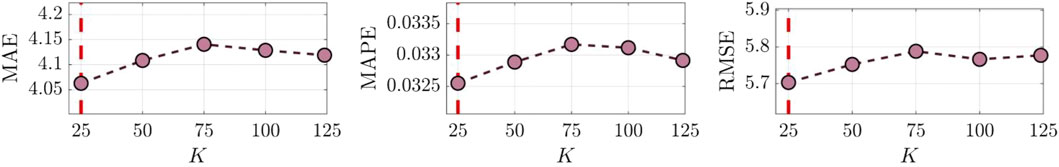
FIGURE 8. The sensitivity analysis of the hyperparameter K.
From Figure 8, the highest model accuracy is achieved when K is set to 25. According to Eq. 6, a larger K indicates denser adjacency information. However, an overly extensive relationship association might make it challenging for the prediction model to capture vital information, thus limiting prediction accuracy. These results also further verify the influence of graph relationships among multiple samples on prediction accuracy.
4 Conclusion
Inherent heterogeneity and uncertainty in multiple CGM datasets present significant constraints to the applicability of traditional personalized BGP models in multi-patient scenarios. In this study, a novel HETER model is proposed for the simultaneous prediction of blood glucose levels in multiple diabetic patients. First, the SSR method is utilized to align patient samples drawn from heterogeneous time series. Subsequently, multiple CGM datasets are structured as a graph, employing a graph structure learning module to capture global temporal information. To improve the model’s learning capability for continuous temporal characteristics, we incorporated a representation enhancement module into HETER, which allows it to highlight key information and further extract temporal representations. Additionally, we considered linear representations to enhance the model’s predictive stability. Finally, We conducted comprehensive experiments to evaluate our proposed HETER model against five comparable methods. The results of these experiments verify the superiority of our proposed SSR method and HETER model. The rising demand for effective and accurate tracking of the progression of multiple diabetic patients in clinical scenarios heightens the necessity to enhance existing methodologies. HETER is an important methodological advancement for predicting heterogeneous multi-patient CGM data using graph neural networks.
There are several potential directions for future research. First, we aim to further optimize the alignment process for heterogeneous CGM data. The generative diffusion model could be employed to align heterogeneous data by generating new data similar to historical observations. Second, we plan to incorporate additional related factors into the multi-patient BGP, including patient behavior, heart rate, and food intake. This could enhance the robustness and generalizability of the prediction model, while also improving the interpretability of the results. Third, knowledge distillation and dynamic graph convolution could be utilized to design a lightweight graph architecture. This would potentially reduce the storage and computational requirements of the model.
Data availability statement
The original contributions presented in the study are included in the article/Supplementary Material, further inquiries can be directed to the corresponding author.
Author contributions
YH conceived the study, wrote the manuscript, and contributed to the methodology. ZN critically reviewed and revised the manuscript and conducted statistical analysis. ZL designed the experimental process, revised the manuscript, and supervised the entire study. XH, JH, and BL analyzed data and conducted literature checks. HY and YS contributed to drafting the manuscript and analyzed data. All authors contributed to the article and approved the submitted version.
Funding
This work was supported by the National Natural Science Foundation of China (no. 61561008), the Innovation Project of Guangxi Graduate Education (no. YCSW2023254).
Acknowledgments
We thank Tongji University, Shanghai Fourth People’s Hospital, and Shanghai East Hospital for generously sharing the data. We also sincerely appreciate the editor and the reviewers for their invaluable feedback and constructive suggestions that have substantially enhanced the quality of this paper.
Conflict of interest
The authors declare that the research was conducted in the absence of any commercial or financial relationships that could be construed as a potential conflict of interest.
Publisher’s note
All claims expressed in this article are solely those of the authors and do not necessarily represent those of their affiliated organizations, or those of the publisher, the editors and the reviewers. Any product that may be evaluated in this article, or claim that may be made by its manufacturer, is not guaranteed or endorsed by the publisher.
Supplementary material
The Supplementary Material for this article can be found online at:https://www.frontiersin.org/articles/10.3389/fphys.2023.1225638/full#supplementary-material
References
Ahmed, A., Aziz, S., Abd-Alrazaq, A., Farooq, F., Househ, M., and Sheikh, J. (2023). The effectiveness of wearable devices using artificial intelligence for blood glucose level forecasting or prediction: Systematic review. J. Med. Internet Res.25, e40259. doi:10.2196/40259
Aliberti, A., Pupillo, I., Terna, S., Macii, E., Di Cataldo, S., Patti, E., et al. (2019). A multi-patient data-driven approach to blood glucose prediction. IEEE Access7, 69311–69325. doi:10.1109/access.2019.2919184
Battelino, T., Bergenstal, R. M., Rodríguez, A., Landó, L. F., Bray, R., Tong, Z., et al. (2022). Efficacy of once-weekly tirzepatide versus once-daily insulin degludec on glycaemic control measured by continuous glucose monitoring in adults with type 2 diabetes (surpass-3 cgm): A substudy of the randomised, open-label, parallel-group, phase 3 surpass-3 trial. Lancet Diabetes and Endocrinol.10, 407–417. doi:10.1016/S2213-8587(22)00077-8
Bellary, S., Kyrou, I., Brown, J. E., and Bailey, C. J. (2021). Type 2 diabetes mellitus in older adults: Clinical considerations and management. Nat. Rev. Endocrinol.17, 534–548. doi:10.1038/s41574-021-00512-2
Cai, J.-x., Zhong, R., and Li, Y. (2019). Antenna selection for multiple-input multiple-output systems based on deep convolutional neural networks. PloS one14, e0215672. doi:10.1371/journal.pone.0215672
Cai, J., Hu, J., Tang, X., Hung, T.-Y., and Tan, Y.-P. (2020). Deep historical long short-term memory network for action recognition. Neurocomputing407, 428–438. doi:10.1016/j.neucom.2020.03.111
Capobianco, E. (2017). Systems and precision medicine approaches to diabetes heterogeneity: A big data perspective. Clin. Transl. Med.6, 23–10. doi:10.1186/s40169-017-0155-4
Chen, K., Liu, W., Han, J., and Lombardi, F. (2020). Profile-based output error compensation for approximate arithmetic circuits. IEEE Trans. Circuits Syst. I Regul. Pap.67, 4707–4718. doi:10.1109/tcsi.2020.2996567
Cole, J. B., and Florez, J. C. (2020). Genetics of diabetes mellitus and diabetes complications. Nat. Rev. Nephrol.16, 377–390. doi:10.1038/s41581-020-0278-5
Deng, Y., Lu, L., Aponte, L., Angelidi, A. M., Novak, V., Karniadakis, G. E., et al. (2021). Deep transfer learning and data augmentation improve glucose levels prediction in type 2 diabetes patients. NPJ Digit. Med.4, 109. doi:10.1038/s41746-021-00480-x
Duchêne, F., Garbay, C., and Rialle, V. (2007). Learning recurrent behaviors from heterogeneous multivariate time-series. Artif. Intell. Med.39, 25–47. doi:10.1016/j.artmed.2006.07.004
Eizirik, D. L., Pasquali, L., and Cnop, M. (2020). Pancreatic β-cells in type 1 and type 2 diabetes mellitus: Different pathways to failure. Nat. Rev. Endocrinol.16, 349–362. doi:10.1038/s41574-020-0355-7
Elbalshy, M., Haszard, J., Smith, H., Kuroko, S., Galland, B., Oliver, N., et al. (2022). Effect of divergent continuous glucose monitoring technologies on glycaemic control in type 1 diabetes mellitus: A systematic review and meta-analysis of randomised controlled trials. Diabet. Med.39, e14854. doi:10.1111/dme.14854
Espinoza, J., Xu, N. Y., Nguyen, K. T., and Klonoff, D. C. (2023). The need for data standards and implementation policies to integrate cgm data into the electronic health record. J. Diabetes Sci. Technol.17, 495–502. doi:10.1177/19322968211058148
Flood, D., Seiglie, J. A., Dunn, M., Tschida, S., Theilmann, M., Marcus, M. E., et al. (2021). The state of diabetes treatment coverage in 55 low-income and middle-income countries: A cross-sectional study of nationally representative, individual-level data in 680 102 adults. Lancet Healthy Longev.2, e340–e351. doi:10.1016/s2666-7568(21)00089-1
Hammad, M., Iliyasu, A. M., Subasi, A., Ho, E. S. L., and El-Latif, A. A. A. (2021). A multitier deep learning model for arrhythmia detection. IEEE Trans. Instrum. Meas.70, 1–9. doi:10.1109/tim.2020.3033072
Hollander, N. H. M. d., and Roep, B. O. (2022). From disease and patient heterogeneity to precision medicine in type 1 diabetes. Front. Med.9, 932086. doi:10.3389/fmed.2022.932086
Huang, Y., Zhang, P., Wang, Z., Lu, Z., and Wang, Z. (2022). HFMD cases prediction using transfer one-step-ahead learning. Neural Process. Lett.Early View. doi:10.1007/s11063-022-10795-9
Jin, X., Li, G., Xu, T., Su, L., Yan, D., and Zhang, X. (2022). Fully integrated flexible biosensor for wearable continuous glucose monitoring. Biosens. Bioelectron.196, 113760. doi:10.1016/j.bios.2021.113760
Johnson, S. R., Holmes-Walker, D. J., Chee, M., Earnest, A., Jones, o. b. o. t. C. A. C., Timothy, W., et al. (2021). Universal subsidized continuous glucose monitoring funding for young people with type 1 diabetes: Uptake and outcomes over 2 years, a population-based study. Diabetes Care45, 391–397. doi:10.2337/dc21-1666
Karges, B., Tittel, S. R., Bey, A., Freiberg, C., Klinkert, C., Kordonouri, O., et al. (2023). Continuous glucose monitoring versus blood glucose monitoring for risk of severe hypoglycaemia and diabetic ketoacidosis in children, adolescents, and young adults with type 1 diabetes: A population-based study. Lancet Diabetes and Endocrinol.11, 314–323. doi:10.1016/S2213-8587(23)00061-X
Kingma, D. P., and Ba, J. (2015). “Adam: A method for stochastic optimization,” in Proceedings of the 3rd International Conference on Learning Representations, San Diego, CA, USA. Poster.
Lai, G., Chang, W., Yang, Y., and Liu, H. (2018). “Modeling long- and short-term temporal patterns with deep neural networks,” in Proceedings of the 41st International ACM SIGIR Conference on Research and Development in Information Retrieval (Ann Arbor, MI, USA: ACM), 95–104.
Lee, S.-M., Kim, D.-Y., and Woo, J. (2023). Glucose transformer: Forecasting glucose level and events of hyperglycemia and hypoglycemia. IEEE J. Biomed. Health Inf.27, 1600–1611. doi:10.1109/JBHI.2023.3236822
Leelarathna, L., Evans, M. L., Neupane, S., Rayman, G., Lumley, S., Cranston, I., et al. (2022). Intermittently scanned continuous glucose monitoring for type 1 diabetes. N. Engl. J. Med.387, 1477–1487. doi:10.1056/NEJMoa2205650
Li, H., Liu, J., Yang, Z., Liu, R. W., Wu, K., and Wan, Y. (2020). Tandem Mass Tag-based quantitative proteomics analysis of metabolic associated fatty liver disease induced by high fat diet in mice. Inf. Sci.534, 97–116.doi:10.1186/s12986-020-00522-3
Li, H., Yu, C., Zhang, Z. T., Yan, S., Liao, Y. J., and Lu, D. F. (2021). Time works well: Dynamic time warping based on time weighting for time series data mining. Inf. Sci.547, 592–598. doi:10.1111/os.12855
Martens, T., Beck, R. W., Bailey, R., Ruedy, K. J., Calhoun, P., Peters, A. L., et al. (2021). Effect of continuous glucose monitoring on glycemic control in patients with type 2 diabetes treated with basal insulin: A randomized clinical trial. J. Am. Med. Assoc.325, 2262–2272. doi:10.1001/jama.2021.7444
Mhaskar, H. N., Pereverzyev, S. V., and Van der Walt, M. D. (2017). A deep learning approach to diabetic blood glucose prediction. Front. Appl. Math. Statistics3, 14. doi:10.3389/fams.2017.00014
Nemat, H., Khadem, H., Eissa, M. R., Elliott, J., and Benaissa, M. (2022). Blood glucose level prediction: Advanced deep-ensemble learning approach. IEEE J. Biomed. Health Inf.26, 2758–2769.doi:10.1109/JBHI.2022.3144870
Paszke, A., Gross, S., Massa, F., Lerer, A., Bradbury, J., Chanan, G., et al. (2019). “Porch: An imperative style, high-performance deep learning library,” in Proceedings of the 33rd Advances in Neural Information Processing Systems, Vancouver, BC, Canada, 8024–8035.
Qiao, H., Wu, Y.-X., Zhong, S.-L., Yin, P.-J., and Chen, J.-H. (2023). Brain-inspired intelligent robotics: Theoretical analysis and systematic application. Mach. Intell. Res.20, 1–18. doi:10.1007/s11633-022-1390-8
Rabby, M. F., Tu, Y., Hossen, M. I., Lee, I., Maida, A. S., and Hei, X. (2021). Stacked lsm based deep recurrent neural network with Kalman smoothing for blood glucose prediction. BMC Med. Inf. Decis. Mak.21, 101–115. doi:10.1186/s12911-021-01462-5
Shih, S.-Y., Sun, F.-K., and Lee, H.-y. (2019). Temporal pattern attention for multivariate time series forecasting. Mach. Learn.108, 1421–1441. doi:10.1007/s10994-019-05815-0
Visser, M. M., Charleer, S., Fieuws, S., De Block, C., Hilbrands, R., Van Huffel, L., et al. (2023). Effect of switching from intermittently scanned to real-time continuous glucose monitoring in adults with type 1 diabetes: 24-month results from the randomised alertt1 trial. Lancet Diabetes and Endocrinol.11, 96–108. doi:10.1016/S2213-8587(22)00352-7
Wadghiri, M., Idri, A., El Idrissi, T., and Hakkoum, H. (2022). Ensemble blood glucose prediction in diabetes mellitus: A review. Comput. Biol. Med.147, 105674. doi:10.1016/j.compbiomed.2022.105674
Wang, Z., Huang, Y., and He, B. (2021). Dual-grained representation for hand, foot, and mouth disease prediction within public health cyber-physical systems. Softw. Pract. Exp.51, 2290–2305. doi:10.1002/spe.2940
Wang, Z., Wang, Z., Lu, L., Huang, Y., and Fu, Y. (2022). A multi-view multi-omics model for cancer drug response prediction. Appl. Intell.52, 14639–14650. doi:10.1007/s10489-022-03294-w
Wang, Z., Liu, X., Huang, Y., Zhang, P., and Fu, Y. (2023). A multivariate time series graph neural network for district heat load forecasting. Energy278, 127911. doi:10.1016/j.energy.2023.127911
Wu, Z., Pan, S., Long, G., Jiang, J., Chang, X., and Zhang, C. (2020). “Connecting the dots: Multivariate time series forecasting with graph neural networks,” in Proceedings of the 26th ACM SIGKDD International Conference on Knowledge Discovery and Data Mining (New York, NY, USA: ACM), 753–763.
Xie, J., and Wang, Q. (2020). Benchmarking machine learning algorithms on blood glucose prediction for type i diabetes in comparison with classical time-series models. IEEE Trans. Biomed. Eng.67, 3101–3124. doi:10.1109/TBME.2020.2975959
Yang, T., Yu, X., Ma, N., Wu, R., and Li, H. (2022). An autonomous channel deep learning framework for blood glucose prediction. Appl. Soft Comput.120, 108636. doi:10.1016/j.asoc.2022.108636
Yang, G., Liu, S., Li, Y., and He, L. (2023). Short-term prediction method of blood glucose based on temporal multi-head attention mechanism for diabetic patients. Biomed. Signal Process. Control82, 104552. doi:10.1016/j.bspc.2022.104552
Ye, Z., Wang, J., Hua, H., Zhou, X., and Li, Q. (2022). Precise detection and quantitative prediction of blood glucose level with an electronic nose system. IEEE Sensors J.22, 12452–12459. doi:10.1109/jsen.2022.3178996
Zale, A., and Mathioudakis, N. (2022). Machine learning models for inpatient glucose prediction. Curr. Diabetes Rep.22, 353–364. doi:10.1007/s11892-022-01477-w
Zhang, S., Bahrampour, S., Ramakrishnan, N., Schott, L., and Shah, M. (2017). “Deep learning on symbolic representations for large-scale heterogeneous time-series event prediction,” in Proceedings of the 2017 International Conference on Acoustics, Speech and Signal Processing (New Orleans, LA, USA: IEEE), 5970–5974.
Zhang, S., Tong, H., Xu, J., and Maciejewski, R. (2019). Graph convolutional networks: A comprehensive review. Comput. Soc. Netw.6, 11–23. doi:10.1186/s40649-019-0069-y
Zhang, H., He, R., Niu, Y., Han, F., Li, J., Zhang, X., et al. (2022a). Graphene-enabled wearable sensors for healthcare monitoring. Biosens. Bioelectron.197, 113777. doi:10.1016/j.bios.2021.113777
Zhang, P., Wang, Z., Huang, Y., and Wang, M. (2022b). Dual-grained directional representation for infectious disease case prediction. Knowledge-Based Syst.256, 109806. doi:10.1016/j.knosys.2022.109806
Zhao, Q., Zhu, J., Shen, X., Lin, C., Zhang, Y., Liang, Y., et al. (2023). Chinese diabetes datasets for data-driven machine learning. Sci. Data10, 35. doi:10.1038/s41597-023-01940-7
Keywords: continuous glucose monitoring, diabetes mellitus, time series, prediction, graph neural network, deep neural network
Citation: Huang Y, Ni Z, Lu Z, He X, Hu J, Li B, Ya H and Shi Y (2023) Heterogeneous temporal representation for diabetic blood glucose prediction. Front. Physiol. 14:1225638. doi: 10.3389/fphys.2023.1225638
Received: 25 May 2023; Accepted: 19 June 2023;
Published: 17 July 2023.
Edited by:
Philippe Fournier-Viger, Shenzhen University, ChinaCopyright © 2023 Huang, Ni, Lu, He, Hu, Li, Ya and Shi. This is an open-access article distributed under the terms of the Creative Commons Attribution License (CC BY). The use, distribution or reproduction in other forums is permitted, provided the original author(s) and the copyright owner(s) are credited and that the original publication in this journal is cited, in accordance with accepted academic practice. No use, distribution or reproduction is permitted which does not comply with these terms.
*Correspondence: Zhenkun Lu, bHprMDZAc2luYS5jb20=