 Liang Wang
 Zhong Yun1*
 Jinfu Yao
 Xiaoyan Tang
 Yunhao Feng
 Chuang Xiang
94% of researchers rate our articles as excellent or good
Learn more about the work of our research integrity team to safeguard the quality of each article we publish.
Find out more
ORIGINAL RESEARCH article
Front. Physiol., 12 April 2023
Sec. Computational Physiology and Medicine
Volume 14 - 2023 | https://doi.org/10.3389/fphys.2023.1174188
This article is part of the Research TopicRecent Advances in the Design and Preclinical Evaluation of Ventricular Assist DevicesView all 9 articles
For blood pumps with a rotating vane-structure, hemolysis values are estimated using a stress-based power-law model. It has been reported that this method does not consider the red blood cell (RBC) membrane’s shear resistance, leading to inaccurate estimation of the hemolysis value. The focus of this study was to propose a novel hemolysis model which can more accurately predict the hemolysis value when designing the axial flow blood pump. The movement behavior of a single RBC in the shear flow field was simulated at the mesoscale. The critical value of shear stress for physiological injury of RBCs was determined. According to the critical value, the equivalent treatment of RBC aging was studied. A novel hemolysis model was established considering the RBC’s aging and the hemolysis’ initial value. The model’s validity was verified under the experimental conditions of shear stress loading and the conditions of the shear flow field of the blood pump. The results showed that compared with other hemolysis models for estimating the hemolysis value of blood pumps, the novel hemolysis model proposed in this paper could effectively reduce the estimation error of the hemolysis value and provide a reference for the optimal design of rotary vane blood pumps.
In recent years, the increase in the number of patients with heart failure and the acute shortage of heart transplant donors have led to the gradual replacement of ventricular assist devices (VADs, also known as blood pumps) with heart transplantation as an effective treatment for heart failure (Bellumkonda and Bonde, 2012; Molina and Boyce, 2013; Magruder et al., 2017; Gaffey et al., 2018; Grace et al., 2018; Kawabori et al., 2018; Muhammad et al., 2018; Wu et al., 2021).
However, for medical devices that come into contact with blood, mechanical damage to blood is the focus of research prior to clinical application of medical devices. In particular, the shear stress generated by the high-speed rotating impeller of the vane blood pump, which exposes red blood cells in blood to non-physiological shear damage that is much higher than that of physiological shear damage (Tie-yan et al., 2013; Faghih and Sharp, 2019). In order to enhance the hemolysis performance of blood pumps, several studies have been proposed to optimize the design of blood pumps with the goal of hemolysis performance and to establish a hemolysis model (Zimmer et al., 2000; Lim et al., 2001; Chan et al., 2002; Grigioni et al., 2005; Goubergrits, 2006; Taskin et al., 2012) to estimate the hemolysis performance of blood pumps during the optimization design process. However, for complex flow fields inside rotating impeller blood pumps, the existing hemolysis model estimates are sufficiently inaccurate and have large errors compared to the reported hemolysis experiments (Wurzinger, 1986; Paul et al., 1999; Faghih and Sharp, 2019).
This study aimed to obtain the equivalent shear stress of RBC aging by the threshold model and establish a novel model for hemolysis estimation based on the power-law formula hemolysis model. The novel hemolysis model could provide a more accurate prediction for the optimal design of rotary vane blood pumps. First, the motion behavior of individual RBCs in the shear flow field was simulated at the mesoscale, and the critical value of the physiological damage shear stress of RBCs was determined. Second, a novel model for hemolysis estimation was developed by adding the aging equivalence and the initial value of hemolysis. Finally, the validity of the novel model for hemolysis estimation was verified under the experimental conditions of shear loading and the conditions of the shear flow field in the blood pump.
Most of the current research studies reported on the quantitative estimation of hemolysis models were based on the hemolysis model proposed by Giersiepen (Giersiepen et al., 1990). Giersiepen defined the hemolysis index (
where τ represents the shear stress (Pa); t represents the exposure time (s); and C, α, and β are constants,
To predict hemolysis more accurately, Goubergrits and Affeld (2004) considered the loading history of shear stress and defined the virtual time
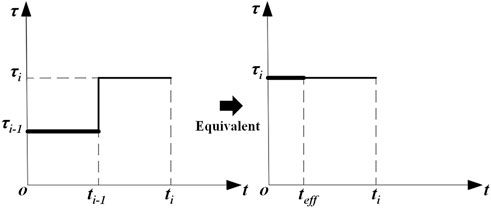
FIGURE 1. Schematic illustration of the imaginary time equivalence principle.
Then, the expression for the imaginary time is computed as follows:
The expression of the hemolysis model is
Although the shear stress loading history could effectively reduce the hemolysis estimation error, the RBCs still had a specific shear resistance, and hemolysis did not occur when the shear stress was less than a certain threshold value. So, it was not reasonable to directly use the power-law formula to estimate the hemolysis value.
For the study of the relationship between exposure time and critical shear stress, Eilers (1997) concluded that for a specific exposure time
The aging process of RBCs, which began with the release of RBCs from the bone marrow into the circulation and ended with destruction, fluctuated in the duration from 70 to 140 days, with an average of 115 days (Cohen et al., 2008; Mock et al., 2011). From the hemolysis perspective, the RBCs’ value reached 100% after 115 days in the circulatory system, and the threshold model allowed us to obtain the average equivalent shear stress to which RBCs were subjected during their life cycle as 0.3886 Pa.
Chen et al. (2016) and Chen et al. (2017) reported that scalar shear stresses within the blood pump were classified into three categories: below 25 Pa was in the normal physiological range, between 25 and 125 Pa was the elevated non-physiological range, and above 125 Pa was the highly elevated non-physiological shear stress range that might lead to RBC destruction. During their lifetime, RBCs had the property of returning to their original state after passing through capillaries that are much smaller in diameter than themselves. This property indicates that the RBCs could withstand some shear stress without mechanical damage.
Thus, the damage process at shear stresses below 25 Pa could be considered an aging problem of the RBCs. At shear loads greater than 25 Pa, it was a non-physiological shear range that caused mechanical damage to the RBCs and caused hemolysis.
For the study of the pump flow field at the shear-damaging threshold of RBCs, the results obtained for the shear threshold of RBCs differ due to the different experimental methods used, parameters of the theoretical calculations, and other factors. There were 255 Pa (Shi et al., 2014), 400 Pa (Pan et al., 2011), 600 Pa (Grigioni et al., 2005), and 800 Pa ranges (Lu et al., 2001), and the corresponding exposure times were 1 ms, 700 ms, 4 min, and 1 ms, respectively. We studied the morphology, perimeter, and total elastic strain energy of the RBCs in the shear flow field according to the shear threshold and physiological shear damage threshold of the RBCs reported previously.
A single RBC shear flow field environment was built, mainly through two infinite extensions of the parallel plate; the spacing was
It has been reported that RBCs subjected to a certain degree of shear stress undergo a certain amount of deformation, and when the shear stress ceases to act, the RBCs return to a biconcave pancake shape, whose biconcave pancake shape can be expressed as follows (Lanlan. et al., 2013):
where
The fluid flow in the narrow gap causes the RBCs to move and deform, and the deformation produced by the RBCs simultaneously acts back on the fluid. At this point, the action between the RBC membrane and the fluid is strongly coupled. The strong coupling will significantly enhance the non-linearity of the model. Therefore, the flow–solid coupling approach was used to model the RBCs, and for the blood flow in the blood pump, the blood was considered an incompressible Newtonian fluid. The hydrodynamic equations for blood are
where
The RBC membrane was treated as an isotropic viscoelastic membrane, and the equations of motion are expressed as
where
Due to the viscoelastic nature of the RBC membrane, the viscoelastic behavior of RBC was described using the Kelvin–Voigt model with the following relationship between the elastic strain rate and stress:
where
Here,
Here,
The interaction at the fluid–solid interface was due to the fluid load on the solid and the displacement of the solid within the flowing fluid, which could be expressed as
where
(1) Initial values of hemolysis
Yeleswarapu et al. (1995) detected an increase in plasma-free hemoglobin concentration, ∆PfHb = 69.3 mg%, after blood was exposed to a constant shear stress of 700 pa for 25 ms, and this shear stress and exposure time were used to calculate the hemolysis value,
Li et al. (2015) used a coefficient
Yeleswarapu et al. detected that the initial value of hemoglobin concentration (
(2) A novel model for hemolysis estimation
In summary, considering the shear loading history, the equivalent shear stress of aging RBCs, and the physiological shear threshold of RBCs, a novel hemolytic prognosis model based on the aforementioned hemolytic Eq. 3 was developed, and the novel model hemolytic prognosis flow is shown in Figure 2.

FIGURE 2. Novel model hemolysis prognosis process.
Thus, a novel model of hemolysis considering RBC aging is as follows:
The values of empirical coefficient parameters
In computational fluid dynamics (CFD), the Lagrange particle tracing method could be used to obtain the shear stress tensor of RBCs on the flow field trace in the pump. However, because the flow inside the blood pump was a three-dimensional complex flow, it was necessary to convert the shear stress tensor reading in the flow field into a scalar shear stress and then bring it into the hemolysis model to solve the hemolysis value. The expression of the flow field shear stress tensor is
where
The best way to validate the hemolysis model would be to use a hemolysis experiment with a loaded shear stress, but this was not possible due to the difficulty in accurately controlling the blood variable shear stress of the experimental setup and the fact that there were few relevant measured reference data for hemolysis experiments. Therefore, this paper used the new model and other models to estimate hemolysis under different working conditions. The comparison verified the validity of the new model.
(1) Shear stress loading experimental conditions
For the validation of the novel hemolysis model under the experimental conditions of shear loading, the experimental data from Yeleswarapu et al. on shear loading were used and combined with the estimated values of the hemolytic model for comparative validation. During the experiments of Yeleswarapu et al. to study the shear stress on blood damage, two conditions of decreasing and increasing shear stress with time were loaded. The shear stress loading with time is shown in Figure 3.
(2) Axial flow pump shear flow field conditions
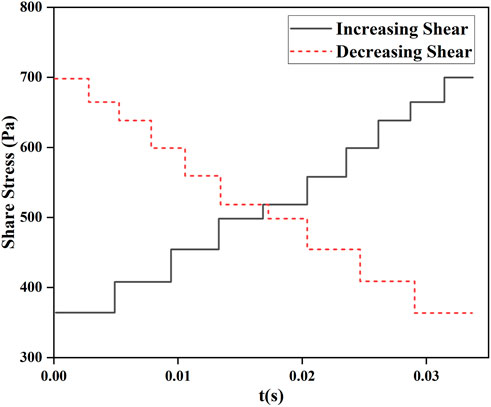
FIGURE 3. Variation in loaded shear stress with time studied by Yeleswarapu et al. (1995).
Particles representing RBCs were released through the inlet of the blood pump, and the particles were traced using the Lagrange method. The statistical shear stress and exposure time on the traces could be used for blood pump hemolysis estimation. The shear stress and exposure time on the traces of one of the particles numbered 4 are shown in Figure 4.
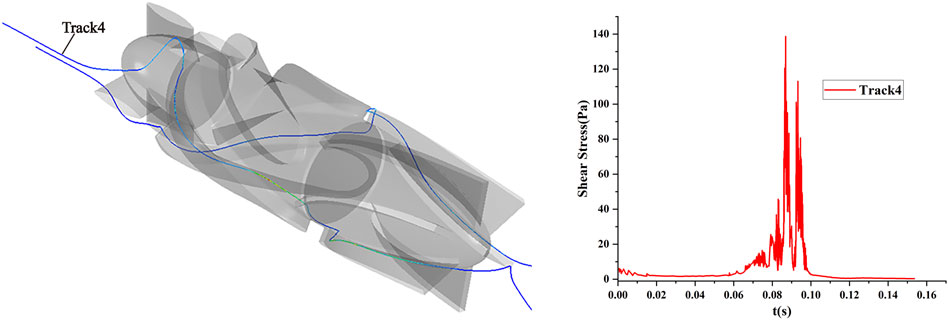
FIGURE 4. Scalar shear stress and exposure time of the particle traces for number 4 under the shear flow field condition of the axial flow pump.
In order to verify the validity of the hemolysis estimation for the blood pump, a hemolysis test study was conducted on a magneto-hydraulic suspended axial flow pump, and the blood circulation platform built is shown in Figure 5. Fresh porcine blood was used as a blood sample in the experimental circulatory tubing circuit. The normal range of the total hemoglobin concentration in porcine blood was 90–130 g/L, and the normal range of hematocrit was 32%–43%. Fresh porcine blood obtained from a local slaughterhouse was anticoagulated with 3,000 USP of heparin per 500 mL of blood. Porcine blood should be stored under refrigeration at 4°C for no longer than 48 h. Before the experiment, PBS solution was injected into the circulatory tubing circuit, which was circulated and flushed for 15 min, after which PBS was drained. A measure of 1 L of anticoagulated porcine blood was injected into the circulatory tubing circuit, the blood pump speed was set to about 8,000 r/min to achieve blood pumping circulation, and the ambient temperature of the laboratory was 25°C–26°C. From the start of pumping, samples were taken from the sampling port every 30 min, and the total circulation time of the experiment was 5.5 h. The hemolysis value was analyzed according to the free hemoglobin measurement.
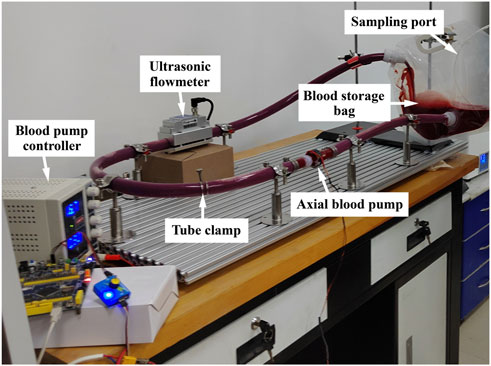
FIGURE 5. Hemolysis test circulation platform.
In this paper, the plasma-free hemoglobin content was determined by using the colorimetric method. The micro-free hemoglobin (freeHb) content assay kit A071 (developed by the Nanjing Jiancheng Institute of Biological Engineering) was used for the analysis. A linear regression analysis fitted the measured plasma-free hemoglobin concentration (freeHb) data into a straight line. The slope of the line was the increment of the plasma-free hemoglobin concentration (∆freeHb) during the experimental sampling interval. The formula for calculating the standardized hemolysis index
where
To compare the estimated hemolysis value with the experimental hemolysis value, the relationship between NIH and HI was obtained according to the additional descriptive form of NIH (Carswell et al., 2013) and combined with Eq. 1; then, the formula for the experimental hemolysis value is expressed as
where
Generating shear flow fields of different strengths required the moving speed of the upper plate to be calculated according to Eq. 5, and additional parameter settings are shown in Table 1.
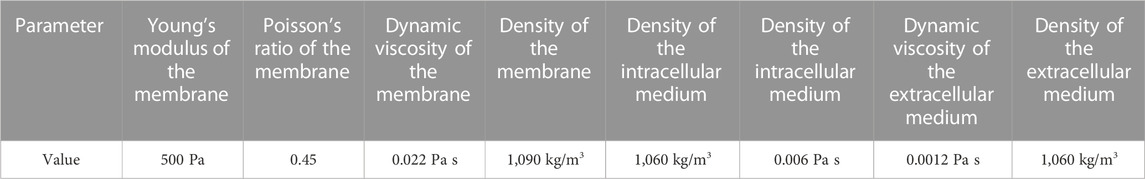
TABLE 1. Shear flow field setting parameters.
Point A at the left end of the long axis in the initial state of the RBC is set as the marker point, and the trajectory of point A and the morphology of the RBC at some nodes under the corresponding shear stress are shown in Figure 6.

FIGURE 6. Changes in the RBC motility and morphology.
Figure 6 shows that: (1) RBCs lost their biconcave pancake-like shape characteristics when shear stress was applied, and the overall main motion direction of RBCs was the same as that of the upper plate. (2) From the position of point A relative to the cell membrane, there was a rotational motion of the RBC membrane around its center of mass, and the speed of the rotational motion was greater when the shear stress was greater. (3) In the shear flow field, when the shear force was small, the RBCs moved in the negative direction of the Y-axis, and the trajectory was parabolic. As the shear force increased, the distance of RBCs moving in the negative direction of the Y-axis became smaller, and the parabola became flat. When the shear force continued to increase above 600 Pa, the RBCs moved in the positive direction of the Y-axis. (4) The comparative analysis showed that when the shear stress in the shear flow field was 25 Pa or below, the RBC stretching changes were not obvious.
Studies of RBC deformation typically used the ratio of the major and minor axes defined as the deformation index, whereas the deformation of RBCs in a shear flow field was complex and unreliable to describe using the deformation index. Therefore, the change in RBC perimeter could be better than the deformation and stretching of the cell membrane of RBCs subjected to the shear state, and the change in RBC perimeter in shear flow fields of different intensities is shown in Figure 7.
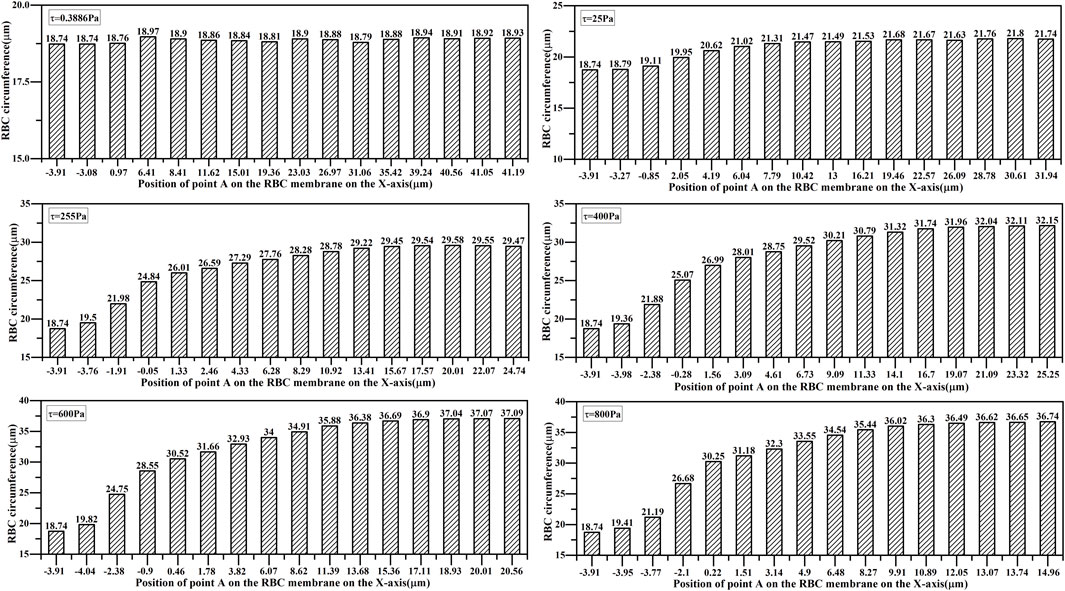
FIGURE 7. Changes in the circumference of RBCs.
Figure 7 shows that: (1) the perimeter of RBCs increased with the increasing shear stress, which was consistent with the trend of the morphological changes shown in Figure 6. (2) When the shear stress was 0.3886 Pa, the maximum stretching length of RBCs is 1.012 times the original perimeter, indicating that the change in RBC girth was negligible, and it was reasonable to take 0.3886 Pa as the equivalent shear stress of RBC aging. (3) When the shear stress was 25 Pa, the maximum stretching length of RBCs was 1.16 times the original perimeter; when the shear stress force reached 400 Pa, the maximum stretch length of the RBCs was 1.72 times the original perimeter.
The total elastic strain energy changes in RBCs under different shear stresses are shown in Figure 8. The maximum value of the total elastic strain energy of RBCs increased with the increasing shear stress. The changes in the total elastic strain energy of RBCs under 600 and 800 Pa shear stresses were similar, and the changes in the total elastic strain energy of RBCs in the shear flow fields below 400 Pa were considerably smaller than those in the shear flow fields above 600 Pa. Moreover, the total RBC elastic energy was nearly the same in 25 and 0.3886 Pa shear flow fields.

FIGURE 8. Changes in the total elastic strain energy of the RBCs.
A comprehensive analysis of morphological changes, perimeter changes, and total elastic strain energy changes in RBCs in shear flow fields of different intensities showed that it was reasonable and reliable to treat RBCs subjected to shear stress below 25 Pa as equivalent to aging for hemolytic prognosis model studies.
The shear stress loading with time data, shown in Figure 3, was substituted into the hemolysis model of Eq. 3 and Eq. 7 to obtain the hemolysis estimates
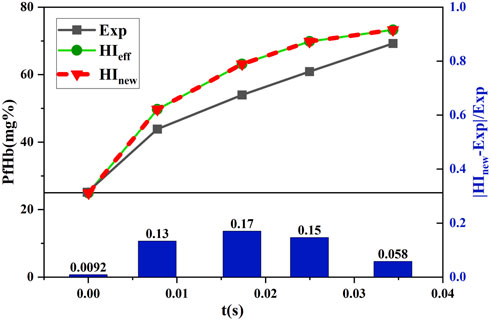
FIGURE 9. Comparison between the estimated and experimental hemolysis values with the decreasing shear force under time working conditions.
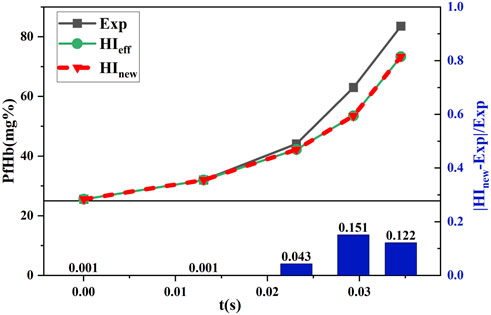
FIGURE 10. Comparison between the estimated and experimental hemolysis values with the increasing shear force under time working conditions.
Figure 9 and Figure 10 show that
The measured data and data processing results after 5.5 h of in vitro hemolysis experiments (n = 4) with the 3D-printed blood pump are shown in Figure 11. The standardized hemolysis index NIH was calculated by substituting ∆freeHb obtained from each experiment into Eq. 10. Then, the NIH value was substituted into Eq. 11 to get the hemolysis value (
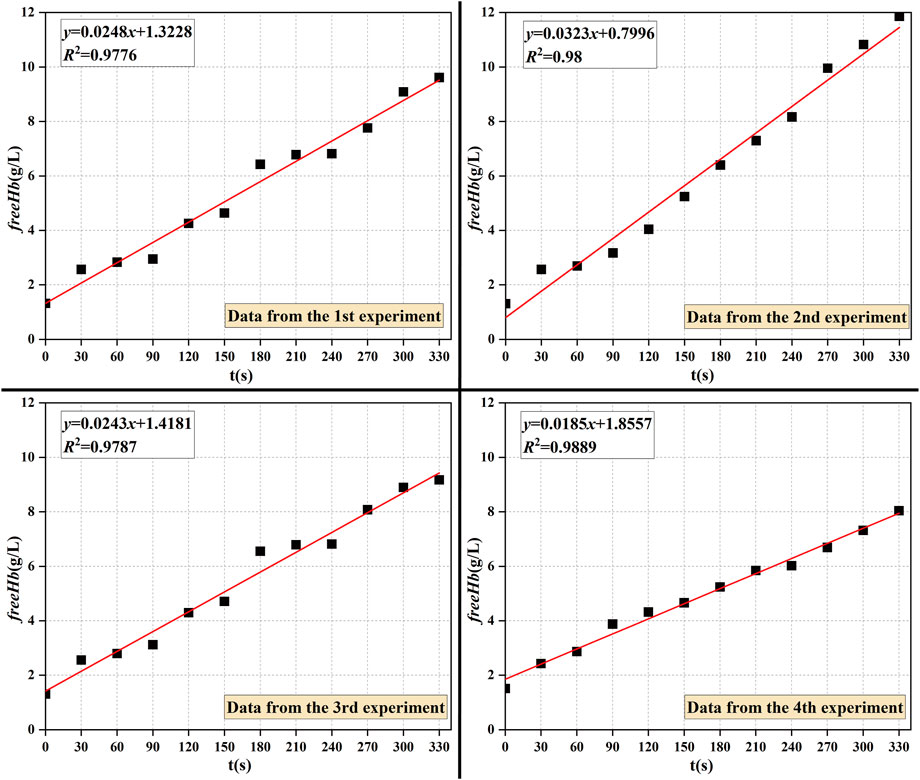
FIGURE 11. Experimentally measured plasma-free protein concentration over time.
When a lower shear stress of less than or equal to 25 Pa existed, to which the RBCs were subjected to, the parameter

FIGURE 12. Comparison of hemolysis estimates and experimental values in the axial blood pump.
For blood pumps with a rotating vane structure, the estimation of hemolysis performance is mainly based on a power-law formula, which has a significant estimation error. In this paper, we carried out a study on the equivalent shear stress of RBC aging, analyzed the rationality of RBC aging equivalence in the shear flow field, and developed and validated a novel hemolysis model for blood pumps by considering the initial value of hemolysis and RBC aging equivalence based on the hemolysis model in Eq. 3. Although the estimated hemolysis value of the new model is still slightly different from the experimental hemolysis value, the hemolysis estimation error is effectively reduced compared with the previous hemolysis model, which could provide a more accurate hemolysis model reference for the optimal design of rotary vane blood pumps.
This study also has the limitation that only the effects of RBC aging and initial values of hemolysis on hemolysis estimation were studied. There are other physical factors that can affect hemolysis estimation, such as the temperature factor, were not considered, and many factors that can affect hemolysis estimation should be considered in the blood pump design process.
The original contributions presented in the study are included in the article/Supplementary Material; further inquiries can be directed to the corresponding authors.
LW, ZY, JY, XT, YF, and CX: study concept and design. LW, ZY, JY, and YF: numerical simulation and data analysis. XT and CX: hydraulic experiments. LW, ZY, and JY: drafting of the manuscript. ZY, XT, and CX: critical revision of the manuscript. All authors contributed to the article and approved the submitted version.
The authors would like to acknowledge the support from the Natural Science Foundation of Changsha City, China (Grant No. kq2202074), the Natural Science Foundation of Hunan Province, China (Grant No. 2022JJ30696), and the Scientific Research Project of Hunan Provincial Education Department, China (Grant Nos 21C0523 and 21C0525).
The authors declare that the research was conducted in the absence of any commercial or financial relationships that could be construed as a potential conflict of interest.
All claims expressed in this article are solely those of the authors and do not necessarily represent those of their affiliated organizations, or those of the publisher, the editors, and the reviewers. Any product that may be evaluated in this article, or claim that may be made by its manufacturer, is not guaranteed or endorsed by the publisher.
Bellumkonda, L., and Bonde, P. (2012). Ventricular assist device therapy for heart failure-past, present, and future. Int. Anesthesiol. Clin. 50, 123–145. doi:10.1097/AIA.0b013e31826233a9
Bludszuweit, C. (1995). Three-Dimensional numerical prediction of stress loading of blood particles in a centrifugal pump. Artif. Organs 19 (7), 590–596. doi:10.1111/j.1525-1594.1995.tb02386.x
Carswell, D., McBride, D., Croft, T., Slone, A., Cross, M., and Foster, G. (2013). A CFD model for the prediction of haemolysis in micro axial left ventricular assist devices. Appl. Math. Model. 37 (6), 4199–4207. doi:10.1016/j.apm.2012.09.020
Chan, W. K., Wong, Y. W., Ding, Y., Chua, L. P., and Yu, S. (2002). Numerical investigation of the effect of blade geometry on blood trauma in a centrifugal blood pump. Artif. Organs 26 (9), 785–793. doi:10.1046/j.1525-1594.2002.06954.x
Chen, Z., Jena, S. K., Giridharan, G. A., Koenig, S. C., Slaughter, M. S., Griffith, B. P., et al. (2017). Flow features and device-induced blood trauma in CF-VADs under a pulsatile blood flow condition: A CFD comparative study. Int. J. Numer. Method Biomed. Eng. 34, e2924. doi:10.1002/cnm.2924
Chen, Z., Mondal, N. K., Ding, J., Koenig, S. C., Slaughter, M. S., and Wu, Z. J. (2016). Paradoxical effect of nonphysiological shear stress on platelets and von Willebrand factor. Artif. Organs 40 (7), 659–668. doi:10.1111/aor.12606
Cohen, R. M., Franco, R. S., Khera, P. K., Smith, E. P., Lindsell, C. J., Ciraolo, P. J., et al. (2008). Red cell life span heterogeneity in hematologically normal people is sufficient to alter HbA1c. Blood 112 (10), 4284–4291. doi:10.1182/blood-2008-04-154112
Eilers, R. (1997). Einsatz und Bewertung rechnergestützter Methoden für die technische Auslegung mechanischer Herzklappenprothesen. Shaker: Doctoral.
Faghih, M. M., and Sharp, M. K. (2019). Modeling and prediction of flow-induced hemolysis: A review. Biomechanics Model. Mechanobiol. 18, 845–881. doi:10.1007/s10237-019-01137-1
Gaffey, A. C., Chen, C. W., Chung, J. J., Han, J., Bermudez, C. A., Wald, J., et al. (2018). Is there a difference in bleeding after left ventricular assist device implant: Centrifugal versus axial? J. Cardiothorac. Surg. 13 (1), 22. doi:10.1186/s13019-018-0703-z
Giersiepen, M., Wurzinger, L. J., Opitz, R., and Reul, H. (1990). Estimation of shear stress-related blood damage in heart valve prostheses - in vitro comparison of 25 aortic valves. Int. J. Artif. organs 13 (5), 300–306. doi:10.1177/039139889001300507
Goubergrits, L., and Affeld, K. (2004). Numerical estimation of blood damage in artificial organs. Artif. Organs 28 (5), 499–507. doi:10.1111/j.1525-1594.2004.07265.x
Goubergrits, L. (2006). Numerical modeling of blood damage: Current status, challenges and future prospects. Expert Rev. Med. Devices 3 (5), 527–531. doi:10.1586/17434440.3.5.527
Grace, C., Akers, W. J., Scott, M. J., Michael, N., Allen, J. S., Schmieder, A. H., et al. (2018). Diagnosis of LVAD thrombus using a high-avidity fibrin-Specific99mTc probe. Theranostics 8 (4), 1168–1179. doi:10.7150/thno.20271
Grigioni, M., Morbiducci, U., D’Avenio, G., Benedetto, G. D., and Gaudio, C. D. (2005). A novel formulation for blood trauma prediction by a modified power-law mathematical model. Biomechanics Model. Mechanobiol. 4 (4), 249–260. doi:10.1007/s10237-005-0005-y
Kawabori, M., Kurihara, C., Sugiura, T., Cohn, W. E., Civitello, A. B., Frazier, O. H., et al. (2018). Continuous-flow left ventricular assist device implantation in patients with a small left ventricle. Ann. Thorac. Surg. Official J. Soc. Thorac. Surg. South. Thorac. Surg. Assoc. 105 (3), 799–806. doi:10.1016/j.athoracsur.2017.09.040
Lanlan, X., Shuo, C., Junyan, L., and Zhi, S. (2013). Coarse-grained simulation of red blood cells stretching deformation. J. Tongji Univ. Sci. 41 (11), 1744–1750. doi:10.3969/j.issn.0253-374x.2013.11.023
Li, H., Ruan, X., Qian, W., and Fu, X. (2015). Numerical estimation of hemolysis from the point of view of signal and system. Artif. Organs 38 (12), 1065–1075. doi:10.1111/aor.12294
Lim, W. L., Chew, Y. T., Chew, T. C., and Low, H. T. (2001). Pulsatile flow studies of a porcine bioprosthetic aortic valve in vitro: PIV measurements and shear-induced blood damage. J. Biomechanics 34 (11), 1417–1427. doi:10.1016/s0021-9290(01)00132-4
Lu, P. C., Lai, H. C., and Liu, J. S. (2001). A reevaluation and discussion on the threshold limit for hemolysis in a turbulent shear flow. J. Biomechanics 34 (10), 1361–1364. doi:10.1016/S0021-9290(01)00084-7
Magruder, J. T., Grimm, J. C., Crawford, T. C., Tedford, R. J., Russell, S. D., Sciortino, C. M., et al. (2017). Survival after orthotopic heart transplantation in patients undergoing bridge to transplantation with the HeartWare HVAD versus the heartmate II. Ann. Thorac. Surg. 103, 1505–1511. doi:10.1016/j.athoracsur.2016.08.060
Mock, D. M., Matthews, N. I., Zhu, S., Strauss, R. G., Schmidt, R. L., Nalbant, D., et al. (2011). Red blood cell (RBC) survival determined in humans using RBCs labeled at multiple biotin densities. Transfusion 51 (5), 1047–1057. doi:10.1111/j.1537-2995.2010.02926.x
Molina, E. J., and Boyce, S. W. (2013). Current status of left ventricular assist device technology. Seminars Thorac. Cardiovasc. Surg. 25 (1), 56–63. doi:10.1053/j.semtcvs.2013.02.002
Muhammad, S., Tamunoinemi, B., Rami, N., Khouzam, S., Sulaiman, S., Akinseye, O., et al. (2018). Trends, predictors and outcomes of ischemic stroke and intracranial hemorrhage in patients with a left ventricular assist device. Ann. Transl. Med. 6, 5. doi:10.21037/atm.2017.12.23
Pan, W., Fedosov, D. A., Caswell, B., and Karniadakis, G. E. (2011). Predicting dynamics and rheology of blood flow: A comparative study of multiscale and low-dimensional models of red blood cells. Microvasc. Res. 82 (2), 163–170. doi:10.1016/j.mvr.2011.05.006
Paul, R., Schügner, F., Reul, H., and Rau, G. (1999). Recent findings on flow induced blood damage: Critical shear stresses and exposure times obtained with a high shear Couette-system. Int. J. Artif. Organs 22, 256.
Shi, L., Pan, T. W., and Glowinski, R. (2014). Three-dimensional numerical simulation of red blood cell motion in Poiseuille flows. New Jersey, United States: John Wiley and Sons, Ltd. doi:10.1002/FLD.3939
Taskin, M. E., Fraser, K. H., Zhang, T., Wu, C., Griffith, B. P., and Wu, Z. J. (2012). Evaluation of eulerian and Lagrangian models for hemolysis estimation. Asaio J. 58 (4), 363–372. doi:10.1097/MAT.0b013e318254833b
Tie-yan, L. I., Liang, Y. E., Hong, F. w., Liu, D. c., Fan, H. m., and Liu, Z. m. (2013). The simulation of multiphase flow field in implantable blood pump and analysis of hemolytic capability. J. Hydrodynamics Ser B 25, 606–615. doi:10.1016/S1001-6058(11)60402-3
Wu, P., Huo, J., Dai, W., Wu, W. T., and Li, S. (2021). On the optimization of a centrifugal maglev blood pump through design variations. Front. Physiology 12, 699891. doi:10.3389/fphys.2021.699891
Wu, P., Huo, J. D., Zhang, Z. J., and Wang, C. J. (2022). The influence of non-conformal grid interfaces on the results of large eddy simulation of centrifugal blood pumps. Artif. Organs 46 (9), 1804–1816. doi:10.1111/aor.14263
Yeleswarapu, K. K., Antaki, J. F., Kameneva, M. V., and Rajagopal, K. R. (1995). A mathematical model for shear-induced hemolysis. Artif. Organs 19 (7), 576–582. doi:10.1111/j.1525-1594.1995.tb02384.x
Keywords: red blood cell aging, rotating impeller blood pump, shear injury, hemolysis estimation, optimization
Citation: Wang L, Yun Z, Yao J, Tang X, Feng Y and Xiang C (2023) A novel model for hemolysis estimation in rotating impeller blood pumps considering red blood cell aging. Front. Physiol. 14:1174188. doi: 10.3389/fphys.2023.1174188
Received: 26 February 2023; Accepted: 27 March 2023;
Published: 12 April 2023.
Edited by:
Peng Wu, Soochow University, ChinaCopyright © 2023 Wang, Yun, Yao, Tang, Feng and Xiang. This is an open-access article distributed under the terms of the Creative Commons Attribution License (CC BY). The use, distribution or reproduction in other forums is permitted, provided the original author(s) and the copyright owner(s) are credited and that the original publication in this journal is cited, in accordance with accepted academic practice. No use, distribution or reproduction is permitted which does not comply with these terms.
*Correspondence: Zhong Yun, eXVuemhvbmdAY3N1LmVkdS5jbg==
Disclaimer: All claims expressed in this article are solely those of the authors and do not necessarily represent those of their affiliated organizations, or those of the publisher, the editors and the reviewers. Any product that may be evaluated in this article or claim that may be made by its manufacturer is not guaranteed or endorsed by the publisher.
Research integrity at Frontiers
Learn more about the work of our research integrity team to safeguard the quality of each article we publish.