 Aleksander S. Golub1,2
 Bjorn K. Song
 Roland N. Pittman
- 1Department of Physiology and Biophysics, Medical College of Virginia Campus, Virginia Commonwealth University, Richmond, VA, United States
- 2Song Biotechnologies LLC, Cockeysville, MD, United States
This study examined changes in interstitial PO2, which allowed calculation of VO2 during periods of rest, muscle contraction and recovery using an in situ rat spinotrapezius muscle preparation. The PO2 was measured using phosphorescence quenching microscopy and the muscle VO2 was calculated as the rate of O2 disappearance during brief periods of muscle compression to stop blood flow with a supra-systolic pressure. The PO2 and VO2 measurements were made during “5 s compression and 15 s recovery” (CR) cycles. With all three stimulation frequencies, 1, 2 and 4 Hz, the fall in interstitial PO2 and rise in VO2 from resting values occurred within the first 20 s of contraction. The PO2 during contraction became lower as stimulation frequency increased from 1 to 4 Hz. VO2 was higher at 2 Hz than at 1 Hz contraction. With cessation of stimulation, PO2 began increasing exponentially towards baseline values. After 1 and 2 Hz contraction, the fall in muscle VO2 was delayed by one CR cycle and then exponentially decreased towards resting values. After 4 Hz stimulation, VO2 increased for 2 cycles and then decreased. The post-contraction transients of PO2 and VO2 were not synchronous and had different time constants. With further analysis two distinct functional responses were identified across all stimulation frequencies having PO2 during contraction above or below 30 mmHg. The corresponding VO2 responses were different - for “high” PO2, muscle VO2 reached high levels, while for the “low” PO2 data set muscle VO2 remained low. Recovery patterns were similar to those described above. In summary, local microscopic PO2 and VO2 were measured in resting and contracting muscle in situ and the post-contraction transients of PO2 and VO2 were all much slower than the onset transients.
Introduction
The ability of the microcirculation to provide an adequate oxygen supply over a wide range of metabolic activity represents a remarkable physiological phenomenon (Poole and Jones, 2012; Koga et al., 2014). The nature of mechanisms synchronizing and matching the O2 delivery and consumption rates have been under investigation for more than a century (Roy and Brown, 1880; Roy and Sherrington, 1890; Krogh, 1919; Krogh, 1922; Rowell, 2004; Clifford, 2007; Clifford and Tschakovsky, 2008; Tschakovsky and Joyner, 2008; Sarelius and Pohl, 2010; Clifford, 2011; Golub and Pittman, 2013a; Golub and Pittman, 2013b; Joyner and Casey, 2015). It is assumed that the basic principles of local blood flow regulation are the same for all organs; however, skeletal muscle is the most appropriate organ for experimental studies due to the controllable and measurable functional activity. Metabolic rate and O2 consumption in muscle can be changed over a wide range by voluntary control of workload intensity or by electrical stimulation. This opportunity opens an experimental window into the general mechanisms of coordination between O2 demand and supply in organs and tissues.
Studies of skeletal muscle at transitions from rest to steady exercise and then back to the resting state have a long history of achievements, being thoroughly discussed in reviews, covering thousands of sources (Borsheim and Bahr, 2003; Joyner and Wilkins, 2007; Wagner, 2011a; Casey and Joyner, 2011; Poole and Jones, 2012; Joyner and Casey, 2015). The main methodological approach for studying VO2 in a muscle is Fick’s principle representing mass conservation for oxygen in blood (Weibel, 1984). In a steady state of O2 delivery and consumption, the oxygen flux from capillaries to cells in an organ is equal to the product of blood flow and arterio-venous difference of blood oxygen content, i.e., the oxygen extraction. At the onset of muscle contraction and activation of oxidative metabolism, an additional amount of oxygen can be delivered due to increased O2 extraction at constant blood flow, increased blood flow at constant oxygen extraction and the augmentation in values of both these variables. The interaction of individual factors that determine the oxygen flux to the parenchymal cell and limit the maximum oxygen consumption is demonstrated in Wagner’s diagram representing the graphical solution of two pertinent equations describing Fick’s principle and Fick’s law of diffusion (Wagner, 1996; Wagner, 2011b; Spurway et al., 2012). Increased oxygen extraction from blood leads to a decrease in the mid-capillary PO2, which reduces the diffusive flux of oxygen and limits oxygen consumption by muscle fibers. Thus, a balance between convective and diffusive transport is achieved at the intersection of the two “Fick” lines. An important assumption in this analysis was having zero PO2 at the mitochondria, which was reasonable for the analysis of factors limiting the maximal O2 consumption. Moreover, in the case of a limited metabolic capacity of mitochondria, the maximal VO2 could be limited by this factor (Wagner, 2011b).
The experimentally established dependence of VO2 on the PO2 for muscle tissue and mitochondria under “physiological conditions” (Golub and Pittman, 2012; Wilson et al., 2012; Golub et al., 2018) formed the basis for a graphical analysis of the O2 delivery and consumption in the range between resting and maximal workload rate. For that purpose, the experimental dependence of VO2 on interstitial PO2 has to be measured on a microscopic scale, throughout the entire range of functional activity in the muscle. The narrow interstitial space between the capillaries and muscle fibers is the interface between the O2 delivery and consumption part ofthe muscle. The compartment is located between capillaries and myocytes, thus the interstitial PO2 can be used as a sensitive indicator of the balance between rates of O2 delivery and consumption in the muscle. The VO2(PO2) dependence curves for muscle cells are determined by two factors: mitochondrial respiration and intracellular diffusion (Golub and Pittman, 2012). Thus, a set of curves VO2(PO2) for various rates of workload characterizes the entire function of O2 consumption in muscle cells.
The development of phosphorescence quenching technology (Vanderkooi et al., 1987; Vanderkooi et al., 1991) has allowed measuring oxygen-related variables in resting and contracting muscles on the microscopic scale (Behnke et al., 2001; McDonough et al., 2001). The successful combination of in vivo microscopy in a thin skeletal muscle and the phosphorescence quenching method was employed for recording the transients in microvascular PO2 together with blood flow velocities and RBC flux (Behnke et al., 2002; Behnke et al., 2003a; Behnke et al., 2003b). We have developed the compression technique, combined with phosphorescence quenching microscopy, to enable a direct determination of VO2 in microscopic volumes of muscle during rest, contraction and recovery (Roy and Brown, 1880; Smith et al., 2002; Golub et al., 2011; Golub and Pittman, 2012; Nugent et al., 2016a).
We have applied that technique to collect a set of oxygen dependence curves in rat spinotrapezius muscle at different levels of metabolic activity (Golub et al., 2018). As a result of this work, a model of balance between O2 delivery and consumption at different workloads in the muscle was developed.
This methodology opens up the possibility of directly and simultaneously measuring oxygen tension on the surface of myocytes and the rate of their respiration in various states of muscle function: rest, work and recovery. There is a belief that in a resting muscle there is a balance between the rate of oxygen delivery to the interstitium and oxygen consumption by myocytes. During the transition from rest to work, the increased oxygen consumption by the muscle reduces interstitial PO2 and thus increases the transmural flow of oxygen from the capillaries. This mode of regulation has its limitations so that the component of convective transport may require an active vascular response. In addition, mechanical interference with perfusion occurs in a contracting muscle. The same complex interactions also occur during the transition from work to rest, so that there is a restoration of muscle resources used to cover the energy imbalance during work. The balance of oxygen delivery and consumption results from the interaction of many factors. The imbalance of oxygen demand and supply is the subject of this experimental study.
The experimental study of transients following the onset and offset of muscle contraction at different intensities opens a window into understanding the functional mechanisms by which muscle cells interact with the microvascular network (Hill et al., 1924; McDonough et al., 2001; Behnke et al., 2002; Borsheim and Bahr, 2003; Poole and Jones, 2012). Over recent decades the study of these transients on a microscopic scale, at which the musculature and vasculature interact, has yielded significant progress in this area (Behnke et al., 2001; McDonough et al., 2001; Behnke et al., 2002; Kindig et al., 2003). Investigations of the regulation of oxygen consumption are focused on the issue of determining these factors, namely, the role of regulation of oxygen delivery versus cellular metabolic control (Poole and Jones, 2012). In the analysis of our experimental results, we assumed that oxygen delivery and consumption in contracting muscle tissue are well-coordinated and interrelated, hence forming an integrated O2 processing system.
Materials and methods
PO2 and VO2 monitoring in skeletal muscle in situ
The compression of a thin muscle using a transparent airbag, rapidly inflated to a supra-systolic pressure (140 mmHg) was employed for measuring the rate of O2 disappearance from the interstitium due to tissue respiration (Golub et al., 2011; Nugent et al., 2016a). The PO2 decrease in the interstitial space, loaded with a phosphorescent oxygen probe, was recorded using phosphorescence quenching microscopy (PQM). Analysis of the O2 disappearance curves (ODC) yielded the local rate of oxygen consumption, VO2, and established its dependence on PO2 for skeletal muscle in situ (Golub et al., 2011; Golub and Pittman, 2012; Nugent et al., 2016b). The VO2 in muscle fibers was calculated from the initial slope of the ODC at the onset of muscle compression, and O2 solubility in muscle. The method required a brief compression to avoid a shortage of oxygen. After rapid release of airbag pressure, the PO2 was quickly restored to the baseline value. The entire muscle on the thermostated pedestal of the animal platform was compressed. The total time period for interstitial PO2 measurement represented a complete muscle compression and recovery (CR) cycle, which could be repeated many times without significant effect on the studied variables (Nugent et al., 2016a). A 20-s CR cycle, consisting of 5 s of muscle compression and 15 s free perfusion (Figure 1, top), provided a reliable measurement of VO2 in resting and contracting muscle (Nugent et al., 2016a; Nugent et al., 2016b).
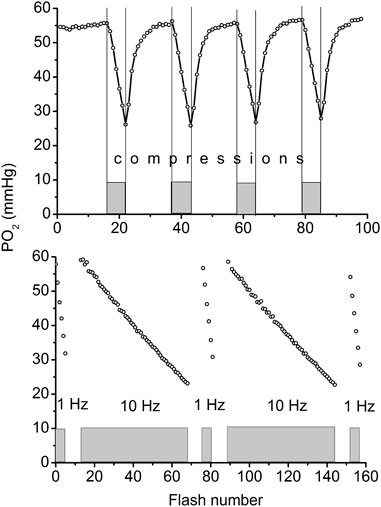
FIGURE 1. Top: Example of continuous measurement of interstitial PO2 in the rat spinotrapezius muscle with a flash rate of 1 Hz. Compression air pressure of 140 mmHg from automatic pressure controller was quickly applied via thin film airbag to muscle for 5 s time period (grey rectangles and vertical lines). During 5 s of compression the PO2 fall was recorded, then the airbag pressure was momentarily reduced to a low level of 5 mmHg and interstitial PO2 in muscle was restored to its initial level during the next 15 s. The rate of oxygen disappearance (initial slope for 5 s line segments) was converted to VO2 (Nugent et al., 2016a). Measuring compression-recovery (CR) cycle is properly adjusted for VO2 measurements with PQM technique. Bottom: Principle of determination of oxygen photo-consumption by the method in muscle. The PO2 was recorded during the 5 s intervals of muscle compressions, with intermittent excitation flash rates of 1 and 10 Hz (five 5 s compression time intervals are shown as gray boxes). Excitation flash light source was synchronized with the air bag pressure controller, so that the longer periods of pressure release were not recorded in this test. Linear fitting of these data returns the values of oxygen disappearance rates, relevant for the calculation of oxygen consumption by the method (Nugent et al., 2016a).
Oxygen consumption by the method
The PO2 sampling frequency for serial VO2 measurements also has limitations (Golub et al., 2011; Golub and Pittman, 2012; Nugent et al., 2016a). The interstitial oxygen tension in a muscle was measured with a flash rate of 1 Hz. The oxygen consumption by the phosphorescence quenching method itself was estimated by comparison of measurements obtained at flash rates of 1 and 10 Hz at the same tissue site (Figure 1, bottom) (Nugent et al., 2016a). The fraction of oxygen consumed by the method was (6.9 ± 0.5) 10−3, and was determined at 56 sites in the rat spinotrapezius muscle. This meant that the PO2 measuring procedure itself reduced the PO2 by 0.7% per flash, and it is not accumulated due to the 1-s long time interval between two consecutive excitation light pulses. The excitation energy density and oxygen probe concentration were adjusted so that the VO2 by the method would not exceed a 1% reduction of the ambient PO2 at the measurement site.
Animal experiments
The following animal protocols and experimental procedures were approved by the Virginia Commonwealth University Institutional Animal Care and Use Committee and are consistent with the National Institutes of Health Guidelines for the Humane Treatment of Laboratory Animals, as well as the American Physiological Society’s Guiding Principles in the Care and Use of Animals. Briefly, 15 male Sprague-Dawley rats (BW = 325 ± 15 g; Harlan, Indianapolis, IN) were given a pre-operative intraperitoneal dose of Ketastet and Acepromazine (75 mg/kg and 2.5 mg/kg, respectively) to establish a sufficient plane of anesthesia for incision and cannulation procedures. The femoral vein was then accessed and cannulated with polyethylene tubing (PE-90) to enable the continuous infusion of alfaxalone acetate (Alphaxan, Vetoquinol UK Limited, Buckingham, MK18 1 PA; ∼0.1 mg/kg/min), which maintained, with responsive adjustment to animal reflexes, heart rate and oxygen saturation indicators, a steady plane of anesthesia through the conclusion of surgical preparation and measurements. A tracheal cannula of PE-240 tubing was inserted to maintain a patent airway. Animal anesthesia status was monitored with a veterinary pulse oximeter (PulseSense VET, www.nonin.com). The SpSO2 probe was placed on the hairless, left hindpaw, and the left hindlimb was in contact with the heating pad of the animal platform, with the expectation of good perfusion of the skin in the foot containing mostly arterial blood. Heart rate was 303 ± 4 (65) min-1 and oxygen saturation was 88 ± 1 (65) %, below the normal range and not used to calculate arterial PO2. Following the completion of experimental measurements, animals were euthanized with an overdose of Euthasol (150 mg/kg i. v., pentobarbital component; Delmarva; Midlothian, VA).
Rat spinotrapezius muscle preparation
Surgical preparation of the rat spinotrapezius muscle was similar to the original descriptions (Gray, 1973; Engelson et al., 1986; Schmid-Schonbein et al., 1986; Bailey et al., 2000). The muscle was placed on a trans-illuminated pedestal of the animal platform, thermo-stabilized at 37°C (Golub and Pittman, 2003). In order to minimize muscle movement for isometric contractions, the edges of the muscle were fixed with 10–12 sutures to a rigid frame (Bailey et al., 2000). For the purpose of electrical stimulation, two chlorided silver wire electrodes were attached along the side edges of the muscle preparation. In order to ensure proper muscle fixation and electrode connection, a short electrical stimulation (1–5 s) was applied at the end of the preparation period. The muscle was allowed to stabilize for about 20 min while the phosphorescent probe was loaded into the interstitium (Golub et al., 2011). The muscle was then covered with a polyvinylidene chloride gas barrier film (Krehalon, CB-100; Kureha, Japan). An objective-mounted airbag made of the same film provided muscle compression at a supra-systolic pressure (Golub et al., 2011; Golub and Pittman, 2012). The airbag was pneumatically connected to a custom-built air pressure controller containing a diaphragm air pump (LT24, www.pentairaes.com), an electro-pneumatic regulator T3220 (www.marshbellofram.com) and a cycle timer, set for a 5 s period of high pressure at 140 mmHg and 15 s of low pressure at 5 mmHg. The low pressure in the airbag allowed free blood circulation, while providing a tight contact of the gas barrier film to the muscle surface.
Intravital and phosphorescence quenching microscopy
Measurements of PO2 and VO2 were carried out using an Axioimager-2m microscope with a 20X/0.8 Plan-Apochromat objective lens (Carl Zeiss, Germany). The measurement technique has been described in detail in our previous publications (Golub et al., 2011; Golub and Pittman, 2012; Nugent et al., 2016a; Nugent et al., 2016b), except for the application in the current work of the Oxyphor R2 dendrimer phosphorescent probe (www.oxygenent.net) whose calibration parameters were taken from the manufacturer (Lo et al., 1996). This R2 probe was chosen for its relatively low molecular weight (2.7 kD) and water-solubility that facilitated its loading into the interstitial space of a thin muscle by topical application of a 10 mg/mL solution for 30 min to the surgically exposed tissue. Octagonal regions of 300 µm diameter, containing no large vessels and separated by about 1 mm from each other were selected for PO2 and VO2 measurement sites in the central region of the muscle. PO2 was sampled at 1 Hz during 300 s of PO2 data collection (Figure 2). A color video camera KP-D20B (www.hitachikokusai.com) was employed for imaging and selection of the measurement sites.
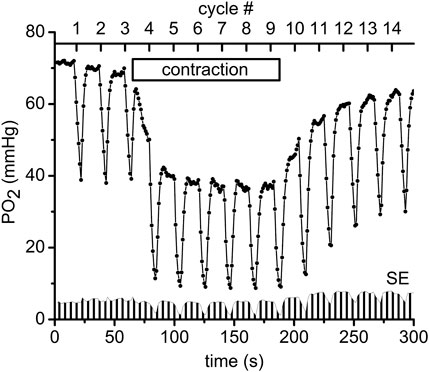
FIGURE 2. An example of the experimental procedure performed in muscle regions that consisted of measuring the interstitial PO2 every second for a time period of 300 s. Every 20 s a pulse of supra-systolic air pressure momentarily compressed the muscle for 5 s and then reduced the pressure to 5 mmHg for recovery during the next 15 s. The initial slope of the saw teeth indicates the rate of oxygen disappearance required to calculate VO2 (Nugent et al., 2016a). The scale on the top shows the numbers (#1–14) of the CR cycles (20 s each). Immediately after the end of compression #3 the electrical stimulation of the muscle started at 1 Hz and lasted until the end of CR#9 compression. The “contraction” box represents the electrical stimulation time interval. In total 11 experimental PO2 time courses, recorded in different microscopic regions of the same muscle preparation, were averaged and plotted as mean PO2’s in this diagram. Standard errors (SE) are presented as a fence-like pattern along the abscissa for convenience.
Experimental protocol
The following sequence of experimental events (at each site) as presented in Figure 2 (Behnke et al., 2009; Poole and Jones, 2012): baseline interstitial PO2 and VO2 were measured at rest during a 1-min time interval, then during 2 min of isometric contraction induced by electrical stimulation (10 V and 20 m duration) and finally during a 2-min post-contraction recovery period. In order to obtain data for different exercise intensities, 1, 2 and 4 Hz frequencies of electrical stimulation were used in different microscopic regions of muscle; the corresponding duty cycles were 20 m, 40 m and 80 m, respectively. For convenience the time scale of the experimental procedure was presented as CR cycle numbers (#, presented in the upper scale of Figure 2). The automatic cycling of a series of 14 tissue compressions started with 3 cycles of compression/release in the resting muscle. Then, the electrical stimulation started after the pressure release at CR cycle #3, so that the muscle was contracting during CR cycles #4–9 (Figure 2). Immediately after decompression in CR cycle #9, the stimulation stopped and the PO2 was recorded during the post-contraction CR cycles #10–14, as shown in Figure 2. Depending on preparation stability, the PO2 time course data were collected from 5 to 11 different sites in the central region of the same muscle. The time interval between the end of one 300 s record at one site on the muscle and the beginning of measurements at the next site was about 7.5 min (453 ± 14 s; N = 105).
Statistics
The Levenberg-Marquardt algorithm was used for PO2 calculations to fit the multiple phosphorescence decays with codes made using LabView software (www.ni.com). Statistical calculations and parameter fitting were made with the OriginPro 8.1 (originlab.com) software package. All data are presented as Mean ± SE (N, number of measurements).
Results
Stimulation rates of 1, 2 and 4 Hz
The data on interstitial PO2 and muscle tissue VO2 in experiments with 1, 2 and 4 Hz stimulation are presented in Figure 3 and Table 1. In resting muscle, the mean PO2 and VO2 were similar for all frequencies of stimulation, with the exception of pre-contraction PO2 = 82 mmHg in the 4 Hz series, which is 12 mmHg higher (p < 0.01) than baseline (CR cycles #1–3) PO2 for 1 and 2 Hz contraction. The transition of VO2 to its “steady state” contraction (CR cycles #3–5) in response to stimulation happened within a single CR cycle. The fall of PO2 to a stable low level took three, two and one cycle at 1, 2 and 4 Hz stimulation rates, respectively. The PO2 during the steady contraction period (CR cycles #5–9) decreased between 1 and 4 Hz stimulation rates, with a decrement of about 5 mmHg per Hz (Table 1). Compared with the resting state, the VO2 at 1 Hz stimulation (CR cycles #5–9) increased by a factor of 1.54, at 2 Hz by a factor of 2.42, but the VO2 at 4 Hz contraction was only slightly higher than at rest, by a factor of 1.32.
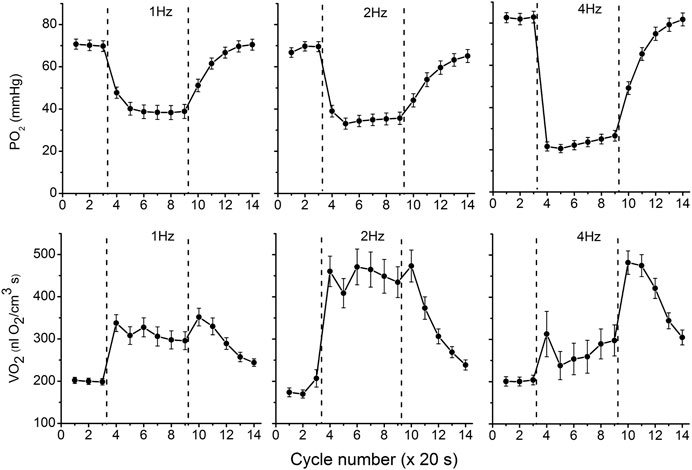
FIGURE 3. Interstitial oxygen tension (PO2, mmHg) and rate of oxygen consumption (VO2, nl O2/cm3 s), recorded in microscopic volumes of rat spinotrapezius muscle in response to electrical stimulation at 1, 2 and 4 Hz. The time unit is the number of CR cycles (20 s each). The electrical stimulation of the muscle started immediately after the end of CR #3 and stopped at the end of CR #9; the contraction time interval is marked by vertical dashed lines. The baseline (rest, CR cycles #1–3) is followed by the transition from rest to contraction (CR cycles #3–5), steady state contraction (# 5–9) and then the post-contraction recovery transients (CR cycles #9–14). Averaged PO2 and VO2 for segments of experimental curves and their numbers are presented in Table 1.
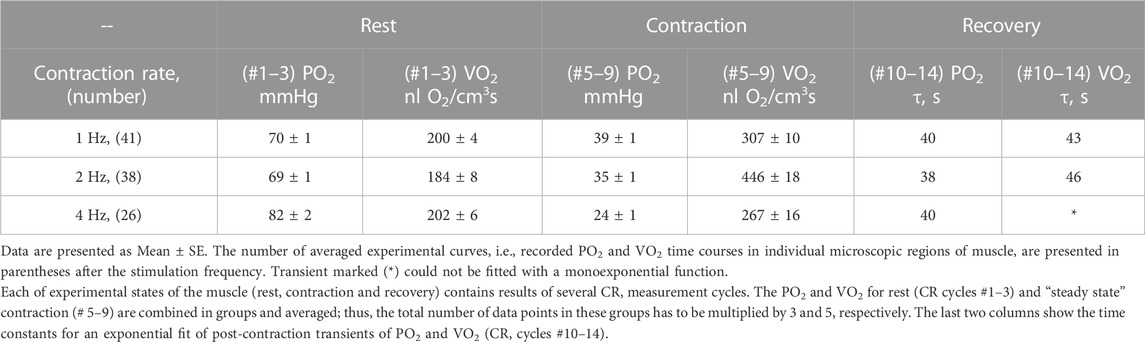
TABLE 1. Experimental data on interstitial PO2 and muscle VO2 at rest and during “steady-state” contraction and time constants for the recovery transients for stimulation rates 1, 2 and 4 Hz.
With cessation of muscle stimulation, after CR cycle #9, the PO2 began to increase exponentially towards pre-stimulation values. The PO2 rise had a time constant of 38–40 s (Figure 3; Table 1). After the end of stimulation, the high level VO2 was extended for at least one more CR cycle. In the experiments with 4 Hz stimulation, muscle VO2 first increased to a maximum for 2 CR cycles and then began to decrease toward the resting values. Thus, the post-contraction transients of PO2 and VO2 did not start synchronously and had different time constants (Table 1; Figure 3).
Two patterns of functional response
With further analysis, two distinct responses were identified across all applied stimulation frequencies. The VO2 responses to 1 and 4 Hz muscle contraction were very different (Figure 3), while the data set for the VO2 response to 2 Hz stimulation contained both types of responses. This indicates that, due to the dynamic heterogeneity of the measured microscopic regions of muscle (Poole and Jones, 2012; Heinonen et al., 2015) the responses to stimuli vary at the same stimulation rate. Since the difference in functional response between the data with stimulation at 4 Hz and 1 Hz is due to increased workload, we will assign them to the low workload and the high workload domains. At the same time, data with 2 Hz stimulation exhibit the properties of the first (16 PO2 data lines or records) or second type (22 PO2 time courses) of functional response. In order to enhance the contrast between VO2 responses, all data were sorted into two groups, in which the PO2’s during contraction were either above or below 30 mmHg (Figure 4; Figure 5; Table 2). For this purpose the PO2 values for the period of sustained contraction (CR cycles #5–9) were averaged and designated as minimal PO2, Pmin. Thus, all VO2 and PO2 curves fall into two groups with Pmin < 30 and Pmin > 30 mmHg characterized by two different types of functional response, conditionally named as low Pmin and high Pmin data sets, respectively (Table 2; Figure 4; Figure 5). An empirical analysis of the experimental curves gave reason to believe that sorting according to the “30 mmHg criterion” corresponds to a division of the data into low and high workload domains.
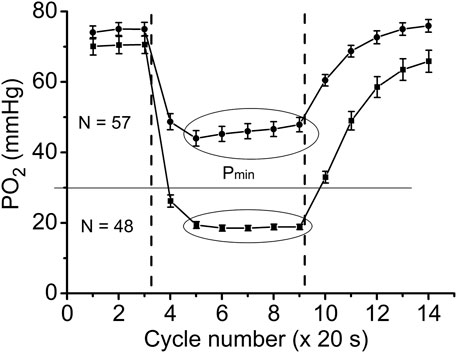
FIGURE 4. Time courses of interstitial PO2 in response to muscle contraction. All experimental data were sorted out according to the PO2 during “steady-state” contraction (“low workload group,” Pmin > 30 and “high workload group,” Pmin <30 mmHg). Low workload group contained all 1 Hz stimulation data and part of data with 2 Hz stimulation. High workload group contained all 4 Hz data and part of the 2 Hz group. These two groups of dynamic PO2 profiles, high and low Pmin data sets, have the same baseline (CR cycles #1–3) and different PO2 levels during the “steady-state” contraction (CR cycles #5–9). Restoration of PO2 in both groups began immediately after the cessation of stimulation (CR cycles #10–14).
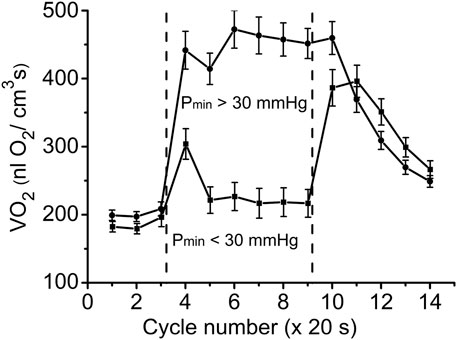
FIGURE 5. Time courses of muscle VO2 during rest, contraction and recovery periods. All experimental data were sorted into two groups according to Pmin. These two groups are also named as “low workload” (Pmin < 30 mmHg) and “high workload” (Pmin > 30 mmHg). In both groups the dynamic VO2 profiles have the same baseline level at rest (CR cycles #1–3) and different VO2 during the “steady-state” contraction (CR #5–9). After cessation of stimulation, VO2 in the low workload data set remained high for one CR cycle, and then decreased exponentially. In the high workload group VO2 during contraction period was low, but increased rapidly after end of contraction (CR cycles #10–14). Note the statistically significant VO2 peak at CR cycle #4, presumably due to utilization of local oxygen storage.
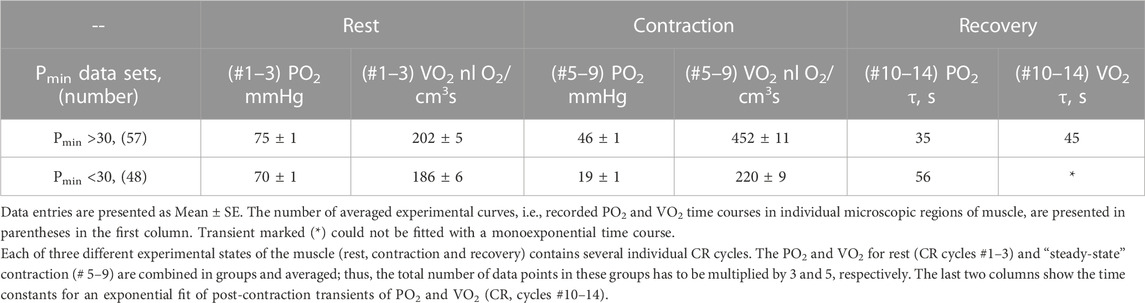
TABLE 2. Two sets of experimental data PO2 and VO2 grouped according to average PO2 during “steady-state” contraction (CR cycles # five to nine, marked Pmin).
These two sets of experimental data have distinct patterns of response to contraction. The baselines for PO2 and VO2 (CR cycles #1–3) were the same and the onset transients were similarly fast, but the values of oxygen consumption in the contracting muscle (CR cycles #5–9) differed by more than two-fold (p < 0.01). At muscle sites with low Pmin (Pmin < 30 mmHg) the VO2 response started from a VO2 peak (CR cycle #4; VO2 = 304 ± 22 nL O2/cm3 s; n = 39; p < 0.01) significantly above the following steady state contraction period (CR cycles #5–9; VO2 = 220 ± 9 nL O2/cm3 s; n = 221).
In the post-stimulation period, the PO2 started rising immediately, but at different rates in the two groups. Monoexponential PO2 restoration occurred much faster in the group of muscle regions with Pmin > 30 mmHg (Table 2). Excess post-contraction oxygen consumption (EPOC) also occurred quite differently in the two groups of data. The decrease of VO2 was significantly slower than that of PO2, and it was also slower in the group with Pmin < 30 mmHg (Table 2; Figure 5). A special feature of the post-contraction VO2 transients was the extension of a high VO2 level for one CR cycle at muscle regions with Pmin > 30 mmHg and for two CR cycles at the tissue sites with low Pmin. Thus, in the muscle regions with high Pmin the VO2 remained elevated as during contraction for about 20 s. In the low Pmin sites the VO2 started rising to its maximum level and then remained high for about 40 s before decreasing toward baseline (Figure 5). In both data groups the VO2 recovery occurred substantially more slowly than did the restoration of the PO2 values (Table 2).
Discussion
PO2 and VO2 at 1, 2 and 4 Hz stimulation
At all stimulation frequencies the onset of contraction evoked a VO2 rise and PO2 fall, which occurred within the duration of a single CR cycle (20 s). No typical time delay (Hirai et al., 2018; Poole et al., 2020) in the PO2 fall was detected, since it was substantially shorter than a single CR cycle.
The magnitude of the PO2 drop depended on the workload intensity, i.e., stimulation rate, so that an elevated capillary transmural PO2 difference could enhance the oxygen diffusion flux from capillaries. This factor provided a 1.5 times increase in VO2 at 1 Hz and a 2.4 times increase at 2 Hz stimulation frequencies. However, this trend did not apply to contraction at 4 Hz, when the VO2 was even lower than at 1 Hz stimulation.
The post-contraction increase of PO2 started immediately after the cessation of stimulation, although the high VO2 was sustained for about one CR cycle for the experimental groups at 1 and 2 Hz stimulation. The post-contraction dynamics of VO2 at 4 Hz was different from the transients produced by lower frequencies of stimulation. Upon the completion of 4 Hz stimulation, VO2 was maximized during one CR cycle, and then remained at a high level for another CR cycle before starting to decrease (Table 1; Figure 3). Features of transients in interstitial PO2 and muscle VO2 depended on the intensity of stimulation and contrasted more when comparing groups of data from different workload domains. An alternative interpretation of the post-contraction changes at 4 Hz stimulation is that any increase in O2 supply was insufficient to support VO2, hence the drop in PO2 and increased O2 extraction. But by cycles six to nine there was an increase in flow resulting in an increase in PO2 and hence an increase in VO2 due to VO2 dependence on PO2.
Comparison of low and high workload domains
In the groups of data for muscle regions with high and low Pmin the rest-to-work transition of VO2 and PO2 occurred within a single CR cycle (Figures 4, 5). That is in good agreement with the characteristic response time for these variables, obtained in experiments on dog and human muscles in situ (Grassi et al., 1998; Bangsbo, 2000; Grassi et al., 2002) and isolated muscle fibers (Hogan, 2001), microcirculatory measurements in the rat spinotrapezius muscle (Behnke et al., 2002; Poole et al., 2005; Hirai et al., 2018; Poole et al., 2020) and in the mathematical modeling of oxidative phosphorylation in mitochondria (Spires et al., 2012; Wilson, 2015a).
A more than two-fold increase in oxygen consumption at the rest-to-work transition was achieved in muscle regions with high Pmin, while in the group with low Pmin, a brief VO2 increase was followed by a VO2 slightly above the resting level (Figure 5; Table 2). In the low workload domain, the increase in O2 consumption and interstitial PO2 are inversely related. From rest-to-work, VO2 increased from 202 to 452 nL O2/cm3s, while the PO2 decreased from 75 to 46 mmHg. However, this relationship was broken in the data group with high workload. Interstitial PO2 decreased from 70 to 19 mmHg, while the average VO2 increased from 186 to 220 nL O2/cm3s. In this case, VO2 increased only at the beginning of the working period, and then returned close to the resting level. The elevated oxygen consumption at the beginning of the contraction period (CR cycle #4) in the low Pmin data set may serve as evidence of a brief period of oxygen supply supported by local oxygen storage (Figures 3, 5). Previously published data on the rate of oxygen disappearance in this muscle reported the ability of local oxygen storage to supply muscle respiration for about one CR cycle (Golub and Pittman, 2012).
An important finding of this study was the time lag of VO2 remaining high after the end of stimulation for about 20–40 s (Figure 5). Interstitial PO2 started rising immediately after the end of contraction, almost twice as fast as in the low workload domain (Table 2; Figure 4). In the regions of muscle with high Pmin, the maximal VO2 value extended for one CR cycle, followed by a decrease with a time constant of 45 s (Table 2). In the set of data with low Pmin, post-contraction VO2 increased nearly two-fold in one CR cycle #10, then remained high in CR cycle #11. The VO2 decline began in the next CR cycle #12 at the same slow rate. The post-contraction transients of VO2 were slower than those of PO2 and no symmetry was observed with the rapid changes at the onset of contraction.
Analysis of the VO2(PO2) cyclogram for high and low workload in the muscle
The experimental procedure was carried out cyclically: first, data were obtained at rest, then electrical stimulation was turned on for 6 CR measuring cycles. The muscle was then left at rest for about 10 min to recover before the next CR cycle. It is convenient to display such processes on a cyclogram in which the time parameter is excluded and the data are presented in the form of VO2 vs. PO2 points. Analysis of the current data was based on a previously published study on the oxygen dependence of tissue respiration (Golub et al., 2018).
The analogy between oxygen tension and oxygen flux in organs, and the voltage and current in electrical circuits is traditionally used for interpretation and mathematical modeling of oxygen transport and its control (Piiper and Scheid, 1975a; Piiper and Scheid, 1975b; Piiper, 1982; Piiper, 1992; Powell and Hempleman, 1993; Piiper and Scheid, 1999; Piiper, 2000; Wagner, 2000; Spires et al., 2013). This analogy is based on the applicability of Ohm’s and Kirchhoff’s laws to a circuit delivering oxygen to parenchymal cells, which is true when properly identifying the corresponding variables. In schematic diagrams the components of O2 transport are usually represented by resistor symbols, though conductance, the reciprocal of resistance, is used in the physiological models to avoid confusing it with the hemodynamic resistance in vessels.
In the electrical analogy of the oxygen supply, oxygen flux Vs and respiration rate VO2 in myocytes are equivalent to an electrical current. This allows plotting both variables in the same coordinates VO2(PO2) (Figure 6). Oxygen delivery and consumption are connected in series, so O2 flux and consumption are equal (in absolute value) during steady states. For simplicity, we assume that fully oxygenated arterial blood entering the muscle has plasma O2 tension Pa. The voltage is represented by the transcapillary difference of oxygen tensions, as between blood and interstitium: (Pa—PO2), where PO2 represents interstitial oxygen tension. A coefficient of proportionality between Vs and (Pa—PO2) in Ohm’s law is the overall transport conductance, Go. The dependence of the oxygen delivery rate on PO2 is determined by a straight line passing through the point Pa at zero O2 consumption (Figure 6, lines A and B):
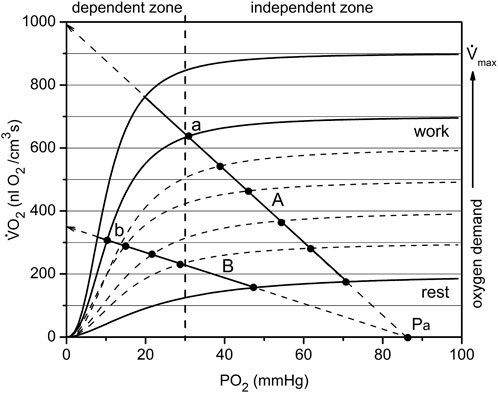
FIGURE 6. The mechanism of passive balance of oxygen delivery and consumption in skeletal muscle. The dependence of muscle respiration VO2 on interstitial PO2 is expressed by a sigmoid curve consisting of segments relatively dependent and independent of PO2. In addition, the oxygen demand increases with increasing workload, and each level of workload has a separate sigmoid curve. All together they make up a set of characteristics of the oxygen dependence of respiration, separated approximately into O2-dependent and -independent zones at a PO2 of about 30 mmHg. Oxygen delivery is linearly dependent on the difference in oxygen tension between arterial blood and interstitial space: (Pa—PO2). Depending on the conductance Go of the oxygen delivery pathway, the line may go steep or flat, but will cross the point Pa on the abscissa. The point of intersection between the sigmoid curve VO2 (PO2) and the line (for example, A or B) is the solution to the delivery/consumption balance problem. When the respiration rate of the muscle changes, the point will move along the line. Such sliding within the independent zone is capable of supplying the muscles with oxygen over a wide range of PO2. For the less steep O2 supply line B, there are restrictions on oxygen consumption due to the supply. Points a and b belong to the same workload curve, but supply lines A and B have different values of O2 conductance, Go. Therefore, the muscle in state b performs the same work as in state a, but under conditions of reduced PO2. This occurs due to the reserves of oxygen, ATP and phosphocreatine in myocytes, which are replenished due to high VO2 following the period of muscle work (Figure 5).
In this equation, Vs. represents the oxygen flux or rate of oxygen delivery, driven by the difference of arterial oxygen tension and interstitial PO2 through the conductance Go (Figure 6). Data from this study used for rat arterial blood PO2 was Pa = 94 mmHg (Turek et al., 1978). At PO2 = 0, this line intersects the vertical axis for Vs. and VO2 at the point Vs = Go·Pa, from which it follows that Go is equal to the slope of the line that determines the rate of oxygen delivery. A larger oxygen conductance (Figure 6: line A vs. line B) corresponds to a greater efficiency of oxygen transport (Piiper and Scheid, 1975b; Piiper, 1982; Piiper, 1992).
It should be noted that the overall conductance, Go, is determined jointly by the convective and diffusive conductances according to the rule:
Diffusive conductance Gd is determined by the stable anatomical structure of the microvasculature and a relatively constant density of perfused capillaries at different workloads (Turek et al., 1978; Piiper, 1992; Piiper and Scheid, 1999). Thus, the changes in overall oxygen conductance are mainly determined by variation of the convective O2 conductance Gc.
The analysis of the factors involved in the balance between O2 supply and demand at different levels of metabolic activity tend to neglect the role of the PO2 dependence of tissue respiration rate (Piiper and Scheid, 1975b; Piiper and Scheid, 1999; Wagner, 2011a). Recent measurements (Golub and Pittman, 2012; Wilson et al., 2012; Wilson et al., 2014; Wilson, 2015a; Golub et al., 2018) have brought evidence that the respiration rate of cells is PO2-dependent and that at different levels of functional activity these dependencies are similar in shape but different in amplitude. The oxygen dependence of respiration is a combined effect of metabolic regulation in mitochondria (Wilson et al., 1977; Wilson et al., 2012; Wilson, 2015a; Wilson, 2015b; Wilson, 2016) and the intracellular diffusion barrier (Golub and Pittman, 2012). Each curve of this type is Ohm’s Law for the cell, and each level of energy expenditure has a separate curve defined by workload.
The oxygen dependence of the respiratory rates on interstitial PO2 in this muscle were obtained previously (Golub et al., 2018). These dependences are expressed as a set of sigmoidal curves VO2 (PO2), with magnitude directly dependent on workload (Figure 6). If lines A and B in Figure 6 represent oxygen flux to the muscle (according to Eq. 1) and the sigmoid line represents the O2 consumption rate, then the intersection point corresponds to the equality of oxygen supply and consumption. For each level of workload, there is only one equilibrium point that belongs to both the characteristic curve of tissue oxygen supply, Vs, and oxygen consumption rate, VO2. For each level of workload, there is only one equilibrium point that belongs to both the characteristic curve of myocyte respiration VO2 (PO2) and the line for the rate of O2 supply Vs (PO2) described by Eq. 1.
Each experimental point is determined by a pair of values in the coordinates VO2 vs. PO2. These data are shown separately in Figure 4 and Figure 5. At a given PO2, the muscle receives an oxygen flux Vs and consumes O2 at the rate VO2. Thus, each state of muscle respiration corresponds to the conductance Go, which can be determined as:
This expression is valid for stationary states represented by CR #1–3 (rest) and CR #5–9 (work). Eq. 3 can also be applied to transients, provided the influence of local oxygen storage is negligible. Data used for rat arterial blood PO2 was Pa = 94 mmHg (Turek et al., 1978).
The graphical analysis was applied to two contrasting groups of experimental data for low and high workload (Figure 7; Figure 8). These two groups of VO2(PO2) data points for oxygen supply Vs and consumption rate VO2 are plotted over the set of sigmoidal curves representing the oxygen dependence of respiration for this muscle (Golub et al., 2018). The location of the points for both resting data groups is the same, but the difference is revealed in transitions from rest (CR points one to three) to steady state contraction (CR points five to nine). The rest-to-work transition defines a corresponding O2 supply line, which crosses the PO2 axis at Pa (Figure 7 and partly in Figure 8).
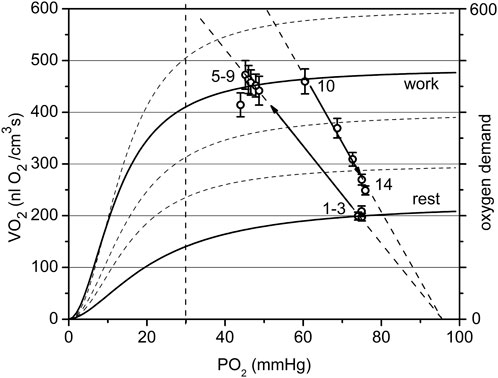
FIGURE 7. The cyclogram (points #1–14) represents in coordinates of VO2 vs. PO2 the complete experimental cycle for the low workload data group: stationary rest (points one to three), rest-to-work transition, stationary work (points five to nine), work-to-rest transition (points 10–14). The calculated conductance for the steady state is 10.6 at rest and 9.4 nL O2/(cm3·s·mmHg at work. The rest-to-work transition line has a conductivity of 9.5, close to that in steady work, but lower than at rest. The reverse pathway or work-to-rest runs along the line with increased O2 conductance Go = 13.7. The vertical dashed line separates the relatively dependent and independent zones for VO2(PO2) curves).
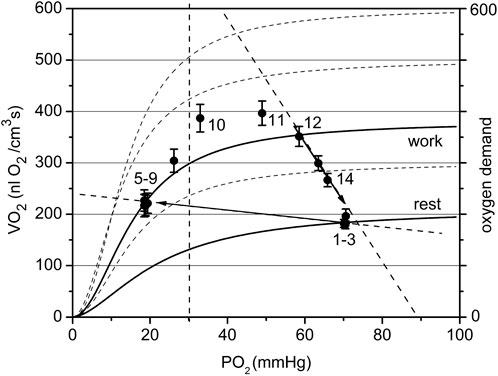
FIGURE 8. The cyclogram (points #1–14) represents the complete experimental cycle for the high workload data group: stationary rest (points one to three), rest-to-work transition, stationary work (points five to nine), work-to-rest transition (points 10–14). The calculated O2 conductance for the steady state is 7.8 at rest and 2.9 nL O2/(cm3·s mmHg) at work. The position of the “steady work” data points #five to nine in the dependent zone is characterized by a low respiration rate, forced by a low PO2. The rest-to-work transition line goes beyond the scope of the model, since it does not pass through the point Pa. The proposed reason for this behavior is the development of tetanus, which dramatically reduces oxygen conductivity by reducing blood flow in the muscle. The return to the state of rest follows a wide arc with a long-term increase in the respiration rate and then its decrease along the supply line with Go about 13.4 nL O2/(cm3·s mmHg).
In the low workload data set (Figure 7) a steady state conductance, calculated from Table 2, at rest was Go = 10.6, while at work it was 9.4 nL O2/(cm3s·mmHg). The value at rest is the starting point of the cycle, with a minimum flow of oxygen through the muscle. In steady state muscular work, the conductance is moderately reduced, presumably proportional to the time fraction of muscle contraction, or fill factor. The rest-to-work transition going along the O2 supply line with Go = 9.5 nL O2/(cm3s·mmHg), was close to the value of Go for the steady state at work. This line is entirely located in the PO2-independent segments of the VO2(PO2) characteristics. This indicates that the contracting muscle (CR points five to nine) had an enhanced O2 supply mostly due to the increased PO2 gradient between blood and muscle cells. Following the cessation of stimuli, the overall O2 conductance instantly increased to 13.7 nL O2/(cm3s·mmHg) during the return to the resting state (CR points 10–14). An increase in conductance during the work-to-rest transition reflects the development of vasodilation in the muscle (Marshall and Tandon, 1984). The changes in Go resulted in a narrow loop trajectory describing the complete cycle of muscle contraction/relaxation.
The data set collected at high workload (Pmin < 30 mmHg) is displayed in Figure 8. With a high workload, the difference in overall conductance Go at rest and work is more pronounced: 7.8 and 2.9 nL O2/(cm3s·mmHg), respectively. The conductance at the starting point is noticeably lower than that in the low workload domain and conductance during steady work dropped substantially. We hypothesize that this is due to the impact of muscle contraction at this stimulation rate on local microvascular perfusion, which greatly increased the fill factor for the contracted muscle phase. The O2 supply line for the rest-to-work transition was directed into the PO2-dependent zone of the VO2(PO2) characteristics for myocytes and the O2 supply line for transition is near horizontal, with a low Go = 0.8 nL O2/(cm3s·mmHg). The cause of this phenomenon lies in the limitation of blood flow in an intensely contracting muscle. In the classic experiments of Barcroft (Barcroft, 1972a; Barcroft, 1972b), it was established that static muscle contraction at a workload higher than 20% of the maximum level causes the hindrance and arrest of blood flow. The cause for blood flow arrest is the supra-systolic tissue pressure developed in a contracting muscle, demonstrated by direct measurements (Styf et al., 1987; Crenshaw et al., 1992; Hargens et al., 1992). The hindrance of blood flow in muscle was detected at a compartment pressure above 30–80 mmHg (Jarvholm et al., 1988; Crenshaw et al., 1992). In a rhythmically contracting muscle the intramuscular pressure has a series of peaks, so that the mean time of the arrested blood flow may be less than 50% of the total time (Hargens and Ballard, 1995; Styf et al., 1995; Saltin et al., 1998).
Other potential explanations for the stratification of the data into two groups according to Pmin include heterogeneity in capillary density, geometry, and capillary RBC supply rate between different regions. In addition, the relative placement of the measurement region in terms of arteriolar or venular end of capillaries and A-V units could also influence the measured interstitial PO2s due to longitudinal SO2 gradients along the length of capillaries. This may explain why some regions at 2 Hz contraction frequency fell within the Pmin < 30 mmHg bin when no physical impediment to vascular filling was present. Another possibility is that some regions have relatively lower RBC supply/tissue volume, which is somewhat supported by the lower resting PO2 in the high workload group—while one might expect lower perfused regions to increase RBC supply proportionally to increases elsewhere, it is possible that more reactive regions, in terms of arteriolar vasodilation, could shift the distribution of blood flow to regions with higher conductance.
After the cessation of contraction in the high workload data group (Figure 8), the transition from work-to-rest occurred in a wide arc, with high respiration rate and rapidly rising PO2. The final segment of the cycle runs along the line with approximately Go = 13.4 nL O2/(cm3s·mmHg), a much higher conductance than in the steady state at rest.
The employment of the conductance parameter Go to describe steady states and transient processes in muscle makes it possible to represent the cycle of oxygen delivery/consumption during a full cycle of work and rest (Figure 9). The difference between Go in the two data groups was large during the steady rest and contraction periods and remained large in the post-contraction Go transient. The post-contraction time lag of VO2 had no effect on the Go transient that started at the end of the contraction period (Figure 9). Go had reached a maximum at 40–60 s after the end of stimulation and then started to decrease. The analysis of Go demonstrated that no active hyperemia was developed during isometric contractions at high workload (Pmin < 30 mmHg); but oppositely, that type of contraction was accompanied by limited blood flow. Blood flow restoration and hyperemia occurred during the post-contraction period, contributing to the formation of the PO2 and VO2 transients (Figures 5, 6). Note that Go for stationary rest and work is an exact value, but the Go for transients can be distorted by the effect of local oxygen storage.
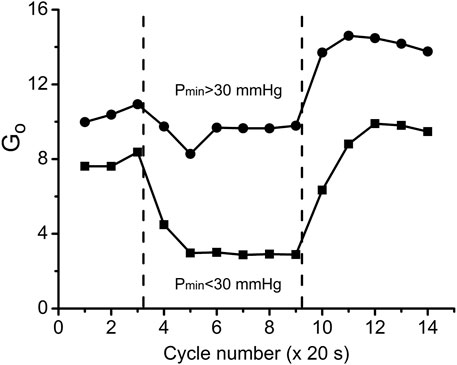
FIGURE 9. Overall oxygen conductance Go (units: nl O2/cm3 s mmHg) in the two workload groups of data during the transitions through three experimental states: rest, work and recovery. Go values were calculated according to Eq. 3 using data from Figures 5, 6. Muscle regions with low workload (high Pmin) during the contraction kept Go = 9.4 at almost the same level as at rest Go = 10.6, but there was an increase of Go during the recovery phase, indicating vasodilation. In the data group of high workload (low Pmin) Go was reduced from rest Go = 7.8 to contraction Go = 2.9, presumably due to high intramuscular pressure, developed by intensive muscle contraction. Following the cessation of stimulation, Go reached a peak value which was lower than in the low workload data group.
By comparing the time courses of Go during the rest-work-rest cycle at low and high workload we distinguish two types of changes in the state of delivery/consumption of oxygen in the muscle. At low workload, the rest-to-work transition occurs with a slight decrease in oxygen conductivity, and the reverse transition is associated with an increase in conductivity above the rest level. Under high workload, steady work occurs under severely limited delivery conditions. At the same time, myocytes are in the region of respiration dependent on PO2, which greatly limits their respiration rate. Restoration of muscle resources begins after the end of steady work with the transition to the zone of VO2, which is virtually independent of PO2. Recovery is characterized by a long period of high PO2 and VO2 with a return to rest along a line with high conductance. The changes of Go during rest, contraction and recovery agree with classical experimental evidence that contractions engender a mechanical impediment to the passage of blood through human muscle and the mechanical hindrance of contraction reduces blood flow (Folkow et al., 1969; Barcroft, 1972a; Barcroft, 1972b; Chilian and Marcus, 1982; Styf et al., 1987; Jarvholm et al., 1988) and leads to the development of vasodilation after the end of the work period (Marshall and Tandon, 1984).
Conclusion
The mechanisms responsible for the coordination of functional activities by the musculature and vasculature in skeletal muscle, over a wide range of workloads, remain a problem of interest in physiology. A dominating paradigm in muscle physiology is that the VO2 kinetics associated with muscle contraction is principally determined by the activity of mitochondria in myocytes, rather than by the integrated O2 transport system. This theory was rooted in the belief that cellular respiration is independent of oxygen level. New evidence regarding the oxygen dependence of respiration requires a reevaluation of the role of interstitial PO2, which is not only a gauge of the balance between oxygen delivery and consumption, but also a modulator of tissue respiration (Golub et al., 2018).
Simultaneous measurements of PO2 and VO2 were conducted in the muscle interstitial space during periods of rest, isometric contraction and recovery. Increasing the intensity of contractions from 1 to 4 Hz also increased the extent of muscle regions with a contraction-induced fall of PO2 below 30 mmHg, which was accompanied by a reduced VO2 due to limitation in O2 delivery. Тhe results indicate that in the range of stimulation frequencies from 1 to 4 Hz, there is a transition from a series of twitches to a contraction, which impedes the delivery of oxygen to myocytes.
Two types of functional response were distinguished in contracting muscle, depending on the effect of the increased workload on steady-state PO2. In muscle regions where interstitial PO2 remained above 30 mmHg during steady contraction (low workload), VO2 increased rapidly and stabilized at a high level. Total O2 conductance remained almost the same as at rest. After the end of the contraction period, the PO2 increased immediately, while high VO2 lagged behind for 20 s and then slowly decreased. At a high workload the PO2 at contraction fell below 30 mmHg, the VO2 was limited by O2 delivery almost to its resting level. Because of the strong oxygen dependence of respiration below 30 mmHg, that level of interstitial PO2 and VO2 may be considered as evidence of low oxygen conductance due to mechanical hindrance to blood flow.
Upon cessation of 4 Hz contraction, the low VO2 sharply increased to a high level, then remained elevated for 40 s before starting to fall at a much slower rate than in low intensity contractions. The post-contraction transients of PO2 and VO2 were not synchronous and had different time constants, all much slower than the onset transients.
Complex trajectories of the process of restoring the oxygen balance after work indicate a dependence on other variables, except for VO2 and PO2, as is in the case of steady states. First of all, this is the convective conductance of oxygen, which can decrease due to intramuscular pressure or increase due to vasodilation. Another factor is intramuscular oxygen reserves, which are not involved in steady states, but can be depleted or replenished with oxygen during transients.
In contracting muscle, the balance between oxygen delivery and consumption, known as an “adequate O2 supply,” is violated during transients. The new balance may not be achievable if the muscle workload exceeds the limit imposed by the increase in blood flow. Consequently, under intense muscle contraction there is a mismatch between oxygen supply and demand, which can be compensated during the post-exercise recovery by the development of hyperemia. Cellular respiration and the microcirculation in the muscle are integrated into a system of oxygen processing, capable of complex adaptive behavior that includes time separation between work and compensation for energy expenditure.
Data availability statement
The original contributions presented in the study are included in the article/supplementary material, further inquiries can be directed to the corresponding author.
Ethics statement
The animal study was reviewed and approved by Virginia Commonwealth University Institutional Animal Care and Use Committee.
Author contributions
Conception and research design AG, RP, BS, and WN. Experimental setup and protocol AG, BS, and WN. Performing experiments BS, WN, and AG. Data collection BS, WN, and AG. Data analysis AG. Interpretation of results AG and RP. Manuscript and figures preparation AG. Editing and revising manuscript AG and RP. Final version of MS approval AG and RP. All authors contributed to the article and approved the submitted version.
Funding
This work was supported by Grant 14GRNT20380551 from the American Heart Association.
Conflict of interest
Authors AG, BS, and WN were employed by Song Biotechnologies LLC.
The remaining author declares that the research was conducted in the absence of any commercial or financial relationships that could be construed as a potential conflict of interest.
Publisher’s note
All claims expressed in this article are solely those of the authors and do not necessarily represent those of their affiliated organizations, or those of the publisher, the editors and the reviewers. Any product that may be evaluated in this article, or claim that may be made by its manufacturer, is not guaranteed or endorsed by the publisher.
Abbreviations
PO2, oxygen tension in the interstitium; VO2, oxygen consumption (equal to O2 flux); PQM, phosphorescence quenching method (or microscopy); CR, compression and recovery cycle for VO2 measurement; ODC, oxygen disappearance curve.
References
Bailey, J. K., Kindig, C. A., Behnke, B. J., Musch, T. I., Schmid-Schoenbein, G. W., and Poole, D. C. (2000). Spinotrapezius muscle microcirculatory function: Effects of surgical exteriorization. Am. J. Physiol. Heart Circ. Physiol. 279 (6), H3131–H3137. doi:10.1152/ajpheart.2000.279.6.H3131
Bangsbo, J. (2000). Muscle oxygen uptake in humans at onset of and during intense exercise. Acta Physiol. Scand. 168 (4), 457–464. doi:10.1046/j.1365-201x.2000.00697.x
Barcroft, H. (1972a). An enquiry into the nature of the mediator of the vasodilatation in skeletal muscle in exercise and during circulatory arrest. J. Physiol. 222 (2), 99P–118P. doi:10.1113/jphysiol.1972.sp009826
Barcroft, H. (1972b). The mechanism of vasodilatation in the limbs during and after arrest of the circulation. Angiology 23 (10), 595–599. doi:10.1177/000331977202301003
Behnke, B. J., Barstow, T. J., Kindig, C. A., McDonough, P., Musch, T. I., and Poole, D. C. (2002). Dynamics of oxygen uptake following exercise onset in rat skeletal muscle. Respir. Physiol. Neurobiol. 133 (3), 229–239. doi:10.1016/s1569-9048(02)00183-0
Behnke, B. J., Ferreira, L. F., McDonough, P. J., Musch, T. I., and Poole, D. C. (2009). Recovery dynamics of skeletal muscle oxygen uptake during the exercise off-transient. Respir. Physiol. Neurobiol. 168 (3), 254–260. doi:10.1016/j.resp.2009.07.013
Behnke, B. J., Kindig, C. A., Musch, T. I., Koga, S., and Poole, D. C. (2001). Dynamics of microvascular oxygen pressure across the rest-exercise transition in rat skeletal muscle. Respir. Physiol. 126 (1), 53–63. doi:10.1016/s0034-5687(01)00195-5
Behnke, B. J., McDonough, P., Musch, T. I., Poole, D. C., and Arena, R. (2003b). Comparison of oxygen uptake on-kinetics calculations in heart failure. Med. Sci. Sports Exerc 35 (4), 708. doi:10.1249/01.MSS.0000058444.43322.05
Behnke, B. J., McDonough, P., Padilla, D. J., Musch, T. I., and Poole, D. C. (2003a). Oxygen exchange profile in rat muscles of contrasting fibre types. J. Physiol. 549 (2), 597–605. doi:10.1113/jphysiol.2002.035915
Borsheim, E., and Bahr, R. (2003). Effect of exercise intensity, duration and mode on post-exercise oxygen consumption. Sports Med. 33 (14), 1037–1060. doi:10.2165/00007256-200333140-00002
Casey, D. P., and Joyner, M. J. (2011). Local control of skeletal muscle blood flow during exercise: Influence of available oxygen. J. Appl. Physiol. 111 (6), 1527–1538. doi:10.1152/japplphysiol.00895.2011
Chilian, W. M., and Marcus, M. L. (1982). Phasic coronary blood flow velocity in intramural and epicardial coronary arteries. Circ. Res. 50 (6), 775–781. doi:10.1161/01.res.50.6.775
Clifford, P. S. (2011). Local control of blood flow. Adv. Physiol. Educ. 35 (1), 5–15. doi:10.1152/advan.00074.2010
Clifford, P. S. (2007). Skeletal muscle vasodilatation at the onset of exercise. J. Physiol. 583 (3), 825–833. doi:10.1113/jphysiol.2007.135673
Clifford, P. S., and Tschakovsky, M. E. (2008). Rapid vascular responses to muscle contraction. Exerc Sport Sci. Rev. 36 (1), 25–29. doi:10.1097/jes.0b013e31815ddba4
Crenshaw, A. G., Styf, J. R., and Hargens, A. R. (1992). Intramuscular pressures during exercise: An evaluation of a fiber optic transducer-tipped catheter system. Eur. J. Appl. Physiol. Occup. Physiol. 65 (2), 178–182. doi:10.1007/BF00705077
Engelson, E. T., Schmid-Schonbein, G. W., and Zweifach, B. W. (1986). The microvasculature in skeletal muscle. II. Arteriolar network anatomy in normotensive and spontaneously hypertensive rats. Microvasc. Res. 31 (3), 356–374. doi:10.1016/0026-2862(86)90024-5
Folkow, B., Gaskell, P., and Waaler, B. A. (1969). Blood flow through muscles during heavy rhythmic exercise. Acta Physiol. Scand. 76 (1), 22A–23A.
Golub, A. S., and Pittman, R. N. (2013b). Bang-bang model for regulation of local blood flow. Microcirculation 20 (6), 455–483. doi:10.1111/micc.12051
Golub, A. S., and Pittman, R. N. (2013a). Last word on viewpoint: A paradigm shift for local blood flow regulation. J. Appl. Physiol. 116, 708. doi:10.1152/japplphysiol.00006.2014
Golub, A. S., and Pittman, R. N. (2012). Oxygen dependence of respiration in rat spinotrapezius muscle in situ. Am. J. Physiol. Heart Circ. Physiol. 303 (1), H47–H56. doi:10.1152/ajpheart.00131.2012
Golub, A. S., and Pittman, R. N. (2003). Thermostatic animal platform for intravital microscopy of thin tissues. Microvasc. Res. 66 (3), 213–217. doi:10.1016/s0026-2862(03)00061-x
Golub, A. S., Dodhy, S. C., and Pittman, R. N. (2018). Oxygen dependence of respiration in rat spinotrapezius muscle contracting at 0.5-8 twitches per second. J. Appl. Physiol. 125(1), 124–133. doi:10.1152/japplphysiol.01136.2016
Golub, A. S., Tevald, M. A., and Pittman, R. N. (2011). Phosphorescence quenching microrespirometry of skeletal muscle in situ. Am. J. Physiol. Heart Circ. Physiol. 300 (1), H135–H143. doi:10.1152/ajpheart.00626.2010
Grassi, B., Gladden, L. B., Samaja, M., Stary, C. M., and Hogan, M. C. (1998). Faster adjustment of O2 delivery does not affect V(O2) on-kinetics in isolated in situ canine muscle. J. Appl. Physiol. 85(4), 1394–1403. doi:10.1152/jappl.1998.85.4.1394
Grassi, B., Hogan, M. C., Greenhaff, P. L., Hamann, J. J., Kelley, K. M., Aschenbach, W. G., et al. (2002). Oxygen uptake on-kinetics in dog gastrocnemius in situ following activation of pyruvate dehydrogenase by dichloroacetate. J. Physiol. 538 (Pt 1), 195–207. doi:10.1113/jphysiol.2001.012984
Gray, S. D. (1973). Rat spinotrapezius muscle preparation for microscopic observation of the terminal vascular bed. Microvasc. Res. 5 (3), 395–400. doi:10.1016/0026-2862(73)90055-1
Hargens, A. R., and Ballard, R. E. (1995). Basic principles for measurement of intramuscular pressure. Oper. Tech. Sports Med. 3 (4), 237–242. doi:10.1016/s1060-1872(95)80022-0
Hargens, A. R., Watenpaugh, D. E., and Breit, G. A. (1992). Control of circulatory function in altered gravitational fields. Physiologist 35 (1), S80–S83.
Heinonen, I., Koga, S., Kalliokoski, K. K., Musch, T. I., and Poole, D. C. (2015). Heterogeneity of muscle blood flow and metabolism: Influence of exercise, aging, and disease states. Exerc Sport Sci. Rev. 43 (3), 117–124. doi:10.1249/JES.0000000000000044
Hill, A. V., Long, C. N., and Lupton, H. (1924). Muscular exercise, lactic acid and the supply and utilisation of oxygen. Proc. R. Soc. Lond. B 97, 155–176.
Hirai, D. M., Craig, J. C., Colburn, T. D., Eshima, H., Kano, Y., Sexton, W. L., et al. (2018). Skeletal muscle microvascular and interstitial PO2 from rest to contractions. J. Physiol. 596 (5), 869–883. doi:10.1113/JP275170
Hogan, M. C. (2001). Fall in intracellular PO(2) at the onset of contractions in Xenopus single skeletal muscle fibers. J. Appl. Physiol. 90 (5), 1871–1876. doi:10.1152/jappl.2001.90.5.1871
Jarvholm, U., Palmerud, G., Styf, J., Herberts, P., and Kadefors, R. (1988). Intramuscular pressure in the supraspinatus muscle. J. Orthop. Res. 6 (2), 230–238. doi:10.1002/jor.1100060210
Joyner, M. J., and Casey, D. P. (2015). Regulation of increased blood flow (hyperemia) to muscles during exercise: A hierarchy of competing physiological needs. Physiol. Rev. 95 (2), 549–601. doi:10.1152/physrev.00035.2013
Joyner, M. J., and Wilkins, B. W. (2007). Exercise hyperaemia: Is anything obligatory but the hyperaemia? J. Physiol. 583 (3), 855–860. doi:10.1113/jphysiol.2007.135889
Kindig, C. A., Howlett, R. A., and Hogan, M. C. (2003). Effect of extracellular PO2 on the fall in intracellular PO2 in contracting single myocytes. J. Appl. Physiol. 94 (5), 1964–1970. doi:10.1152/japplphysiol.00893.2002
Koga, S., Rossiter, H. B., Heinonen, I., Musch, T. I., and Poole, D. C. (2014). Dynamic heterogeneity of exercising muscle blood flow and O2 utilization. Med. Sci. Sports Exerc 46 (5), 860–876. doi:10.1249/MSS.0000000000000178
Krogh, A. (1922). The anatomy and physiology of capillaries. First ed. New Haven: Yale University Press.
Krogh, A. (1919). The supply of oxygen to the tissues and the regulation of the capillary circulation. J. Physiol. 52 (6), 457–474. doi:10.1113/jphysiol.1919.sp001844
Lo, L. W., Koch, C. J., and Wilson, D. F. (1996). Calibration of oxygen-dependent quenching of the phosphorescence of Pd-meso-tetra (4-carboxyphenyl) porphine: A phosphor with general application for measuring oxygen concentration in biological systems. Anal. Biochem. 236 (1), 153–160. doi:10.1006/abio.1996.0144
Marshall, J. M., and Tandon, H. C. (1984). Direct observations of muscle arterioles and venules following contraction of skeletal muscle fibres in the rat. J. Physiol. 350, 447–459. doi:10.1113/jphysiol.1984.sp015211
McDonough, P., Behnke, B. J., Kindig, C. A., and Poole, D. C. (2001). Rat muscle microvascular PO2 kinetics during the exercise off-transient. Exp. Physiol. 86 (3), 349–356. doi:10.1113/eph8602192
Nugent, W. H., Song, B. K., Pittman, R. N., and Golub, A. S. (2016a). Simultaneous sampling of tissue oxygenation and oxygen consumption in skeletal muscle. Microvasc. Res. 105, 15–22. doi:10.1016/j.mvr.2015.12.007
Nugent, W. H., Song, B. K., Pittman, R. N., and Golub, A. S. (2016b). Simultaneous sampling of tissue oxygenation and oxygen consumption in skeletal muscle. Microvasc. Res. 105, 15–22. doi:10.1016/j.mvr.2015.12.007
Piiper, J. (1992). Modeling of oxygen transport to skeletal muscle: Blood flow distribution, shunt, and diffusion. Adv. Exp. Med. Biol. 316, 3–10. doi:10.1007/978-1-4615-3404-4_1
Piiper, J. (2000). Perfusion, diffusion and their heterogeneities limiting blood-tissue O2 transfer in muscle. Acta Physiol. Scand. 168 (4), 603–607. doi:10.1046/j.1365-201x.2000.00711.x
Piiper, J. (1982). Respiratory gas exchange at lungs, gills and tissues: Mechanisms and adjustments. J. Exp. Biol. 100, 5–22. doi:10.1242/jeb.100.1.5
Piiper, J., and Scheid, P. (1975b). Gas transport efficacy of gills, lungs and skin: Theory and experimental data. Respir. Physiol. 23 (2), 209–221. doi:10.1016/0034-5687(75)90061-4
Piiper, J., and Scheid, P. (1999). Modeling oxygen availability to exercising muscle. Respir. Physiol. 118 (2-3), 95–101. doi:10.1016/s0034-5687(99)00082-1
Piiper, J., and Scheid, P. (1975a). Proceedings: Measurement of diffusivity of O2 and CO2 in respiring tissues: Results in rat skeletal muscle. J. Physiol. 251 (1), 44P–45P.
Poole, D. C., Behnke, B. J., and Padilla, D. J. (2005). Dynamics of muscle microcirculatory oxygen exchange. Med. Sci. Sports Exerc 37 (9), 1559–1566. doi:10.1249/01.mss.0000177471.65789.ce
Poole, D. C., and Jones, A. M. (2012). Oxygen uptake kinetics. Compr. Physiol. 2 (2), 933–996. doi:10.1002/cphy.c100072
Poole, D. C., Pittman, R. N., Musch, T. I., and Østergaard, L. (2020). August krogh's theory of muscle microvascular control and oxygen delivery: A paradigm shift based on new data. J. Physiol. 598 (20), 4473–4507. doi:10.1113/JP279223
Powell, F. L., and Hempleman, S. C. (1993). Diffusion limitation in comparative models of gas exchange. Respir. Physiol. 91 (1), 17–29. doi:10.1016/0034-5687(93)90086-p
Rowell, L. B. (2004). Ideas about control of skeletal and cardiac muscle blood flow (1876-2003): Cycles of revision and new vision. J. Appl. Physiol. 97 (1), 384–392. doi:10.1152/japplphysiol.01220.2003
Roy, C. S., and Brown, J. G. (1880). The blood-pressure and its variations in the arterioles, capillaries and smaller veins. J. Physiol. 2 (5-6), 323–446 1. doi:10.1113/jphysiol.1880.sp000068
Roy, C. S., and Sherrington, C. S. (1890). On the regulation of the blood-supply of the brain. J. Physiol. 11 (1-2), 85–158. doi:10.1113/jphysiol.1890.sp000321
Saltin, B., Rådegran, G., Koskolou, M. D., and Roach, R. C. (1998). Skeletal muscle blood flow in humans and its regulation during exercise. Acta Physiol. Scand. 162 (3), 421–436. doi:10.1046/j.1365-201X.1998.0293e.x
Sarelius, I., and Pohl, U. (2010). Control of muscle blood flow during exercise: Local factors and integrative mechanisms. Acta Physiol. (Oxf) 199 (4), 349–365. doi:10.1111/j.1748-1716.2010.02129.x
Schmid-Schonbein, G. W., Firestone, G., and Zweifach, B. W. (1986). Network anatomy of arteries feeding the spinotrapezius muscle in normotensive and hypertensive rats. Blood Vessels 23 (1), 34–49. doi:10.1159/000158623
Smith, L. M., Golub, A. S., and Pittman, R. N. (2002). Interstitial PO(2) determination by phosphorescence quenching microscopy. Microcirculation 9 (5), 389–395. doi:10.1038/sj.mn.7800147
Spires, J., Gladden, L. B., Grassi, B., Goodwin, M. L., Saidel, G. M., and Lai, N. (2013). Distinguishing the effects of convective and diffusive O₂ delivery on VO₂ on-kinetics in skeletal muscle contracting at moderate intensity. Am. J. Physiol. Regul. Integr. Comp. Physiol. 305 (5), R512–R521. doi:10.1152/ajpregu.00136.2013
Spires, J., Gladden, L. B., Grassi, B., Saidel, G. M., and Lai, N. (2012). Model analysis of the relationship between intracellular PO2 and energy demand in skeletal muscle. Am. J. Physiol. Regul. Integr. Comp. Physiol. 303 (11), R1110–R1126. doi:10.1152/ajpregu.00106.2012
Spurway, N. C., Ekblom, B., Noakes, T. D., and Wagner, P. D. (2012). What limits [V]O(2max)? A symposium held at the bases conference, 6 september 2010. J. Sports Sci. 30 (6), 517–531. doi:10.1080/02640414.2011.642809
Styf, J., Ballard, R., Aratow, M., Crenshaw, A., Watenpaugh, D., and Hargens, A. R. (1995). Intramuscular pressure and torque during isometric, concentric and eccentric muscular activity. Scand. J. Med. Sci. Sports 5 (5), 291–296. doi:10.1111/j.1600-0838.1995.tb00047.x
Styf, J., Korner, L., and Suurkula, M. (1987). Intramuscular pressure and muscle blood flow during exercise in chronic compartment syndrome. J. Bone Jt. Surg. Br. 69 (2), 301–305. doi:10.1302/0301-620X.69B2.3818765
Tschakovsky, M. E., and Joyner, M. J. (2008). Nitric oxide and muscle blood flow in exercise. Appl. Physiol. Nutr. Metab. 33 (1), 151–161. doi:10.1139/H07-148
Turek, Z., Kreuzer, F., and Ringnalda, B. E. (1978). Blood gases at several levels of oxygenation in rats with a left-shifted blood oxygen dissociation curve. Pflugers Arch. 376 (1), 7–13. doi:10.1007/BF00585241
Vanderkooi, J. M., Erecinska, M., and Silver, I. A. (1991). Oxygen in mammalian tissue: Methods of measurement and affinities of various reactions. Am. J. Physiol. 260 (1), C1131–C1150. doi:10.1152/ajpcell.1991.260.6.C1131
Vanderkooi, J. M., Maniara, G., Green, T. J., and Wilson, D. F. (1987). An optical method for measurement of dioxygen concentration based upon quenching of phosphorescence. J. Biol. Chem. 262 (12), 5476–5482. doi:10.1016/s0021-9258(18)45596-2
Wagner, P. D. (1996). Determinants of maximal oxygen transport and utilization. Annu. Rev. Physiol. 58, 21–50. doi:10.1146/annurev.ph.58.030196.000321
Wagner, P. D. (2000). Diffusive resistance to O2 transport in muscle. Acta Physiol. Scand. 168 (4), 609–614. doi:10.1046/j.1365-201x.2000.00712.x
Wagner, P. D. (2011b). Modeling O- transport as an integrated system limiting V(O-MAX). Comput. Methods Programs Biomed. 101 (2), 109–114. doi:10.1016/j.cmpb.2010.03.013
Wagner, P. D. (2011a). Muscle intracellular oxygenation during exercise: Optimization for oxygen transport, metabolism, and adaptive change. Eur. J. Appl. Physiol. 112, 1–8. doi:10.1007/s00421-011-1955-7
Weibel, E. R. (1984). The pathway for oxygen: Structure and function in the mammalian respiratory system. Cambridge, MA: Harvard UP.
Wilson, D. F., Harrison, D. K., and Vinogradov, A. (2014). Mitochondrial cytochrome c oxidase and control of energy metabolism: Measurements in suspensions of isolated mitochondria. J. Appl. Physiol. 117(12), 1424–1430. doi:10.1152/japplphysiol.00736.2014
Wilson, D. F., Erecińska, M., Drown, C., and Silver, I. A. (1977). Effect of oxygen tension on cellular energetics. Am. J. Physiol. 233 (5), C135–C140. doi:10.1152/ajpcell.1977.233.5.C135
Wilson, D. F., Harrison, D. K., and Vinogradov, S. A. (2012). Oxygen, pH, and mitochondrial oxidative phosphorylation. J. Appl. Physiol. 113 (12), 1838–1845. doi:10.1152/japplphysiol.01160.2012
Wilson, D. F. (2015b). Programming and regulation of metabolic homeostasis. Am. J. Physiol. Endocrinol. Metab. 308 (6), E506–E517. doi:10.1152/ajpendo.00544.2014
Wilson, D. F. (2015a). Regulation of metabolism: The rest-to-work transition in skeletal muscle. Am. J. Physiol. Endocrinol. Metab. 309 (9), E793–E801. doi:10.1152/ajpendo.00355.2015
Keywords: oxygen consumption, oxygen supply, oxygen supply-demand matching, microcirculation, muscle contraction
Citation: Golub AS, Song BK, Nugent WH and Pittman RN (2023) Dynamics of PO2 and VO2 in resting and contracting rat spinotrapezius muscle. Front. Physiol. 14:1172834. doi: 10.3389/fphys.2023.1172834
Received: 23 February 2023; Accepted: 03 July 2023;
Published: 19 July 2023.
Edited by:
Michael E. Tschakovsky, Queen’s University, CanadaReviewed by:
Graham Mathew Fraser, Memorial University of Newfoundland, CanadaChristopher G. Ellis, Western University, Canada
Copyright © 2023 Golub, Song, Nugent and Pittman. This is an open-access article distributed under the terms of the Creative Commons Attribution License (CC BY). The use, distribution or reproduction in other forums is permitted, provided the original author(s) and the copyright owner(s) are credited and that the original publication in this journal is cited, in accordance with accepted academic practice. No use, distribution or reproduction is permitted which does not comply with these terms.
*Correspondence: Roland N. Pittman, cGl0dG1hbkB2Y3UuZWR1