
95% of researchers rate our articles as excellent or good
Learn more about the work of our research integrity team to safeguard the quality of each article we publish.
Find out more
ORIGINAL RESEARCH article
Front. Physiol. , 03 May 2023
Sec. Vascular Physiology
Volume 14 - 2023 | https://doi.org/10.3389/fphys.2023.1167857
This article is part of the Research Topic Measuring Resting Cerebral Perfusion using Magnetic Resonance Imaging (MRI) View all 14 articles
 Ece Su Sayin1,2*
 Olivia Sobczyk2,3
 Julien Poublanc3
 David J. Mikulis3
 Joseph A. Fisher1,2,4
 James Duffin1,2
Introduction: Use of contrast in determining hemodynamic measures requires the deconvolution of an arterial input function (AIF) selected over a voxel in the middle cerebral artery to calculate voxel wise perfusion metrics. Transfer function analysis (TFA) offers an alternative analytic approach that does not require identifying an AIF. We hypothesised that TFA metrics Gain, Lag, and their ratio, Gain/Lag, correspond to conventional AIF resting perfusion metrics relative cerebral blood volume (rCBV), mean transit time (MTT) and relative cerebral blood flow (rCBF), respectively.
Methods: 24 healthy participants (17 M) and 1 patient with steno-occlusive disease were recruited. We used non-invasive transient hypoxia-induced deoxyhemoglobin as an MRI contrast. TFA and conventional AIF analyses were used to calculate averages of whole brain and smaller regions of interest.
Results: Maps of these average metrics had colour scales adjusted to enhance contrast and identify areas of high congruence. Regional gray matter/white matter (GM/WM) ratios for MTT and Lag, rCBF and Gain/Lag, and rCBV and Gain were compared. The GM/WM ratios were greater for TFA metrics compared to those from AIF analysis indicating an improved regional discrimination.
Discussion: Resting perfusion measures generated by The BOLD analysis resulting from a transient hypoxia induced variations in deoxyhemoglobin analyzed by TFA are congruent with those analyzed by conventional AIF analysis.
Cerebral blood flow is distributed via a complex network of vessels with flow resistances that vary depending on anatomy, vascular health, and tissue metabolism. This distribution of blood flow can be mapped using blood oxygenation level dependent (BOLD) magnetic resonance imaging (MRI) to trace a bolus of contrast agent. The BOLD signal is sensitive to distortions in the static magnetic field caused by paramagnetic contrast agents such as gadolinium (Ogawa et al., 1990). The value of resting perfusion metrics obtained from the passage of a contrast agent during BOLD imaging, including mean transit time (MTT), relative cerebral blood volume (rCBV) and relative cerebral blood flow (rCBF), is that they can indicate regions of slowed and insufficient resting blood supply (Donahue et al., 2017). The dynamic susceptibility contrast (DSC) agent of choice used for perfusion imaging clinically is a gadolinium-based contrast agent (GBCA), injected intravenously to generate a bolus that is required to be imaged over a large artery on its first pass through the brain. Tissue BOLD signals can be analysed during passage of the GBCA bolus through the brain using the first pass arterial signal changes (arterial input function or AIF) deconvolved with tissue signal changes to obtain tissue perfusion metrics.
Transient hypoxia-induced deoxyhemoglobin (THx-dOHb) can be used as an endogenous paramagnetic contrast agent for DSC imaging. In 2021 Poublanc et al. reported the use of THx-dOHb as a non-invasive dynamic susceptibility contrast agent (Poublanc et al., 2021; Vu et al., 2021; Sayin et al., 2022a). Comparisons of resting perfusion metrics calculated from THx-dOHb were very similar to those obtained from a clinical standard, GBCA (Sayin et al., 2022a). However, a significant issue with DSC perfusion mapping is that the BOLD signal in proximity to arteries has both linear and non-linear behaviour depending on where the signal is measured. The intravascular signal exhibits a quadratic relationship with the concentrating of the paramagnetic contrast agent (Spees et al., 2001; Zhao et al., 2007) at 3 Tesla (Uludag et al., 2009), whereas the signal in tissue adjacent to the vessel is linear with contrast concentration. The nature of the AIF used for perfusion analysis is therefore dependent on location of the voxels used to measure the AIF. An AIF independent method for acquiring DSC perfusion metrics would therefore be welcomed.
Here we introduce a frequency domain analysis technique, transfer function analysis (TFA). This technique has been used to measure dynamic pressure autoregulation of the cerebral vasculature (Blaber et al., 1997; Zhang et al., 1998; Tzeng et al., 2012), as well as the cerebrovascular response to changes in CO2 (Duffin et al., 2015). It offers a means of characterizing the BOLD response to [dOHb] with not only an estimate of the magnitude of the response (Gain), but also the phase, or time Lag (Blockley et al., 2011) and coherence, the linear time invariance of the BOLD to SO2 relationship. Briefly, the aligned BOLD response and SO2 data are divided into five 50% overlapping segments (Welch algorithm (Welch, 1967)). In each segment the relation between the BOLD response signal and the contrast signal (SO2) is analyzed in the frequency domain by resolving the two signals into their Fourier series of component sine waves (Figures 1A, B). The frequency response function, defined as the average cross-spectrum of the response signal divided by the average autospectrum of the stimulus signal, yields Gain and Phase measures, averaged for all segments. Coherence is calculated from averages of the cross- and auto-spectra as the average cross-spectrum squared divided by the product of the stimulus and response autospectra. Gain, Phase and Coherence measures are taken from the frequency spectrum at a single reference frequency (Figures 1A, B). As Figure 1C illustrates, Gain describes the amplitude ratio relating the BOLD response to the contrast signal and phase or time Lag the time relationship.
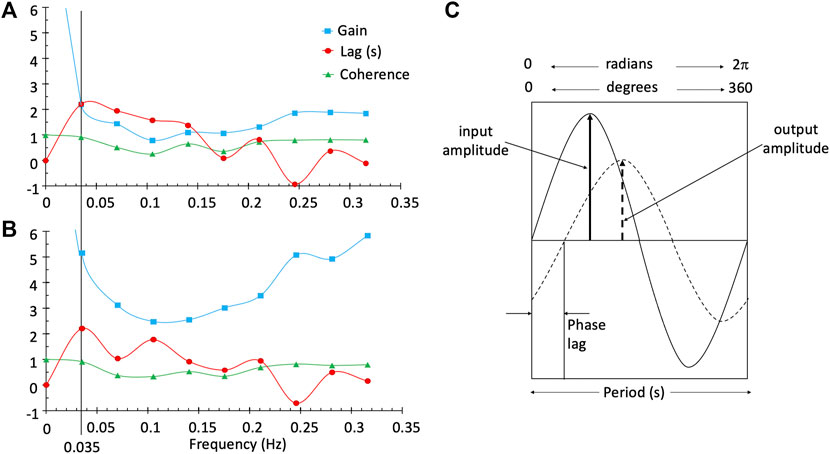
FIGURE 1. TFA provides the Gain, phase or time Lag, and Coherence measures for all frequencies in a single voxel in the white matter (A) and a single voxel in the grey matter (B). The line at a frequency of 0.035 Hz was chosen as the single frequency representative measurement of Gain, Lag and Coherence used to characterise the BOLD response in a voxel. Diagram (C) illustrates a single frequency. Gain is output amplitude/input amplitude and phase is the difference in the timing of the sine waves. As illustrated, the output is positive and lags the input; consequently, phase is negative. The time lag (s) is period*phase lag (r/2π).
Previously, TFA was used to describe the dynamics of the BOLD response to changes in a vasoactive agent such as CO2 (Duffin et al., 2015; Sayin et al., 2022b). In this case the phase difference between stimulus and response arises from two factors: a blood arrival time delay and a vascular response time. Differences in time delay between regions were assumed to be less than the 1.5 s sampling period (TR) so that TFA phase primarily reflects the speed of the vascular response (Duffin et al., 2015). By contrast, the phase difference between [dOHb] changes and the resulting BOLD signal is assumed to arise from both the time of passage of blood through a voxel and the arrival time delay. If the time of arrival delay is minimised, the phase difference expressed in time units is a measure related to mean transit time (MTT). We further hypothesised that if the Gain can be assumed to reflect the strength of the signal in a voxel, which is proportional to the volume of blood in a voxel, then Gain is a measure of relative cerebral volume (rCBV). In this case the ratio of Gain/Lag (CBV/MTT) is a measure of relative cerebral blood flow (rCBF), analogous to the central volume theorem (Ostergaard, 2005).
We describe the utility of transfer function analysis of the BOLD response to a series of two transient hypoxic exposures to produce corresponding changes in [dOHb] at rest. Voxel-wise maps of Gain, Lag and Gain/Lag were assembled by averaging these TFA metrics calculated and compared with maps of rCBV, MTT and rCBF respectively obtained from a deconvolution-based method using an AIF as described by Poublanc et al. (2021). Average supratentorial whole brain and posterior/anterior circulation TFA perfusion metrics were also compared to the corresponding conventional AIF analysis. In addition, we made spatial comparisons of the maps in a healthy participant and a patient with vascular insufficiency as shown in the magnetic resonance angiography (MRA) in Figure 8.
This study conformed to the standards set by the latest revision of the Declaration of Helsinki and was approved by the Research Ethics Board of the University Health Network (UHN) and Health Canada. All participants provided written and informed consent to partake in this study. We recruited 24 healthy participants (7 Female) ranging from 21 to 82 (mean (SD) 38.6 ± 17.9 years, median age 30 years (Table 1) by word of mouth. The healthy participants consisted of non-smokers, not taking any medication and no known history of neurological or cardiovascular disease. In addition, a 66-year-old female participant with known cerebral vascular disease was recruited. The patient has bilateral moyamoya disease with a right MCA occlusion and distal left ICA occlusion with a previous patent left EC-IC bypass.
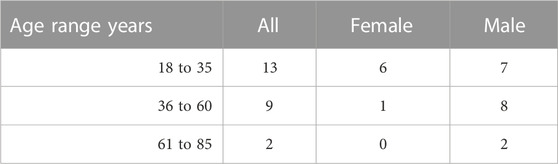
TABLE 1. Healthy participant characteristics.
Changes in [dOHb] were achieved by controlling PetCO2 and PetO2 using sequential delivery of specific inspired gases with a computer-controlled gas blender (RespirAct™; Thornhill Medical Inc, Toronto, Canada) running a prospective targeting algorithm (Slessarev et al., 2007). The principles of operation of the RespirAct™ have been described elsewhere (Fisher et al., 2016). Participants breathed through a facemask sealed to the face with skin tape (Tegaderm, 3M, Saint Paul, MN, United States) to exclude all but system-supplied gas. The dOHb changes resulting from the programmed PetO2 stimulus pattern of 4-min and 20 s duration is shown in Figure 2. The pattern consisted of a 60 s normoxic baseline at PetO2 of 95 mmHg, a hypoxic step of PetO2 to 40 mmHg for 60 s, a return to normoxia for 20 s, a second hypoxic step for 60 s, followed by a return to normoxia for 60 s. After the completion of the PetO2 sequence, the participant returns to free breathing of room air. With this targeting approach, the end tidal values have been shown to be equal, within measurement error, to their respective arterial partial pressures (Ito et al., 2008; Fierstra et al., 2011).
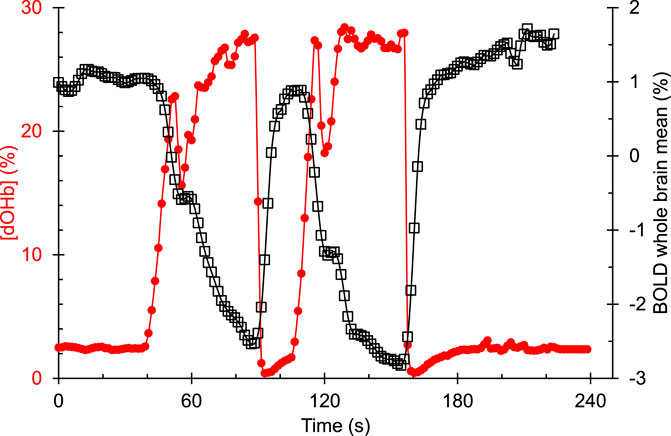
FIGURE 2. An example of the hypoxia-induced changes in [dOHb] (%) and the resulting whole brain average BOLD (%) signal response in a representative healthy control participant. [dOHb] was calculated from end tidal PO2 using the Hill equation describing the normal oxyhemoglobin in-vivo O2 dissociation curve (Balaban et al., 2013).
A 3-Tesla scanner (HDx Signa platform, GE healthcare, Milwaukee, WI, USA) with an 8-channel head coil was used in these experiments. The protocol consisted of a high-resolution T1-weighted scan followed by one BOLD sequence scan. The high-resolution T1-weighted scan was acquired using a 3D spoiled gradient echo sequence with the following parameters: TI = 450 ms, TR 7.88 ms, TE = 3 ms, flip angle = 12°, voxel size = 0.859 × 0.859 × 1 mm, matrix size = 256 × 256, 146 slices, field of view = 24 × 24 cm, no interslice gap. The BOLD scan was acquired during normocapnic PetO2 manipulation using a T2*-weighted gradient echoplanar imaging sequence with the following parameters: TR = 1,500 ms, TE = 30 ms, flip angle = 73°, 29 slices voxel size = 3 mm isotropic voxels and matrix size = 64 × 64.
The acquired BOLD images were volume registered, slice-time corrected and co-registered to the anatomical images using AFNI software (National Institutes of Health, Bethesda, Maryland) (Cox, 1996). Arterial oxygen saturation (SaO2) and [dOHb] were calculated from PetO2 and the oxyhemoglobin dissociation curve (Balaban et al., 2013) assuming a fixed [Hb] of 130 g/L and a pH of 7.4. Two methods of analysis were employed. First, a conventional analysis using an AIF chosen over the middle cerebral artery and a deconvolution-based model was used to calculate voxel-wise maps of rCBV and MTT. The rCBF was calculated as CBV/MTT and scaled by 25. This is described in greater detail elsewhere (Poublanc et al., 2021).
Second, a voxel-wise TFA of the BOLD data was analyzed using a custom program (LabVIEW, National Instruments, Texas). First, a zero-phase filter was applied to the BOLD vs. time data for all voxels to smooth the time course and reduce signal variations due to noise. The zero-phase filter applies an infinite impulse response recursive filter to the input signal such that the filtered signal has no phase distortion. Careful temporal alignment of the SO2 and BOLD data is required for the measurement of both Lag and Gain/Lag ratio. Lag is affected by both the contrast transit time and its time of arrival. Lag was minimised by using the whole brain population histogram as a guide, adjusting the alignment of SO2 and the whole brain mean BOLD to zero the minimum Lag. TFA calculated Gain, phase Lag, and Coherence as well as the Gain/Lag ratio for each voxel at the chosen frequency of 0.035 Hz. With this frequency the period is 28.57 s and phase Lag can be converted to time Lag (s) as period*phase lag (r/2π). SaO2 was taken as the measure of the contrast agent and used as the AIF.
Maps of the perfusion metrics obtained from each analysis were transformed into Montreal Neurological Institute (MNI) space and overlayed onto their respective anatomical images. Analytical processing software, SPM8 (Wellcome Department of Imaging Neuroscience, Institute of Neurology, University College, London, UK), was used to segment the anatomical images (T1 weighted) into grey matter (GM) and white matter (WM). The vascular regions of interest (middle cerebral artery (MCA), posterior cerebral artery (PCA) and anterior cerebral artery (ACA)) were previously delineated manually on an anatomical MNI template. For this analysis, the supratentorial cortical grey matter MCA and ACA were combined as the anterior circulation mask and the supratentorial cortical grey matter PCA was used as the posterior circulation mask, as shown in Figure 3.
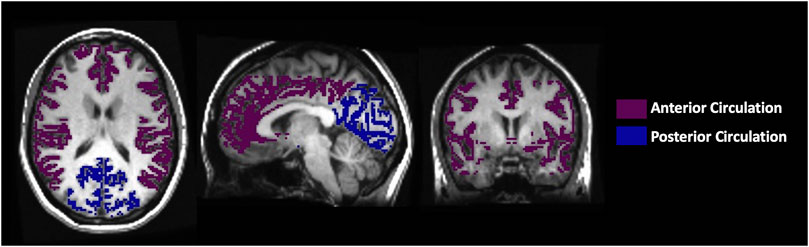
FIGURE 3. The axial, sagittal and coronal view of the manually delineated grey matter in the anterior and posterior circulation.
Average resting perfusion metrics using both TFA and conventional AIF analysis were calculated for specific regions for each participant in GM and WM and their ratios (GM/WM) using previously created vascular territory masks. To avoid susceptibility artifacts where the MRI signal is noisy, the slices ranging from mid to the top of the brain (slices 40–60) were selected to calculate perfusion metrics. Comparisons between the conventional AIF analysis and TFA for perfusion metrics were not possible for relative values (expressed in arbitrary units) and were therefore limited to only TFA lag vs. MTT (expressed in seconds). To assess the spatial discrimination of the two analyses, the regional GM/WM ratios were compared. The results from the grouped 24 healthy participants were compiled together to determine normative ranges for TFA (Gain, Lag, Coherence and Gain/Lag ratio), and for conventional AIF analysis (rCBV, MTT and rCBF). This was performed for each metric and analysis by calculating a voxel-by- voxel mean and standard deviation from the co-registered maps in standard space (Sobczyk et al., 2015; Sobczyk et al., 2021).
Comparisons were made using a two-way analysis of variance (ANOVA) with factors tissue region and type of analysis using a commercial statistical package (SigmaPlot, Systat Software, San Jose, California, USA). Both a Normality Test (Shapiro-Wilk) and Equal Variance Tests were part of the ANOVA, and correction for multiple comparisons were applied by an all pairwise multiple comparison procedure (Bonferroni method). The GM/WM ratios for MTT, rCBF and rCBV were compared between the types of analysis using one-way ANOVA. Significant difference in these tests was taken as p < 0.05.
None of the subjects expressed distress during hypoxia and none terminated the procedure. Figure 4 presents the distribution of the data using boxplots. Figure 5 displays axial slices of the TFA and the conventional AIF analysis perfusion metrics for the grouped healthy participants. Note that colour scales minimum and maximum values were scaled to obtain the maximum colour contrast.
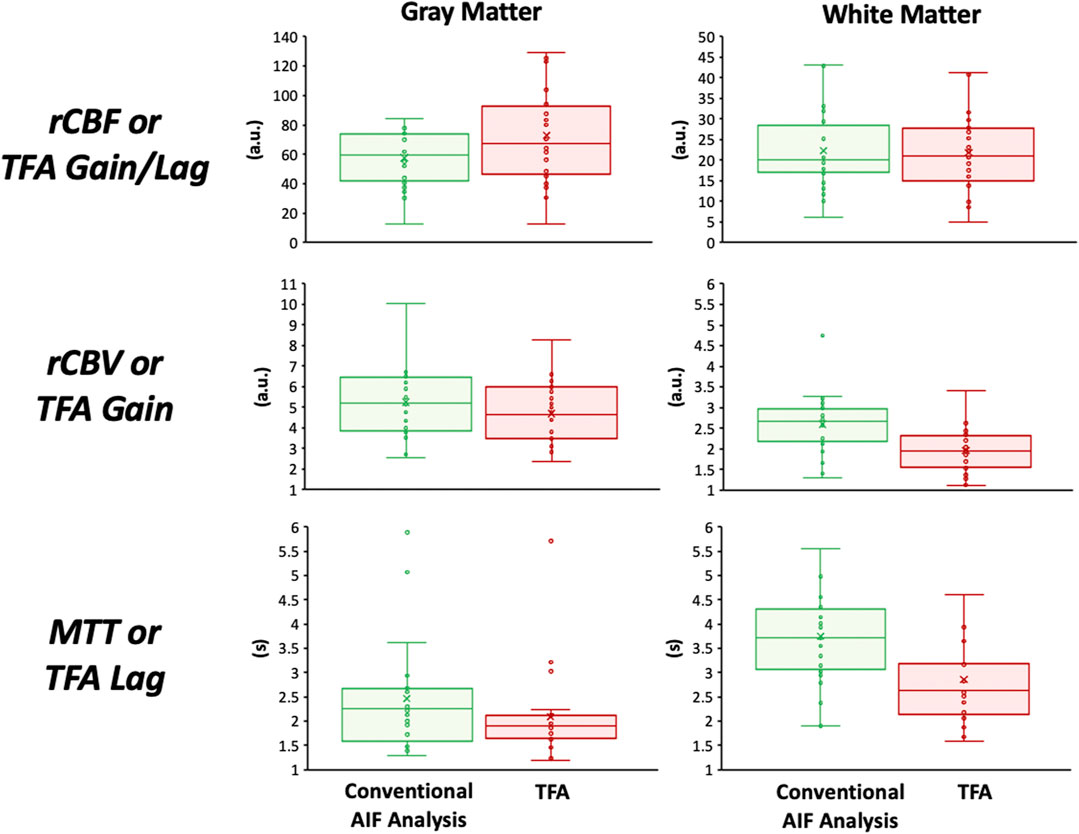
FIGURE 4. Boxplots showing the distribution of the perfusion metrics in the gray and white matter for the conventional AIF analysis (in green) and TFA (in red). The statistical summary comparing the two analysis techniques is found in Tables 2, 3.
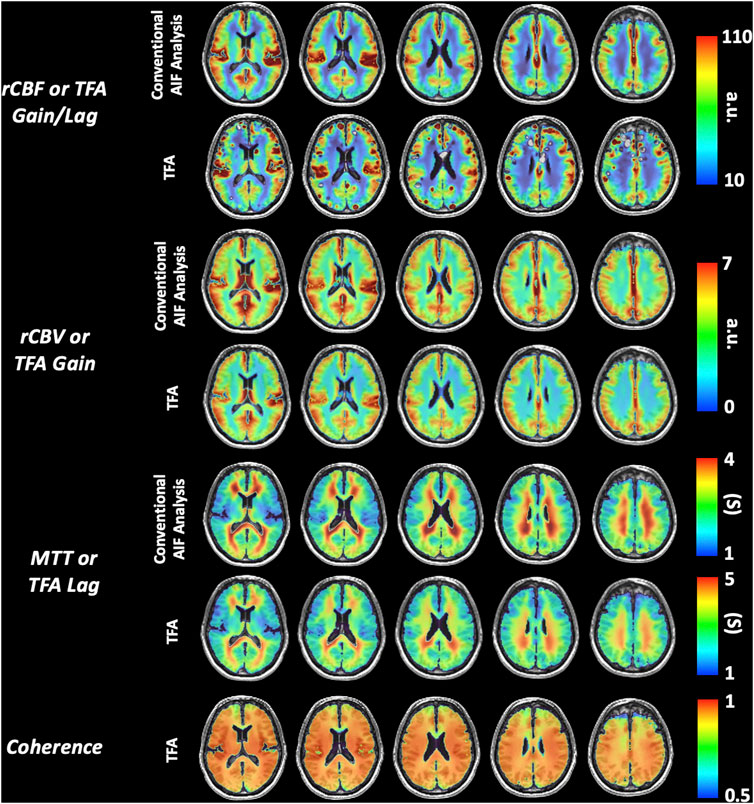
FIGURE 5. Representative axial slices of the grouped healthy participant group TFA metrics (Gain/Lag, Gain, Lag, and Coherence) and AIF metrics (rCBF, rCBV and MTT).
Table 2 summarises the comparison of TFA, and conventional AIF analysis metrics expressed as mean (SD) values for all the healthy participants. The Gain/rCBV and Gain/Lag/rCBF is relative and expressed in arbitrary units. Hence to be able to compare spatial discrimination between analysis methods, the GM/WM ratios were calculated. Table 3 summarises the comparison of GM/WM ratios between TFA, and conventional AIF analysis metrics expressed as mean (SD) values. The p values in Table 1 are from the two-way ANOVA with factors type of analysis and region. An All Pairwise Multiple Comparison Procedure (Bonferroni t-test) was used. The p values in Table 3 are from one-way ANOVA.
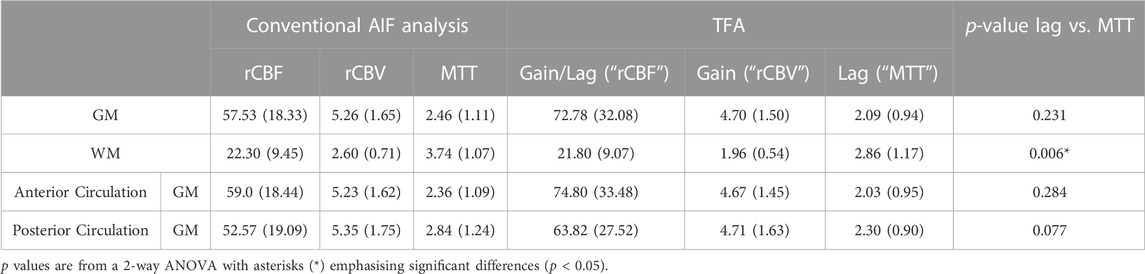
TABLE 2. A summary of the mean (SD) TFA lag vs. AIF MTT metrics for grouped healthy participants.
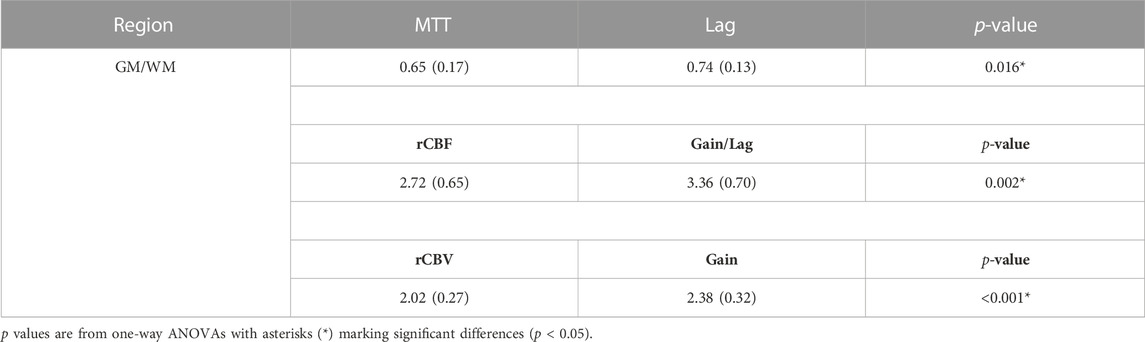
TABLE 3. Whole brain supratentorial cortical GM/WM ratios for all metrics from both analyses.
Figures 6, 8 display example perfusion metrics maps of a healthy individual and a selected patient. Figures 7, 9 display the histogram distribution of the perfusion metrics of a healthy individual and a selected patient.
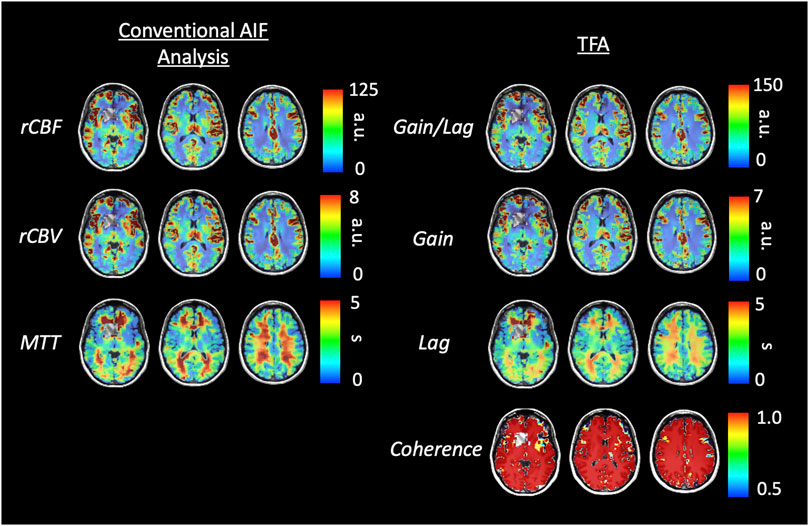
FIGURE 6. Axial slices of perfusion metrics for the conventional AIF and TFA analyses for a representative healthy control. Scales for rCBF, Gain/Lag, rCBV, and Gain are arbitrary units, and seconds for MTT and Lag.
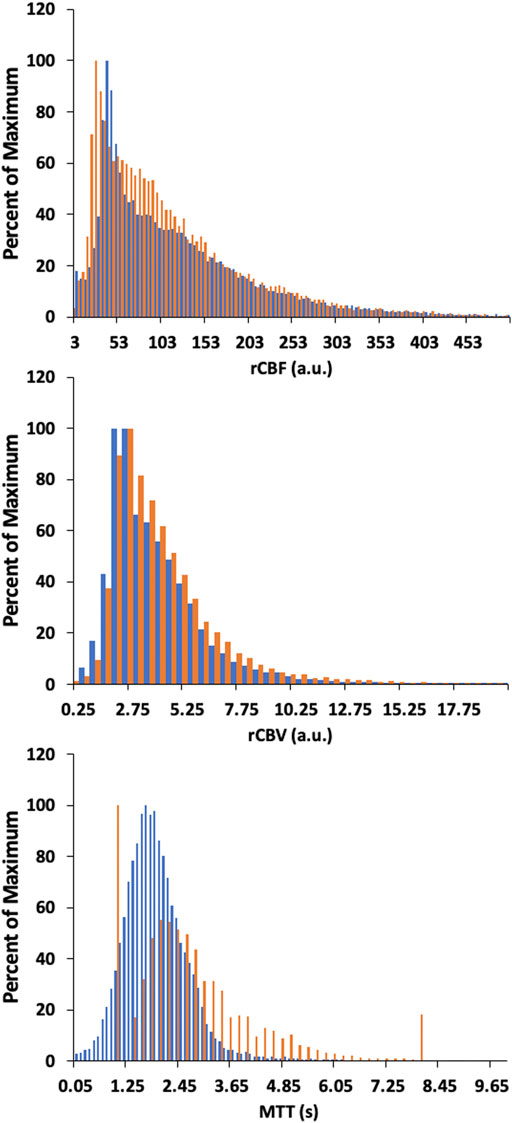
FIGURE 7. Histogram of whole brain averages for the conventional analysis (in orange) and TFA metrics (in blue) for a representative healthy control. Scales for rCBF, Gain/Lag, rCBV, and Gain are arbitrary units, and seconds for MTT and Lag.
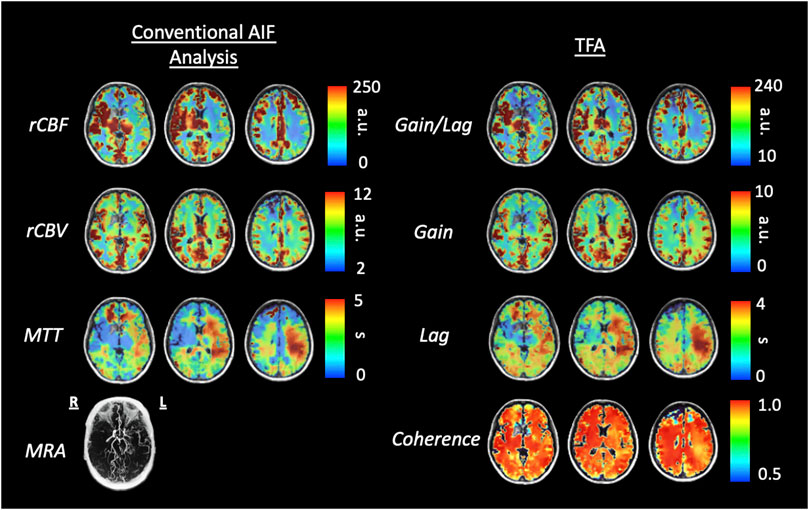
FIGURE 8. Axial slices of perfusion metrics for the conventional AIF analysis and TFA for a patient example with bilateral moyamoya disease with a right MCA occlusion and distal left ICA occlusion with a previous patent left EC-IC bypass. Note the decreased rCBF and Gain/Lag, the increased rCBV and Gain, and the prolonged MTT and Lag in all analyses reflect the vascular pathology of the patient. Scales for rCBF, Gain/Lag, rCBV and Gain are arbitrary units, seconds for MTT and Lag.
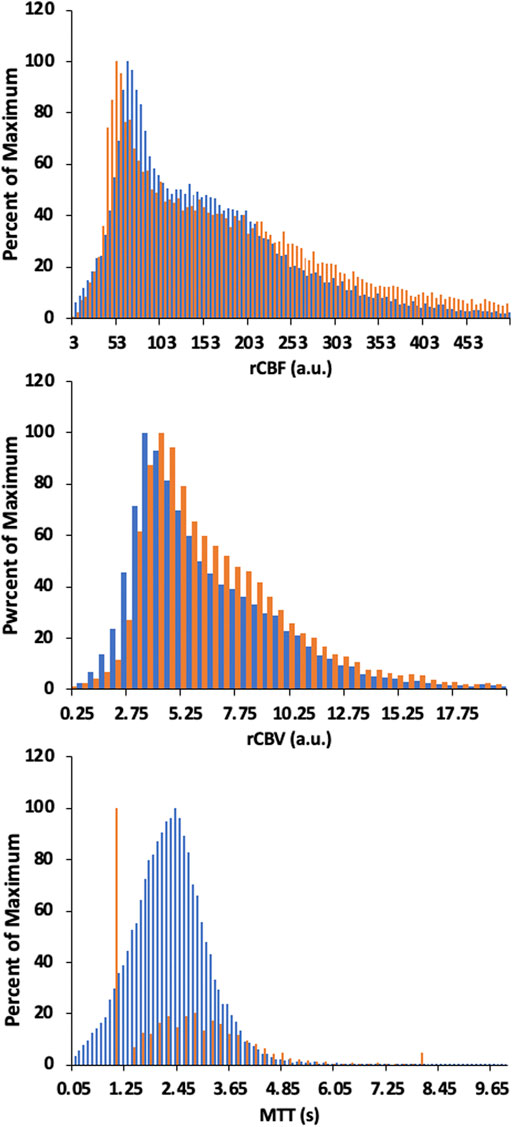
FIGURE 9. Histogram of whole brain averages for the conventional analysis (in orange) and TFA metrics (in blue) for a patient example with bilateral moyamoya disease with a right MCA occlusion and distal left ICA occlusion with a previous patent left EC-IC bypass. Scales for rCBF, Gain/Lag, rCBV, and Gain are arbitrary units, and seconds for MTT and Lag. Colour scales are adjusted to assist comparisons.
We hypothesised that TFA metrics of Gain, Lag, and their ratio, Gain/Lag, correspond to conventional AIF resting perfusion metrics such as rCBV, MTT and rCBF, respectively. The main finding of this study is that TFA of the BOLD signal response to hypoxia induced dOHb provides perfusion metrics that are equivalent to those obtained with a conventional deconvolution-based analysis using an AIF. The grouped healthy participant maps of perfusion metrics for both types of analyses displayed high degree of similarity in relative magnitude and distribution of the perfusion metrics. The ranges of Lag and MTT values were similar with statistically significant but small differences only found in the whole brain WM. Ratios of GM/WM for each resting perfusion metric, calculated to assess their regional contrast, found Lag, Gain/Lag and Gain were significantly higher than MTT, rCBF and rCBV respectively, suggesting that TFA metrics provided a higher regional contrast.
We compared maps from a healthy individual to that of a patient with cerebrovascular pathology in order to determine whether TFA can identify cerebrovascular pathology seen with conventional AIF analysis. The comparison of perfusion values generated from conventional AIF analysis and TFA in the healthy individual show high congruence. Perhaps more importantly, there is also high spatial similarity between the two perfusion methods in magnitude and spatial distribution in the patient with right MCA occlusion and distal left ICA occlusion. This finding also suggests that TFA, like the AIF conventional analysis, can identify areas of reduced cerebrovascular health at rest.
Altogether these observations indicate that analysis of the BOLD response to THx-dOHb by TFA can provide an alternative to the conventional AIF analysis.
Perfusion metrics rCBV and rCBF from the conventional AIF analysis and their TFA counterparts Gain, and Gain/Lag ratio are in arbitrary units so that direct numerical comparisons are not possible between analyses, or with published values of these metrics. Nevertheless, the grouped healthy participant maps for these metrics are spatially very similar to each other, and to other published maps of rCBV and rCBF, with regional differences that are in general agreement with the control group average maps presented by others (Grandin et al., 2005; Ibaraki et al., 2007; Newbould et al., 2007; Watabe et al., 2014; Asaduddin et al., 2019). Furthermore, the values in GM and WM fall within the range of those from computerized tomography studies (Chen et al., 2019).
Both MTT and Lag in grouped healthy participant maps depicted regional variations of about 0–5 s with whole brain means (SD) of 3.74 (1.07) and 2.86 (1.17) s in WM and 2.46 (1.11) and 2.09 (0.94) s in GM for MTT and Lag, respectively. These values are comparable to those found for DSC MRI of 3.0 (0.6) s in GM and 4.3 (0.7) s in WM by (Helenius et al., 2003), as well as those found using positron emission tomography and DSC MRI (Ibaraki et al., 2007; Wirestam et al., 2010). A range of 0–10 s were found using carpet plots to analyze transit times from low frequency oscillations in resting state fMRI (Fitzgerald et al., 2021) and from hypoxia-induced dOHb (Bhogal et al., 2022). The MTT and Lag metrics are also within the range of MTT metrics calculated previously using hypoxia-induced changes in [dOHb] as a susceptibility contrast agent; between 0 and 12 s (Vu et al., 2021) and between 0 and 8 s (Poublanc et al., 2021; Sayin et al., 2022a).
The maps of resting perfusion metrics and their corresponding histograms presented in Figures 6–9 provide two comparisons, one between a healthy control and a patient with cerebrovascular pathology, and the other between the two analysis methods TFA and conventional AIF analysis. Comparing the maps between the two methods demonstrate the apparent spatial similarity, with regional variations that match each other despite the different analytic approaches. The main differences between analyses with respect to the regional distributions of the metrics are discernible in the histograms, whose widths display the full variability of the metrics. As noted in Table 3 comparing the GM/WM ratios, the TFA discrimination between GM and WM is higher than the conventional AIF analysis.
We also note the very apparent differences between the perfusion maps of the healthy participant and that of the patient. These differences are also reflected in the histograms of the distribution of each metric. The maps of the patient example for both analyses indicate signs of the known left sided pathology with areas of increased MTT/Lag, increased rCBV/Gain and decreased rCBF/Gain/Lag ratio. We suggest that both analyses provide the clinically useful information.
The voxel-wise application of TFA uses the changes in SO2 calculated from PetO2 measured at the lungs as the input signal and the measured BOLD changes in a voxel as the output signal. The voxel-wise TFA therefore assumes that the SO2 signal arrives at the voxel where BOLD is measured with the same changes as in pulmonary venous blood. Any dispersion is limited to passage through the left atrium and left ventricle, with the latter dispersion depending on the left ventricular ejection fraction.
One consideration in this study is the exposure of subjects to hypoxia. While SO2 and [dOHb] can be quickly returned to normal by increasing inspired oxygen to 100%, the speed of reduction of SO2 and [dOHb] by changing inspired PO2 is limited by minute ventilation, functional residual capacity, and oxygen consumption. The rate of washout of O2 from the functional residual capacity is limited by the lowest inspired oxygen concentration, which in the RespirAct™ is 4%, the functional residual capacity of the lungs, and minute ventilation. The two hypoxic exposures in the sequence were therefore extended to 60 s as the time to attaining PO2 of 40 mmHg is about 15–20 s, leaving at least 30 s of hypoxia baseline. Re-establishment of normoxia is usually evoked within one breath. This provides a step change in dOHb and can also act as a safety feature. An important caution is not to induce hypoxia in patients who are already hypoxic due to congenital heart disease, sickle cell disease, severe chronic obstructive and restrictive pulmonary disease, presence of lung atelectasis, pneumonia, asthma, and pulmonary shunting associated with COVID-19.
As Table 1 notes, the healthy participant group was small and varied in age and sex, so that the results cannot be differentiated by age or sex. Indeed, our purpose in recruiting was to sample a wide variety of individuals to gain a general sense of the range of perfusion metrics and their regional variation.
It is assumed that the brief hypoxic exposures do not cause any change in cerebral blood flow. This assumption is based partly on the observation that the vasculature does not begin to respond to hypoxia at resting PetCO2 until PetO2 is below 50 mmHg (Mardimae et al., 2012), and partly on the consideration that the vascular response time constant is too long (80 s) for the brief hypoxia to affect the flow (Poulin et al., 1996). We note that the conversion of PetO2 to SO2 assumed a fixed [Hb] of 130 g/L and a pH = 7.4 and suggest that if actual measures are available, adjustments to the calculation of perfusion metrics be applied for each individual.
In this study THx-dOHb was used to produce a rapid variation in [dOHb], which induced sufficient BOLD signal changes to enable the calculation of resting perfusion metrics using TFA. We hypothesised that perfusion metrics derived from TFA analysis would be congruent with those derived from standard DSC processing using deconvolution of the AIF with the tissue response function such that TFA Gain would be analogous to rCBV, TFA Lag to MTT and the ratio Gain/Lag to rCBF. The truth of this hypothesis was first verified by showing high congruence between perfusion maps generated by both analytical methods in a healthy group of participants. A second confirmation was obtained by showing that TFA was able to discriminate between healthy and diseased tissue in a patient with a right MCA occlusion and distal left ICA occlusion with a previous patent left EC-IC bypass in a manner that was also highly consistent with the conventional analysis. We conclude that TFA of the BOLD changes resulting from THx-dOHb can be used to provide an alternative analysis method of determining resting perfusion metrics in individuals, which eliminates the requirement of an AIF selection and complex deconvolution calculations based on an assumed kinetic model. Furthermore, TFA has the potential to be applied to perfusion analysis for DSC imaging using GBCAs.
The original contributions presented in the study are included in the article/Supplementary Material, further inquiries can be directed to the corresponding author.
The studies involving human participants were reviewed and approved by Research Ethics Board at University Health Network. The patients/participants provided their written informed consent to participate in this study.
JD conceived the study and implemented the analyses. DM selected and reviewed all subjects for suitability. ES, OS, and JP executed the experiments to acquire the data. JD and ES analysed the data. JD, ES, and JF wrote the initial draft of the manuscript. All authors participated in the preparation and revision of the final version of the manuscript.
The authors thank the MR technologist at Toronto Western Hospital.
JF and DM contributed to the development of the automated end-tidal targeting device, RespirAct™ (Thornhill Research Inc., TRI) used in this study and have equity in the company. OS and JD receive salary support from TRI. TRI provided no other support for the study.
The remaining authors declare that the research was conducted in the absence of any commercial or financial relationships that could be construed as a potential conflict of interest.
All claims expressed in this article are solely those of the authors and do not necessarily represent those of their affiliated organizations, or those of the publisher, the editors and the reviewers. Any product that may be evaluated in this article, or claim that may be made by its manufacturer, is not guaranteed or endorsed by the publisher.
Asaduddin, M., Do, W.-J., Kim, E. Y., and Park, S.-H. (2019). Mapping cerebral perfusion from time-resolved contrast-enhanced MR angiographic data. Magn. Reson. Imaging 61, 143–148. doi:10.1016/j.mri.2019.05.040
Balaban, D. Y., Duffin, J., Preiss, D., Mardimae, A., Vesely, A., Slessarev, M., et al. (2013). The in-vivo oxyhaemoglobin dissociation curve at sea level and high altitude. Respir. Physiol. Neurobiol. 186, 45–52. doi:10.1016/j.resp.2012.12.011
Bhogal, A. A., Sayin, E. S., Poublanc, J., Duffin, J., Fisher, J. A., Sobcyzk, O., et al. (2022). Quantifying cerebral blood arrival times using hypoxia-mediated arterial BOLD contrast. NeuroImage 261, 119523. doi:10.1016/j.neuroimage.2022.119523
Blaber, A. P., Bondar, R. L., Stein, F., Dunphy, P. T., Moradshahi, P., Kassam, M. S., et al. (1997). Transfer function analysis of cerebral autoregulation dynamics in autonomic failure patients. Stroke 28, 1686–1692. doi:10.1161/01.str.28.9.1686
Blockley, N. P., Driver, I. D., Francis, S. T., Fisher, J. A., and Gowland, P. A. (2011). An improved method for acquiring cerebrovascular reactivity maps. Magn. Reson Med. 65, 1278–1286. doi:10.1002/mrm.22719
Chen, C., Bivard, A., Lin, L., Levi, C. R., Spratt, N. J., and Parsons, M. W. (2019). Thresholds for infarction vary between gray matter and white matter in acute ischemic stroke: A ct perfusion study. J. Cereb. Blood Flow. Metab. 39, 536–546. doi:10.1177/0271678X17744453
Cox, R. W. (1996). Afni: Software for analysis and visualization of functional magnetic resonance neuroimages. Comput. Biomed. Res. 29, 162–173. doi:10.1006/cbmr.1996.0014
Donahue, M. J., Achten, E., Cogswell, P. M., De Leeuw, F. E., Derdeyn, C. P., Dijkhuizen, R. M., et al. (2017). Consensus statement on current and emerging methods for the diagnosis and evaluation of cerebrovascular disease. J. Cereb. Blood Flow. Metab. 38, 1391–1417. doi:10.1177/0271678X17721830
Duffin, J., Sobczyk, O., Crawley, A. P., Poublanc, J., Mikulis, D. J., and Fisher, J. A. (2015). The dynamics of cerebrovascular reactivity shown with transfer function analysis. NeuroImage 114, 207–216. doi:10.1016/j.neuroimage.2015.04.029
Fierstra, J., Machina, M., Battisti-Charbonney, A., Duffin, J., Fisher, J. A., and Minkovich, L. (2011). End-inspiratory rebreathing reduces the end-tidal to arterial PCO(2) gradient in mechanically ventilated pigs. Intensive Care Med. 37, 1543–1550. doi:10.1007/s00134-011-2260-y
Fisher, J. A., Iscoe, S., and Duffin, J. (2016). Sequential gas delivery provides precise control of alveolar gas exchange. Respir. Physiol. Neurobiol. 225, 60–69. doi:10.1016/j.resp.2016.01.004
Fitzgerald, B., Yao, J. F., Talavage, T. M., Hocke, L. M., Frederick, B. D., and Tong, Y. (2021). Using carpet plots to analyze transit times of low frequency oscillations in resting state fMRI. Sci. Rep. 11, 7011. doi:10.1038/s41598-021-86402-z
Grandin, C. B., Bol, A., Smith, A. M., Michel, C., and Cosnard, G. (2005). Absolute CBF and CBV measurements by MRI bolus tracking before and after acetazolamide challenge: Repeatabilily and comparison with PET in humans. Neuroimage 26, 525–535. doi:10.1016/j.neuroimage.2005.02.028
Helenius, J., Perkio, J., Soinne, L., Ostergaard, L., Carano, R. A., Salonen, O., et al. (2003). Cerebral hemodynamics in a healthy population measured by dynamic susceptibility contrast MR imaging. Acta Radiol. 44, 538–546. doi:10.1034/j.1600-0455.2003.00104.x
Ibaraki, M., Ito, H., Shimosegawa, E., Toyoshima, H., Ishigame, K., Takahashi, K., et al. (2007). Cerebral vascular mean transit time in healthy humans: A comparative study with PET and dynamic susceptibility contrast-enhanced MRI. J. Cereb. Blood Flow. Metab. 27, 404–413. doi:10.1038/sj.jcbfm.9600337
Ito, S., Mardimae, A., Han, J., Duffin, J., Wells, G., Fedorko, L., et al. (2008). Non-invasive prospective targeting of arterial PCO2 in subjects at rest. J. Physiol. 586, 3675–3682. doi:10.1113/jphysiol.2008.154716
Mardimae, A., Balaban, D. Y., Machina, M. A., Han, J. S., Katznelson, R., Minkovich, L. L., et al. (2012). The interaction of carbon dioxide and hypoxia in the control of cerebral blood flow. Pflugers Arch. - Eur. J. Physiol. 464, 345–351. doi:10.1007/s00424-012-1148-1
Newbould, R. D., Skare, S. T., Jochimsen, T. H., Alley, M. T., Moseley, M. E., Albers, G. W., et al. (2007). Perfusion mapping with multiecho multishot parallel imaging EPI. Magnetic Reson. Med. 58, 70–81. doi:10.1002/mrm.21255
Ogawa, S., Lee, T. M., Kay, A. R., and Tank, D. W. (1990). Brain magnetic resonance imaging with contrast dependent on blood oxygenation. Proc. Natl. Acad. Sci. U. S. A. 87, 9868–9872. doi:10.1073/pnas.87.24.9868
Ostergaard, L. (2005). Principles of cerebral perfusion imaging by bolus tracking. J. Magn. Reson Imaging 22, 710–717. doi:10.1002/jmri.20460
Poublanc, J., Sobczyk, O., Shafi, R., Sayin, E. S., Schulman, J., Duffin, J., et al. (2021). Perfusion MRI using endogenous deoxyhemoglobin as a contrast agent: Preliminary data. Magnetic Reson. Med. 86 (6), 3012–3021. doi:10.1002/mrm.28974
Poulin, M. J., Liang, P. J., and Robbins, P. A. (1996). Dynamics of the cerebral blood flow response to step changes in end-tidal PCO2 and PO2 in humans. J. Appl. Physiology 81, 1084–1095. doi:10.1152/jappl.1996.81.3.1084
Sayin, E. S., Schulman, J., Poublanc, J., Levine, H. T., Raghavan, L. V., Uludag, K., et al. (2022a). Investigations of hypoxia-induced deoxyhemoglobin as a contrast agent for cerebral perfusion imaging. Hum. Brain Mapp. 44, 1019–1029. doi:10.1002/hbm.26131
Sayin, E. S., Sobczyk, O., Poublanc, J., Mikulis, D. J., Fisher, J. A., Kuo, K. H. M., et al. (2022b). Assessment of cerebrovascular function in patients with sickle cell disease using transfer function analysis. Physiol. Rep. 10, e15472. doi:10.14814/phy2.15472
Slessarev, M., Han, J., Mardimae, A., Prisman, E., Preiss, D., Volgyesi, G., et al. (2007). Prospective targeting and control of end-tidal CO2 and O2 concentrations. J. Physiol. 581, 1207–1219. doi:10.1113/jphysiol.2007.129395
Sobczyk, O., Battisti-Charbonney, A., Poublanc, J., Crawley, A. P., Sam, K., Fierstra, J., et al. (2015). Assessing cerebrovascular reactivity abnormality by comparison to a reference atlas. J. Cereb. Blood Flow. Metab. 35, 213–220. doi:10.1038/jcbfm.2014.184
Sobczyk, O., Sayin, E. S., Sam, K., Poublanc, J., Duffin, J., Fisher, J. A., et al. (2021). The reproducibility of cerebrovascular reactivity across MRI scanners. Front. physiology 12, 668662. doi:10.3389/fphys.2021.668662
Spees, W. M., Yablonskiy, D. A., Oswood, M. C., and Ackerman, J. J. (2001). Water proton MR properties of human blood at 1.5 Tesla: Magnetic susceptibility, T(1), T(2), T*(2), and non-lorentzian signal behavior. Magn. Reson Med. 45, 533–542. doi:10.1002/mrm.1072
Tzeng, Y. C., Ainslie, P. N., Cooke, W. H., Peebles, K. C., Willie, C. K., Macrae, B. A., et al. (2012). Assessment of cerebral autoregulation: The quandary of quantification. Am. J. Physiol. Heart Circ. Physiol. 303, H658–H671. doi:10.1152/ajpheart.00328.2012
Uludag, K., Muller-Bierl, B., and Ugurbil, K. (2009). An integrative model for neuronal activity-induced signal changes for gradient and spin echo functional imaging. Neuroimage 48, 150–165. doi:10.1016/j.neuroimage.2009.05.051
Vu, C., Chai, Y., Coloigner, J., Nederveen, A. J., Borzage, M., Bush, A., et al. (2021). Quantitative perfusion mapping with induced transient hypoxia using BOLD MRI. Magnetic Reson. Med. 85, 168–181. doi:10.1002/mrm.28422
Watabe, T., Shimosegawa, E., Kato, H., Isohashi, K., Ishibashi, M., and Hatazawa, J. (2014). CBF/CBV maps in normal volunteers studied with (15)O PET: A possible index of cerebral perfusion pressure. Neurosci. Bull. 30, 857–862. doi:10.1007/s12264-013-1458-0
Welch, P. (1967). The use of fast fourier transform for the estimation of power spectra: A method based on time averaging over short, modified periodograms. IEEE Trans. Audio Electroacoustics 15, 70–73. doi:10.1109/tau.1967.1161901
Wirestam, R., Thilmann, O., Knutsson, L., Bjorkman-Burtscher, I. M., Larsson, E. M., and Stahlberg, F. (2010). Comparison of quantitative dynamic susceptibility-contrast MRI perfusion estimates obtained using different contrast-agent administration schemes at 3T. Eur. J. Radiol. 75, e86–e91. doi:10.1016/j.ejrad.2009.07.038
Zhang, R., Zuckerman, J. H., Giller, C. A., and Levine, B. D. (1998). Transfer function analysis of dynamic cerebral autoregulation in humans. Am. J. Physiol. 274, H233–H241. doi:10.1152/ajpheart.1998.274.1.h233
Keywords: transfer function analysis, transient hypoxia, MRI, BOLD = blood oxygen level dependent, contrast agents, brain, perfusion imaging
Citation: Sayin ES, Sobczyk O, Poublanc J, Mikulis DJ, Fisher JA and Duffin J (2023) Transfer function analysis assesses resting cerebral perfusion metrics using hypoxia-induced deoxyhemoglobin as a contrast agent. Front. Physiol. 14:1167857. doi: 10.3389/fphys.2023.1167857
Received: 16 February 2023; Accepted: 07 April 2023;
Published: 03 May 2023.
Edited by:
Julien Vincent Brugniaux, Université Grenoble Alpes, FranceReviewed by:
Stephen John Payne, National Taiwan University, TaiwanCopyright © 2023 Sayin, Sobczyk, Poublanc, Mikulis, Fisher and Duffin. This is an open-access article distributed under the terms of the Creative Commons Attribution License (CC BY). The use, distribution or reproduction in other forums is permitted, provided the original author(s) and the copyright owner(s) are credited and that the original publication in this journal is cited, in accordance with accepted academic practice. No use, distribution or reproduction is permitted which does not comply with these terms.
*Correspondence: Ece Su Sayin, ZWNlc3Uuc2F5aW5AbWFpbC51dG9yb250by5jYQ==
Disclaimer: All claims expressed in this article are solely those of the authors and do not necessarily represent those of their affiliated organizations, or those of the publisher, the editors and the reviewers. Any product that may be evaluated in this article or claim that may be made by its manufacturer is not guaranteed or endorsed by the publisher.
Research integrity at Frontiers
Learn more about the work of our research integrity team to safeguard the quality of each article we publish.