 Declan Manning
 Richard Barrett-Jolley
 Richard L. Evans
 Caroline Dart
94% of researchers rate our articles as excellent or good
Learn more about the work of our research integrity team to safeguard the quality of each article we publish.
Find out more
BRIEF RESEARCH REPORT article
Front. Physiol., 06 March 2023
Sec. Membrane Physiology and Membrane Biophysics
Volume 14 - 2023 | https://doi.org/10.3389/fphys.2023.1141006
This article is part of the Research TopicThe Role of Calcium and Calcium Binding Proteins in Cell Physiology and DiseaseView all 6 articles
Skin is the largest organ in the human body with ∼95% of its surface made up of keratinocytes. These cells maintain a healthy skin barrier through regulated differentiation driven by Ca2+-transcriptional coupling. Many important skin conditions arise from disruption of this process although not all stages are fully understood. We know that elevated extracellular Ca2+ at the skin surface is detected by keratinocyte Gαq-coupled receptors that signal to empty endoplasmic reticulum Ca2+ stores. Orai channel store-operated Ca2+ entry (SOCE) and Ca2+ influx via “canonical” transient receptor potential (TRPC)-composed channels then activates transcription factors that drive differentiation. While STIM-mediated activation of Orai channels following store depletion is well defined, how TRPC channels are activated is less clear. Multiple modes of TRPC channel activation have been proposed, including 1) independent TRPC activation by STIM, 2) formation of Orai-TRPC-STIM complexes, and 3) the insertion of constitutively-active TRPC channels into the membrane during SOCE. To help distinguish between these models, we used high-resolution microscopy of intact keratinocyte (HaCaT) cells and immunogold transmission electron microscopy (TEM) of HaCaT plasma membrane sheets. Our data shows no evidence of significant insertion of Orai1 or TRPC subunits into the membrane during SOCE. Analysis of transmission electron microscopy data shows that during store-depletion and SOCE, Orai1 and TRPC subunits form separate membrane-localized clusters that migrate towards each other. This clustering of TRPC channel subunits in keratinocytes may support the formation of TRPC-STIM interactions at ER-plasma membrane junctions that are distinct from Orai-STIM junctions.
Keratinocytes protect the body from the extracellular environment by forming a condensed layer of cornified epithelial tissue that covers the proliferative cell layers below. The cornified layer is produced as keratinocytes crowd towards the skin surface and differentiate in response to increased extracellular calcium [Ca2+]o (Capone et al., 2000; Hofer and Brown, 2003; Tu et al., 2004). Elevated [Ca2+]o is detected by keratinocytes via the extracellular Ca2+-sensing receptor (CaSR), which couples to Gαq proteins to activate phospholipase C (Hofer & Brown, 2003; Tu et al., 2005). This in turns stimulates IP3-mediated Ca2+ mobilization from the endoplasmic reticulum (ER), emptying Ca2+ stores and triggering the opening of store-operated channels in the plasma membrane (Numaga-Tomita and Putney, 2013). Incoming Ca2+ then reaches the nucleus where it activates specific transcriptional factors, including the critical differentiation regulator activating protein 1 (AP-1). This form of Ca2+-transcriptional coupling notably upregulates the expression of many structural proteins, including involucrin and keratin, and also alters the expression of hundreds of other genes to shift the cell towards a differentiated phenotype (Rossi et al., 1998; Capone et al., 2000; Ng et al., 2000; Tu et al., 2004). A number of skin diseases including Darier’s disease, anhidrotic ectodermal dysplasia, Hailey’s disease and psoriasis arise from failures of epidermal Ca2+ handling (Pani and Singh, 2008; Lacruz and Feske, 2015; Dai et al., 2021), although several stages in the keratinocyte Ca2+-transcription pathway are not well understood.
Store-operated Ca2+ entry (SOCE) through Orai channels is a critical component of keratinocyte differentiation (Numaga-Tomita and Putney, 2013) and Ca2+ influx via “canonical” transient receptor potential (TRPC)-composed channels also plays an essential role (Tu et al., 2005; Fatherazi et al., 2007; Beck et al., 2008; Muller et al., 2008). Orai channels are directly activated by STIM proteins which themselves directly sense the Ca2+ levels within the internal stores (Emrich et al., 2022). However, there is no consensus for how TRPC channel opening is triggered by CaSR activation. Aside from activation by incoming “trigger” Ca2+ (Blair et al., 2009; Gross et al., 2009), some members of the TRPC family can be directly activated by diacylglycerol downstream of Gq protein activity (Hofmann et al., 1999; Trebak et al., 2003; Storch et al., 2017). However, there is also evidence for the activation of TRPC channels by STIM (Huang et al., 2006; Yuan et al., 2007; Alicia et al., 2008), the formation of Orai-TRPC-STIM complexes (Jardin et al., 2008; Jia et al., 2017), and the insertion of constitutively active TRPC channels into the membrane during SOCE (Cayouette et al., 2004; Cheng et al., 2011).
To distinguish between these latter three models, we used high-resolution microscopy of intact keratinocyte (HaCaT) cells to determine membrane insertion, and immunogold transmission electron microscopy of plasma membrane sheets to measure the spatial relationship between Orai1 and TRPC channel subunits at rest, and during store-depletion and SOCE.
Unless specified otherwise, all reagents were purchased from Sigma-Aldrich (St Louis, MO, United States). Experiments were undertaken at room temperature (20°C–25°C) unless indicated otherwise.
The HaCaT keratinocyte cell line was gifted from David Fernig (University of Liverpool, United Kingdom) and validated by 16-loci short tandem repeat profiling at the European Collection of Authenticated Cell Cultures (ECACC). Cells were cultured under sterile conditions at 37°C, 5% CO2 and sub-cultured every 3–4 days. Differentiated HaCaT cells were cultured in Dulbecco’s Modified Eagle’s Medium (DMEM) supplemented with 2 mM L-Glutamine and 10% (v/v) foetal bovine serum (FBS) (Thermo Fisher Scientific Inc., Waltham, MA, United States). To maintain a basal phenotype, HaCaT cells were cultured in low-Ca2+ DMEM (Thermo Fisher Scientific) supplemented with 30 µM CaCl2 and 10% (v/v) FBS following Ca2+ chelation with 0.76% (w/v) Chelex-100 resin (Wilson, 2014).
RNA was extracted using an RNeasy Mini Kit® (Qiagen, Valancia, CA, United States) according to manufacturer’s instructions. RNA was treated with DNAse I to remove contaminating genomic DNA before cDNA was synthesized using SuperScript® III reverse transcriptase (Invitrogen) according to manufacturer’s instructions.
Primers were obtained from Sigma-Aldrich or GeneGlobe (Qiagen; Supplementary Table S1). qRT-PCR reactions contained up to 200 ng cDNA, forward and reverse primers (10 nM), and PowerUp SYBR Green Mastermix 1X (Thermo Fisher Scientific) topped up to 25 µL with RNAse-free water (Thermo Fisher Scientific). Reactions were amplified with a StepOnePlus thermal cycler (Thermo Fisher Scientific). PCR reactions were initially subjected to a 95°C holding stage for 10 min followed by 48 cycles consisting of 15 s at 95°C followed by 60 s at 60°C. mRNA expression was calculated using the ΔΔCt method based on the formula RQ = 2−ΔΔCt (Livak and Schmittgen, 2001). No-template control reactions all failed to amplify any genetic material and melt curve analyses indicated no amplification of off-target products in each reaction. mRNA expression was normalised to β-actin and presented as mean ΔCt values or values relative to Orai1.
The following primary antibodies were used for immunofluorescence: mouse anti-Orai1 (sc-377281, Santa Cruz Biotechnology) and rabbit anti-TRPC1 (PA5-77303, Invitrogen). The following primary antibodies were used for gold particle transmission electron microscopy (TEM): rabbit anti-Orai1 (SAB3500412, Sigma) and mouse anti-TRPC1 (sc-133076, Santa Cruz Biotechnology). Secondary antibodies for immunofluorescence were: Alexa Fluor 488-conjugated anti-mouse IgG and Alexa-fluor 647 anti-rabbit IgG (Invitrogen). Primary antibodies for TEM were directly conjugated to gold particles. Antibodies were assessed for their ability to detect the Orai1 or TRPC1 using HEK293 cells transiently expressing epitope-tagged versions of the proteins (Supplementary Figures S1, S2). We also assessed the cross-reactivity of anti-Orai1 antibodies with Orai2 and Orai3 (Supplementary Figures S1, S2).
HaCaT cells were grown on poly-L-lysine-coated coverslips and fixed in 4% (w/v) paraformaldehyde (PFA), 0.2% (v/v) Triton X-100 in PBS for 10 min. Live cells were stained prior to fixation with 1X CellBrite 555 Fix in PBS (Biotium; 60 min). Fixed cells were washed with PBS and blocked in buffer containing 1% (w/v) bovine serum albumin (30 min) before incubating with primary antibody solutions in blocking buffer (1:50 dilution for 60 min). Cells were washed before addition of fluorophore-conjugated anti-IgG secondary antibodies in blocking buffer (30 min). Coverslips were mounted onto glass slides using Prolong Glass Antifade Mountant (Thermo Fisher Scientific). Images were captured through a ×63 oil-immersion objective (Zeiss) using the lattice-structured illumination microscopy (lattice-SIM) mode on an Elyra-7 super resolution microscope (Zeiss). 200 mW laser lines were used to stimulate fluorophores at 488, 561, and 642 nm wavelengths, at 2% laser intensity. Relevant excitation, filtering and grating parameters for each channel are detailed in Supplementary Table S2. Images were captured with 50 ms camera exposure time in 16-bit grey depth and z-stack images were captured every 101 nm, producing approximately 100 stacks per image.
Z-stack image files encompassing 2-6 cells were sectioned within ImageJ 2.3 (Rasband, W.S., ImageJ, U. S. National Institutes of Health, Bethesda, Maryland, United States, https://imagej.nih.gov/ij/, 1997–2018), removing the lower 10–20 z-planes to avoid any non-specific binding of CellBrite to the poly-L-lysine coverslip coating. Single-cell images were pre-processed using the SIM2 formula package for Zen Black 16.0 (Zeiss). 3-dimensional SIM2 processing was applied using the “Weak, Fixed” pre-set (Low input signal-to-noise ratio, 15 iterations, regularization weight 0.065) and a median filter was applied using the ‘Fast Fit’ method. Pre-processed z-stacks were exported into Imaris 9.8 (Andor) for image analysis. Binary “Surface” objects were segmented, firstly marking the plasma membrane (CellBrite 555 Fix) using smoothing (surface detail 0.0626 μm) and thresholding via background contrast (largest sphere diameter 1.00 μm). Total Orai1 and TRPC1 surfaces were also generated with smoothing (surface detail 0.0626 μm) and background contrast thresholding (largest sphere diameter 0.235 μm). “Split touching Objects (Region Growing)” was enabled to watershed closely aligned surfaces (seed points diameter 0.313 μm). Seed points were subjected to a median intensity filter to reduce non-specific signal. Finally, membrane-restricted Orai1 and TRPC1 surfaces were generated by strictly assessing surfaces overlapping the membrane volume (>10–20 μm3, the lower volume limit in Imaris 9.8). Surface statistics were exported into Excel 16.5 (Microsoft) to analyse volume overlap and nearest-neighbour distances.
Plasma membrane sheets were prepared from cultured HaCaT cells grown on poly-L-lysine-coated glass coverslips as previously described (Prior et al., 2003). For details on grid preparation see Supplementary Methods. Grids were imaged using a FEI 120 kV Tecnai G 2 Spirit BioTWIN transmission electron microscope. Distances between gold particles were measured using ImageJ 2.3 and exported to Excel 16.5 (Microsoft) for nearest-neighbour distance calculation and Prism 9 (GraphPad) for analysis. Images were processed using ImageJ 2.3 and Excel 16.5 (Microsoft Corp, United States) prior to analysis and plotting in Prism 9 (GraphPad Software, Inc., San Diego, United States). Density-based spatial clustering of applications with noise (DBSCAN) was implemented in R (Hahsler, 2019). Epsilon neighbourhood and minimum cluster size were set to 50 and 5 respectively. Other parameters were defaults.
Statistical tests and p values are stated throughout.
To assess the relative transcript levels of TRPC, Orai and STIM isoforms in HaCaT keratinocytes we used qRT-PCR to screen for mRNA expression in basal and differentiated cells. Transcripts for Orai1, Orai 2 and Orai3 were found in both basal and differentiated HaCaTs (Figures 1A, B, D). Orai1 expression, represented as a fraction of β-actin, was found to approximately double between basal and differentiated cells (Figure 1A). Orai2 and Orai3 expression were similar to Orai1 in the basal phenotype, but both Orai2 and Orai3 expression reduced with differentiation (Figure 1B). STIM1 was the dominant STIM isoform in both HaCaT phenotypes (Figures 1B, D). STIM2 was detected at much lower levels such that the approximate STIM1:STIM2 ratio was 10:1 in the basal phenotype versus 18:1 in the differentiated phenotype. TRPC1, C3, C4, C5, C6, and C7 transcript levels were also determined (Figures 1C, D). TRPC1 was the dominant isoform and C4 was also detected. Both TRPC variants were detected at low levels relative to Orai1 and remained relatively constant between basal and differentiated phenotypes. TRPC3, C5, C6, and C7 mRNA were not detected in samples from either HaCaT phenotype.
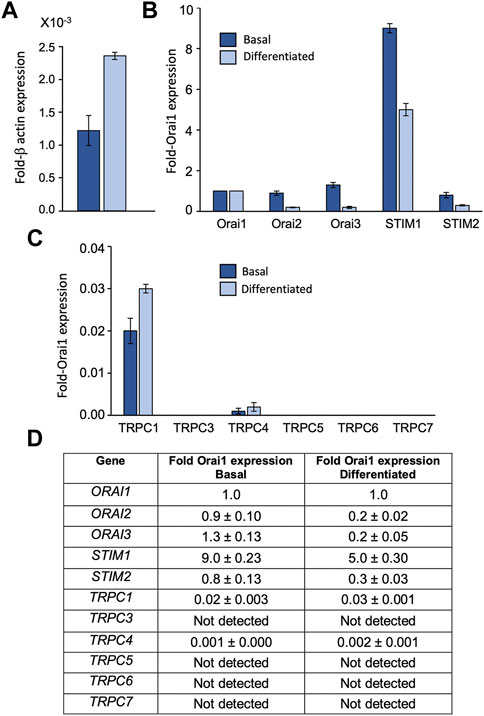
FIGURE 1. HaCaT keratinocytes express transcripts for Orai1, 2, 3, STIM1, 2 and TRPC 1, 4 HaCaT mRNA expression from basal (dark blue) and differentiated HaCaT cells (light blue) as determined by qRT-PCR. Results are presented relative to β-actin (A) or Orai1 expression (B,C). All STIM, Orai and TRPC results are shown as mean ± SEM for N = 3 experimental replicates (D).
Keratinocyte store-operated Ca2+ entry is driven largely by Orai1 (Numaga-Tomita and Putney, 2013). We thus chose to focus on this isoform for high-resolution lattice-structured illumination microscopy (lattice-SIM) studies to examine Orai-TRPC co-localization and Orai/TRPC membrane insertion during SOCE. Only TRPC1 and C4 have been implicated previously in keratinocyte store-operated currents (Cai et al., 2005; Cai et al., 2006; Fatherazi et al., 2007; Beck et al., 2008). Of these two TRPC variants that we detected at transcript level, only antibodies against the dominant TRPC1 were found to be suitable for use in combination with Orai1 antibodies in immunofluorescence experiments. We therefore selected TRPC1 for this investigation. Due to the number of other members of the TRPC family, cross-reactivity of the anti-TRPC1 antibodies was not assessed. These antibodies robustly detected epitope-tagged TRPC1 in transient expression systems (Supplementary Data), but we cannot exclude the possibility that in keratinocytes these antibodies cross-react with another TRPC protein.
Immunofluorescence experiments were conducted using antibodies targeted to Orai1 and TRPC1 in conjunction with plasma membrane staining (CellBrite 555 Fix; Figure 2A). Cells were treated with a SOCE activation protocol (5 min in nominally Ca2+-free PBS with 2 μM thapsigargin followed by 2 min in 2 mM Ca2+-supplemented PBS) or maintained in a resting condition (2 mM Ca2+-PBS alone) prior to fixation, permeabilization and staining. Plasma membrane staining was used to stratify Orai1 and TRPC1 signal incident at the plasma membrane. The resultant membrane-restricted TRPC1/Orai1 signal was used for co-localization and membrane expression analysis.
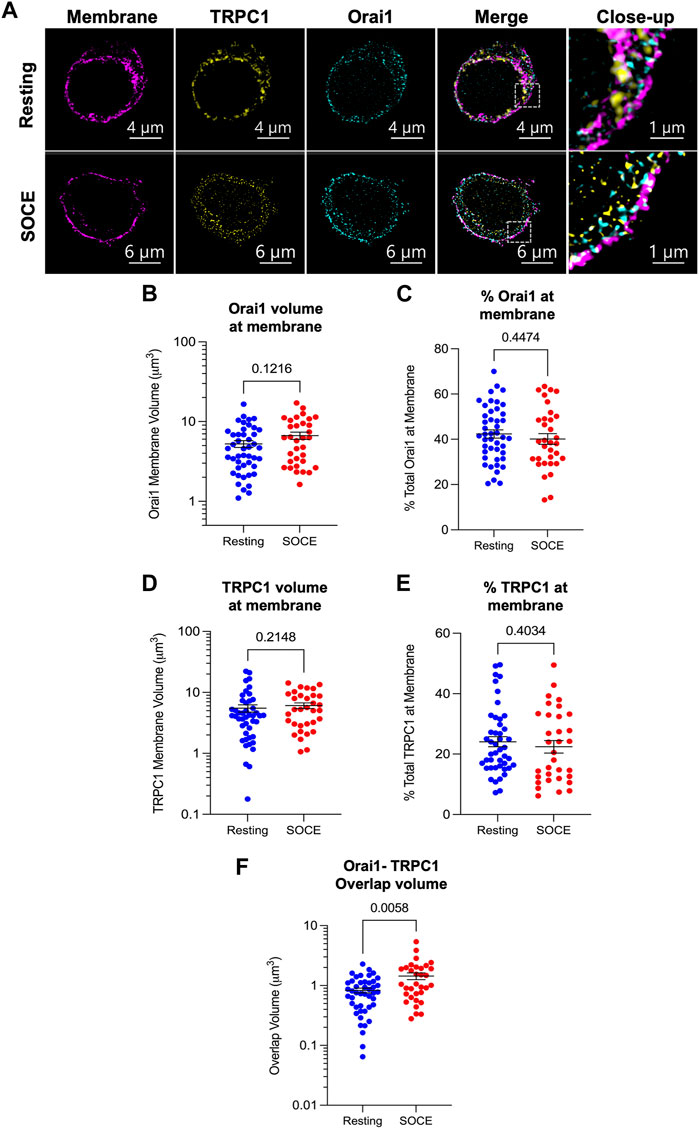
FIGURE 2. Orai1 and TRPC1 co-localize during SOCE but membrane levels of both proteins remain constant. (A) Representative lattice-SIM immunofluorescent images of HaCaT cells fixed in a resting state (upper panel) or following activation of store-operated Ca2+ entry (lower panel). Cells were stained for the plasma membrane (CellBrite 555 Fix), and with antibodies against TRPC1 and Orai1. Images show a transverse slice from a z-stack which was used to construct 3D models for co-localization analysis. Staining for TRPC1 and Orai1 was identified using the surfaces methodology in Imaris v9.8 (see Section 2). Surfaces of TRPC1/Orai1 signal were filtered to staining coincident with the plasma membrane stain and watershed to represent individual clusters of fluorescence signal. Resultant surfaces were analysed for overlap of Orai1 (B,C), TRPC1 (D,E) and with the plasma membrane stain and for total overlapping volume of Orai1-TRPC1 (F) under both resting (blue) and SOCE (red) conditions.
TRPC1 and Orai1 membrane expression was assessed by examining the volume of signal co-incident with the plasma membrane stain (Figures 2A–E). Membrane-incident Orai1 volume was 4.59 μm3 in resting cells (median, IQR 2.68–7.23 μm3; Figure 2B, blue) versus 6.24 μm3 in the SOCE condition (IQR 2.96–9.93 μm3; red; Mann-Whitney test, p = 0.1216). These values correspond with 41.5% of total Orai1 signal in resting cells (IQR 32.9%–51.8%; Figure 2C, blue) versus 38.5% of total Orai1 signal in the SOCE condition (IQR 30.3%–49.6%; red; p = 0.4474). Membrane-incident TRPC1 volume was 4.16 μm3 in resting cells (median, IQR 2.01–6.98 μm3; Figure 2D, blue) versus 5.22 μm3 in the SOCE condition (IQR 2.93–8.91 μm3; red; p = 0.2148). As a percentage of the total TRPC1 signal detected in each cell, these values correspond with 21.4% of total TRPC1 in resting cells (IQR 15.8%–30.7%; Figure 2E, blue) versus 20.5% of total TRPC1 in the SOCE condition (IQR 12.2%–33.1%; red; p = 0.4034). This suggests that neither Orai1 nor TRPC1 membrane expression vary significantly during HaCaT SOCE.
To assess the spatial relationship of the proteins in the membrane and how this changes during store depletion and Ca2+ entry we examined their co-localization. The total volume of coincident Orai1 and TRPC1 signal in the resting condition was 0.75 μm3 (median; IQR 0.43–1.13 μm3; N = 45 cells; Figure 2F, blue), compared with a significantly increased coincident volume in the SOCE condition of 1.05 μm3 (IQR 0.68–1.96 μm3; N = 33 cells; red; Mann-Whitney test, p = 0.0058). This suggests that a greater number of Orai1 and TRPC1 molecules are co-localized during SOCE compared with baseline.
We sought to confirm this SOCE-induced co-localization with the higher resolution of electron microscopy. HaCaT cells were treated prior to fixation and preparation for imaging. Treatments included either: 1) 7 min in 2 mM Ca2+-supplemented PBS (resting); 2) 7 min in nominally Ca2+-free PBS with 2 μM thapsigargin (depleted); or 3) 5 min in Ca2+-free PBS with thapsigargin followed by 2 min in 2 mM Ca2+-PBS (SOCE). After treatment and fixation, basal HaCaT plasma membranes were ripped off exposing the inner membrane leaflet for immunolabelling with primary antibodies targeted to cytoplasmic portions of Orai1 and TRPC1 proteins. Primary antibodies were directly conjugated with gold nanoparticles (Orai1:10 nm diameter gold and TRPC1: 3 nm diameter gold) to distinguish between these proteins (Figure 3A). This procedure was carried out three times per condition (N = 3 biological replicates), with each condition totalling between 117–365 Orai1-associated particles and 156–1107 TRPC1-associated particles. Distances between gold particles were measured to calculate nearest-neighbour distances. We investigated whether these Euclidean distances were clustered, and whether such cluster configurations altered with treatment, using the density-based spatial clustering of applications with noise (DBSCAN) technique (Hahsler, 2019). Clustering was quantified for four different distance combinations (Orai1-Orai1; TRPC1-TRPC1; Orai1-TRPC1; TRPC1-Orai1) under three conditions each (at rest, following store depletion, and during SOCE).
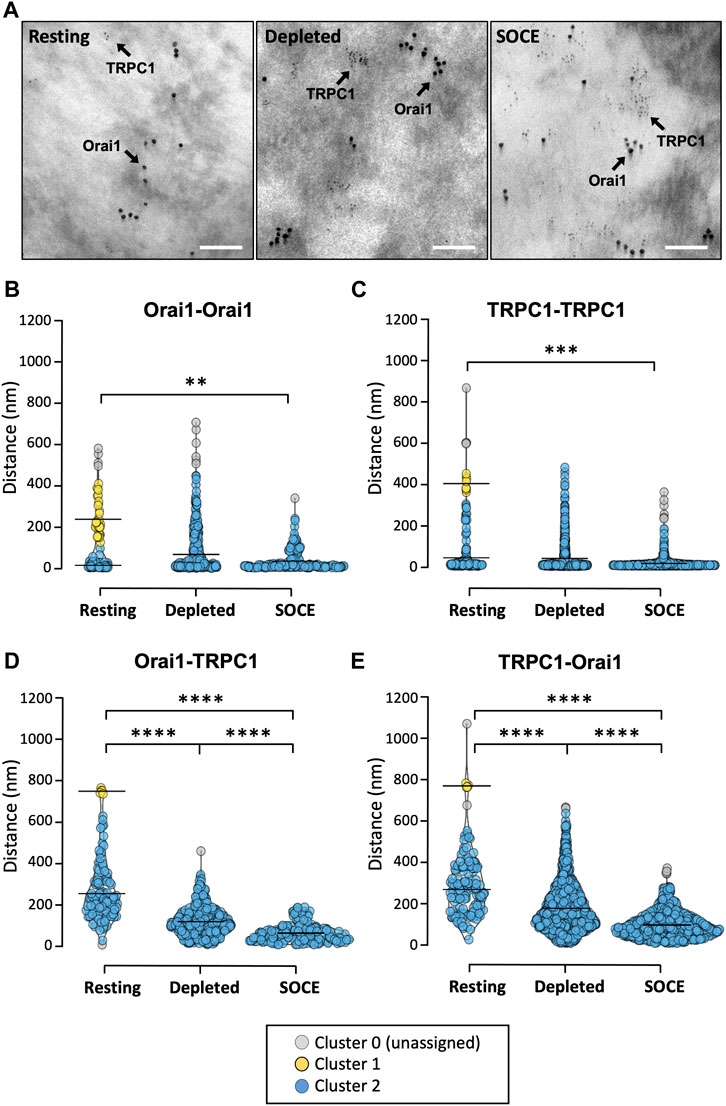
FIGURE 3. TRPC1 and Orai1 channel populations cluster and co-localize under Ca2+ store depletion and SOCE conditions. (A) Representative transmission electron micrographs of HaCaT cell membrane rip-offs (N = 3 biological replicates per condition) immunolabelled with 10 nm and 3 nm diameter gold nanoparticles targeted to Orai1 and TRPC1, respectively (scale bar 100 nm). (B) Distances between gold particles were measured to calculate nearest-neighbour distances and the DBSCAN technique used to assess whether these Euclidean distances were clustered and whether identified cluster configurations altered with treatment. Clustering was quantified for four different distance combinations [Orai1-Orai1(B); TRPC1-TRPC1 (C); Orai1-TRPC1 (D); TRPC1-Orai1 (E)] under three conditions each (at rest, during store depletion, and during SOCE). For all conditions two clusters [cluster 1 (yellow) and cluster 2 (blue)] were detected at rest. Cluster 0 (grey) denotes particles not attributed to any cluster. Only one cluster (blue) was detected in all conditions following store depletion and SOCE. The mean distance between particles in each identified cluster is indicated by the horizontal line. Significance levels refer to the median distance between all particles within the population for a given condition (Kruskal-Wallis with Dunn’s multiple comparisons; **p = 0.006; ***p = 0.0009; ****p < 0.0001; see text for details).
For each distance combination, clustering analysis detected two clusters at rest and only one cluster following store depletion and SOCE (Figures 3B–E). Note that the two “clusters” at rest simply denote that some particles are “close” and others are “further away,” perhaps randomly distributed throughout the membrane. The loss of the “further away” population following treatment for each distance combination reflects that the particles move closer together. This suggests that under these conditions, Orai1 and TRPC1 subunits form separate membrane-localized clusters and that these clusters migrate towards each other.
For Orai1 channels at rest, the mean distance between Orai1 particles was 244.5 ± 80.0 nm in cluster 1 (mean ± SD; n = 35; Figure 3B, yellow) and 21.9 ± 14.9 nm for cluster 2 (n = 78; Figure 3B, blue). Following store depletion, only one cluster could be detected centred at 74.7 ± 93.8 nm (n = 357; Figure 3B, blue), and during SOCE only one cluster was identified centred at 42.1 ± 46.7 nm (n = 174; Figure 3B, blue). A similar pattern was seen for TRPC1-TRPC1 distances (Figure 3C). At rest, the mean distance between TRPC1 particles was 404.9 ± 32.9 nm in cluster 1 (n = 8; Figure 3C, yellow) and 45.5 ± 76.2 nm for cluster 2 (n = 144; Figure 3C, blue). One cluster was detected following store depletion centred at 41.8 ± 66.3 nm (n = 1,107, blue) and, again, only one cluster was detected during SOCE centred at 17.6 ± 19.1 nm (n = 823, blue). We also analysed the distance between Orai1-TRPC1 particles and, conversely, TRPC1-Orai1 under the different conditions. At rest, the mean distance between Orai1-TRPC1 was 749.6 ± 10.9 nm in cluster 1 (n = 5; Figure 3D, yellow) and 259.1 ± 125.0 in cluster 2 (n = 111; Figure 3D, blue). This was found to be similar for TRPC1-Orai1 distances at rest where cluster centres were at 776.3 ± 8.1 nm and 275.9 ± 117.0 nm for cluster 1 (n = 5; Figure 3E, yellow) and cluster 2 (n = 149; Figure 3E, blue), respectively. Here, again, the two clusters coalesced into one cluster following treatment. Following store depletion, the mean distance between Orai1-TRPC1 particles was 115.1 ± 68.5 nm (n = 362; Figure 3D, blue), similar to the mean distance between TRPC1-Orai1 (177.0 ± 112.6 nm, n = 1,105; Figure 3E, blue). During SOCE, the one identified Orai-TRPC cluster centred at 64.5 ± 43.3 nm (n = 175; Figure 3D, blue), and the single TRPC-Orai cluster centred at 96.4 ± 57.9 nm (n = 825; Figure 3E, blue).
Independent from cluster analysis, we also looked at the median distance between all particles within the population for a given condition (Supplementary Figure S3). The distance between a given labelled Orai1 particle and its nearest Orai1 neighbour was found to be significantly lower during SOCE (median 19 nm, IQR 14–52 nm) compared to resting (median 24 nm; IQR 15–206 nm; Kruskal-Wallis with Dunn’s multiple comparisons, p = 0.0056). Similarly, TRPC1 nearest-neighbour distances were significantly lower in the SOCE condition (median 11 nm, IQR 8–18 nm) compared to at rest (14 nm, IQR 8–54 nm; p = 0.006).
Orai1-TRPC1 median nearest-neighbour distances were 236 nm (IQR 163–334 nm) at rest compared to 106 nm in the depleted condition (IQR 67–154 nm) and 57 nm during SOCE (IQR 31–85 nm). A Kruskal-Wallis test with Dunn’s multiple comparisons demonstrated a statistically significant difference between all three distributions (p < 0.0001). Conversely, TRPC1-Orai median nearest-neighbour distances were 274 nm (IQR 169–386 nm), versus 150 nm in the depleted condition (IQR 97–236 nm) and 83 nm in the SOCE condition (54–128 nm; blue). Similar to the above, a Kruskal-Wallis test with Dunn’s multiple comparisons demonstrated a statistically significant difference between the distributions in all three conditions (p < 0.0001).
Ca2+ influx via TRPC-composed channels plays a crucial role in the Ca2+-transcriptional coupling that underlies keratinocyte differentiation (Tu et al., 2005; Fatherazi et al., 2007; Beck et al., 2008; Muller et al., 2008). Here we investigate the spatial relationship between these channels and Orai1 in the HaCaT cell membrane following store depletion and during SOCE. Our data support the idea that under these conditions separate populations TRPC channels coalesce to form larger membrane-localized clusters that migrate towards clustered Orai channels.
To assess the spatial relationship of Orai and TRPC channels at the membrane under resting and SOCE conditions, high-resolution imaging was undertaken. Immunofluorescence experiments with cells fixed in resting and SOCE conditions suggest that plasma membrane Orai1 and TRPC1 co-localize during SOCE, as assessed by the overlap of respective fluorescence signal at the plasma membrane. Plasma membrane levels of Orai1 and TRPC1 were both found to be consistent between resting and SOCE conditions. These results are in contrast to findings that Orai1 Ca2+ entry recruits TRPC1 to the plasma membrane (Cayouette et al., 2004; Cheng et al., 2011) and findings that Orai1 is recruited to the membrane during ER Ca2+ store depletion (Woodard et al., 2008). We determined plasma membrane-restricted Orai and TRPC based on the staining of a well-characterized dye, which covalently labels the surface of live cells. Cells were stained prior to fixation and permeabilization to avoid dye internalization as much as possible. We cannot exclude the staining of some intracellular membranes however, and a proportion of the membrane-restricted TRPC1 or Orai1 signal may originate from intracellular trafficking vesicles close to the plasma membrane or the membrane of the junctional ER, (approximately 20 nm distance from the plasma membrane).
To look at the plasma membrane in isolation we turned to the higher-resolution membrane rip-off technique in conjunction with immuno-gold labelling and TEM. TEM carries a resolution limit closer to 0.1 nm (Franken et al., 2020) and so is expected to give enhanced detail of Orai1-TRPC1 localisation at the plasma membrane. Likely reflecting the relatively low abundance of these proteins, the staining density of Orai1/TRPC1-conjugated gold particles did not meet the minimum requirement for Ripley’s K Function analysis of clustering or co-localization (Prior et al., 2003), so nearest-neighbour distances were calculated. These data confirm numerous studies that show Orai channel clustering during SOCE (Xu et al., 2006; Park et al., 2009). Unbiased cluster analysis detected two distinct clusters for Orai at rest and only one cluster following store depletion. The lost cluster represents the “further away” population, suggesting that Orai particles begin to move closer together during store depletion. When analyzing Orai1 nearest-neighbor distances, the change in median distance between rest and store-depleted conditions did not reach significance. One possible explanation for this is that our study looks at endogenous Orai channels as opposed to over–expression systems which may exaggerate clustering effects. Since we could not directly assess Orai-STIM interactions in these experiments, another possibility is that the detected Orai clusters are not active clusters induced by STIM. Our results also demonstrate separate clustering of TRPC1 channel subunits, and a general migration of Orai1 clusters and TRPC1 clusters towards each other under these conditions. It is tempting to speculate that this may be evidence for TRPC1-STIM interactions at ER-plasma membrane junctions that are distinct from Orai-STIM junctions, although we have no direct evidence for this. This has been indicated previously in pancreatic acinar secretory epithelial cells (Hong et al., 2011) and also in HEK293 overexpression experiments (DeHaven et al., 2009), with specialized STIM-TRPC junctions suggested to exist independent of other STIM-Orai or STIM-Orai-TRPC junctions.
Original datasets are publicly available. This data can be found here: http://cci02.liv.ac.uk/gallery/show_group/1204/ http://figshare.com/articles/dataset/Data/20407206.
DM, RE, and CD were responsible for the conception and design of experiments. DM conducted all experiments. DM, RE, RB-J, and CD were responsible for analysis and interpretation of data. DM and CD were responsible for the original draft of the article. DM, RE, RB-J, and CD were responsible for revising the article and approving the final version.
This work was supported by a Biotechnology and Biological Sciences Research Council (BBSRC)—Unilever Collaborative Training Partnership grant BB/R505432/1 (recipient: DM, award: CD/RE).
Thanks to the staff at the Liverpool Centre for Cell Imaging (CCI): Marie Held, Marco Marcello, and Jen Adcott for their help and advice with the lattice-SIM imaging and analysis. Also thanks to Alison Beckett and Ian Prior at the Liverpool Biomedical Electron Microscopy Unit for their guidance and help with the immunogold labelling and transmission electron microscopy.
The authors declare that the research was conducted in the absence of any commercial or financial relationships that could be construed as a potential conflict of interest.
All claims expressed in this article are solely those of the authors and do not necessarily represent those of their affiliated organizations, or those of the publisher, the editors and the reviewers. Any product that may be evaluated in this article, or claim that may be made by its manufacturer, is not guaranteed or endorsed by the publisher.
The Supplementary Material for this article can be found online at: https://www.frontiersin.org/articles/10.3389/fphys.2023.1141006/full#supplementary-material
Alicia, S., Angelica, Z., Carlos, S., Alfonso, S., and Vaca, L. (2008). STIM1 converts TRPC1 from a receptor-operated to a store-operated channel: Moving TRPC1 in and out of lipid rafts. Cell Calcium 44 (5), 479–491. doi:10.1016/j.ceca.2008.03.001
Beck, B., Lehen'kyi, V., Roudbaraki, M., Flourakis, M., Charveron, M., Bordat, P., et al. (2008). TRPC channels determine human keratinocyte differentiation: New insight into basal cell carcinoma. Cell Calcium 43 (5), 492–505. doi:10.1016/j.ceca.2007.08.005
Blair, N. T., Kaczmarek, J. S., and Clapham, D. E. (2009). Intracellular calcium strongly potentiates agonist-activated TRPC5 channels. J. Gen. Physiol. 133 (5), 525–546. doi:10.1085/jgp.200810153
Cai, S., Fatherazi, S., Presland, R. B., Belton, C. M., and Izutsu, K. T. (2005). TRPC channel expression during calcium-induced differentiation of human gingival keratinocytes. J. Dermatol Sci. 40 (1), 21–28. doi:10.1016/j.jdermsci.2005.06.005
Cai, S., Fatherazi, S., Presland, R. B., Belton, C. M., Roberts, F. A., Goodwin, P. C., et al. (2006). Evidence that TRPC1 contributes to calcium-induced differentiation of human keratinocytes. Pflugers Arch. 452 (1), 43–52. doi:10.1007/s00424-005-0001-1
Capone, A., Visco, V., Belleudi, F., Marchese, C., Cardinali, G., Bellocci, M., et al. (2000). Up-modulation of the expression of functional keratinocyte growth factor receptors induced by high cell density in the human keratinocyte HaCaT cell line. Cell Growth Differ. 11 (11), 607–614.
Cayouette, S., Lussier, M. P., Mathieu, E. L., Bousquet, S. M., and Boulay, G. (2004). Exocytotic insertion of TRPC6 channel into the plasma membrane upon Gq protein-coupled receptor activation. J. Biol. Chem. 279 (8), 7241–7246. doi:10.1074/jbc.M312042200
Cheng, K. T., Liu, X., Ong, H. L., Swaim, W., and Ambudkar, I. S. (2011). Local Ca2+ entry via Orai1 regulates plasma membrane recruitment of TRPC1 and controls cytosolic Ca2+ signals required for specific cell functions. PLoS Biol. 9 (3), e1001025. doi:10.1371/journal.pbio.1001025
Dai, Y., Yu, L., Wang, Y., Gao, M., and Wang, P. (2021). Case report: A case of Hailey-Hailey disease mimicking condyloma acuminatum and a novel splice-site mutation of ATP2C1 gene. Front. Genet. 12, 777630. doi:10.3389/fgene.2021.777630
DeHaven, W. I., Jones, B. F., Petranka, J. G., Smyth, J. T., Tomita, T., Bird, G. S., et al. (2009). TRPC channels function independently of STIM1 and Orai1. J. Physiol. 587 (10), 2275–2298. doi:10.1113/jphysiol.2009.170431
Emrich, S. M., Yoast, R. E., and Trebak, M. (2022). Physiological functions of CRAC channels. Annu. Rev. Physiol. 84, 355–379. doi:10.1146/annurev-physiol-052521-013426
Fatherazi, S., Presland, R. B., Belton, C. M., Goodwin, P., Al-Qutub, M., Trbic, Z., et al. (2007). Evidence that TRPC4 supports the calcium selective I(CRAC)-like current in human gingival keratinocytes. Pflugers Arch. 453 (6), 879–889. doi:10.1007/s00424-006-0156-4
Franken, L. E., Grunewald, K., Boekema, E. J., and Stuart, M. C. A. (2020). A technical introduction to transmission electron microscopy for soft-matter: Imaging, possibilities, choices, and technical developments. Small 16 (14), e1906198. doi:10.1002/smll.201906198
Gross, S. A., Guzman, G. A., Wissenbach, U., Philipp, S. E., Zhu, M. X., Bruns, D., et al. (2009). TRPC5 is a Ca2+-activated channel functionally coupled to Ca2+-selective ion channels. J. Biol. Chem. 284 (49), 34423–34432. doi:10.1074/jbc.M109.018192
Hahsler, M. P., Piekenbrock, M., and Doran, D. (2019). dbscan: Fast density-based clustering with R. J. Stat. Softw., 91(1), 1–30. doi:10.18637/jss.v091.i01
Hofer, A. M., and Brown, E. M. (2003). Extracellular calcium sensing and signalling. Nat. Rev. Mol. Cell Biol. 4 (7), 530–538. doi:10.1038/nrm1154
Hofmann, T., Obukhov, A. G., Schaefer, M., Harteneck, C., Gudermann, T., and Schultz, G. (1999). Direct activation of human TRPC6 and TRPC3 channels by diacylglycerol. Nature 397 (6716), 259–263. doi:10.1038/16711
Hong, J. H., Li, Q., Kim, M. S., Shin, D. M., Feske, S., Birnbaumer, L., et al. (2011). Polarized but differential localization and recruitment of STIM1, Orai1 and TRPC channels in secretory cells. Traffic 12 (2), 232–245. doi:10.1111/j.1600-0854.2010.01138.x
Huang, G. N., Zeng, W., Kim, J. Y., Yuan, J. P., Han, L., Muallem, S., et al. (2006). STIM1 carboxyl-terminus activates native SOC, I(crac) and TRPC1 channels. Nat. Cell Biol. 8 (9), 1003–1010. doi:10.1038/ncb1454
Jardin, I., Lopez, J. J., Salido, G. M., and Rosado, J. A. (2008). Orai1 mediates the interaction between STIM1 and hTRPC1 and regulates the mode of activation of hTRPC1-forming Ca2+ channels. J. Biol. Chem. 283 (37), 25296–25304. doi:10.1074/jbc.M802904200
Jia, S., Rodriguez, M., Williams, A. G., and Yuan, J. P. (2017). Homer binds to Orai1 and TRPC channels in the neointima and regulates vascular smooth muscle cell migration and proliferation. Sci. Rep. 7 (1), 5075. doi:10.1038/s41598-017-04747-w
Lacruz, R. S., and Feske, S. (2015). Diseases caused by mutations in ORAI1 and STIM1. Ann. N. Y. Acad. Sci. 1356 (1), 45–79. doi:10.1111/nyas.12938
Livak, K. J., and Schmittgen, T. D. (2001). Analysis of relative gene expression data using real-time quantitative PCR and the 2(-Delta Delta C(T)) Method. Methods 25 (4), 402–408. doi:10.1006/meth.2001.1262
Muller, M., Essin, K., Hill, K., Beschmann, H., Rubant, S., Schempp, C. M., et al. (2008). Specific TRPC6 channel activation, a novel approach to stimulate keratinocyte differentiation. J. Biol. Chem. 283 (49), 33942–33954. doi:10.1074/jbc.M801844200
Ng, D. C., Shafaee, S., Lee, D., and Bikle, D. D. (2000). Requirement of an AP-1 site in the calcium response region of the involucrin promoter. J. Biol. Chem. 275 (31), 24080–24088. doi:10.1074/jbc.M002508200
Numaga-Tomita, T., and Putney, J. W. (2013). Role of STIM1-and Orai1-mediated Ca2+ entry in Ca2+-induced epidermal keratinocyte differentiation. J. Cell Sci. 126 (2), 605–612. doi:10.1242/jcs.115980
Pani, B., and Singh, B. B. (2008). Darier's disease: A calcium-signaling perspective. Cell Mol. Life Sci. 65 (2), 205–211. doi:10.1007/s00018-007-7397-z
Park, C. Y., Hoover, P. J., Mullins, F. M., Bachhawat, P., Covington, E. D., Raunser, S., et al. (2009). STIM1 clusters and activates CRAC channels via direct binding of a cytosolic domain to Orai1. Cell 136 (5), 876–890. doi:10.1016/j.cell.2009.02.014
Prior, I. A., Parton, R. G., and Hancock, J. F. (2003). Observing cell surface signaling domains using electron microscopy. Sci. STKE 2003, PL9. doi:10.1126/stke.2003.177.pl9
Rossi, A., Jang, S. I., Ceci, R., Steinert, P. M., and Markova, N. G. (1998). Effect of AP1 transcription factors on the regulation of transcription in normal human epidermal keratinocytes. J. Invest. Dermatol 110 (1), 34–40. doi:10.1046/j.1523-1747.1998.00071.x
Storch, U., Forst, A. L., Pardatscher, F., Erdogmus, S., Philipp, M., Gregoritza, M., et al. (2017). Dynamic NHERF interaction with TRPC4/5 proteins is required for channel gating by diacylglycerol. Proc. Natl. Acad. Sci. U. S. A. 114 (1), E37–E46. doi:10.1073/pnas.1612263114
Trebak, M., St, J. B. G., McKay, R. R., Birnbaumer, L., and Putney, J. W. (2003). Signaling mechanism for receptor-activated canonical transient receptor potential 3 (TRPC3) channels. J. Biol. Chem. 278 (18), 16244–16252. doi:10.1074/jbc.M300544200
Tu, C. L., Chang, W., and Bikle, D. D. (2005). Phospholipase cgamma1 is required for activation of store-operated channels in human keratinocytes. J. Invest. Dermatol 124 (1), 187–197. doi:10.1111/j.0022-202X.2004.23544.x
Tu, C. L., Oda, Y., Komuves, L., and Bikle, D. D. (2004). The role of the calcium-sensing receptor in epidermal differentiation. Cell Calcium 35 (3), 265–273. doi:10.1016/j.ceca.2003.10.019
Wilson, V. G. (2014). Growth and differentiation of HaCaT keratinocytes. Methods Mol. Biol. 1195, 33–41. doi:10.1007/7651_2013_42
Woodard, G. E., Salido, G. M., and Rosado, J. A. (2008). Enhanced exocytotic-like insertion of Orai1 into the plasma membrane upon intracellular Ca2+ store depletion. Am. J. Physiol. Cell Physiol. 294 (6), C1323–C1331. doi:10.1152/ajpcell.00071.2008
Xu, P., Lu, J., Li, Z., Yu, X., Chen, L., and Xu, T. (2006). Aggregation of STIM1 underneath the plasma membrane induces clustering of Orai1. Biochem. Biophys. Res. Commun. 350 (4), 969–976. doi:10.1016/j.bbrc.2006.09.134
Keywords: orai channels, TRPC channels, keratinocytes, store-operated calcium entry, store-operated channels, skin, epidermis, differentiation
Citation: Manning D, Barrett-Jolley R, Evans RL and Dart C (2023) TRPC1 channel clustering during store-operated Ca2+ entry in keratinocytes. Front. Physiol. 14:1141006. doi: 10.3389/fphys.2023.1141006
Received: 09 January 2023; Accepted: 20 February 2023;
Published: 06 March 2023.
Edited by:
Nathan Dascal, Tel Aviv University, IsraelReviewed by:
Klaus Groschner, Medical University of Graz, AustriaCopyright © 2023 Manning, Barrett-Jolley, Evans and Dart. This is an open-access article distributed under the terms of the Creative Commons Attribution License (CC BY). The use, distribution or reproduction in other forums is permitted, provided the original author(s) and the copyright owner(s) are credited and that the original publication in this journal is cited, in accordance with accepted academic practice. No use, distribution or reproduction is permitted which does not comply with these terms.
*Correspondence: Caroline Dart, Yy5kYXJ0QGxpdmVycG9vbC5hYy51aw==
‡Present address: Declan Manning, Department of Physiology and Membrane Biology, School of Medicine, University of California, Davis, CA, United States
Disclaimer: All claims expressed in this article are solely those of the authors and do not necessarily represent those of their affiliated organizations, or those of the publisher, the editors and the reviewers. Any product that may be evaluated in this article or claim that may be made by its manufacturer is not guaranteed or endorsed by the publisher.
Research integrity at Frontiers
Learn more about the work of our research integrity team to safeguard the quality of each article we publish.