 Chengjun Huang
 Zhiyuan Lu
 Maoqi Chen
 Cliff S. Klein
 Yingchun Zhang
 Sheng Li
 Ping Zhou
- 1Department of Neuroscience, Baylor College of Medicine, Houston, TX, United States
- 2School of Rehabilitation Science and Engineering, University of Health and Rehabilitation Sciences, Qingdao, Shandong, China
- 3Guangdong Work Injury Rehabilitation Center, Guangzhou, Guangdong, China
- 4Department of Biomedical Engineering, University of Houston, Houston, TX, United States
- 5Department of Physical Medicine and Rehabilitation, University of Texas Health Science Center at Houston, Houston, TX, United States
- 6TIRR Memorial Hermann Hospital, Houston, TX, United States
This study examined methods for estimating the innervation zone (IZ) of a muscle using recorded monopolar high density M waves. Two IZ estimation methods based on principal component analysis (PCA) and Radon transform (RT) were examined. Experimental M waves, acquired from the biceps brachii muscles of nine healthy subjects were used as testing data sets. The performance of the two methods was evaluated by comparing their IZ estimations with manual IZ detection by experienced human operators. Compared with manual detection, the agreement rate of the estimated IZs was 83% and 63% for PCA and RT based methods, respectively, both using monopolar high density M waves. In contrast, the agreement rate was 56% for cross correlation analysis using bipolar high density M waves. The mean difference in estimated IZ location between manual detection and the tested method was 0.12 ± 0.28 inter-electrode-distance (IED) for PCA, 0.33 ± 0.41 IED for RT and 0.39 ± 0.74 IED for cross correlation-based methods. The results indicate that the PCA based method was able to automatically detect muscle IZs from monopolar M waves. Thus, PCA provides an alternative approach to estimate IZ location of voluntary or electrically-evoked muscle contractions, and may have particular value for IZ detection in patients with impaired voluntary muscle activation.
1 Introduction
The innervation zone (IZ) of a muscle is the region where muscle fibers are innervated by motor axon terminals. The architecture of the IZ can influence electromyographic (EMG) signal characteristics recorded from the muscle surface (Nishihara et al., 2010; Rantalainen et al., 2012; Gallina et al., 2013; Ye et al., 2015; Smith et al., 2017; de Souza et al., 2022). The ability to detect the location of the IZ using EMG techniques has implications for understanding muscle function in health and disease. Thus, monitoring changes in IZ location may provide valuable information about the processes of motor unit remodeling associated with aging, disease, and injury (Jahanmiri-Nezhad et al., 2015; Rasool et al., 2017; Dias et al., 2018; Li et al., 2021). In addition, the ability to detect the IZ has important clinical value. For example, one clinical application of IZ estimation is to guide botulinum toxin (BTX) injection more precisely for treating spasticity in patients with neurological injuries such as stroke and cerebral palsy (Van Campenhout and Molenaers, 2011; Guzmán-Venegas et al., 2014; Zhang et al., 2019; Chen et al., 2020; Zhang et al., 2021). The effectiveness of BTX treatment has been reported to depend on the distance between the injection site and the IZ (Shaari and Ira Sanders, 1993; Lapatki et al., 2011; Kaymak et al., 2018).
The IZ can be identified through EMG signals recorded by a linear electrode array or a matrix of electrodes placed over the muscle (Drost et al., 2006; Barbero et al., 2012; Piccoli et al., 2014; Campanini et al., 2022). Most investigators have estimated the location of the IZ based on surface EMG recordings of voluntary muscle contractions and processing the signals in a single differential or bipolar configuration (Ostlund et al., 2007; Mesin et al., 2009; Enck et al., 2010; Barbero et al., 2011; Beck et al., 2012; Ullah et al., 2014; Marateb et al., 2016; Liu et al., 2019; Mancebo et al., 2019; Liu et al., 2020; Zhang et al., 2020), whereas few have processed monopolar signals for IZ estimation (Rodriguez-Falces, 2017). When EMG signals are processed in a differential configuration the IZ location may correspond to either a reversal in EMG signal polarity between two adjacent channels along the muscle fibers, or the smallest amplitude in a single channel.
Although voluntary contractions are convenient for estimating the IZ, they may not be feasible in patients with significant paralysis or poor motor control. An alternative method for IZ location is to record compound muscle action potentials (or M waves) evoked by electrical stimulation of the motor nerve, but few have used this approach (Zhang et al., 2017). In two reports, the IZ location was found to be similar when based on M waves and voluntary EMG (Guzmán-Venegas et al., 2016) (Huang et al., 2019). When recording M waves using electrode arrays, a monopolar electrode configuration is often used because bipolar configuration may considerably attenuate M wave content (Tucker and Türker, 2005; Hadoush et al., 2009; Rodriguez-Falces and Place, 2018). There is a need to further develop appropriate methods to automatically estimate the IZ from M wave signals recorded in a monopolar configuration.
In this study we investigated two methods to estimate the IZ from monopolar M-wave recordings. One method was based on principal component analysis (PCA); specifically, the second principal component coefficients derived from PCA, which are related to time delays of different EMG channels. The method is suitable for analysis of monopolar signals and has been evaluated using high density voluntary surface EMG signals (Huang et al., 2022), but not on electrically-evoked signals. The other method is based on Radon transform (RT), which can be used to detect linear patterns in a two-dimensional signal and has been proved useful for IZ estimation (Cescon, 2006). Although IZ estimation based on RT was mainly applied to bipolar voluntary surface EMG signals (Li et al., 2021), (Cescon, 2006), (Li et al., 2022), theoretically, the RT method can also be applied on monopolar signals for estimation of IZ location.
The usefulness of PCA and RT methods for automated estimation of IZ location was explored in the current study using monopolar M waves recorded with surface electrode arrays from the biceps brachii (BB) muscles. The performance of automatic IZ detection was compared with manual detection based on visual inspection of the M waves. The objective was to provide an alternative approach to voluntary contraction for reliable and automatic estimation of muscle IZ.
2 Methods
2.1 Experiment
2.1.1 Participants and consent
Nine healthy male subjects (mean ± SD, 28.9 ± 4.8 years) without a history of neuromuscular or musculoskeletal disorders participated in the study. They were well informed of the experimental procedures, including possible risks and discomforts. All subjects gave written informed consent approved by the ethics committee of Guangdong Work Injury Rehabilitation Center (Guangzhou, China).
2.1.2 Experiment protocols
Two high density channel arrays (ELSCH064NM2, Bioelettronica, Torino, Italy) were placed parallel to the muscle fiber direction over the lateral side (Array 1) and the medial side (Array 2) of the BB after skin preparation and fixed with elastic straps (Figure 1A). Each channel matrix consists of 64 channels with an 8 mm inter electrode distance (IED) arranged in a grid of 5 columns by 13 rows (one column contained only 12 channels). A ground electrode was placed at the elbow. A constant-current stimulator (DS7A, Digitimer, Herthfordshire, UK) and standard bar electrode (3 cm inter-electrode spacing) were used to evoke BB M-waves. The bar electrode was placed over the musculocutaneous nerve at the proximal medial side of the BB (Figure 1B). Single pulses of 1 ms duration were applied every 5 s as the current intensity was increased until the maximal M-wave was recorded. The M waves were recorded by a signal amplifier (100x) in monopolar configuration (EMG-USB2, sampling frequency of 2048 Hz, 12-bit A/D converter, Bioelettronica, Torino, Italy).
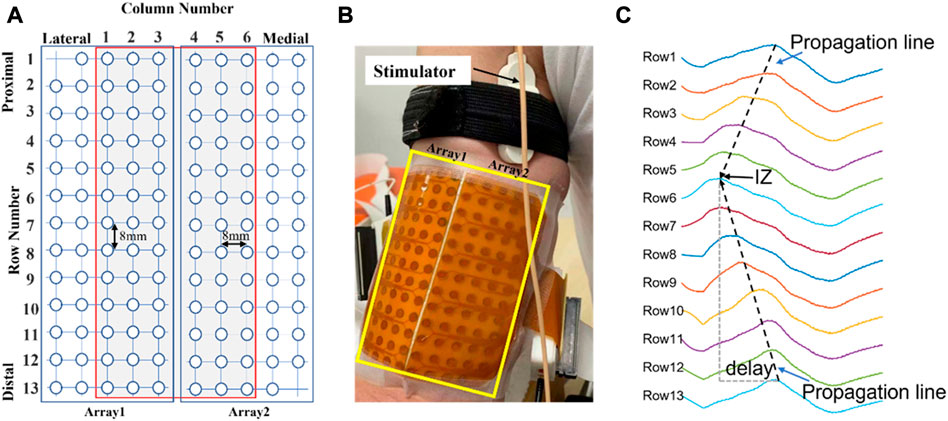
FIGURE 1. (A): Schematic representation of the two adhesive 2D matrices for recording experimental signals. (B): High-density electrode array recording with columns positioned parallel to the muscle fiber direction. (C): An example of monopolar M waves of 13 channels in one of the columns from a representative subject. The IZ is located close to row 6. Delay: time interval of the waveforms travelling distally from the IZ.
2.2 Detection of muscle IZ from monopolar M waves
2.2.1 Muscle IZ estimation based on PCA
The rationale for using the 2nd principal component coefficients derived from PCA for IZ estimation was explained in detail (Huang et al., 2022). Briefly, PCA performs the eigen decomposition on the covariance matrix Σ of the standardized (zero mean, and unit variance) electrode array EMG signals X (M-by-N matrix, N samples and M channels), which is a M × M matrix where each element represents the covariance between two channels. The elements of each eigenvector are the coefficients of each principal component. It has been proven that the 2nd principal component coefficients are related with the time delays of different channels due to signal propagation from the IZ to the two ends of a muscle (Huang et al., 2022) (Laguna et al., 2018). As illustrated in Figure 1C, the channels located near the IZ are expected to have minimum time delay. Therefore, analysis of the 2nd principal component coefficients can provide useful information pertaining to IZ location.
2.2.2 Muscle IZ estimation based on RT
The procedures of the RT based IZ identification have been described in detail (Cescon, 2006). For a column of signals, starting from the first row, the RT was implemented to search for the optimal propagation lines from signals at either side of a row i (i = 1,2,3 … 13), or between row j and row j + 1 (j = 1,2,3 … 12). A total of 25 RT results were obtained. As illustrated in Figure 1C, the potentials in the spatiotemporal surface EMG signal appear along inclined lines as they travel from the IZ to the tendon regions at a certain velocity. Therefore, the IZ location can be estimated by the maximum RT result.
2.3 Performance evaluation
The M-waves of the two most lateral and most two medial side columns were excluded from IZ identification as they were close to margin of the muscle. This left 6 columns for IZ estimation for each subject (Figure 1A). For each M wave, stimulation artifact was identified and suppressed as described previously (Liu et al., 2014). The signal duration was 0.2 s. For the PCA-based method, the signals were standardized (zero mean and unit variance). The spline interpolation was applied to the 2nd component coefficients along the rows to determine the IZ location for each column. For the RT based method, the signals were rectified. The output of the IZ detection was the channel number if the IZ was located on a specific channel or the average of neighboring channels if the IZ was located between two channels. In addition, the IZ was estimated from a conventional cross correlation method applied on bipolar M wave signals constructed from monopolar signals. The identified IZs from each of the methods were compared with those estimated manually based on visual inspection of the M waves by at least two experienced investigators. These investigators reached an agreement on IZ location prior to automated processing. The IZ location from manual inspection was used as the reference for quantifying the performance of the automated methods.
3 Results
Figure 2A shows one column of M waves in both monopolar and bipolar configurations for a single subject. Visually, the IZ was located near the channel at row 7. Figure 2B shows spatial distribution of the 2nd component coefficients. Notice that the position of the smallest coefficients was at row 7. The RT method also identified the IZ at row 7 (Figure 2C). The minimum correlation coefficient was between bipolar pair row6—row7 and row 7—row8 (Figure 2D), which also indicated that the IZ was located at row 7 based on the monopolar configuration. These results reveal that IZ location was similar across the three methods.
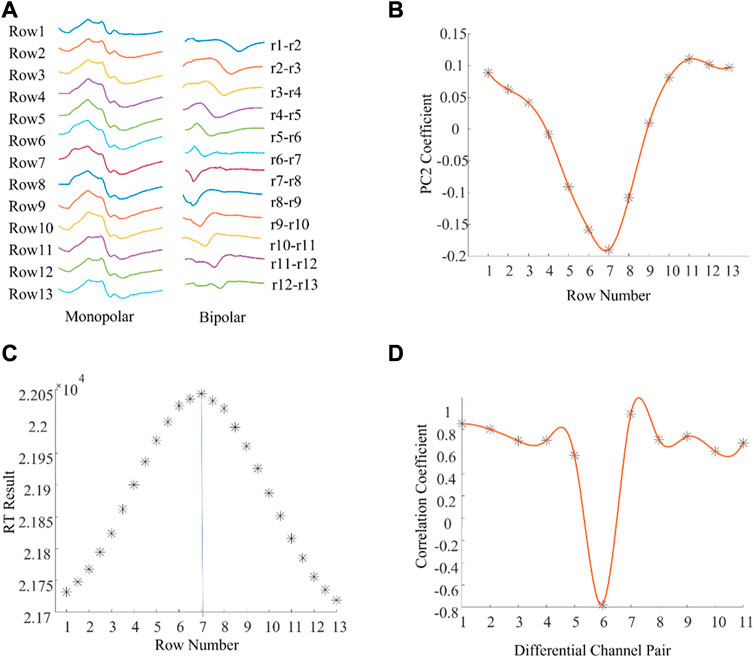
FIGURE 2. An example of muscle IZ estimation from experimental high density M waves where different methods reached the same results. (A): A column of M waves of a tested subject. (B): PCA based IZ estimation: the minimum coefficient was located at row 7 and the coefficients gradually increased along the fiber direction. (C): RT based IZ estimation: the distribution of RT results across all the rows, and between rows. (D): Cross correlation based IZ estimation: the distribution of the correlation coefficients between adjacent bipolar signals.
There were also examples where the different methods produced different IZ locations (Figure 3). Figure 3A shows a column of M waves in both monopolar and bipolar configurations from a different subject. The IZ was located between row 5 and row 6 according to the 2nd principal component coefficients (Figure 3B) and at row 6 according to the maximum RT (Figure 3C). In contrast, the IZ was located at row 4 (between bipolar pair row 3—row 4, and row 4—row 5) according to the minimum correlation coefficient (Figure 3D). To explore possible reasons for the different estimates, the associated M waves were visually examined. As shown in Figure 3E, at the second phase of the M wave from row 4, there was a very short segment of saturation, which caused an artificial phase reversal between the bipolar pair row3—row4, and row4—row5, leading to misidentification of the IZ. Visual inspection of the M waves revealed that the IZ was located between row 5 and row 6. This was also confirmed from the differential signals as the amplitude between row 5 and row 6 was close to 0.
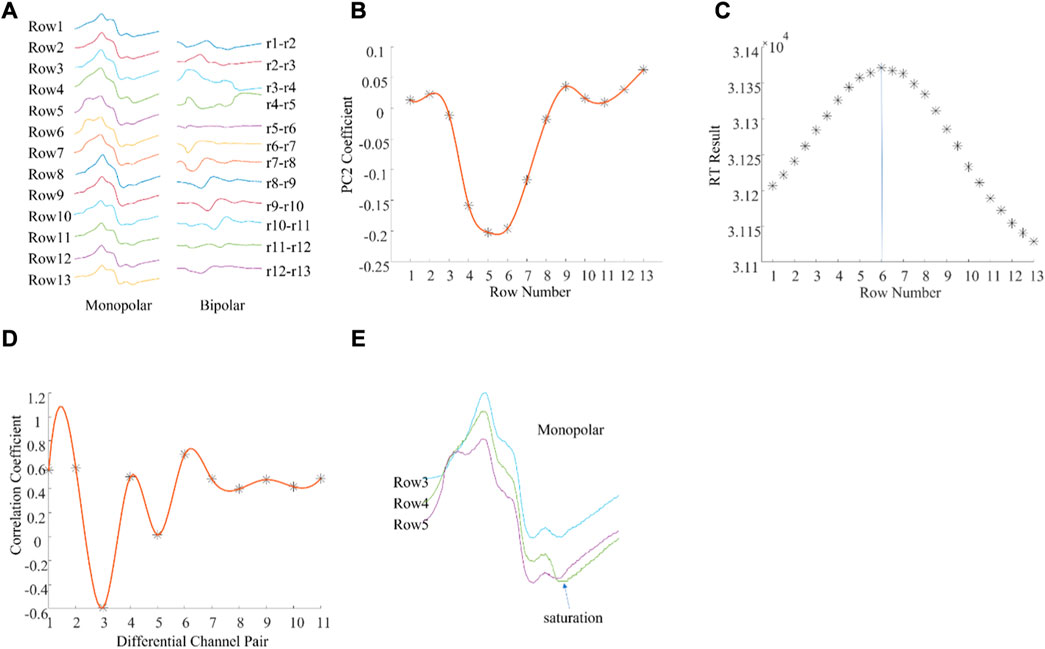
FIGURE 3. An example of muscle IZ estimation from experimental high density M waves where different methods produced different results. (A): A column of M waves of a single subject. (B): PCA based IZ estimation; (C): RT based IZ estimation; (D): Cross correlation based IZ estimation; (E): Enlarged view of the monopolar M waves from rows 3, 4, and 5. See text for details.
In total, 54 columns of experimental signals were processed for IZ estimation. Among them, 45 IZs (83%) estimated from the PCA, 34 IZs (63%) from the RT, and 30 IZs (56%) from the cross correlation were the same as estimations based on visual inspection. Compared with the visual estimations (reference IZs), the mean difference in estimated IZ location was 0.12 ± 0.28 IED for PCA, 0.33 ± 0.41 IED for RT, and 0.39 ± 0.74 IED for cross correlation.
4 Discussion
The ability to estimate muscle IZ through high density surface EMG signals using linear or 2-dimensional electrode arrays may be important clinically. A typical application is to guide BTX injection as close as possible to the IZ for spasticity treatment (Lapatki et al., 2011), (Kaymak et al., 2018). Voluntary contraction and electrical stimulation of the motor nerve are two common ways to generate surface EMG signals. The advantage of using electrical stimulation for IZ estimation is that it can be applied in patients who are paralyzed or lack the necessary voluntary control. M waves are commonly recorded in a monopolar mode, which provides informative content of action potential generation, propagation, and extinction (Rodriguez-Falces and Place, 2018). Compared with a differential configuration, monopolar recording can capture EMG signals from a larger muscle volume. The loss of M wave signal due to phase cancellation was more pronounced in bipolar than monopolar recording (Tucker and Türker, 2005). Although M waves provide a valuable signal source, its application for muscle IZ estimation has been rarely explored in the literature.
The current study examined two methods of estimating IZ location (PCA and RT) from monopolar M waves of the BB muscles. The BB was chosen as it is often affected by spasticity in patients with neurological disorders and is thus often a target muscle for treatment. Compared with manual IZ detection by an experienced investigator, the PCA based method achieved more consistent performance than one based on RT. PCA and RT use different computational approaches for IZ estimation. In PCA, a simplified time misaligned data model shows that the 2nd principal component coefficients are linearly related with the time delay of different channels (Laguna et al., 2018). Therefore, the 2nd principal component can be used for IZ estimation. The rationale of RT is that it can be used to measure the projections of the line-scan image at a range of angles and determine the propagation of waveforms. When the RT is applied for IZ estimation, it is assumed that waveforms propagate at a constant velocity on both sides of the IZ (Cescon, 2006). However, this is not always the case experimentally, as illustrated from examples of the 2nd principal component coefficients distributions (Figures 2, 3). This might be one reason that the performance of RT is not as consistent as PCA.
The IZ was also estimated from cross correlation analysis applied to bipolar M waves constructed from the monopolar signals, and its performance was the least consistent relative to the visual inspected IZ. In the correlation coefficient method, if one monopolar channel is of poor signal quality, the constructed bipolar configuration may be affected leading to errors in IZ location (Figure 3). This was also demonstrated in our previous study (Huang et al., 2022).
The experimental data sets used for evaluating IZ estimation performance were limited to the BB of healthy subjects. Recordings from other muscles in the future is desirable. It would be clinically relevant to test patients with neurological disorders such as stroke. The IED of the electrode array used in this study was 8 mm. This limited the spatial resolution for IZ detection, but can be increased by using a smaller IED. In addition, this study only considered a single IZ in a muscle. The effects of possible multiple IZs on recorded M waves needs further investigation, as they may compromise accuracy of the estimated IZ (Piccoli et al., 2014), (Huang et al., 2021) (Lateva et al., 2010).
In summary, the current study explored the feasibility of estimating IZ using monopolar high density BB M waves. The PCA based method was able to automatically detect muscle IZs from monopolar M waves, demonstrating a performance most consistent with manual detection by human operators. The findings provide an alternative approach to voluntary contractions for estimating the IZ, which has practical clinical value for patients with compromised ability to voluntarily activate their skeletal musculature.
Data availability statement
The raw data supporting the conclusion of this article will be made available by the authors, without undue reservation.
Ethics statement
The studies involving human participants were reviewed and approved by the ethics committee of Guangdong Work Injury Rehabilitation Center. The patients/participants provided their written informed consent to participate in this study.
Author contributions
Conceptualization: PZ, CK, YZ, and SL; methodology: CH, ZL, MC, and PZ; data collection: CH and CK; data analysis and interpretation: CH, ZL, MC, YZ, SL, CK, and PZ; writing—original draft preparation: CH; writing—review and editing: PZ, CK, YZ, and SL; Study supervision: CK and PZ All authors have read and agreed to the published version of the manuscript.
Funding
This work was supported by Shandong Provincial Natural Science Foundation (ZR2020KF012, ZR2021QH267, and ZR2021QH053), National Natural Science Foundation of China (82102179), and the Guangzhou Science and Technology Program (201904010256).
Conflict of interest
The authors declare that the research was conducted in the absence of any commercial or financial relationships that could be construed as a potential conflict of interest.
Publisher’s note
All claims expressed in this article are solely those of the authors and do not necessarily represent those of their affiliated organizations, or those of the publisher, the editors and the reviewers. Any product that may be evaluated in this article, or claim that may be made by its manufacturer, is not guaranteed or endorsed by the publisher.
References
Barbero, M., Merletti, R., and Rainoldi, A. (2012). Atlas of muscle innervation zones: Understanding surface electromyography and its applications. Berlin/Heidelberg, Germany: Springer Science & Business Media.
Barbero, M., Gatti, R., Lo Conte, L., Macmillan, F., Coutts, F., and Merletti, R. (2011). Reliability of surface EMG matrix in locating the innervation zone of upper trapezius muscle. J. Electromyogr. Kinesiol. 21 (5), 827–833. doi:10.1016/j.jelekin.2011.05.013
Beck, T. W., DeFreitas, J. M., and Stock, M. S. (2012). Accuracy of three different techniques for automatically estimating innervation zone location. Comput. Methods Programs Biomed. 105 (1), 13–21. doi:10.1016/j.cmpb.2010.07.003
Campanini, I., Merlo, A., Disselhorst-Klug, C., Mesin, L., Muceli, S., and Merletti, R. (2022). Fundamental concepts of bipolar and high-density surface EMG understanding and teaching for clinical, occupational, and sport applications: Origin, detection, and main errors. Sensors (Basel) 22 (11), 4150. doi:10.3390/s22114150
Cescon, C. (2006). “Automatic location of muscle innervation zones from multi-channel surface EMG signals,” in IEEE International Workshop on Medical Measurement and Applications, Benevento, Italy, 20-21 April 2006 (IEEE), 87–90.
Chen, Y.-T., Zhang, C., Liu, Y., Magat, E., Verduzco-Gutierrez, M., Francisco, G. E., et al. (2020). The effects of botulinum toxin injections on spasticity and motor performance in chronic stroke with spastic hemiplegia. Toxins (Basel). 12 (8), 492. doi:10.3390/toxins12080492
de Souza, L. M. L., Cabral, H. V., de Oliveira, L. F., and Vieira, T. M. (2022). Differences between vastus medialis and lateralis excitation onsets are dependent on the relative distance of surface electrodes placement from the innervation zone location. J. Electromyogr. Kinesiol 67, 102713. doi:10.1016/j.jelekin.2022.102713
Dias, N., Li, X., Zhang, C., and Zhang, Y. (2018). Innervation asymmetry of the external anal sphincter in aging characterized from high-density intra-rectal surface EMG recordings. Neurourol. Urodyn. 37 (8), 2544–2550. doi:10.1002/nau.23809
Drost, G., Stegeman, D. F., van Engelen, B. G., and Zwarts, M. J. (2006). Clinical applications of high-density surface EMG: A systematic review. J. Electromyogr. Kinesiol 16 (6), 586–602. doi:10.1016/j.jelekin.2006.09.005
Enck, P., Franz, H., Davico, E., Mastrangelo, F., Mesin, L., and Merletti, R. (2010). Repeatability of innervation zone identification in the external anal sphincter muscle. Neurourol. Urodyn. 29 (3), 449–457. doi:10.1002/nau.20749
Gallina, A., Merletti, R., and Gazzoni, M. (2013). Innervation zone of the vastus medialis muscle: Position and effect on surface EMG variables. Physiol. Meas. 34 (11), 1411–1422. doi:10.1088/0967-3334/34/11/1411
Guzmán-Venegas, R. A., Araneda, O. F., and Silvestre, R. A. (2014). Differences between motor point and innervation zone locations in the biceps brachii. An exploratory consideration for the treatment of spasticity with botulinum toxin. J. Electromyogr. Kinesiol 24 (6), 923–927. doi:10.1016/j.jelekin.2014.07.012
Guzmán-Venegas, R. A., Bralic, M. P., Cordero, J. J., Cavada, G., and Araneda, O. F. (2016). Concordance of the location of the innervation zone of the tibialis anterior muscle using voluntary and imposed contractions by electrostimulation. J. Electromyogr. Kinesiol. 27, 18–23. doi:10.1016/j.jelekin.2016.01.002
Hadoush, H., Tobimatsu, Y., Nagatomi, A., Kimura, H., Ito, Y., and Maejima, H. (2009). Monopolar surface electromyography: A better tool to assess motoneuron excitability upon passive muscle stretching. J. Physiol. Sci. 59 (3), 243–247. doi:10.1007/s12576-009-0027-9
Huang, C., Chen, M., Li, X., Zhang, Y., Li, S., and Zhou, P. (2021). Neurophysiological factors affecting muscle innervation zone estimation using surface EMG: A simulation study. Biosensors 11 (10), 356. doi:10.3390/bios11100356
Huang, C., Chen, M., Zhang, Y., Li, S., Klein, C. S., and Zhou, P. (2022). A novel muscle innervation zone estimation method using monopolar high density surface electromyography. IEEE Trans. Neural Syst. Rehabil. Eng. 31, 2022–2030. doi:10.1109/TNSRE.2022.3215612
Huang, C., Klein, C. S., Meng, Z., Zhang, Y., Li, S., and Zhou, P. (2019). Innervation zone distribution of the biceps brachii muscle examined using voluntary and electrically-evoked high-density surface EMG. J. Neuroeng. Rehabil. 16 (1), 73–79. doi:10.1186/s12984-019-0544-6
Jahanmiri-Nezhad, F., Barkhaus, P. E., Rymer, W. Z., and Zhou, P. (2015). Innervation zones of fasciculating motor units: Observations by a linear electrode array. Front. Hum. Neurosci. 9, 239. doi:10.3389/fnhum.2015.00239
Kaymak, B., Kara, M., Yağiz On, A., Soylu, A. R., and Özçakar, L. (2018). Innervation zone targeted botulinum toxin injections. Eur. J. Phys. Rehabil. Med. 54 (1), 100–109. doi:10.23736/S1973-9087.17.04663-9
Laguna, P., Garde, A., Giraldo, B. F., Meste, O., Jané, R., and Sörnmo, L. (2018). Eigenvalue-based time delay estimation of repetitive biomedical signals. Digit. Signal Process. 75, 107–119. doi:10.1016/j.dsp.2018.01.007
Lapatki, B. G., Van Dijk, J. P., Van De Warrenburg, B. P. C., and Zwarts, M. J. (2011). Botulinum toxin has an increased effect when targeted toward the muscle’s endplate zone: A high-density surface EMG guided study. Clin. Neurophysiol. 122 (8), 1611–1616. doi:10.1016/j.clinph.2010.11.018
Lateva, Z. C., McGill, K. C., and Johanson, M. E. (2010). The innervation and organization of motor units in a series-fibered human muscle: The brachioradialis. J. Appl. Physiol. 108, 1530–1541. doi:10.1152/japplphysiol.01163.2009
Li, X., Huang, C., Lu, Z., Wang, I., Klein, C. S., Zhang, L., et al. (2022). Distribution of innervation zone and muscle fiber conduction velocity in the biceps brachii muscle. J. Electromyogr. Kinesiol. 63, 102637. doi:10.1016/j.jelekin.2022.102637
Li, X., Lu, Z., Wang, I., Li, L., Stampas, A., and Zhou, P. (2021). Assessing redistribution of muscle innervation zones after spinal cord injuries. J. Electromyogr. Kinesiol. 59, 102550. doi:10.1016/j.jelekin.2021.102550
Liu, J., Li, S., Jahanmiri-Nezhad, F., Zev Rymer, W., and Zhou, P. (2019). Motor unit innervation zone localization based on robust linear regression analysis. Comput. Biol. Med. 106, 65–70. doi:10.1016/j.compbiomed.2019.01.007
Liu, J., Li, S., Li, X., Klein, C., Rymer, W. Z., and Zhou, P. (2014). Suppression of stimulus artifact contaminating electrically evoked electromyography. NeuroRehabilitation 34 (2), 381–389. doi:10.3233/NRE-131045
Liu, Y., Zhang, C., Dias, N., Chen, Y. T., Li, S., Zhou, P., et al. (2020). Transcutaneous innervation zone imaging from high-density surface electromyography recordings. J. Neural Eng. 17 (1), 016070. doi:10.1088/1741-2552/ab673e
Mancebo, F. D., Cabral, H. V., de Souza, L. M. L., de Oliveira, L. F., and Vieira, T. M. (2019). Innervation zone locations distribute medially within the pectoralis major muscle during bench press exercise. J. Electromyogr. Kinesiol 46, 8–13. doi:10.1016/j.jelekin.2019.03.002
Marateb, H. R., Farahi, M., Rojas, M., Mañanas, M. A., and Farina, D. (2016). Detection of multiple innervation zones from multi-channel surface EMG recordings with low signal to noise ratio using graph-cut segmentation. PLoS One 11 (12), e0167954. doi:10.1371/journal.pone.0167954
Mesin, L., Gazzoni, M., and Merletti, R. (2009). Automatic localisation of innervation zones: A simulation study of the external anal sphincter. J. Electromyogr. Kinesiol. 19 (6), e413–e421. e413–e421. doi:10.1016/j.jelekin.2009.02.002
Nishihara, K., Chiba, Y., Suzuki, Y., Moriyama, H., Kanemura, N., Ito, T., et al. (2010). Effect of position of electrodes relative to the innervation zone on surface EMG. J. Med. Eng. Technol. 34 (2), 141–147. doi:10.3109/03091900903480754
Ostlund, N., Gerdle, B., and Stefan Karlsson, J. (2007). Location of innervation zone determined with multichannel surface electromyography using an optical flow technique. J. Electromyogr. Kinesiol. 17 (5), 549–555. doi:10.1016/j.jelekin.2006.06.002
Piccoli, M. B., Rainoldi, A., Heitz, C., Wuthrich, M., Boccia, G., Tomasoni, E., et al. (2014). Innervation zone locations in 43 superficial muscles: Toward a standardization of electrode positioning. Muscle Nerve 49, 413–421. doi:10.1002/mus.23934
Rantalainen, T., Kłodowski, A., and Piitulainen, H. (2012). Effect of innervation zones in estimating biceps brachii force-EMG relationship during isometric contraction. J. Electromyogr. Kinesiol 22 (1), 80–87. doi:10.1016/j.jelekin.2011.09.012
Rasool, G., Afsharipour, B., and Suresh, N. L. (2017). Spatial analysis of multichannel surface EMG in hemiplegic stroke. IEEE Trans. Neural Syst. Rehabil. Eng. 25 (10), 1802–1811. doi:10.1109/TNSRE.2017.2682298
Rodriguez-Falces, J. (2017). A new method for the localization of the innervation zone based on monopolar surface-detected potentials. J. Electromyogr. Kinesiol. Off. J. Int. Soc. Electrophysiol. Kinesiol. 35, 47–60. doi:10.1016/j.jelekin.2017.05.004
Rodriguez-Falces, J., and Place, N. (2018). Determinants, analysis and interpretation of the muscle compound action potential (M wave) in humans: Implications for the study of muscle fatigue. Eur. J. Appl. Physiol. 118 (3), 501–521. doi:10.1007/s00421-017-3788-5
Shaari, C. M., and Ira Sanders, M. D. (1993). Quantifying how location and dose of botulinum toxin injections affect muscle paralysis. Muscle Nerve 16 (9), 964–969. doi:10.1002/mus.880160913
Smith, C. M., Housh, T. J., Zuniga, J. M., Camic, C. L., Bergstrom, H. C., Smith, D. B., et al. (2017). Influences of interelectrode distance and innervation zone on electromyographic signals. Int. J. Sports Med. 38 (2), 111–117. doi:10.1055/s-0042-119398
Tucker, K. J., and Türker, K. S. (2005). A new method to estimate signal cancellation in the human maximal M-wave. J. Neurosci. Methods 149 (1), 31–41. doi:10.1016/j.jneumeth.2005.05.010
Ullah, K., Cescon, C., Afsharipour, B., and Merletti, R. (2014). Automatic detection of motor unit innervation zones of the external anal sphincter by multichannel surface EMG. J. Electromyogr. Kinesiol. 24 (6), 860–867. doi:10.1016/j.jelekin.2014.05.003
Van Campenhout, A., and Molenaers, G. (2011). Localization of the motor endplate zone in human skeletal muscles of the lower limb: Anatomical guidelines for injection with botulinum toxin. Dev. Med. Child. Neurol. 53 (2), 108–119. doi:10.1111/j.1469-8749.2010.03816.x
Ye, X., Beck, T. W., and Wages, N. P. (2015). Relationship between innervation zone width and mean muscle fiber conduction velocity during a sustained isometric contraction. J. Musculoskelet. Neuronal Interact. 15 (1), 95–102.
Zhang, C., Chen, Y. T., Liu, Y., Zhou, P., Li, S., and Zhang, Y. (2019). Three dimensional innervation zone imaging in spastic muscles of stroke survivors. J. Neural Eng. 16 (3), 034001. doi:10.1088/1741-2552/ab0fe1
Zhang, C., Dias, N., He, J., Zhou, P., Li, S., and Zhang, Y. (2020). Global innervation zone identification with high-density surface electromyography. IEEE Trans. Biomed. Eng. 67 (3), 718–725. doi:10.1109/TBME.2019.2919906
Zhang, C., Peng, Y., Liu, Y., Li, S., Zhou, P., Rymer, W. Z., et al. (2017). Imaging three-dimensional innervation zone distribution in muscles from M-wave recordings. J. Neural Eng. 14 (3), 036011. doi:10.1088/1741-2552/aa65dd
Keywords: innervation zone, monopolar, M wave, electrode array, principal component analysis, radon transform
Citation: Huang C, Lu Z, Chen M, Klein CS, Zhang Y, Li S and Zhou P (2023) Muscle innervation zone estimation from monopolar high-density M-waves using principal component analysis and radon transform. Front. Physiol. 14:1137146. doi: 10.3389/fphys.2023.1137146
Received: 04 January 2023; Accepted: 27 February 2023;
Published: 15 March 2023.
Edited by:
Lisheng Xu, Northeastern University, ChinaReviewed by:
Wenjun Tan, Northeastern University, ChinaYang Yao, ShanghaiTech University, China
Hongbo Xie, Queensland University of Technology, Australia
Copyright © 2023 Huang, Lu, Chen, Klein, Zhang, Li and Zhou. This is an open-access article distributed under the terms of the Creative Commons Attribution License (CC BY). The use, distribution or reproduction in other forums is permitted, provided the original author(s) and the copyright owner(s) are credited and that the original publication in this journal is cited, in accordance with accepted academic practice. No use, distribution or reproduction is permitted which does not comply with these terms.
*Correspondence: Zhiyuan Lu, emhpeXVhbi5sdUB1b3IuZWR1LmNu; Ping Zhou, ZHIucGluZy56aG91QG91dGxvb2suY29t