 Nisarg Radadia1
 Yonni Friedlander2,3
 Eldar Priel2,4,5Norman B. Konyer3Chynna Huang2Mobin Jamal1
 Troy Farncombe6,7
 Christopher Marriott6,7Christian Finley2,4,5
 John Agzarian2,4,5
 Myrna Dolovich1,2,3
 Michael D. Noseworthy3,6,8
 Parameswaran Nair1,2
 Yaron Shargall2,4,5
 Sarah Svenningsen1,2,3*
- 1Division of Respirology, Department of Medicine, McMaster University, Hamilton, ON, Canada
- 2Firestone Institute for Respiratory Health, St. Joseph’s Healthcare Hamilton, Hamilton, ON, Canada
- 3Imaging Research Centre, St. Joseph’s Healthcare Hamilton, Hamilton, ON, Canada
- 4Division of Thoracic Surgery, St. Joseph’s Healthcare Hamilton, Hamilton, ON, Canada
- 5Division of Thoracic Surgery, Department of Surgery, McMaster University, Hamilton, ON, Canada
- 6Department of Radiology, McMaster University, Hamilton, ON, Canada
- 7Department of Nuclear Medicine, St. Joseph’s Healthcare Hamilton, Hamilton, ON, Canada
- 8Department of Electrical and Computer Engineering, McMaster University, Hamilton, ON, Canada
Introduction: The ideal contrast agents for ventilation SPECT and MRI are Technegas and 129Xe gas, respectively. Despite increasing interest in the clinical utility of ventilation imaging, these modalities have not been directly compared. Therefore, our objective was to compare the ventilation defect percent (VDP) assessed by Technegas SPECT and hyperpolarized 129Xe MRI in patients scheduled to undergo lung cancer resection with and without pre-existing obstructive lung disease.
Methods: Forty-one adults scheduled to undergo lung cancer resection performed same-day Technegas SPECT, hyperpolarized 129Xe MRI, spirometry, and diffusing capacity of the lung for carbon monoxide (DLCO). Ventilation abnormalities were quantified as the VDP using two different methods: adaptive thresholding (VDPT) and k-means clustering (VDPK). Correlation and agreement between VDP quantified by Technegas SPECT and 129Xe MRI were determined by Spearman correlation and Bland-Altman analysis, respectively.
Results: VDP measured by Technegas SPECT and 129Xe MRI were correlated (VDPT: r = 0.48, p = 0.001; VDPK: r = 0.63, p < 0.0001). A 2.0% and 1.6% bias towards higher Technegas SPECT VDP was measured using the adaptive threshold method (VDPT: 23.0% ± 14.0% vs. 21.0% ± 5.2%, p = 0.81) and k-means method (VDPK: 9.4% ± 9.4% vs. 7.8% ± 10.0%, p = 0.02), respectively. For both modalities, higher VDP was correlated with lower FEV1/FVC (SPECT VDPT: r = −0.38, p = 0.01; MRI VDPK: r = −0.46, p = 0.002) and DLCO (SPECT VDPT: r = −0.61, p < 0.0001; MRI VDPK: r = −0.68, p < 0.0001). Subgroup analysis revealed that VDP measured by both modalities was significantly higher for participants with COPD (n = 13) than those with asthma (n = 6; SPECT VDPT: p = 0.007, MRI VDPK: p = 0.006) and those with no history of obstructive lung disease (n = 21; SPECT VDPT: p = 0.0003, MRI VDPK: p = 0.0003).
Discussion: The burden of ventilation defects quantified by Technegas SPECT and 129Xe MRI VDP was correlated and greater in participants with COPD when compared to those without. Our observations indicate that, despite substantial differences between the imaging modalities, quantitative assessment of ventilation defects by Technegas SPECT and 129Xe MRI is comparable.
1 Introduction
Pulmonary ventilation imaging modalities have been developed to provide a regional evaluation of airflow obstruction at high-resolution and thus ultimately improve the clinical management of a variety of lung diseases. Nuclear medicine (Jögi et al., 2011; Bajc et al., 2017; Farrow et al., 2017), magnetic resonance imaging (MRI) (Kruger et al., 2016; Ohno et al., 2022; Sharma et al., 2022) and computed tomography (CT) (Park et al., 2010; Kim et al., 2012) based methods have all demonstrated abnormal and heterogeneous ventilation in patients with obstructive lung diseases, including chronic obstructive pulmonary disease (COPD) and asthma. While the potential added value of ventilation imaging modalities over conventional global measures of lung function made by breathing tests is recognized, few are widely available or used in the routine management of obstructive lung disease.
The most clinically established and widely used ventilation imaging modality is single photon emission computed tomography (SPECT) using a range of ventilation agents including krypton-81 m gas (81mKr) and 99mTc-labelled aerosols (e.g., diethylene-triamine-pentaacetate [DTPA] and Technegas) (Roach et al., 2013; Bajc et al., 2019). Beyond its primary use in conjunction with perfusion SPECT for the diagnosis of pulmonary embolism, ventilation SPECT is rarely utilized for other indications such as pre-operative quantification of lung function (Genseke et al., 2018) and functional lung avoidance in radiation therapy planning (Munawar et al., 2010; Yuan et al., 2011). Alternatively, inhaled hyperpolarized gas MRI, using either helium-3 (3He) or xenon-129 (129Xe), has undergone extensive research and development for obstructive lung disease applications (Kirby et al., 2012; Svenningsen et al., 2013; Ebner et al., 2017; Shammi et al., 2022; Stewart et al., 2022). Compared to SPECT, hyperpolarized gas MRI offers higher spatial and temporal resolution without exposure to ionizing radiation. However, its availability is currently limited to specialized academic centers. Previous cross-modality investigations have demonstrated the comparability of 81mKr SPECT with 3He MRI in 23 patients with COPD and 9 healthy volunteers (Stavngaard et al., 2005), and 99mTc-DTPA SPECT with 129Xe MRI in 11 patients with COPD (Doganay et al., 2019; Kim et al., 2019). While these preliminary investigations report good comparability, they were limited by the small number of patients and disease populations evaluated. Most importantly, the current ideal contrast agents for ventilation SPECT and MRI are generally accepted to be Technegas (Bajc et al., 2019) and 129Xe gas (Niedbalski et al., 2021), respectively, and they have not been directly compared to each other.
With broadening interest in the clinical utility of ventilation imaging, and recent approval of 129Xe MRI and impending approval of Technegas SPECT by the U.S. Food and Drug Administration, a direct quantitative comparison of the modalities is needed. Therefore, the primary objective of this study was to compare the ventilation defect percent (VDP) assessed by Technegas SPECT and 129Xe MRI obtained the same day in a convenient sample of patients scheduled to undergo lung cancer resection with and without pre-existing obstructive lung disease. The secondary objective was to evaluate and compare the relationship of VDP assessed by both modalities with clinical history and standard lung function measures of obstructive lung diseases. To address these objectives, ventilation defects observed by Technegas SPECT and 129Xe MRI were quantified as the whole-lung VDP using two previously published segmentation methods: adaptive thresholding (VDPT), previously optimized for Technegas SPECT (Farrow et al., 2012); and, k-means clustering (VDPK), previously optimized for 129Xe MRI (Kirby et al., 2012).
2 Materials and methods
2.1 Participants and study design
This was a prospectively planned sub-study of patients scheduled to undergo first-time lung cancer resection at the division of Thoracic Surgery, McMaster University, Hamilton, Ontario as part of their clinical care who were enrolled into a single-center, prospective, 5-week observational study designed to evaluate the prevalence and clinical relevance of abnormal ventilation in lung cancer patients prior to lung resection. Eligible patients were greater than 18 years of age, first-time lung resection candidates in accordance with the British Thoracic Society guidelines (Callister et al., 2015), and they could not have had previous lung resection, previous chest radiation, or MRI contraindications. All participants provided written informed consent to an ethics-board approved (Hamilton Integrated Research Ethics Board #7770) and registered (ClinicalTrials.gov #NCT04191174) protocol. We report data acquired at a single pre-operative study visit, at which time baseline demographic data and clinical history were collected, and participants performed standard-of-care pulmonary function testing (spirometry and diffusing capacity of the lung for carbon monoxide (DLCO)), Technegas SPECT-CT and 129Xe MRI. Image session order was randomized.
2.2 Technegas SPECT-CT acquisition
Technegas (Cyclomedica Australia, Sydney) was prepared with a Technegas Generator (Cyclomedica Australia, Sydney) according to the manufacturer recommendations and a 40 MBq dose was administered to the participant in the supine position via inhalation. The participant was coached to inhale Technegas, starting at functional residual capacity, until 40 μSv/h was measured by a hand-held Geiger counter positioned over the chest. Technegas SPECT was then acquired while supine, during 15-min of tidal breathing using an Optima™ Nuclear Medicine (NM)/Computed Tomography (CT) 640 hybrid imaging system (GE Healthcare, Milwaukee, United States) and in accordance with The Canadian Association of Nuclear Medicine guidelines using the following acquisition parameters: LEHR collimator, energy window: 140 keV ± 20%, zoom factor of 1.0, 128 × 128 matrix and 4.42 mm isotropic voxels, step and shoot, 25 s/image, 60 images per acquisition (30 images per camera head), 360° rotation, 6° steps, body contour. A low dose non-contrast chest CT was subsequently acquired on the same NM/CT system during free breathing for attenuation correction and to allow for delineation of the thoracic cavity volume using the following acquisition and reconstruction parameters: 120 kVp, 20 mA, 1 s tube rotation time, 1.25 pitch, 512 × 512 matrix, 2.5 mm slice thickness, 2.5 mm slice spacing, standard reconstruction kernel, and 50 cm display field of view. Technegas SPECT reconstruction was performed using a Hermes Workstation (Hermes Medical Solutions, Stockholm, Sweden) with the following settings: OSEM reconstruction (2 iterations, 10 subsets), 3D Gaussian filter with 1.20 cm FWHM with corrections for attenuation, scatter, and collimator resolution recovery.
2.3 MRI acquisition
129Xe ventilation MRI and 1H MRI were acquired using a Discovery™ MR750 3T system (General Electric Healthcare; Milwaukee, United States) as previously described (Svenningsen et al., 2021). Participants were instructed to inhale 1 L of gas (N2 for 1H MRI and a hyperpolarized 129Xe/N2 mixture for 129Xe MRI) from functional residual capacity, and coronal slices were acquired under breath-hold conditions. Spin-exchange polarizer systems (Polarean 9800 or 9820, Polarean, Durham, United States) were used to polarize isotopically enriched 129Xe gas (86%; ∼600 mL) that was dispensed into a pre-filled mixing syringe (∼400 mL of N2) to achieve a fixed dose of 1 L that was transferred to a Tedlar bag (Jensen Inert Products, Coral Springs, United States) for participant delivery. 129Xe polarization was measured using a polarization measurement station (Polarean Inc., Durham, United States) and the dose-equivalent (DE) volume of 100% enriched, 100% polarized 129Xe was calculated as previously described (He et al., 2015). Following inhalation of the 1 L dose from functional residual capacity, hyperpolarized 129Xe static ventilation MRI was performed using a custom-built, unshielded quadrature-asymmetric bird-cage coil and a 3D fast gradient recalled echo sequence (acquisition time = 10 s, TE = 1.5 ms, TR = 5.1 ms, variable flip angle, initial flip angle = 1.3°, receive bandwidth = 16 kHz, field of view = 40 × 40 × 24 cm3, reconstructed matrix size = 128 × 128 × 16, voxel size = 3.125 × 3.125 × 15 mm3). A matching 1H MRI was performed using the whole-body radiofrequency coil and a fast-spoiled gradient echo sequence (acquisition time = 9 s, TE = 1.2 ms, TR = 4.3 ms, flip angle = 20°, FOV = 40 × 40 cm, matrix size = 128 × 128, 16 slices, voxel size = 3.125 × 3.125 × 15 mm3).
2.4 VDP quantification
Ventilation defects observed by Technegas SPECT and 129Xe MRI were quantified as the whole-lung VDP using two different segmentation methods: adaptive thresholding (VDPT) and k-means clustering (VDPK), which have been optimized and validated for Technegas SPECT (Farrow et al., 2012) and 129Xe MRI (Kirby et al., 2012), respectively. For the adaptive thresholding method (Farrow et al., 2012), voxels within the thoracic cavity were defined as “ventilation defect” if they were below a threshold determined as 0.5 x Mean5-80, where Mean5-80 is the mean intensity of all voxels in the thoracic cavity that fall between the 5th and 80th percentile of voxel intensities. The k-means method (Kirby et al., 2012) used an iterative algorithm to bin the voxel intensities into five clusters, with the lowest signal cluster being considered “ventilation defect.” For both segmentation methods, the whole-lung VDP was calculated as the volume of ventilation defects normalized to the thoracic cavity volume.
2.4.1 SPECT segmentation
The thoracic cavity was delineated by registering the CT to the Technegas SPECT and then segmenting the CT using semi-automated segmentation and registration software implemented on a HERMES workstation. Technegas SPECT ventilation segmentation using the threshold method was implemented on a HERMES workstation and the k-means method was implemented using the Image Processing Toolbox provided by MATLAB R2022b (The MathWorks Inc., Natick, MA, United States).
2.4.2 MRI segmentation
The thoracic cavity was delineated by registering the 1H MRI to the 129Xe MRI and then segmenting the 1H MRI using a previously described semi-automated pipeline implemented in MATLAB (Kirby et al., 2012). 129Xe MRI ventilation segmentation using the threshold method was implemented in MATLAB and the k-means method was performed using the previously described MATLAB pipeline (Kirby et al., 2012).
2.5 Statistical analysis
Data were tested for normality using the Shapiro-Wilk normality test and, when data were not normal, non-parametric tests were performed. Differences in demographic and clinical characteristics between participants with no history of lung disease, asthma, and COPD were determined using a one-way ANOVA with Tukey’s multiple comparisons test for parametric data or Kruskal Wallis with Dunn’s multiple comparisons test for non-parametric data. The correlation and agreement between VDP measured by Technegas SPECT and 129Xe MRI were evaluated by Spearman (ρ) correlation coefficients and Bland-Altman analysis, respectively. The relationship of VDP measured by Technegas SPECT and 129Xe MRI with age, pack-year smoking history, spirometry, and DLCO were evaluated by Pearson (r) or Spearman (ρ) correlation coefficients. Statistical analyses were performed using GraphPad Prism 8.0 (GraphPad Software, San Diego, CA, United States) and all results were considered significant when the probability of making a Type I error was less than 5% (p < 0.05).
3 Results
Forty-four patients scheduled for resection of lung cancer were enrolled, and 41 who completed same-day Technegas SPECT and 129Xe MRI were included in our analysis. Three of the enrolled participants were excluded from our analysis because 129Xe MRI was not performed; two participants had an MRI contraindication (brain aneurism clip), and one was unable to accommodate MRI scheduling. Of the 41 participants evaluated, 21 (51%) had no concomitant history of lung disease, while 6 (15%) had a history of asthma, 13 (32%) had COPD, and 1 (2%) had interstitial lung disease (ILD). Participant demographics, clinical characteristics, and primary tumor characteristics are summarized in Table 1. Participants with no history of lung disease, asthma, and COPD were well-balanced with respect to age (p = 0.41) and BMI (p = 0.08). Participants with COPD had a higher pack-year smoking history and lower DLCO%pred than participants with asthma (p = 0.01 and p = 0.0004) and those with no history of lung disease (p = 0.02 and p < 0.0001). FEV1%pred and FEV1/FVC were also lower for participants with COPD than those with no history of lung disease (p = 0.005 and p = 0.002).
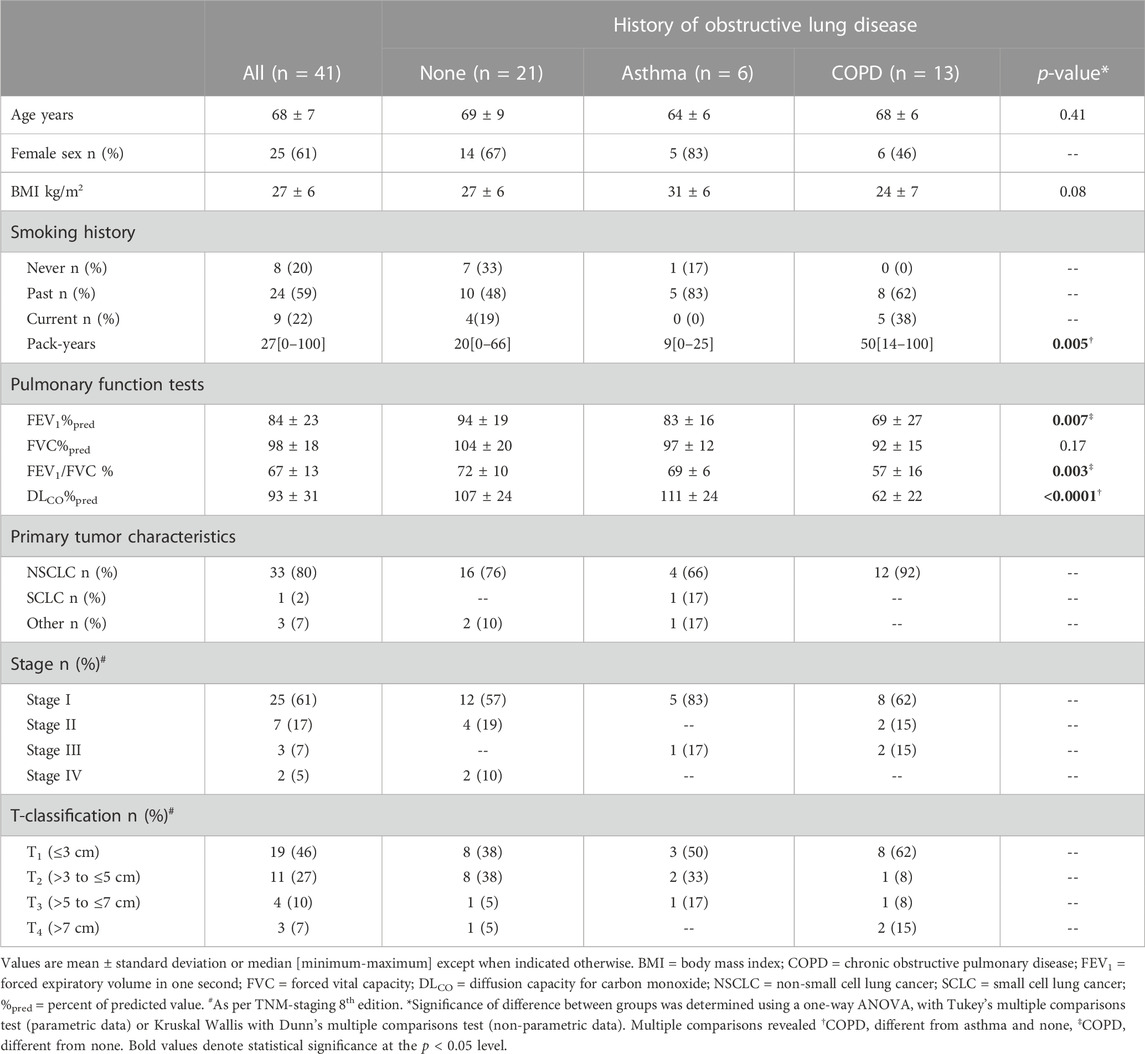
TABLE 1. Participant demographics and clinical characteristics.
Technegas SPECT and 129Xe MRI were well-tolerated by all participants, with no occurrence of adverse events. The scanning sessions were performed 90 ± 30 min apart [minimum of 12 min, maximum of 120 min]. Dosing and measurements of image quality are provided in the online supplement (Supplementary Table S1). Figure 1 shows coronal Technegas SPECT, 129Xe MRI, and corresponding structural 1H MRI slices for four representative participants. For participant A, a never-smoker with no history of lung disease, both modalities revealed relatively normal ventilation. For participant B, an ex-smoker with no history of lung disease, both modalities revealed peripheral ventilation defects despite normal lung function assessed by spirometry. For participants C and D, past smokers with COPD, large and spatially concordant ventilation defects were observed by both modalities. While most ventilation defects, such as those highlighted by yellow arrows, were spatially concordant across modalities, focal discordances were also observed, such as those highlighted by blue arrows for participants B and D.
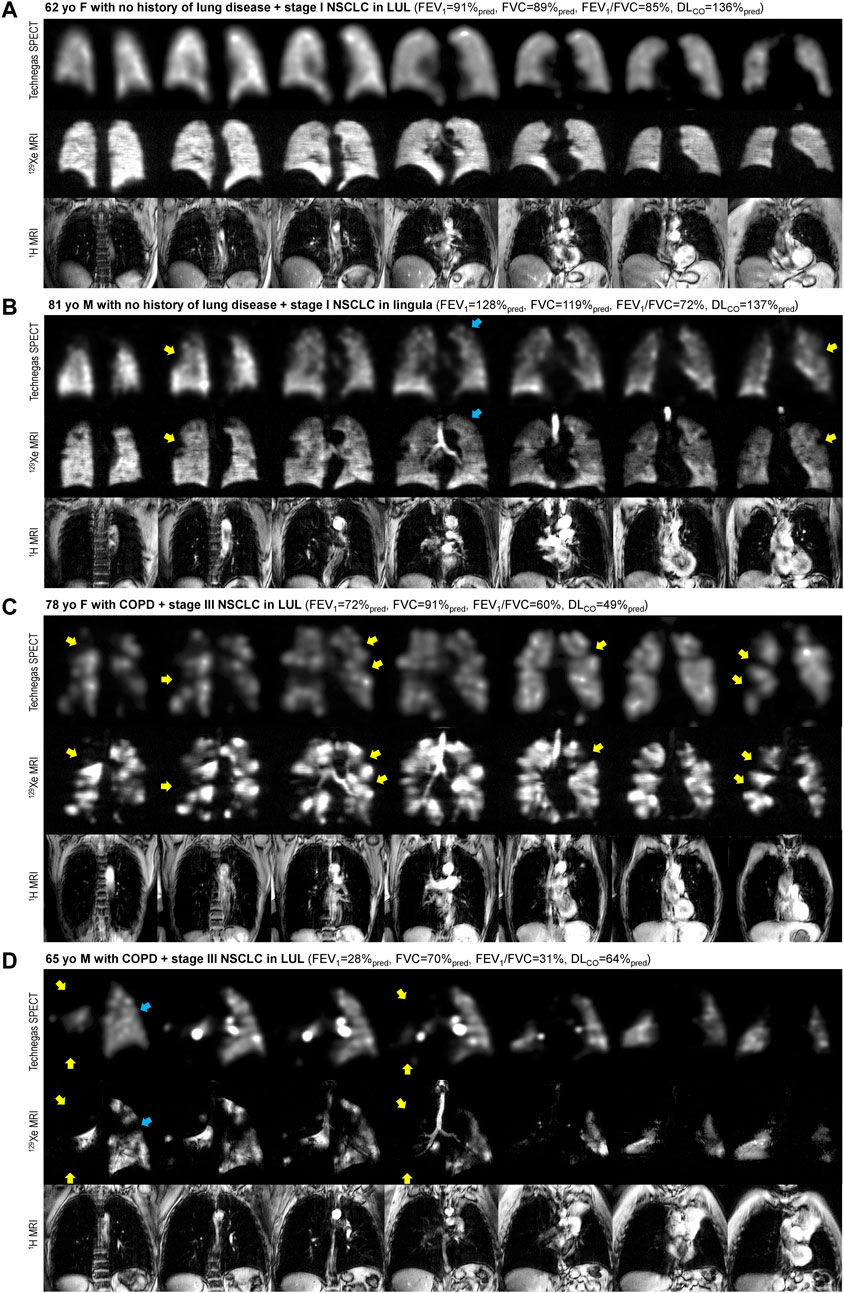
FIGURE 1. Comparison of ventilation visualized by Technegas SPECT and hyperpolarized 129Xe MRI. Anatomically matched coronal Technegas SPECT, 129Xe MRI, and 1H MRI slices for four representative participants. Select examples of spatially concordant and discordant ventilation defects are highlighted by yellow and blue arrows, respectively. (A) 62-year-old female with necrotizing granuloma in left upper lobe and no history of lung disease. Technegas SPECT: VDPT = 12%*, VDPK = 5%; 129Xe MRI: VDPT = 22%, VDPK = 1%*; FEV1 = 91%pred, FVC = 89%pred, FEV1/FVC = 85%, DLco = 136%pred. (B) 81-year-old male with stage I NSCLC in lingula and no history of lung disease. Technegas SPECT: VDPT = 28%*, VDPK = 14%; 129Xe MRI: VDPT = 18%, VDPK = 4%*; FEV1 = 128%pred, FVC = 119%pred, FEV1/FVC = 72%, DLCO = 137%pred. (C) 78-year-old female with stage III NSCLC in left upper lobe and concomitant COPD. Technegas SPECT: VDPT = 47%*, VDPK = 20%; 129Xe MRI: VDPT = 31%, VDPK = 19%*; FEV1 = 72%pred, FVC = 91%pred, FEV1/FVC = 60%, DLCO = 49%pred. (D) 65-year-old male with stage III NSCLC in left upper lobe and concomitant COPD. Technegas SPECT: VDPT = 84%*, VDPK = 52%; 129Xe MRI: VDPT = 37%, VDPK = 48%*; FEV1 = 28%pred, FVC = 70%pred, FEV1/FVC = 31%, DLCO = 64%pred. COPD = chronic obstructive pulmonary disease; FEV1 = forced expiratory volume in one second; FVC = forced vital capacity; DLCO = diffusing capacity for carbon monoxide; LUL = left upper lobe; NSCLC = non-small cell lung cancer; %pred = percent of predicted value. *Thresholding (VDPT) and k-means clustering (VDPK) methods previously optimized and validated for Technegas SPECT and 129Xe MRI, respectively.
The VDP for Technegas SPECT and 129Xe MRI were quantified using adaptive thresholding (VDPT) and k-means clustering (VDPK) methods. The VDP was higher when determined using the threshold method compared to the k-means method for both Technegas SPECT (VDPT = 23.0 ± 14.0% vs. VDPK = 9.4 ± 9.4%, p < 0.0001) and 129Xe MRI (VDPT = 21.0 ± 5.2% vs. VDPK = 7.8 ± 10.0%, p < 0.0001). Figure 2 summarizes the correlation and agreement of VDPT and VDPK measured by Technegas SPECT and 129Xe MRI. For both quantification methods, VDP measured by Technegas SPECT and 129Xe MRI were correlated (Figure 2A: VDPT, r = 0.48, p = 0.001; Figure 2C: VDPK, r = 0.63, p < 0.0001). Using the threshold method, Bland-Altman analysis (Figure 2B) indicated a 2.0% bias (95% limit of agreement: −23.4% to 19.4%) for higher VDPT measured by Technegas SPECT (Technegas SPECT VDPT = 23.0 ± 14.0% vs. 129Xe MRI VDPT = 21.0 ± 5.2%, p = 0.81). Using the k-means method, Bland-Altman analysis (Figure 2D) indicated a similar 1.6% bias (95% limit of agreement: −10.4% to 7.2%) for higher VDPK measured by Technegas SPECT (Technegas SPECT VDPK = 9.4 ± 9.4% vs. 129Xe MRI VDPK = 7.8 ± 10.0%, p = 0.02).
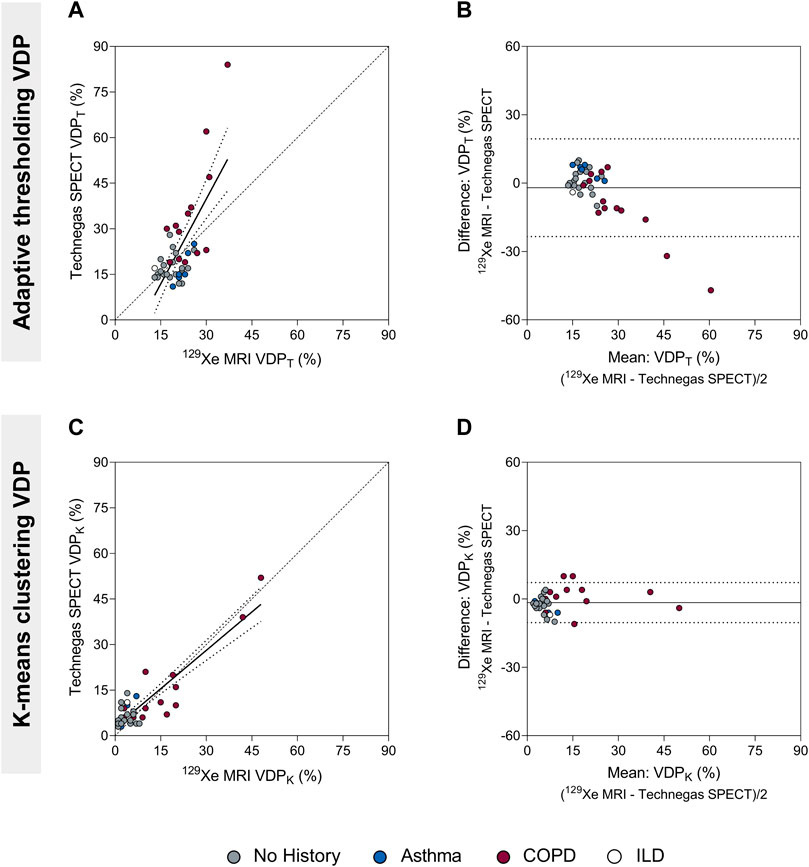
FIGURE 2. Comparison of the ventilation defect percent (adaptive thresholding (VDPT) and k-means clustering (VDPK)) quantified by Technegas SPECT and 129Xe MRI. (A) Positive relationship between Technegas SPECT and 129Xe MRI VDPT quantified using the adaptive threshold method (r = 0.48, r2 = 0.49, p = 0.001, y = 1.86x-16.11). (B) Bland-Altman plot of the difference between Technegas SPECT and 129Xe MRI VDPT quantified using the adaptive threshold method. Bias = −2.0% (95% limits of agreement, −23.4% to 19.4%). (C) Positive relationship between Technegas SPECT and 129Xe MRI VDPK quantified using the k-means clustering method (r = 0.63, r2 = 0.80, p < 0.0001, y = 0.84x+2.83). (D) Bland-Altman plot of the difference between Technegas SPECT and 129Xe MRI VDPK quantified using the k-means clustering method. Bias = −1.6% (95% limits of agreement, −10.4% to 7.2%). For correlation plots, the dashed line represents the line of identity (y = x) and the dotted lines represent the 95% confidence intervals of the linear regression line. For Bland-Altman plots, the solid line represents the mean of the paired differences, and the dotted lines represent the 95% limits of agreement. Colored data points represent history of lung disease (no history, n = 21; asthma, n = 6; COPD, n = 13; ILD: n = 1). *Thresholding (VDPT) and k-means clustering (VDPK) methods previously optimized and validated for Technegas SPECT and 129Xe MRI, respectively.
Univariate relationships of Technegas SPECT VDP and 129Xe MRI VDP with age, pack-year smoking history, spirometry and DLCO are summarized in Table 2. Using the threshold method, Technegas SPECT VDPT and 129Xe MRI VDPT were negatively correlated with DLCO%pred (r = −0.61, p < 0.0001; and r = −0.37, p = 0.02) and FEV1/FVC (r = −0.38, p = 0.01; and r = −0.43, p = 0.005). 129Xe MRI VDPT, but not Technegas SPECT VDPT, was correlated with FEV1%pred (r = −0.55, p = 0.0002). Using the k-means method, Technegas SPECT VDPK and 129Xe MRI VDPK were negatively correlated with DLCO%pred (r = −0.52, p = 0.0005; and r = −0.68, p < 0.0001). 129Xe MRI VDPK, but not Technegas SPECT VDPK, was correlated with pack-year smoking history (r = 0.56, p = 0.0002), FEV1%pred (r = −0.35, p = 0.03) and FEV1/FVC (r = −0.46, p = 0.002). For both modalities, VDPT and VDPK were not different for participants classified by tumor stage or tumor size (Supplementary Table S2). Additionally, for both modalities, VDPT and VDPK of the ipsilateral lung (lung with tumor) was not different than the VDPT and VDPK of the contralateral lung (lung without tumor) (Supplementary Figure S1).

TABLE 2. Univariate relationships of Technegas SPECT VDP and 129Xe MRI VDP with participant demographics and clinical characteristics.
Figure 3 summarizes VDP for 21 (51%) participants with no concomitant obstructive lung disease, 6 (15%) with a history of asthma, and 13 (32%) with COPD. The one (2%) participant with interstitial lung disease was excluded from this cross-sectional comparison. Using the threshold method (Figures 3A, B), Technegas SPECT VDPT and 129Xe MRI VDPT were significantly higher for participants with COPD than with those with no history of lung disease (p = 0.0003 and p = 0.0004). Technegas SPECT VDPT, but not 129Xe MRI VDPT, was significantly higher for participants with COPD than with those with asthma (p = 0.007 and p = 0.45). There was no difference in Technegas SPECT VDPT or 129Xe MRI VDPT between participants with asthma and those with no history of lung disease (p > 0.99 and p = 0.15). Using the k-means method (Figures 3C, D), Technegas SPECT VDPK and 129Xe MRI VDPK were significantly higher for participants with COPD than with those with asthma (p = 0.04 and p = 0.006) and no history of lung disease (p = 0.002 and p = 0.0003). There was no difference in Technegas SPECT VDPK or 129Xe MRI VDPK between participants with asthma and those with no history of lung disease (p > 0.99 and p > 0.99).
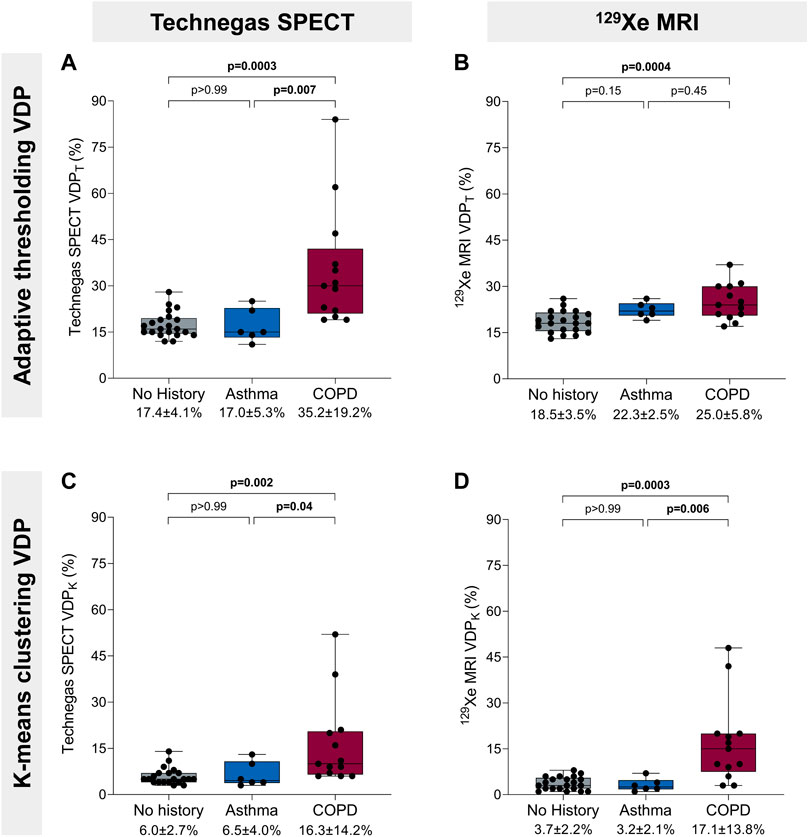
FIGURE 3. Ventilation defect percent and history of obstructive lung disease. (A) Technegas SPECT VDPT* was higher in participants with COPD than participants with asthma (35.2% ± 19.2% vs. 17.0 ± 5.3, p = 0.007) and those with no history of lung disease (35.2% ± 19.2% vs. 17.4 ± 4.1, p = 0.0003). (B) 129Xe MRI VDPT was higher for participants with COPD than those with no history of lung disease (25.0% ± 5.8% vs. 18.5% ± 3.5%, p = 0.0004). (C) Technegas SPECT VDPK was significantly higher for participants with COPD than those with asthma (16.3% ± 14.2% vs. 6.5% ± 4.0%, p = 0.04) and no history of lung disease (16.3% ± 14.2% vs. 6.0% ± 2.7%, p = 0.002). (D) 129Xe MRI VDPK* was higher in participants with COPD than participants with asthma (17.1% ± 13.8% vs. 3.2% ± 2.1%, p = 0.006) and those with no history of lung disease (17.1% ± 13.8% vs. 3.7% ± 2.2%, p = 0.0003). Box plots show minimum, first quartile, median, third quartile, and maximum VDP with individual values for all participants superimposed on the plot. Difference between groups was determined using one-way ANOVA with Tukey’s multiple comparisons test or Kruskal Wallis with Dunn’s multiple comparisons test. *Thresholding (VDPT) and k-means clustering (VDPK) methods previously optimized and validated for Technegas SPECT and 129Xe MRI, respectively.
4 Discussion
We prospectively compared ventilation defects assessed by same-day Technegas SPECT and 129Xe MRI in 41 patients scheduled to undergo first-time lung cancer resection, a subset of whom had concomitant asthma or COPD. We report that ventilation defects quantified by Technegas SPECT and 129Xe MRI VDP (determined using both adaptive thresholding and k-means clustering segmentation methods) were 1) correlated with one another, 2) similarly correlated with standard measures of airflow limitation (FEV1/FVC) and diffusing capacity (DLCO%pred), and 3) significantly higher for participants with COPD than those with asthma and no history of obstructive lung disease.
Many segmentation methods have been developed and optimized to quantify ventilation defects as the VDP, including linear binning, thresholding, and k-means clustering. In this study, VDP was determined for both Technegas SPECT and 129Xe MRI using adaptive thresholding and k-means segmentation methods. The basis for this decision was that the adaptive thresholding quantification method has been previously optimized and validated for Technegas SPECT by Farrow et al., (2012), and the k-means method for 129Xe MRI by Kirby et al., (2012). Using both segmentation approaches, we observed that the burden of ventilation defects quantified by Technegas SPECT and 129Xe MRI VDP acquired on the same day were correlated. While this is the first comparison of ventilation defects assessed by Technegas SPECT and 129Xe MRI, our observations are consistent with previous investigations demonstrating the comparability of ventilation assessed by SPECT and MRI when utilizing alternative ventilation agents. Stavngaard and colleagues previously reported a good correlation between 81mKr SPECT and 3He MRI for both visual and quantitative assessments of ventilation defect scores in a cohort of 23 COPD and 9 healthy participants (Stavngaard et al., 2005). In a smaller study of 11 COPD patients, Doganay et al. demonstrated a good correlation between 99mTc-DTPA SPECT and 129Xe MRI relative lobar percentage ventilation (Doganay et al., 2019). For ventilation SPECT, international guidelines now recommend Technegas as the preferred ventilation agent in patients with obstructive lung disease (Roach et al., 2013; Bajc et al., 2019) limiting the clinical relevance of previous comparisons that used 81mKr and 99mTc-DTPA. Additionally, for hyperpolarized gas ventilation MRI, 129Xe gas is now preferred over 3He gas due to its greater availability, lower cost, and higher solubility that permits dissolved-phase imaging (Niedbalski et al., 2021).
In most participants, visual assessment showed spatial agreement between focal ventilation defects observed by both modalities. However, as highlighted in Figure 1 by the blue arrows, some discordance was also observed. We also report a mean bias, 2.0% and 1.6%, towards higher VDP measured by Technegas SPECT than 129Xe MRI, which was observed using the adaptive threshold and k-means method, respectively. This inter-modality bias and lack of absolute agreement in ventilation defects were not unexpected and may be explained by several factors. First, fundamental differences in the physical properties of the ventilation agents may contribute to differences in lung distribution. Technegas is an ultrafine aerosolized particle (0.005–0.2 μm (Lemb et al., 1993)) whose distribution in the lungs, unlike that of 129Xe gas, is impacted by aerosol deposition mechanics. While Technegas behaves in a gas-like manner, permitting peripheral penetration and alveolar deposition (Bajc et al., 2019), it has been previously shown to aggregate at sites of severe obstruction leading to “hot-spots” (De Nijs et al., 2021). Shown in Figure 1D, we observed this effect in a 65-year-old male with severe COPD (FEV1 = 28%pred, FEV1/FVC = 31%). Bilateral hotspots are observed on Technegas SPECT in the left and right main bronchi. Greater ventilation is observed distal to the right main bronchi hotspot by 129Xe MRI than Technegas SPECT. Second, the different acquisition conditions and spatial resolutions between modalities must be considered. Technegas SPECT is acquired during 15 min of tidal breathing, while 129Xe MRI is acquired during a 10 s breath hold at functional residual capacity plus 1 L. As a result, respiratory and cardiac motion have greater influence on ventilation assessed by SPECT, contributing to blurring and fewer counts at the lung borders. Additionally, lung inflation during imaging affects ventilation defects, with increased ventilation defects observed at lower levels of lung inflation (Hughes et al., 2019). As SPECT is on average acquired at a lower lung inflation (average over tidal volume) than 129Xe MRI (functional residual capacity plus 1 L), higher VDP is expected. Taken together, the aforementioned factors likely account for the higher VDP quantified by Technegas SPECT and the spatial discordances in focal ventilation defects that were observed upon visual inspection.
It is important to emphasize that this study did not intend to determine the optimal quantification approach for each modality, rather to determine if there was correlation and some equivalency between the two modalities using established quantification practices for each modality that are implemented in the literature. There are reasons why each modality may best be served by different segmentation methods, which is beyond the scope of this article. However, we do note that for both modalities, the adaptive threshold method resulted in significantly higher VDPs compared to the k-means clustering method, irrespective of history of obstructive lung disease. In the subgroup of patients with no history of lung disease, the majority of whom had well-ventilated lungs by visual inspection, the VDPs determined using the k-means method were much closer to zero than the threshold method (Technegas SPECT: VDPK = 6.0% vs. VDPT = 17.4%; 129Xe MRI: VDPK = 3.7% vs. VDPT = 18.5%), which better reflects what the images show (e.g., Figure 1A). We also noticed that when the VDP was determined using the threshold method (but not the k-means method), the bias towards higher Technegas SPECT VDPT increased with VDPT, or greater airflow limitation (Figure 2C). This bias seems to be driven largely by a subset of patients with COPD in whom the Technegas SPECT VDPT was considerably higher than the 129Xe MRI VDPT. Taken together, investigation of these cases reveals that the adaptive threshold classifies hypo-ventilated (or low ventilated) voxels as defect, leading to a significantly higher VDPT, which can be misleading when interpreted in absolute terms. This effect, in combination with severe obstruction leading to “hot-spots,” likely explains the exceptionally high Technegas SPECT VDPT reported for two patients with COPD (62% and 84%).
Ventilation defect burden quantified by Technegas SPECT VDPT and 129Xe MRI VDPK (VDPs determined using modality-specific approach) were similarly correlated to standard measures of airflow limitation (FEV1/FVC) and diffusing capacity (DLCO). For both modalities, the correlation with DLCO was stronger than with FEV1/FVC. One explanation for this may be that DLCO is a direct measurement of the capacity of communicating lung volume to transfer gas from inhaled air to the bloodstream, whereas FEV1/FVC is an indirect composite marker of the presence of airway obstruction with forced exhalation. Interestingly, 129Xe MRI VDPK but not SPECT VDPT, was correlated with pack-year smoking history and FEV1. The reason for this discrepancy is unclear. Consistent with these relationships, we also observed greater ventilation defect burden quantified by both modalities in participants with COPD compared to those with asthma and no history of obstructive disease. However, VDP assessed by both modalities was not higher in patients who reported a history of asthma compared to those without any known history of obstructive disease. This result may be considered unexpected as abnormal ventilation is a characteristic feature of asthma. We do note that the VDPs in our cohort of asthmatics are similar to what has been previously reported by others, using 129Xe MRI VDPK (Eddy et al., 2022) and Technegas SPECT VDPT (Farrow et al., 2012; Farrow et al., 2017), respectively. When interpreting this result, it should be considered that most of our cohort of patients without any known history of obstructive lung disease were current smokers (4 of 21, 19%) or past smokers (10 of 21, 48%), 36% of whom had an FEV1/FVC less than 0.70 and 7% had a DLCO less than 80%pred. As demonstrated by participant B in Figure 1, such patients may have subclinical or undiagnosed airways disease contributing to ventilation defects and increased VDP.
There are limitations to our study that should be considered. First, we evaluated a convenient sample of patients scheduled for lung cancer resection, in whom tumor burden may have influenced segmentation of the thoracic cavity and VDP quantification. However, in our cohort, tumor size was not associated with whole-lung VDP, and ipsilateral and contralateral VDP were not different (data provided online, Supplementary Figure S1; Table S2). These observations indicate that tumor burden did not significantly contribute to VDP assessed by either modality, which is not surprising given the small tumor sizes in our cohort (≤3 cm in 46%, >3 to ≤5 cm in 27%, >5 to ≤7 cm in 10%, and >7 cm in 7% of participants). Second, we did not quantitatively evaluate the spatial agreement of ventilation defects observed by Technegas SPECT and 129Xe MRI. Such analysis is highly dependent on accurate registration and anatomical alignment of Technegas SPECT and 129Xe MRI datasets, which was challenging due to differences in voxel size, acquisition conditions (tidal breathing vs. breath hold) and lung volume. Finally, our quantitative analysis distilled regional and voxel-wise measurements of ventilation down to a single whole-lung value, in this case the VDP. VDP is a binary whole-lung measurement that fails to characterize much of the information offered by ventilation imaging modalities. Furthermore, as our analysis demonstrates, different segmentation schemes yield different VDPs in the same individual.
In summary, using the current ideal contrast agents for ventilation SPECT and MRI, we imaged patients with and without obstructive lung disease prior to lung cancer resection to quantify and compare ventilation defects observed by both modalities. We report that the burden of ventilation defects quantified by Technegas SPECT and 129Xe MRI are correlated and increased in participants with COPD. Our observations indicate that, despite substantial differences between the imaging modalities, assessment of ventilation defects using established quantification practices for Technegas SPECT and 129Xe MRI are comparable, provided the same quantification approach is used. Future work is required to determine if superior and comparable improvements in patient outcomes are achieved by integrating ventilation assessment with Technegas SPECT and 129Xe MRI into the clinical management of lung diseases and potential improvement in outcomes post-resection. For now, based on our findings, the selection of ventilation imaging modality can be guided by local availability and regulatory approval, contraindications, and concern of radiation burden.
Data availability statement
Data sharing requests will be considered from researchers that submit a proposal and an appropriate statistical analysis and dissemination plan. Data would be shared via a secure data access system by request to the corresponding author.
Ethics statement
The studies involving human participants were reviewed and approved by Hamilton Integrated Research Ethics Board. The patients/participants provided their written informed consent to participate in this study. Written informed consent was obtained from the individual(s) for the publication of any potentially identifiable images or data included in this article.
Author contributions
SS, YS, and PN were responsible for study conception and study design. YS, EP, CF, JA, and PN were responsible for identifying and characterizing the patients, and for clinical interpretation of the data. NR, MJ, and CH were responsible for recruiting study participants. CM, TF, and MD were responsible for ventilation SPECT-CT acquisition and/or interpretation. NBK and MDN were responsible for MRI acquisition and/or interpretation. NR, YF, and SS were responsible for data acquisition, analysis, and interpretation, and for preparing the first draft of the manuscript. All authors edited and reviewed the manuscript and approved the final version of the manuscript.
Funding
This was an investigator-initiated study funded by Cyclomedica Australia Pty Ltd. and The Lung Association. The funders had no role in the design of the study, the collection and analysis of the data, or the preparation of the manuscript.
Acknowledgments
The authors thank J. Lecomte, C. Awde, S. Weir, and S. Faseruk, the MRI technologists who performed the 129Xe MRI, and L. Speziale, MJ, K. Fraser, and S. Fitzgerald, the nuclear medicine technologists who performed Technegas SPECT. We also thank C. Farrow for supporting the implementation of the adaptive threshold approach to quantify Technegas SPECT VDP at our center.
Conflict of interest
The authors declare that this was an investigator-initiated study that received funding from Cyclomedica Australia Pty Ltd. and The Lung Association. The funder was not involved in the study design, collection, analysis, interpretation of data, the writing of this article, or the decision to submit it for publication. SS reports a relationship with Polarean that includes: Speaking and lecture fees.
The remaining authors declare that the research was conducted in the absence of any commercial or financial relationships that could be construed as a potential conflict of interest.
Publisher’s note
All claims expressed in this article are solely those of the authors and do not necessarily represent those of their affiliated organizations, or those of the publisher, the editors and the reviewers. Any product that may be evaluated in this article, or claim that may be made by its manufacturer, is not guaranteed or endorsed by the publisher.
Supplementary material
The Supplementary Material for this article can be found online at: https://www.frontiersin.org/articles/10.3389/fphys.2023.1133334/full#supplementary-material
References
Bajc, M., Chen, Y., Wang, J., Li, X. Y., Shen, W. M., Wang, C. Z., et al. (2017). Identifying the heterogeneity of COPD by V/P SPECT: A new tool for improving the diagnosis of parenchymal defects and grading the severity of small airways disease. Int. J. chronic Obstr. Pulm. Dis. 12, 1579–1587. doi:10.2147/COPD.S131847
Bajc, M., Schümichen, C., Grüning, T., Lindqvist, A., Le Roux, P.-Y., Alatri, A., et al. (2019). EANM guideline for ventilation/perfusion single-photon emission computed tomography (SPECT) for diagnosis of pulmonary embolism and beyond. Eur. J. Nucl. Med. Mol. Imaging 46 (12), 2429–2451. doi:10.1007/s00259-019-04450-0
Callister, M. E. J., Baldwin, D. R., Akram, A. R., Barnard, S., Cane, P., Draffan, J., et al. (2015). British thoracic society guidelines for the investigation and management of pulmonary nodules: Accredited by NICE. Thorax 70 (2), 1–54. doi:10.1136/thoraxjnl-2015-207168
De Nijs, R., Sijtsema, N. D., Kruis, M. F., Jensen, C. V., Iversen, M., Perch, M., et al. (2021). Comparison of 81mKrypton and 99mTc-Technegas for ventilation single-photon emission computed tomography in severe chronic obstructive pulmonary disease. Nucl. Med. Commun. 42 (2), 160–168. doi:10.1097/MNM.0000000000001314
Doganay, O., Matin, T., Chen, M., Kim, M., McIntyre, A., McGowan, D. R., et al. (2019). Time-series hyperpolarized xenon-129 MRI of lobar lung ventilation of COPD in comparison to V/Q-SPECT/CT and CT. Eur. Radiol. 29 (8), 4058–4067. doi:10.1007/S00330-018-5888-Y
Ebner, L., He, M., Virgincar, R. S., Heacock, T., Kaushik, S. S., Freemann, M. S., et al. (2017). Hyperpolarized 129Xenon magnetic resonance imaging to quantify regional ventilation differences in mild to moderate asthma: A prospective comparison between semiautomated ventilation defect percentage calculation and pulmonary function tests. Investig. Radiol. 52 (2), 120–127. doi:10.1097/rli.0000000000000322
Eddy, R. L., McIntosh, M. J., Matheson, A. M., McCormack, D. G., Licskai, C., and Parraga, G. (2022). Pulmonary MRI and cluster analysis help identify novel asthma phenotypes. J. Magnetic Reson. Imaging 56 (5), 1475–1486. doi:10.1002/jmri.28152
Farrow, C. E., Salome, C. M., Harris, B. E., Bailey, D. L., Bailey, E., Berend, N., et al. (2012). Airway closure on imaging relates to airway hyperresponsiveness and peripheral airway disease in asthma. J. Appl. Physiology 113 (6), 958–966. doi:10.1152/japplphysiol.01618.2011
Farrow, C. E., Salome, C. M., Harris, B. E., Bailey, D. L., Berend, N., and King, G. G. (2017). Peripheral ventilation heterogeneity determines the extent of bronchoconstriction in asthma. J. Appl. Physiology 123 (5), 1188–1194. doi:10.1152/JAPPLPHYSIOL.00640.2016
Genseke, P., Wetz, C., Wallbaum, T., Kreissl, M. C., Ghazzawi, S., Schreiber, J., et al. (2018). Pre-operative quantification of pulmonary function using hybrid-SPECT/low-dose-CT: A pilot study. Lung Cancer 118, 155–160. doi:10.1016/j.lungcan.2018.02.010
He, M., Robertson, S. H., Kaushik, S. S., Freeman, M. S., Virgincar, R. S., Davies, J., et al. (2015). Dose and pulse sequence considerations for hyperpolarized (129)Xe ventilation MRI. Magn. Reson Imaging 33 (7), 877–885. doi:10.1016/j.mri.2015.04.005
Hughes, P. J. C., Smith, L., Chan, H. F., Tahir, B. A., Norquay, G., Collier, G. J., et al. (2019). Assessment of the influence of lung inflation state on the quantitative parameters derived from hyperpolarized gas lung ventilation MRI in healthy volunteers. J. Appl. Physiol. 126 (1), 183–192. doi:10.1152/japplphysiol.00464.2018
Jögi, J., Ekberg, M., Jonson, B., Bozovic, G., and Bajc, M. (2011). Ventilation/perfusion SPECT in chronic obstructive pulmonary disease: An evaluation by reference to symptoms, spirometric lung function and emphysema, as assessed with HRCT. Eur. J. Nucl. Med. Mol. Imaging 38 (7), 1344–1352. doi:10.1007/s00259-011-1757-5
Kim, M., Doganay, O., Matin, T., Povey, T., and Gleeson, F. (2019). Comparison of the thoracic CT-based computational model with hyperpolarized Xenon-129 MRI and SPECT images to assess pulmonary ventilation in COPD patients. Eur. Respir. J. 54 (63), OA1931. doi:10.1183/13993003.CONGRESS-2019.OA1931
Kim, W. W., Lee, C. H., Goo, J. M., Park, S. J., Kim, J. H., Park, E. A., et al. (2012). Xenon-enhanced dual-energy CT of patients with asthma: Dynamic ventilation changes after methacholine and salbutamol inhalation. AJR Am. J. Roentgenol. 199 (5), 975–981. doi:10.2214/AJR.11.7624
Kirby, M., Svenningsen, S., Owrangi, A., Wheatley, A., Farag, A., Ouriadov, A., et al. (2012). Hyperpolarized 3He and 129Xe MR imaging in healthy volunteers and patients with chronic obstructive pulmonary disease. Radiology 265 (2), 600–610. doi:10.1148/radiol.12120485
Kruger, S. J., Nagle, S. K., Couch, M. J., Ohno, Y., Albert, M., and Fain, S. B. (2016). Functional imaging of the lungs with gas agents. J. Magn. Reson Imaging 43 (2), 295–315. doi:10.1002/jmri.25002
Lemb, M., Oei, T. H., Eifert, H., and Gunther, B. (1993). Technegas: A study of particle structure, size and distribution. Eur. J. Nucl. Med. 20 (7), 576–579. doi:10.1007/BF00176550
Munawar, I., Yaremko, B. P., Craig, J., Oliver, M., Gaede, S., Rodrigues, G., et al. (2010). Intensity modulated radiotherapy of non-small-cell lung cancer incorporating SPECT ventilation imaging. Med. Phys. 37 (4), 1863–1872. doi:10.1118/1.3358128
Niedbalski, P. J., Hall, C. S., Castro, M., Eddy, R. L., Rayment, J. H., Svenningsen, S., et al. (2021). Protocols for multi-site trials using hyperpolarized 129Xe MRI for imaging of ventilation, alveolar-airspace size, and gas exchange: A position paper from the 129Xe MRI clinical trial. Magnetic Reson. Med. 86 (6), 2966–2986. doi:10.1002/mrm.28985
Ohno, Y., Hanamatsu, S., Obama, Y., Ueda, T., Ikeda, H., Hattori, H., et al. (2022). Overview of MRI for pulmonary functional imaging. Br. J. Radiol. 95 (1132), 20201053. doi:10.1259/bjr.20201053
Park, E. A., Goo, J. M., Park, S. J., Lee, H. J., Lee, C. H., Park, C. M., et al. (2010). Chronic obstructive pulmonary disease: Quantitative and visual ventilation pattern analysis at xenon ventilation CT performed by using a dual-energy technique. Radiology 256 (3), 985–997. doi:10.1148/radiol.10091502
Roach, P. J., Schembri, G. P., and Bailey, D. L. (2013). V/Q scanning using SPECT and SPECT/CT. J. Nucl. Med. 54 (9), 1588–1596. doi:10.2967/jnumed.113.124602
Shammi, U. A., D'Alessandro, M. F., Altes, T., Hersman, F. W., Ruset, I. C., Mugler, J., et al. (2022). Comparison of hyperpolarized (3)He and (129)Xe MR imaging in cystic fibrosis patients. Acad. Radiol. 29 (2), S82–S90. doi:10.1016/j.acra.2021.01.007
Sharma, M., Wyszkiewicz, P. V., Desaigoudar, V., Guo, F., Capaldi, D. P., and Parraga, G. (2022). Quantification of pulmonary functional MRI: State-of-the-art and emerging image processing methods and measurements. Phys. Med. Biol. 67 (22), 22TR01. doi:10.1088/1361-6560/ac9510
Stavngaard, T., Søgaard, L. V., Mortensen, J., Hanson, L. G., Schmiedeskamp, J., Berthelsen, A. K., et al. (2005). Hyperpolarized 3He MRI and 81mKr SPECT in chronic obstructive pulmonary disease. Eur. J. Nucl. Med. Mol. Imaging 32 (4), 448–457. doi:10.1007/S00259-004-1691-X
Stewart, N. J., Smith, L. J., Chan, H. F., Eaden, J. A., Rajaram, S., Swift, A. J., et al. (2022). Lung MRI with hyperpolarised gases: Current & future clinical perspectives. Br. J. Radiol. 95 (1132), 20210207. doi:10.1259/bjr.20210207
Svenningsen, S., Kirby, M., Starr, D., Leary, D., Wheatley, A., Maksym, G. N., et al. (2013). Hyperpolarized 3He and 129Xe MRI: Differences in asthma before bronchodilation. J. Magnetic Reson. Imaging 38 (6), 1521–1530. doi:10.1002/jmri.24111
Svenningsen, S., McIntosh, M., Ouriadov, A., Matheson, A. M., Konyer, N. B., Eddy, R. L., et al. (2021). Reproducibility of hyperpolarized 129Xe MRI ventilation defect percent in severe asthma to evaluate clinical trial feasibility. Acad. Radiol. 28 (6), 817–826. doi:10.1016/j.acra.2020.04.025
Yuan, S., Frey, K. A., Gross, M. D., Hayman, J. A., Arenberg, D., Curtis, J. L., et al. (2011). Semiquantification and classification of local pulmonary function by V/Q single photon emission computed tomography in patients with non-small cell lung cancer: Potential indication for radiotherapy planning. J. Thorac. Oncol. 6 (1), 71–78. doi:10.1097/jto.0b013e3181f77b40
Keywords: ventilation imaging, Technegas SPECT, hyperpolarized xenon-129, MRI, airflow obstruction, ventilation defects, functional lung imaging
Citation: Radadia N, Friedlander Y, Priel E, Konyer NB, Huang C, Jamal M, Farncombe T, Marriott C, Finley C, Agzarian J, Dolovich M, Noseworthy MD, Nair P, Shargall Y and Svenningsen S (2023) Comparison of ventilation defects quantified by Technegas SPECT and hyperpolarized 129Xe MRI. Front. Physiol. 14:1133334. doi: 10.3389/fphys.2023.1133334
Received: 28 December 2022; Accepted: 03 April 2023;
Published: 28 April 2023.
Edited by:
Sam Bayat, Université Grenoble Alpes, FranceReviewed by:
Helen Marshall, The University of Sheffield, United KingdomG. Kim Prisk, University of California, San Diego, United States
Copyright © 2023 Radadia, Friedlander, Priel, Konyer, Huang, Jamal, Farncombe, Marriott, Finley, Agzarian, Dolovich, Noseworthy, Nair, Shargall and Svenningsen. This is an open-access article distributed under the terms of the Creative Commons Attribution License (CC BY). The use, distribution or reproduction in other forums is permitted, provided the original author(s) and the copyright owner(s) are credited and that the original publication in this journal is cited, in accordance with accepted academic practice. No use, distribution or reproduction is permitted which does not comply with these terms.
*Correspondence: Sarah Svenningsen, c3Zlbm5pbnNAbWNtYXN0ZXIuY2E=