
94% of researchers rate our articles as excellent or good
Learn more about the work of our research integrity team to safeguard the quality of each article we publish.
Find out more
ORIGINAL RESEARCH article
Front. Physiol., 15 February 2023
Sec. Computational Physiology and Medicine
Volume 14 - 2023 | https://doi.org/10.3389/fphys.2023.1126780
This article is part of the Research TopicCognitive Computation and Deep Learning of Human Physiological SystemsView all 9 articles
 Yuhang Pan1†Junru Liu1†Yuting Cai1†Xuemei Yang1Zhucheng Zhang1Hong Long1
 Ketong Zhao1Xia Yu1Cui Zeng2,3Jueni Duan1Ping Xiao4Jingbo Li1Feiyue Cai1,2*Xiaoyun Yang5*
 Zhen Tan1,2*
Purpose: We aim to present effective and computer aided diagnostics in the field of ophthalmology and improve eye health. This study aims to create an automated deep learning based system for categorizing fundus images into three classes: normal, macular degeneration and tessellated fundus for the timely recognition and treatment of diabetic retinopathy and other diseases.
Methods: A total of 1,032 fundus images were collected from 516 patients using fundus camera from Health Management Center, Shenzhen University General Hospital Shenzhen University, Shenzhen 518055, Guangdong, China. Then, Inception V3 and ResNet-50 deep learning models are used to classify fundus images into three classes, Normal, Macular degeneration and tessellated fundus for the timely recognition and treatment of fundus diseases.
Results: The experimental results show that the effect of model recognition is the best when the Adam is used as optimizer method, the number of iterations is 150, and 0.00 as the learning rate. According to our proposed approach we, achieved the highest accuracy of 93.81% and 91.76% by using ResNet-50 and Inception V3 after fine-tuned and adjusted hyper parameters according to our classification problem.
Conclusion: Our research provides a reference to the clinical diagnosis or screening for diabetic retinopathy and other eye diseases. Our suggested computer aided diagnostics framework will prevent incorrect diagnoses caused by the low image quality and individual experience, and other factors. In future implementations, the ophthalmologists can implement more advanced learning algorithms to improve the accuracy of diagnosis.
The fundus is the posterior part of the eye, which includes the retina, choroid, photoreceptor cells, as well as the blood vessels and the optic nerve. Fundus diseases can affect any of these structures, leading to a range of symptoms including vision loss, blind spots, and difficulty seeing in low light. These diseases can be caused by a variety of factors, including genetics, aging, and chronic health conditions like diabetes. Macular degeneration is a medical condition that affects the macula, which is the part of the eye responsible for central vision and this condition can cause a loss of central vision. Some of the known risk factors for this condition include age, smoking, obesity, and a history of high blood pressure. On the other hand, a tessellated fundus is a term used to describe the appearance of the retina at the back of the eye when viewed through an ophthalmoscope. It is characterized by a mosaic-like pattern of light and dark areas, which is caused by the different layers and structures of the retina being visible through the ophthalmoscope. When viewed through an ophthalmoscope, the different layers of the retina, including the photoreceptor cells, the blood vessels, and the nerve fibers, can all be seen, creating the characteristic tessellated pattern. Figure 1 illustrates the process of collecting data from fundus camera.
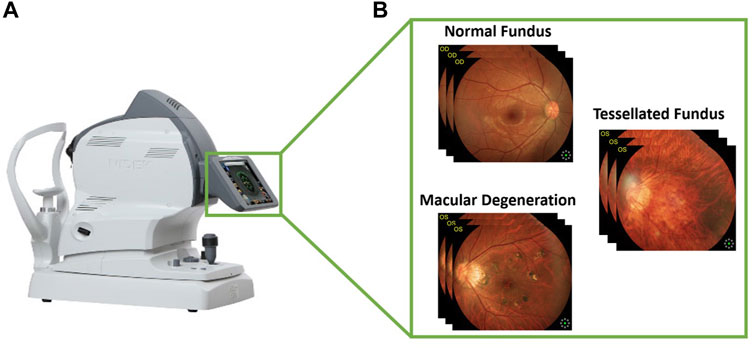
FIGURE 1. Visual representation of collecting images from fundus camera. (A) Fundus camera and (B) the fundus images according to three classes.
Fundus images are typically taken using specialized equipment, such as an ophthalmoscope or a fundus camera. These images can provide important information about the health of the eye and can be used by doctors to diagnose and monitor eye diseases. Healthcare provider will review the images carefully, looking for any abnormalities or signs of disease. They may also compare the images to a reference image or to images taken at an earlier time, to track any changes in the condition of the eye. This means that not all healthcare providers have the necessary training and experience to accurately diagnose eye diseases using fundus images. In addition, fundus images can be affected by factors such as the position of the eye, the lighting conditions, and the quality of the imaging equipment, which can affect their accuracy and reliability. Even trained ophthalmologists do not grade retinal images consistently, with significant variability in sensitivity for detecting retinal diseases (Burlina et al., 2017a). These limitations highlight the importance of computer-aided framework to classify fundus images into different disease diagnosed. Deep learning technology has recently used in various application of life including image classification (Bukhari et al., 2022), text analytics (Hussain et al., 2022; Wahid et al., 2022), crisis management (Sahar et al., 2022) and in medical imaging (Wong et al., 2021).
Deep learning algorithms can automate expert-level diagnostic tasks in ophthalmology, such as the diagnosis of glaucoma (Liu et al., 2018), age-related macular degeneration (Burlina et al., 2017b), and diabetic retinopathy (Gargeya and Leng, 2017; Ting et al., 2017) utilizing retinal fundus pictures. The authors of (Tan et al., 2017) used a single framework to autonomously segment exudates, micro aneurysms, and hemorrhages using a 10 layer convolutional neural network (CNN). Combining handcrafted (Annunziata and Trucco, 2016) data taken from the green channel of the normalized and equalized image, deep learning feature vectors were built using four convolutional layers and one fully connected layer from CNN (trained using LeNet architecture). Using EyePACS, the authors of (Lam et al., 2018) were able to identify the presence of five different kinds of red lesions, including normal, micro aneurysms, hemorrhages, exudates, and retinal neovascularization.
The authors of (Liskowski and Krawiec, 2016) proposed a deep learning based blood vessel segmentation framework of retinal fundus images datasets around the same time that (Maji et al., 2015) used a hybrid of random forest and deep neural network (DNN) for blood vessel segmentation. Their experimental results outperformed many existing approaches. In order to predict the severity of age-related macular degeneration, the study (Taibouni et al., 2021) suggested a classification architecture based on deep learning (AMD). An ensemble of various convolutional neural networks were employed in this study to classify AMD into 13 different categories (Ying et al., 2009). The paper (Govindaiah et al., 2018) described an expanded examination of (Burlina et al., 2017a) using a deeper VGG-16 architectural modification. Images were scaled to a standard reference level and the macula was selected as a Region of Interest. For comparison with the VGG-16, a 50 layer Keras implementation of residual neural network was used.
To increase and strengthen the diagnostic capability, a computer-aided autonomous framework is required to divide Fundus images into three categories. Recently, deep learning technology has dominated contemporary science and technology, permeating a number of medical research fields (Gargeya and Leng, 2017). Deep learning technology has the potential to completely utilize enormous amounts of data, automatically understand the features in the data, support physicians in diagnosis accurately and quickly, and improve medical efficiency. For the purpose of early detection and treatment, our research applied a deep learning framework based on transfer learning to fundus images and divided them into three classes: normal, macular degeneration, and tessellated fundus. We used pre-trained models from ResNet-50 and Inception V3, tweaked them, and changed hyper parameters in accordance with our classification issue. The proposed framework to address the mentioned research gap is shown in Figure 2.
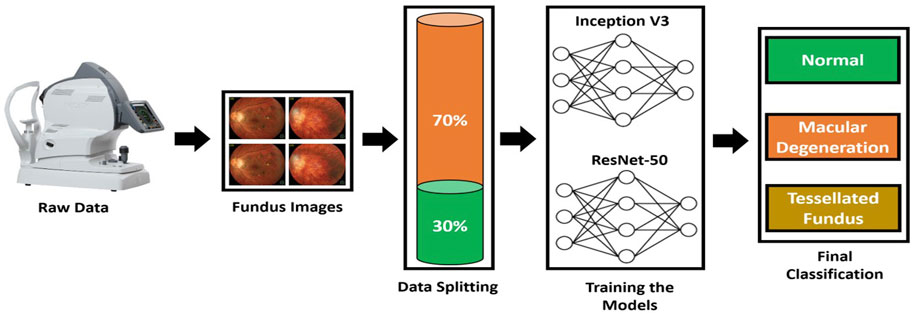
FIGURE 2. Proposed Framework to classify fundus images. A domain specific image is collected from fundus camera; then, data is split to train and test set. Inception V3 and VGG-16 are trained according to the dataset to classify fundus images.
Fundus cameras are specialized medical devices that are used to take images of the retina, which is the light-sensitive tissue at the back of the eye. These cameras use a combination of lenses and light sources to capture detailed images of the retina (Gargeya and Leng, 2017). The resulting image will be a detailed, high-resolution of the retina, which the doctor can then use to diagnose and treat any eye conditions that the patient may have. In this study, a total of 1,032 fundus images were collected from 516 patients using fundus camera from Health Management Center, Shenzhen University General Hospital Shenzhen University, Shenzhen 518055, Guangdong, China. The sample dataset is shown in Figure 3.
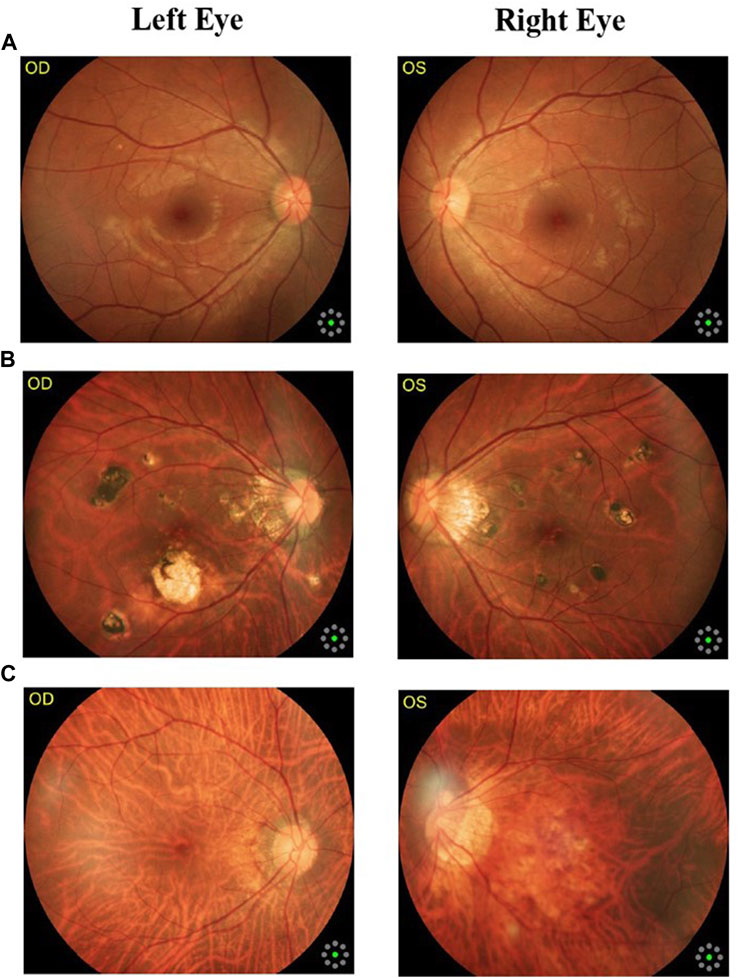
FIGURE 3. Samples of fundus images in various stages. (A) normal, (B) macular degeneration and (C) tessellated fundus.
Moreover, we also described the statistics of our dataset in the table form collected from 516 patients as shown in Table 1. Finally we split our dataset in the training and testing set with ratio of 70% and 30%, respectively.

TABLE 1. Statistics of our dataset in each class.
Inception-v3 is a 48-layer deep pre-trained convolutional neural network model, as shown in Eq. 1 and it is able to learn and recognize complex patterns and features in medical images. One of the key features of Inception V3 is its ability to scale to large datasets and to handle images of varying sizes and resolutions. This is important in the field of medical imaging, where images can vary greatly in terms of size, resolution, and quality. Typically, the Inception module includes one maximum pooling and three convolutions of various sizes (Ting et al., 2017). After the convolution operation, the channel is aggregated for the network output of the preceding layer, and the non-linear fusion is then carried out. In this model, over-fitting can be avoided while enhancing the network’s expression and flexibility to various scales.
To avoid overfitting, we flattened the output layer and reduced its dimensions to one. We then added a sigmoid layer for classification, as well as a fully connected layer with 1,024 hidden units, a Relu activation function as shown in Eq. 2, and a dropout with the rate of 0.4. The weights of the classification layers were initialized using the algorithm described in (Beauxis-Aussalet and Hardman, 2014) as shown in Eq. 3. This approach allowed us to effectively use Inception V3 for our purposes.
Where e U (−a, b) is a uniform distribution in the interval [−a, b], m is the size of the previous layer, and Wk stands for weight parameters in the CNN at iteration k. The complete model architecture and hyper parameter details are shown in Table 2.
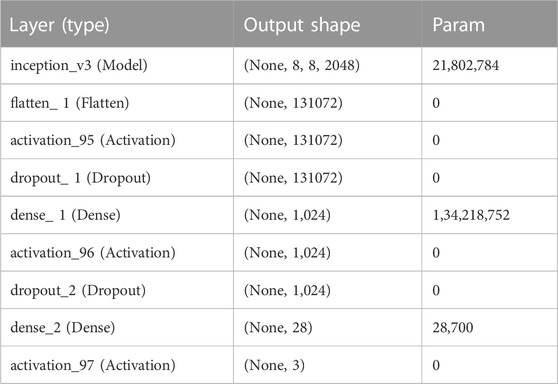
TABLE 2. Hyper Parameters details used in the Inception V3 model according to our dataset.
ResNet-50 is a convolutional neural network with 50 layers that focuses on learning residuals as opposed to features (Litjens et al., 2017). This architecture introduces the idea of the Residual Network to address the issue of the vanishing/exploding gradient. We therefore learn a residual function H(x) rather than simply approximating the underlying mapping that we desire, H(x). As shown in Figure 4, this is accomplished by making the output of a stack of layers be y = F(x) + x, where F(x) is the output of the layers and the initial input x is added element by element.
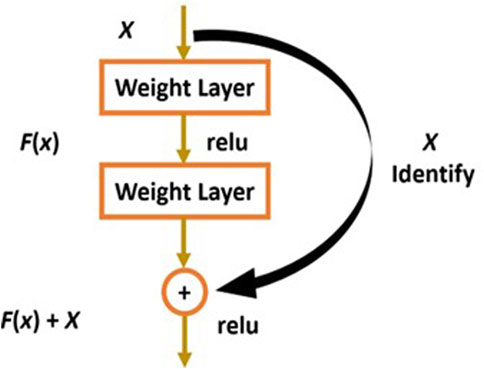
FIGURE 4. Residual blocks of ResNet Network.
Therefore, if our underlying mapping is still y = H(x) that we want to learn, then F(x) = H(x)−x so that y = F(x)+x = H(x)−x + x = H(x). The idea of learning identity mappings is now easier, since we just need to set all weights to 0, so that H(x) = 0 and F(x) = −x, so y = x is learned (Burlina et al., 2017b). Then comes the activation function, f() and we get the output as H(x) as shown in Eqs 4, 5 respectively.
The complete model architecture and hyper parameter details are shown in Table 3, which consist of different layers including, convolutional, max pooling, flatten, dense, and dropout layer which mainly helpful to avoid the over-fitting of our model.
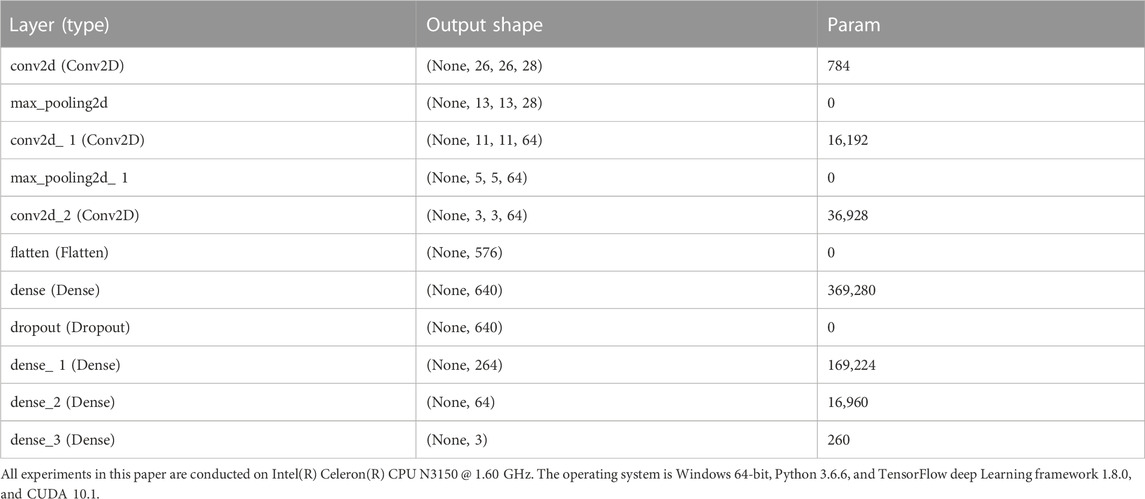
TABLE 3. Hyper Parameters details used in ResNet-50 model according to our dataset.
Evaluating the performance of a deep learning model is crucial in order to determine its ability to make accurate predictions on unseen data. By assessing the model’s performance, we can identify any potential limitations or issues and take steps to improve its accuracy. We assessed our model’s performance using accuracy and loss graphs as described in Eqs 6, 7 respectively.
The total number of correctly detected positive instances is known as true positive (TP). True negative (TN), false positive (FP), and false negative (FN) are the percentages of false positive and false negative occurrences with ground truth, respectively, that are correctly classified as positive and negative cases (cases without stenosis) (Davis et al., 2009).
Where y is the input patch’s ground truth label, calculating the gradient of the function L for the network weights W minimizes the loss function during the model training process.
In addition, we assessed the performance of our model using a confusion matrix. The columns of the matrix indicate forecasts of class instances, while the rows of the matrix show actual class instances. The fact that this matrix can determine whether the machine has mixed up two classes is whence its name originates (Liu et al., 2014). Following is a list of rates for a binary classifier that are frequently determined using a confusion matrix (Guan et al., 2019):
Recall is a measure of a model’s ability to correctly identify all relevant instances from a dataset as shown in Eq. 8.
In Eq. 9, the mathematical expression for precision is displayed, and it is indicated that it is a measure of a model’s ability to correctly identify only relevant instances from a dataset.
In this research work, we used pre-trained deep learning models to improve the diagnosis and early treatment of various fundus diseases. The Inception V3 and ResNet-50 deep learning models are used to classify fundus images into three classes, Normal, Macular degeneration and tessellated fundus for the timely recognition and treatment of fundus diseases. After fine-tuning and adjusting hyper parameters in accordance with our classification problem, we used ResNet-50 and Inception V3 to reach the greatest accuracy of 93.81% and 91.76%, respectively, utilizing our proposed method. Figure 5 accuracy and loss graph was used to evaluate how well our models performed. In Figures 5A, B show the accuracy and loss graphs for classifying fundus images into three categories: normal, macular degeneration, and tessellated fundus using ResNet-50 and Inception V3, respectively.
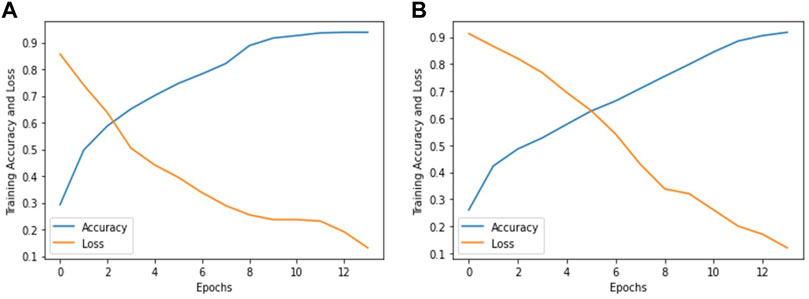
FIGURE 5. Accuracy and loss graph according to our dataset. (A) represents the accuracy and loss graph using ResNet-50 and (B) represents the accuracy and loss graph using Inception V3.
In the context of image classification, a confusion matrix can provide insight into which classes are being accurately predicted by the algorithm and which are not, as well as highlight any potential issues with the classifier. In the Figure 6A represents the confusion matrix using ResNet-50 and Figure 6B represents the confusion matrix using Inception V3 to classify fundus images into three classes: normal, macular degeneration and tessellated fundus.
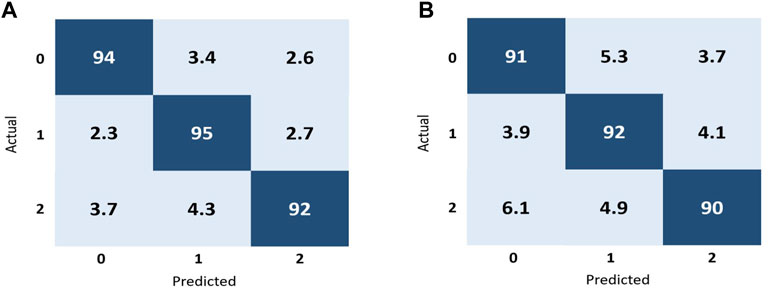
FIGURE 6. Performance representation of our trained models using confusion matrix. (A) represents the performance of ResNet-50 and (B) represents the performance of Inception V3 according to our dataset.
As shown in Figure 6A, for the class 0, 94% of the data correctly classified in this class known as true positive (TP), in that case in false negative (FN) is equal to 6, while the false positive(FP) for that class is also six and the value for true negative for the class 0 is 194. Moreover for the better interpretation of the performance of our proposed models and evaluation metric for each individual fundus disease, we calculated accuracy, precision, recall and f-measure for each individual classes by using both models. We randomly selected one image from each class and perform validation on both models, the validation results are shown in Tables 4, 5. Tables 4, 5 represent the performance metrics for each individual classes of fundus diseases using ResNet-50 and Inception V3, respectively.
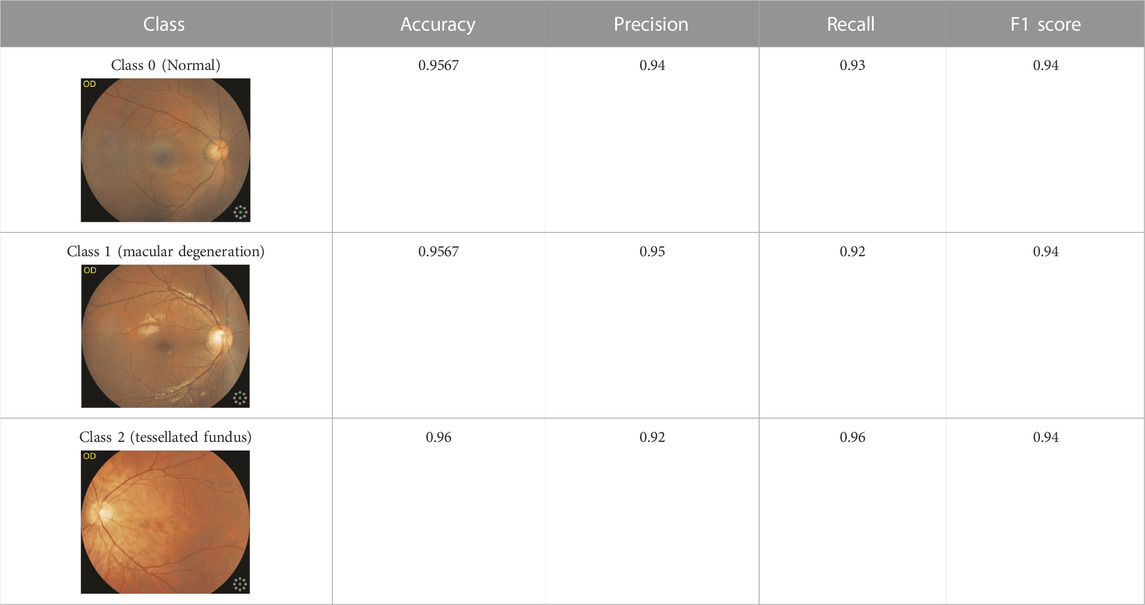
TABLE 4. Performance evaluation for each class using.

TABLE 5. Performance evaluation for each class using.
The fundus is the posterior part of the eye, which includes the retina, choroid, photoreceptor cells, as well as the blood vessels and the optic nerve. Fundus diseases can be caused by a variety of factors, including genetics, aging, and chronic health conditions like diabetes. Macular degeneration is a medical condition that affects the macula, which is the part of the eye responsible for central vision and this condition can cause a loss of central vision. A tessellated fundus is a term used to describe the appearance of the retina at the back of the eye when viewed through an ophthalmoscope. The most common cause of visual impairment is cataract, which caused 55.0% blindness and 50.2% low vision. Fundus lesions were second, causing 22.9% (blindness) and 23.8% (low vision), whereas glaucoma was rare, causing only 9.6% (blindness) and 1.7% (low vision) (Liu et al., 2018). . In addition, fundus images can be affected by factors such as the position of the eye, the lighting conditions, and the quality of the imaging equipment, which can affect their accuracy and reliability. Even skilled ophthalmologists do not consistently evaluate retinal images, and the sensitivity for identifying retinal disorders varies widely (Burlina et al., 2017a). These drawbacks emphasize the value of using a computer-aided framework to categorize fundus images according to various diseases. A total of 1,032 fundus photos from 516 patients were gathered for this study utilizing a fundus camera at the Health Management Center of Shenzhen University General Hospital in Shenzhen, Guangdong, China. We fine-tuned and adjust the hyper parameters of Inception V3 and ResNet-50 according to our dataset as shown in Tables 4, 5 respectively. According to our proposed approach we, achieved the highest accuracy of 93.81% and 91.76% by using ResNet-50 and Inception V3 as shown in Figure 5. Finally to perform the validation of our models, we randomly selected one image from each class and perform validation on both models, the validation results are shown in Tables 4, 5. Tables 4, 5 represent the performance metrics for each individual classes of fundus diseases using ResNet-50 and Inception V3, respectively. Moreover, we also compared the performance of our proposed models with prior studies in this domain as shown in Table 6.
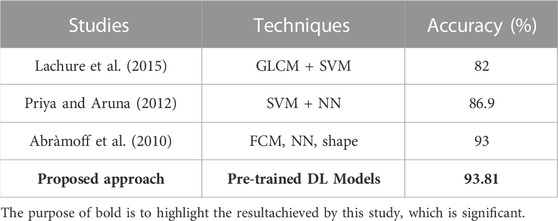
TABLE 6. Comparative accuracy of our proposed model with previous studies.
Our suggested framework for computer-aided diagnosis will stop inaccurate diagnoses brought on by poor image quality, individual differences in expertise, and other reasons. To increase the accuracy of the diagnosis, ophthalmologists can use more sophisticated learning algorithms in the future.
Deep learning requires a large amount of data to improve performance and avoid over-fitting. It is difficult to acquire medical imaging data of low-incidence serious diseases in general practice. Due to differences in patients and the appearance of the prostate, future work will focus on testing the model with a more extensive data set. In future implementations, the ophthalmologists can implement more advanced learning algorithms to improve the accuracy of diagnosis. In the future, we could be able to better localize the lesions by developing a unique object detection model and enhancing the CNN512’s performance classification by including more layers. The system may perform better after being tested and tuned with datasets that are more evenly distributed.
This study concluded that ResNet-50 and Inception V3 methods for fundus disease classification into three classes are the most promising and successful. The first class normal fundus image, second is Macular degeneration and third is tessellated fundus. According to our proposed approach we, achieved the highest accuracy of 93.81% and 91.76% by using ResNet-50 and Inception V3, respectively. Our research provides a reference to the clinical diagnosis or screening for diabetic retinopathy and other eye diseases. Our suggested computer aided diagnostics framework will prevent incorrect diagnoses caused by the low image quality and individual experience, and other factors.
The original contributions presented in the study are included in the article/Supplementary Material, further inquiries can be directed to the corresponding authors.
Written informed consent was obtained from the individual(s) for the publication of any potentially identifiable images or data included in this article.
All authors listed have made a substantial, direct, and intellectual contribution to the work and approved it for publication.
This work is granted by the following: Shenzhen Nanshan District Health Science and Technology Project grant number is NS2202145, Shenzhen Natural Science Fund (the Stable Support Plan Program, No. 20200826225552001), and Natural Science Foundation of Shenzhen University General Hospital, grant number is SUGH2020QD015.
CZ, FC, and ZT were employed by General Practice Alliance.
The remaining authors declare that the research was conducted in the absence of any commercial or financial relationships that could be construed as a potential conflict of interest.
All claims expressed in this article are solely those of the authors and do not necessarily represent those of their affiliated organizations, or those of the publisher, the editors and the reviewers. Any product that may be evaluated in this article, or claim that may be made by its manufacturer, is not guaranteed or endorsed by the publisher.
Abràmoff M. D., Reinhardt J. M., Russell S. R., Folk J. C., Mahajan V. B., Niemeijer M., et al. (2010). Automated early detection of diabetic retinopathy. Ophthalmology 117 (6), 1147–1154. doi:10.1016/j.ophtha.2010.03.046
Annunziata R., Trucco E. J. I. t. o. m. i. (2016). Accelerating convolutional sparse coding for curvilinear structures segmentation by refining SCIRD-TS filter banks. IEEE Trans. Med. Imaging 35 (11), 2381–2392. doi:10.1109/TMI.2016.2570123
Beauxis-Aussalet E., Hardman L. (2014). “Simplifying the visualization of confusion matrix,” in 26th Benelux Conference on Artificial Intelligence, Belgium, November 2014 (Nijmegen, Netherlands: BNAIC).
Bukhari N., Hussain S., Ayoub M., Yu Y., Khan A. (2022). Deep learning based framework for emotion recognition using facial expression. PakJET. 5 (3), 51–57. doi:10.51846/vol5iss3pp51-57
Burlina P. M., Joshi N., Pekala M., Pacheco K. D., Freund D. E., Bressler N. M. (2017). Automated grading of age-related macular degeneration from color fundus images using deep convolutional neural networks. JAMA Ophthalmol. 135 (11), 1170–1176. doi:10.1001/jamaophthalmol.2017.3782
Burlina P., Pacheco K. D., Joshi N., Freund D. E., Bressler N. M. (2017). Comparing humans and deep learning performance for grading AMD: A study in using universal deep features and transfer learning for automated AMD analysis. Comput. Biol. Med. 82, 80–86. doi:10.1016/j.compbiomed.2017.01.018
Davis H., Russell S., Barriga E., Abramoff M., Soliz P. (2009). “Vision-based, realtime retinal image quality assessment,” in 2009 22nd IEEE International Symposium on Computer-Based Medical Systems. (IEEE), 1–6.
Gargeya R., Leng T. J. O. (2017). Automated identification of diabetic retinopathy using deep learning. Ophthalmology 124 (7), 962–969. doi:10.1016/j.ophtha.2017.02.008
Govindaiah A., Hussain M. A., Smith R. T., Bhuiyan A. (2018). “Deep convolutional neural network based screening and assessment of age-related macular degeneration from fundus images,” in 2018 IEEE 15th International symposium on biomedical imaging (ISBI 2018). (IEEE), 1525–1528.
Guan Q., Wan X., Lu H., Ping B., Li D., Wang L., et al. (2019). Deep convolutional neural network inception-v3 model for differential diagnosing of lymph node in cytological images: A pilot study. Ann. Transl. Med. 7 (14), 307. doi:10.21037/atm.2019.06.29
Hussain S., Ayoub Muhammad, Khan Akmal, Yang Yu, Ghulam Jilani, et al. (2022). Aspect2Labels: A novelistic decision support system for higher educational institutions by using multi-layer topic modelling approach. Expert Syst. Appl. 209, 118119. doi:10.1016/j.eswa.2022.118119
Lachure J., Deorankar A. V., Lachure S., Gupta S., Jadhav R. (2015). Diabetic retinopathy using morphological operations and machine learning, in 2015 IEEE international advance computing conference (IACC). (IEEE), 617–622.
Lam C., Yu C., Huang L., Rubin D. (2018). Retinal lesion detection with deep learning using image patches. Invest. Ophthalmol. Vis. Sci, 59 (1), 590–596. doi:10.1167/iovs.17-22721
Liskowski P., Krawiec K. J. I. t. o. m. i. (2016). Segmenting retinal blood vessels with deep neural networks. IEEE Trans. Med. Imaging 35 (11), 2369–2380. doi:10.1109/TMI.2016.2546227
Litjens G., Babak ThijsKooi, Bejnordi Ehteshami, Arindra Arnaud, Setio Adiyoso, Ciompi Francesco, et al. (2017), A survey on deep learning in medical image analysis. Medical Image Analysis. 42: p. 60–88.doi:10.1016/j.media.2017.07.005
Liu G., Wu J., Huang W., Wu W., Zhang H., Wong K. K. L., et al. (2014). Numerical simulation of flow in curved coronary arteries with progressive amounts of stenosis using fluid-structure interaction modelling. J. Med. Imaging Health Inf. 4 (4), 605–611. doi:10.1166/jmihi.2014.1301
Liu S., Graham S. L., Schulz A., Kalloniatis M., Zangerl B., Cai W., et al. (2018). A deep learning-based algorithm identifies glaucomatous discs using monoscopic fundus photographs. Ophthalmol. Glaucoma 1 (1), 15–22. doi:10.1016/j.ogla.2018.04.002
Maji D., Santara A., Ghosh S., Sheet D., Mitra P. (2015). “Deep neural network and random forest hybrid architecture for learning to detect retinal vessels in fundus images,” in 37th annual international conference of the IEEE Engineering inMedicine and Biology Society (EMBC). (IEEE), 3029–3032.
Priya R., Aruna P. J. I. J. o. C. A. (2012). SVM and neural network based diagnosis of diabetic retinopathy. Int. J. Comput. Appl. 41 (1), 6–12. doi:10.5120/5503-7503
Sahar A., Ayoub M., Hussain S., Yu Y., Khan A. (2022). Transfer learning-based framework for sentiment classification of cosmetics products reviews. Prod. Rev. 5 (3), 38–43. doi:10.51846/vol5iss3pp38-43
Taibouni K., Miere A., Samake A., Souied E., Petit E., Chenoune Y. (2021). Choroidal neovascularization screening on OCT-angiography choriocapillaris images by convolutional neural networks. Convolutional Neural Netw. 11 (19), 9313. doi:10.3390/app11199313
Tan J. H., Rao Krishna, Bhandary Sulatha V., Sivaprasad Sobha, Fujita Hamido, et al. (2017). Automated segmentation of exudates, haemorrhages, microaneurysms using single convolutional neural network. Inf. Sci. 420, 66–76. doi:10.1016/j.ins.2017.08.050
Ting D. S. W., Cheung C. Y. L., Lim G., Tan G. S. W., Quang N. D., Gan A., et al. (2017). Development and validation of a deep learning system for diabetic retinopathy and related eye diseases using retinal images from multiethnic populations with diabetes. JAMA 318 (22), 2211–2223. doi:10.1001/jama.2017.18152
Wahid J. A., Shi L., Gao Y., Yang B., Wei L., Tao Y., et al. (2022). Topic2Labels: A framework to annotate and classify the social media data through lda topics and deep learning models for crisis response. Expert Syst. Appl. 195, 116562. doi:10.1016/j.eswa.2022.116562
Wong K. K., Cummock J. S., He Y., Ghosh R., Volpi J. J., Wong S. T. C. (2021). Retrospective study of deep learning to reduce noise in non-contrast head CT images. Comput. Med. Imaging Graph. 94, 101996. doi:10.1016/j.compmedimag.2021.101996
Ying G.-s., Maguire M. G., Alexander J., Martin R. W., Antoszyk A. N.Complications of Age-related Macular Degeneration Prevention Trial Research Group (2009). Description of the age-related eye disease study 9-step severity scale applied to participants in the complications of age-related macular degeneration prevention trial. Arch. Ophthalmol. 127 (9), 1147–1151. doi:10.1001/archophthalmol.2009.189
Keywords: computer-aided diagnosis, fundus camera, ophthalmology, image classification, Inception V3, Resnet-50
Citation: Pan Y, Liu J, Cai Y, Yang X, Zhang Z, Long H, Zhao K, Yu X, Zeng C, Duan J, Xiao P, Li J, Cai F, Yang X and Tan Z (2023) Fundus image classification using Inception V3 and ResNet-50 for the early diagnostics of fundus diseases. Front. Physiol. 14:1126780. doi: 10.3389/fphys.2023.1126780
Received: 18 December 2022; Accepted: 27 January 2023;
Published: 15 February 2023.
Edited by:
Kelvin Kian Loong Wong, University of Saskatchewan, CanadaReviewed by:
Weiwei Yu, Northwestern Polytechnical University, ChinaCopyright © 2023 Pan, Liu, Cai, Yang, Zhang, Long, Zhao, Yu, Zeng, Duan, Xiao, Li, Cai, Yang and Tan. This is an open-access article distributed under the terms of the Creative Commons Attribution License (CC BY). The use, distribution or reproduction in other forums is permitted, provided the original author(s) and the copyright owner(s) are credited and that the original publication in this journal is cited, in accordance with accepted academic practice. No use, distribution or reproduction is permitted which does not comply with these terms.
*Correspondence: Feiyue Cai, NTI5NDMwNDkwQHFxLmNvbQ==; Xiaoyun Yang, ODc2MDA5NDhAcXEuY29t; Zhen Tan, dGFuemhlbkBzenUuZWR1LmNu
†These authors have contributed equally to this work
Disclaimer: All claims expressed in this article are solely those of the authors and do not necessarily represent those of their affiliated organizations, or those of the publisher, the editors and the reviewers. Any product that may be evaluated in this article or claim that may be made by its manufacturer is not guaranteed or endorsed by the publisher.
Research integrity at Frontiers
Learn more about the work of our research integrity team to safeguard the quality of each article we publish.