 Andre Bazzone
 Rocco Zerlotti
 Maria Barthmes1
 Niels Fertig
- 1Nanion Technologies GmbH, Munich, Germany
- 2Department of Structural Biology, Faculty of Biology and Pre-Clinics, Institute of Biochemistry, Genetics and Microbiology, University of Regensburg, Regensburg, Germany
Beside the ongoing efforts to determine structural information, detailed functional studies on transporters are essential to entirely understand the underlying transport mechanisms. We recently found that solid supported membrane-based electrophysiology (SSME) enables the measurement of both sugar binding and transport in the Na+/sugar cotransporter SGLT1 (Bazzone et al, 2022a). Here, we continued with a detailed kinetic characterization of SGLT1 using SSME, determining KM and KDapp for different sugars, kobs values for sugar-induced conformational transitions and the effects of Na+, Li+, H+ and Cl− on sugar binding and transport. We found that the sugar-induced pre-steady-state (PSS) charge translocation varies with the bound ion (Na+, Li+, H+ or Cl−), but not with the sugar species, indicating that the conformational state upon sugar binding depends on the ion. Rate constants for the sugar-induced conformational transitions upon binding to the Na+-bound carrier range from 208 s−1 for D-glucose to 95 s−1 for 3-OMG. In the absence of Na+, rate constants are decreased, but all sugars bind to the empty carrier. From the steady-state transport current, we found a sequence for sugar specificity (Vmax/KM): D-glucose > MDG > D-galactose > 3-OMG > D-xylose. While KM differs 160-fold across tested substrates and plays a major role in substrate specificity, Vmax only varies by a factor of 1.9. Interestingly, D-glucose has the lowest Vmax across all tested substrates, indicating a rate limiting step in the sugar translocation pathway following the fast sugar-induced electrogenic conformational transition. SGLT1 specificity for D-glucose is achieved by optimizing two ratios: the sugar affinity of the empty carrier for D-glucose is similarly low as for all tested sugars (KD,Kapp = 210 mM). Affinity for D-glucose increases 14-fold (KD,Naapp = 15 mM) in the presence of sodium as a result of cooperativity. Apparent affinity for D-glucose during transport increases 8-fold (KM = 1.9 mM) compared to KD,Naapp due to optimized kinetics. In contrast, KM and KDapp values for 3-OMG and D-xylose are of similar magnitude. Based on our findings we propose an 11-state kinetic model, introducing a random binding order and intermediate states corresponding to the electrogenic transitions detected via SSME upon substrate binding.
1 Introduction
The sodium glucose cotransporter SGLT1 represents an extensively studied model transporter within the Solute Sodium Symporter (SSS) family. The SSS family belongs to the Amino Acid-Polyamine-Organocation (APC) superfamily of transporters which is the second largest superfamily of secondary active transporters. Transporters of the SSS family facilitate the transport of diverse solutes against their concentration gradients via coupling to an electrochemical sodium gradient. SGLT1 adopts the inverted repeat fold of the LeuT structural family (Lolkema and Slotboom, 2008) and is widely expressed in the small intestine and the distal segment of the proximal tubule, where it plays an important role in the adsorption of glucose (Ghezzi et al., 2018). Due to its central role in energy metabolism, SGLTs have been described as potential targets for the treatment of diabetes mellitus and cancer (Tsujihara et al., 1996; Koepsell, 2017).
Secondary active transport is often enabled by an alternating access mechanism (Mitchell, 1957; Jardetzky, 1966). For transporters with the characteristic LeuT fold, a rocking bundle mechanism was proposed (Forrest et al., 2008; Weyand et al., 2008; Forrest and Rudnick, 2009; Kazmier et al., 2017). It considers a rocking motion of concerted helices to be sufficient to allow alternating access to the respective ligand binding site from the extracellular and the intracellular environment. Related theories sought to explain the coupled solute transport with an internal symmetry of the protein (Karpowich and Wang, 2008; Drew and Boudker, 2016). While the rocking bundle mechanism can explain the primary conformational change in SGLT1, it does not distinguish between the binding and release of the driving ions and the substrate, which is mandatory to accurately capture the structural framework of the transport cycle. A kinetic model for SGLT1 includes the opening and closure of an intracellular and an extracellular gate (Sala-Rabanal et al., 2012; Ghezzi et al., 2018), also visible in the recently solved SGLT1 structure (Han et al., 2022). These smaller conformational changes allow for selective ligand binding, which causes subsequent major structural changes.
A commonly proposed molecular transport mechanism starts with sodium binding to an extracellular side of SGLT1 (Parent et al., 1992b; Wright et al., 2011). This triggers the opening of the extracellular gate allowing for subsequent sugar binding which then causes the closure of the extracellular gate and the rocking bundle movement to the inward facing transporter conformation. This is followed by the opening of the intracellular gate and subsequent sodium and sugar release. Since Na+/sugar symport transfers a net charge across the plasma membrane, it allows for electrophysiological measurements on SGLT1. Previously performed voltage clamp measurements revealed details about its steady-state kinetics. Voltage steps also revealed pre-steady-state (PSS) currents, which have been attributed to the relocation of the empty carrier from inward to outward facing conformations. Detailed kinetic models have been proposed (Loo et al., 2005; Loo et al., 2006; Loo et al., 2008), including intermediate states within the empty carrier that have been found before (Krofchick et al., 2004).
Despite these prominent details about the transport mechanism, sugar binding to SGLT1 has not yet been measured directly. We recently developed a solid supported membrane-based electrophysiology (SSME) assay for SGLT1, enabling the analysis of both, binding and transport properties at the same time (Bazzone et al., 2022a). In SSME, transporter activity is triggered by substrate concentration jumps at 0 mV with the possibility to apply co-substrate gradients as an additional driving force. In SSME all recorded currents are transient and decay to zero, usually within a second, due to the capacitive read-out (Bazzone et al., 2017a; Bazzone and Barthmes, 2020). Sugar concentration jumps on SGLT1 generate biphasic transient currents comprised of a fast decaying PSS component and a slowly decaying transport component (Bazzone et al., 2022a). While the fast PSS component reflects a sugar binding induced electrogenic transition and can be also observed in the absence of Na+, the slowly decaying transport component is only observed when sugar binding is followed by Na+ translocation across the membrane.
Here, we present a detailed kinetic analysis of SGLT1 using SSME. All kinetic and thermodynamic parameters presented in the following are described in detail within the glossary. We determined Imax, KM and KDapp values for five different sugar substrates and determined rate constants for the sugar-induced electrogenic conformational transitions. We also compared the kinetics of Na+-, Li+- and H+-coupled transport modes and investigated the effects of Cl− on SGLT1 kinetics. In addition, we examined the cross-play between cation and sugar binding and found a high degree of cooperativity for Na+/sugar cotransport. Finally, we propose a detailed kinetic model, focusing on the sugar translocation pathway in SGLT1, introducing a random binding order and electrogenic transitions within the substrate-bound carrier, which have not been observed before.
2 Materials and methods
2.1 Sample preparation
For all experiments, purified membrane vesicles from CHO cells overexpressing SGLT1 were used. Membrane purification was performed via ultracentrifugation with a sucrose gradient as described previously (Bazzone et al., 2022a). Vesicles of total protein concentrations between 2 and 5 mg/mL were stored in buffer containing 30 mM HEPES, 130 mM NMDG-Cl, 10 mM KCl, 5 mM MgCl2 at −80°C. Prior to sensor preparation, vesicles were usually diluted 1:10 in resting solution (R), the composition of which is defined by the type of experiment performed.
2.2 Sensor preparation and electrophysiological measurements
SSME was performed using the SURFE2R N1 device (Nanion Technologies GmbH) and sensor preparation followed the standard protocols as described in detail previously (Bazzone et al., 2017a; Bazzone and Barthmes, 2020). A summary is provided in Supplementary Methods S1.1.
If not stated otherwise, all current traces shown in the same graph were recorded on the same sensor. For analysis, only the currents during the activating solution (A) flow were used. The time resolution of the solution exchange depends on the sensor surface area, with about 3–6 ms for 1 mm sensors and 20–40 ms for 3 mm sensors (Bazzone et al., 2017a) and may limit the recording of fast PSS currents.
The buffer used to prepare the measurement solutions (R, A and non-activating solution, NA) contained 30 mM Tris/HCl, 3 mM EDTA, 1 mM EGTA and 120 mM NMDG/SO4 at pH 7.4. Each figure includes a scheme describing the additional components of NA, A and R solutions used for the respective experiment. Details about the preparation of measurement solutions can be found in Supplementary Methods S1.2.
2.3 Data recording, analysis and kinetic simulations
Current traces were recorded using the SURFE2R N1 Control 1.7.0 software (Nanion Technologies GmbH) and exported for further analysis using OriginPro 2022 (OriginLabs). Details about data processing including normalization and fitting procedures are provided in Supplementary Methods S1.3 to Supplementary Methods S1.6.
Reconstruction of transporter currents was accomplished using MathCAD 15 (Parametric Technology Corporation) as described previously (Tadini-Buoninsegni and Fendler, 2015). Kinetic simulations were performed with Berkeley Madonna 8.0.0 (Berkeley Madonna Inc.) using the Rosenbrock algorithm and a time filter of 2 ms, reflecting the time resolution threshold for solution exchange on 1 mm sensors.
3 Results
Recently we showed that SSME is able to detect both, sugar binding and Na+/sugar cotransport in SGLT1 (Bazzone et al., 2022a). Here, we expand our study to investigate the kinetic properties of SGLT1 regarding substrate binding and transport.
3.1 Concentration dependent currents under transport and PSS conditions
From concentration dependent current traces, we could determine EC50 values. The EC50 represents an apparent constant describing the half-saturation of the assessed parameter. Recently we identified that the measured current is composed of a fast decaying PSS component (τ = 3–10 ms) reflecting a sugar-induced electrogenic conformational transition within SGLT1 and a transport component which displays higher decay time constants (∼150 ms) (Bazzone et al., 2022a). When the detected current is dominated by transport, we assume the determined EC50 value to reflect the Michaelis Menten constant for Na+/sugar cotransport under steady-state conditions (KM). On the other hand, the PSS peak current is a direct consequence of sugar binding (Bazzone et al., 2022a); hence, when PSS currents are analyzed, we assume the EC50 matches the apparent equilibrium constant (KD) for sugar binding. However, the determined parameters are a result of the experimental conditions and analysis procedures, and should be interpreted as apparent constants. To distinguish experimentally determined apparent constants from real KD values, we write KD values derived from SGLT1 PSS currents as KDapp (apparent KD).
3.1.1 Methods to derive KM and KDapp values for D-glucose
To determine the sugar KM and KDapp under Na+/D-glucose cotransport conditions, we performed different sugar concentration jumps using the same sensor in the presence of 300 mM NaCl in all measurement solutions. We took advantage of different sensor sizes with different time resolutions: currents recorded using 3 mm sensors exhibit a broader peak shape. Here, PSS and transport phases contribute to the peak currents (Figure 1A). Due to the higher time resolution when 1 mm sensors are used, the peaks are mainly comprised of the fast PSS current phase (Figure 1B) (Bazzone et al., 2017a). A common mathematical approach is to reconstruct the transporter current via circuit analysis from the raw current trace obtained by SSME (Tadini-Buoninsegni and Fendler, 2015). Through this procedure the slowly decaying current component is used to find the steady-state current amplitude, while the PSS current is unaltered (Figure 1C). This procedure helps to separate PSS and transport current phases and allows for individual analysis.
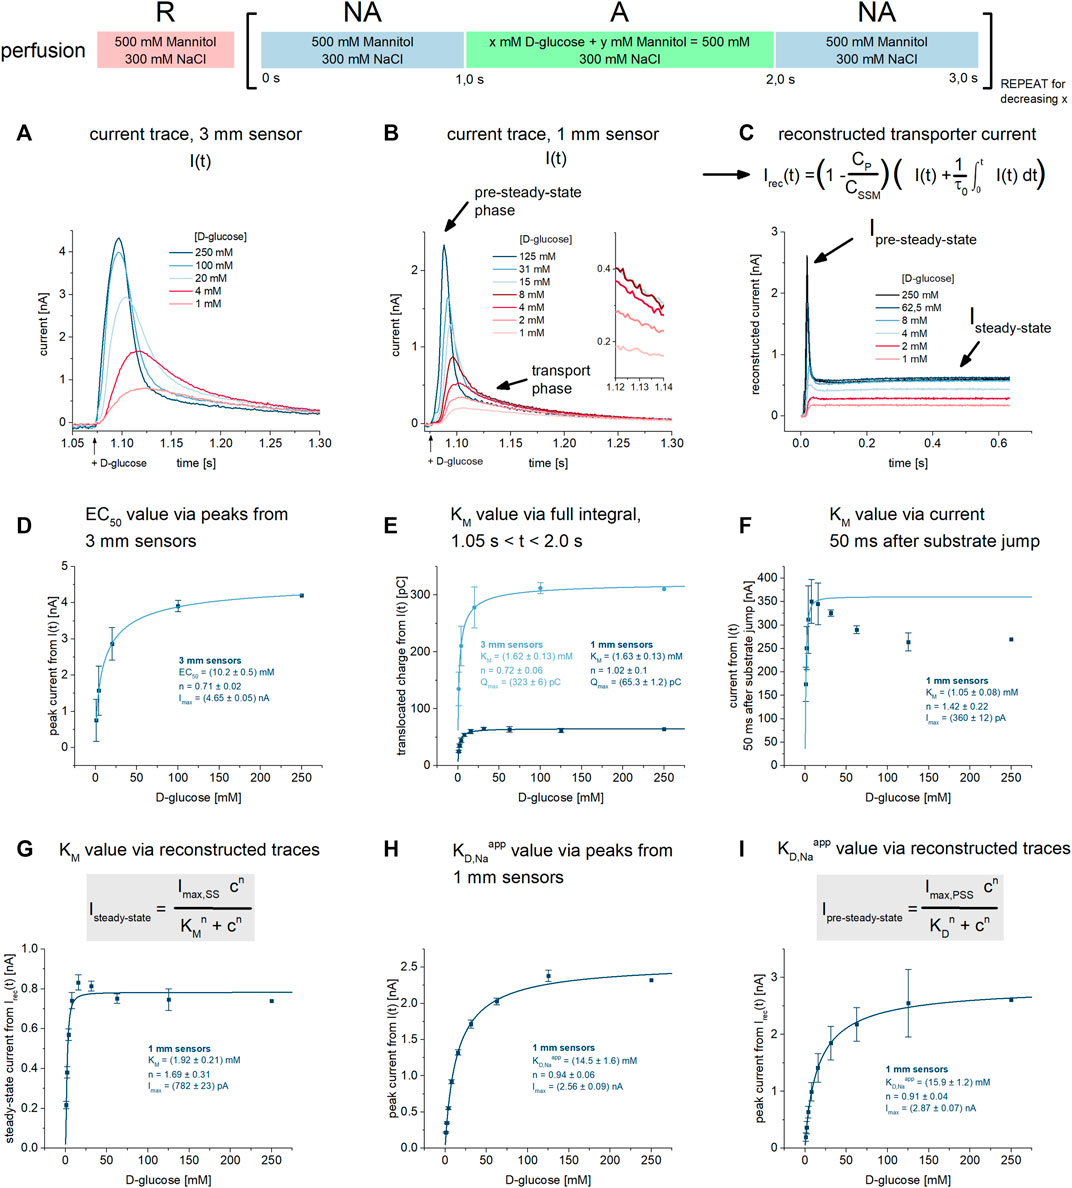
FIGURE 1. KM and KD,Naapp values for D-glucose under Na+/D-glucose cotransport conditions. All current traces were recorded on 3 mm or 1 mm sensors as indicated, equilibrated at pH 7.4 in the presence of 300 mM Na+ in all measurement solutions and upon D-glucose concentration jumps between 1 mM and 250 mM. Averaged data of n = 3 different sensors is shown. (A) Representative current traces recorded on one 3 mm sensor. The large sensor surface and high signal-to-noise comes at the cost of time resolution: peak currents are defined by both PSS and transport components. (B) Representative current traces recorded on one 1 mm sensor. Compared to 3 mm sensors, time resolution is higher and a fast decaying PSS phase can be distinguished from the slow decaying transport phase. The inset shows the current at t = 1.13 s used for the analysis in (F). (C) Via circuit analysis, transporter currents were reconstructed from the current traces shown in (B) (Tadini-Buoninsegni and Fendler, 2015). Steady-state currents are revealed from the transport phase of the original current. Ipre-steady-state and Isteady-state is used for the analysis of KM and KD values in (G) and (I), respectively. (D) Peak currents from 3 mm sensors are fitted using a hyperbolic equation to derive an EC50 of 10.2 ± 0.5 mM for D-glucose. It represents a value which is between KM and KD,Naapp, since the peak is affected by both D-glucose induced PSS and transport phases. (E) Integrals from 3 mm to 1 mm sensors are fitted using a hyperbolic equation to derive KM values of 1.62 ± 0.13 mM and 1.63 ± 0.13 mM for D-glucose, respectively. Integrals reflect the overall charge translocation which is dominated by transport; PSS charge translocation is small in comparison and may be neglected, hence the resulting EC50 reflects the real KM. (F) Currents 50 ms after the sugar concentration jump are fitted using a hyperbolic equation to derive a KM of 1.05 ± 0.08 mM for D-glucose. At this time point, PSS currents are already zero, allowing for the read-out of the transport phase directly. The resulting EC50 reflects a KM. A decrease in current amplitude at high sugar concentrations was observed. The KM was determined using the D-glucose concentrations between 1 mM and 16 mM. (G) Steady-state currents from the reconstructed transporter currents are fitted using a hyperbolic equation to derive a KM value of 1.92 ± 0.21 mM for D-glucose. (H) Peak currents from 1 mm sensors are fitted using a hyperbolic equation to derive a KD,Naapp of 14.5 ± 1.6 mM for D-glucose. In contrast to 3 mm sensors and due to higher time resolution, peaks are dominated by fast PSS currents triggered by D-glucose binding to SGLT1. Hence, the resulting EC50 may be close to the real KD. (I) Peak currents from the reconstructed transporter currents are fitted using a hyperbolic equation to derive a KD,Naapp of 16.3 ± 1.2 mM for D-glucose.
In SSME, concentration dependent peak currents are typically used to derive KM values. When a transporter shows substrate-induced PSS currents, they overlay with transport currents. Consequently, the concentration dependence of the peak current may be affected by both KM and KDapp. Hence, using the peak currents to derive KM values might not be viable, depending on the ratio of transport and PSS current amplitudes. In SGLT1, the PSS current amplitude is pronounced, dominating the peak current when 1 mm sensors with higher time resolution are used. In contrast, when using 3 mm sensors, PSS and transport current amplitudes are of similar magnitude. Hence, when 3 mm sensors are used, an EC50 will be derived reflecting an intermediate value between KM and KDapp (Figure 1D). Here we wanted to evaluate different analysis procedures to derive KM and KDapp values individually.
To derive KM values from recordings on 3 mm sensors, we used the total charge translocation calculated by integrating the current time course: the overall charge translocation is dominated by transport. While PSS currents significantly affect the peak of the measured current, they are already at zero about 50 ms after solution exchange. Therefore, the impact of PSS currents on the total charge is negligible. The current integral represents an alternative read-out in SSME due to different advantages over the peak currents (Pintschovius et al., 1999; Bazzone et al., 2017b; Gerbeth-Kreul et al., 2021; Thomas et al., 2021). When plotting the concentration dependence of the translocated charge, we obtain a KM of 1.62 ± 0.13 mM for SGLT1 mediated D-glucose transport (Figure 1E). Even though the PSS current amplitude is more pronounced on 1 mm sensors, the integral analysis on 1 mm sensors yields essentially the same KM of 1.63 ± 0.13 mM (Figure 1E).
Another method to derive KM values is to read-out the current amplitude at a time point when the PSS current has already decreased to zero. This time point is estimated from a mono-exponential fit of the fast current decay reflecting the PSS current phase. For this analysis, 1 mm sensors are preferred due to the faster decay of the PSS current phase. This allows the selection of the current at an earlier time point after the concentration jump. We plotted the current about 50 ms after the substrate jump against the sugar concentration (compare inset of Figure 1B). From this analysis we obtained a KM of 1.05 ± 0.08 mM (Figure 1F). A third alternative to derive KM is to use the reconstructed steady-state current. For this analysis, the dataset obtained from 1 mm sensors is used. Here, we obtain a KM value of 1.92 ± 0.21 mM (Figure 1G), close to the values obtained from the other two approaches.
To distinguish KDapp values determined in the presence and absence of Na+, we define KD,Naapp as the apparent equilibrium constant in the presence of 300 mM Na+ and KD,Kapp as the constant when Na+ is replaced by 300 mM K+. To obtain KD,Naapp values from PSS currents, we used 1 mm sensors. We have analyzed the peak currents from the raw traces, obtaining a KD,Naapp value of 14.5 ± 1.6 mM (Figure 1H). The analysis of the peak currents from the reconstructed transporter current yield a similar KD,Naapp value of 15.9 ± 1.2 mM (Figure 1I). These values might be a lower limit for the real KD,Na due to the remaining influence of the transport phase and the fact that KM < KDapp. However, the Hill coefficient of all fits are close to 1, indicating sufficient analysis for the binding of one sugar molecule to SGLT1.
Since SGLT1 is predominantly in a right-side-out orientation (Bazzone et al., 2022a), we were able to distinguish KM values for influx and efflux by reversing the assay conditions. We found a KM for D-glucose in efflux mode of 2.2 ± 1.6 mM (Supplementary Figure S1), not significantly increased compared to the KM in influx mode (Supplementary Results S2.1).
3.1.2 Comparison of KM values for D-glucose with the literature
The above determined KM values are in agreement with values from the literature, which range from 0.2 mM to 5.4 mM, depending on the sample and assay conditions (Barfuss and Schafer, 1981; Panayotova-Heiermann et al., 1996; Díez-Sampedro et al., 2001; Hummel et al., 2011; Wright et al., 2011; Arthur et al., 2014). The broad range of values found in the literature is a result of different experimental conditions. Literature values were often obtained using conventional electrophysiology—patch clamp or TEVC—in the presence of 140 mM Na+ and a negative membrane potential in the physiological range. Under these conditions most authors find KM values in the range of 0.5 mM (Wright et al., 2011). In contrast, the KM values close to 2 mM obtained here are recorded at 0 mV and in the presence of 300 mM Na+. It was shown previously that the apparent affinity for MDG increases 5-fold when voltage is shifted from −10 mV to −150 mV (Panayotova-Heiermann et al., 1995; Hirayama et al., 1996). The absence of membrane potential in a typical SSME experiment explains the somewhat higher KM value. We have already demonstrated that the KM value decreases when a negative membrane potential is applied in an SSME assay on SGLT1 (Bazzone et al., 2022a).
3.1.3 Sugar binding in the absence of Na+
Since sugar binding to SGLT1 occurs in the absence of Na+, detected by a smaller PSS current (Bazzone et al., 2022a), we determined the KD,Kapp for D-glucose. Here, 300 mM NaCl is replaced by 300 mM KCl in all measurement solutions (Figure 2). Under these conditions, we do not detect transport currents, but only PSS currents (Figure 2A).
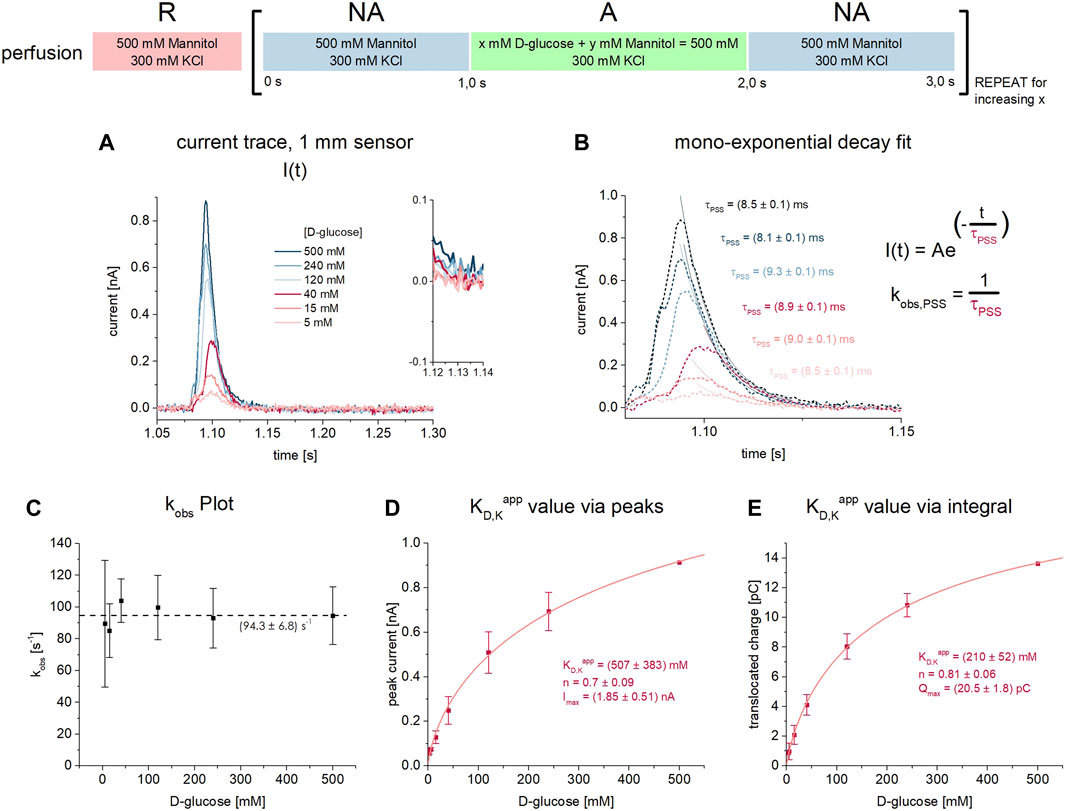
FIGURE 2. D-glucose binding to SGLT1 in absence of co-substrate. All current traces were recorded on 1 mm sensors at pH 7.4 in absence of Na+ upon D-glucose concentration jumps between 5 mM and 500 mM. Na+ was replaced by 300 mM K+ in all measurement solutions. Averaged data of n = 6 different sensors is shown. (A) Representative current traces recorded on one 3 mm sensor. The inset shows the current at t = 1.13 s which already reached the baseline, indicating that only PSS currents upon D-glucose binding are measured. (B) The decay time constant τ is determined from mono-exponential fits of the current decay. Rate constants kobs are derived for each sugar concentration. (C) Rate constants kobs = 1/τ for the sugar-induced PSS reaction are independent of the D-glucose concentration within the tested concentration range. (D) Peak currents are fitted using a hyperbolic equation to derive a KD,Kapp of 507 ± 383 mM for D-glucose binding to the empty carrier. (E) Integrals are fitted using a hyperbolic equation to derive a KD,Kapp value of 210 ± 52 mM for D-glucose binding to the empty carrier.
Indicative for the absence of a transport phase is the mono-exponential current decay. 50 ms after substrate jump–the time point used to read out the transport currents in the presence of Na+ (Figures 1B,F)—the current already reached the baseline (Figure 2A inset). From the time constant of the exponential current decay, the rate constant of the sugar-induced electrogenic reaction (kobs = 1/τ) can be derived (Figure 2B). Interestingly, kobs is independent of sugar concentration for all concentrations tested (5 mM–500 mM) (Figure 2C). The average kobs is 94.3 ± 6.8 s−1.
Since only PSS currents are detected, both peak and integral analysis may be used to derive KD,Kapp values. Integrals are often used when analyzing PSS currents, since the charge translocation contains thermodynamic information about the underlying electrogenic reaction, while the peak current is a consequence of the transporter kinetics and the time resolution of the instrument, hence containing less information about the transporter. However, we obtained very similar KD,Kapp values of 507 ± 383 mM (Figure 2D) and 210 ± 52 mM (Figure 2E), when using peak and integral analysis, respectively.
Summarizing the results so far, we observe an apparent affinity (KM) for D-glucose transport of ≈1.5 mM, while sugar binding to the Na+-bound carrier occurs with much lower affinity (KD,Naapp ≈15 mM); the empty carrier shows a reduced sugar affinity (KD,Kapp ≈200 mM).
3.1.4 Half saturation constants for Na+
To determine the KM value for Na+, we performed 250 mM D-glucose concentration jumps using different Na+ concentrations in all measurement solutions (Figure 3). We performed the measurements using 3 mm sensors (Figure 3A) and 1 mm sensors (Figure 3B) and reconstructed the transporter currents (Figure 3C). The peak currents recorded on 3 mm sensors again yield an EC50 reflecting a mix of EC50 values from transport and PSS current phases (Figure 3D). Hence, we analyzed the results using the same three approaches as discussed for D-glucose above. We obtained KM values of 39 ± 4 mM, 59 ± 13 mM (both Figure 3E), 52 ± 13 mM (Figure 3F) and 54 ± 14 mM (Figure 3G) using the full integrals from 3 mm to 1 mm sensors, the currents 50 ms after substrate jump and the reconstructed steady-state currents, respectively.
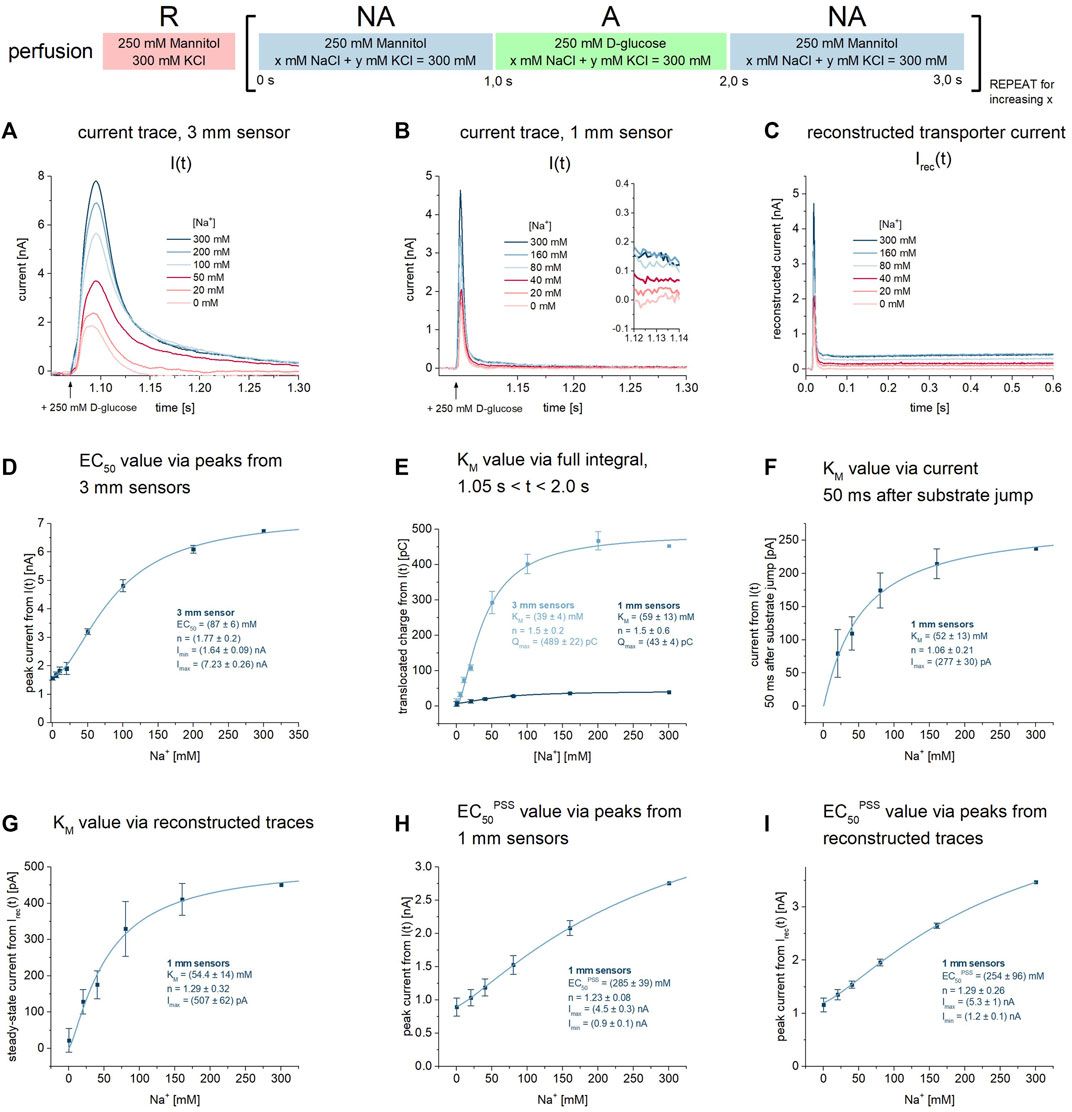
FIGURE 3. KM and EC50PSS values for Na+ during Na+/D-glucose cotransport. All current traces were recorded on 3 mm or 1 mm sensors as indicated, equilibrated at pH 7.4 in the presence of 0–300 mM Na+ in all measurement solutions and upon 250 mM D-glucose concentration jumps. Averaged data of n = 6 different sensors is shown. Further details are found in the description of Figure 1. (A) Representative current traces recorded on one 3 mm sensor. (B) Representative current traces recorded on one 1 mm sensor. The inset shows the current at t = 1.13 s used for the analysis in (F). (C) Via circuit analysis, transporter currents were reconstructed from the current traces shown in (B) (Tadini-Buoninsegni and Fendler, 2015). (D) Peak currents from 3 mm sensors are fitted using a hyperbolic equation to derive an EC50 of 87 ± 6 mM for Na+. It represents a value which is between KM and the EC50 of the D-glucose induced PSS current, since the peak is affected by both D-glucose induced PSS and transport phases. (E) Integrals from 3 mm to 1 mm sensors are fitted using a hyperbolic equation to derive KM values of 39 ± 4 mM and 59 ± 13 mM for Na+, respectively. (F) Currents at t = 1.13 s are fitted using a hyperbolic equation to derive a KM of 52 ± 13 mM for Na+. (G) Steady-state currents from the reconstructed transporter currents are fitted using a hyperbolic equation to derive a KM value of 54.4 ± 14 mM for Na+. (H) Peak currents from 1 mm sensors are fitted using a hyperbolic equation to derive an EC50PSS of 285 ± 39 mM for Na+. Since peaks are dominated by D-glucose binding induced PSS currents, the determined EC50 may not represent a KD for Na+ but is rather limited by sugar binding kinetics. (I) Peak currents from the reconstructed transporter currents are fitted using a hyperbolic equation to derive an EC50PSS of 254 ± 96 mM for Na+.
Altogether, the KM values we obtained do match with those found in the literature. Literature values vary between 0.8 mM and 73 mM, depending on the experimental conditions. Values at the lower end of the spectrum were determined at highly negative membrane voltages (Hirayama et al., 1996; Panayotova-Heiermann et al., 1996; Quick et al., 2001; Loo et al., 2006). Between 0 and -60 mV, KM values are between 35 mM and 73 mM (Hirayama et al., 1996; Loo et al., 2000; Eskandari et al., 2005; Hummel et al., 2011), which agree with our results. Wright et al. found KM values of 60 mM at 0 mV and 0.8 mM at −150 mV (Wright et al., 2011).
We then used the Na+ dependence of the sugar-induced PSS current to derive an EC50PSS value that might correlate with a KDapp for Na+. We have used the peak current amplitudes recorded on 1 mm sensors, either from the raw current traces or from the reconstructed transporter currents. Both approaches yield very similar EC50PSS values of 285 ± 39 mM (Figure 3H) and 254 ± 96 mM (Figure 3I), respectively. This is almost one order of magnitude higher compared to the Na+ KM, similar to the KD,Naapp/KM ratio for D-glucose (15 vs. 2 mM). A KD for Na+ of 20 mM was reported in the literature (Loo et al., 2013). Hence, we suspect that the Na+ EC50PSS is limited by sugar binding kinetics and does not represent a real KD for Na+. Real KD values for Na+ may be determined via Na+ concentration jumps using different Na+ concentrations in the presence of sugar. However, Na+-induced PSS currents are smaller, more affected by the overlay of transport currents and therefore, difficult to analyze (Bazzone et al., 2022a). KD values for Na+ in the absence of sugar cannot be determined, since Na+ binding in the absence of sugar does not trigger PSS currents in SSME (Bazzone et al., 2022a).
Since sugar binding induces PSS currents in the absence of Na+ (Figure 2), we obtain a Na+ concentration dependence of the PSS starting from Imin (Figures 3H,I). The hyperbolic fit thus also reveals the ratio of PSS electrogenicity when sugar binds to the Na+-bound carrier vs. the empty carrier, which is about Imax/Imin = 4.5. Na+ binding has a large effect on the electrogenicity of the sugar-induced conformational transition.
3.1.5 Rate constants for the sugar-induced PSS
The existence of substrate-induced PSS currents enables kinetic analysis of the underlying reaction. We propose a simple kinetic model as shown in Figure 4A: sugar binding with the affinity KD is followed by an electrogenic transition with rate constants kon and koff which is detected via SSME. Note that kon and koff do not represent rates of sugar binding, but rates of a subsequent conformational transition.
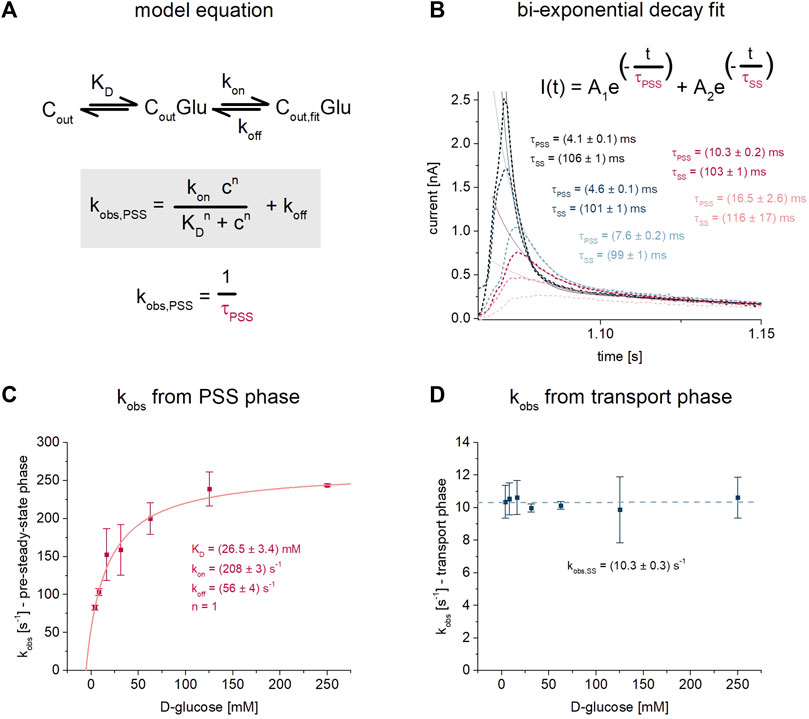
FIGURE 4. D-glucose binding to SGLT1 in the presence of Na+. For this analysis the dataset recorded on 1 mm sensors shown in Figure 1 was used. (A) Kinetic model and model equation for D-glucose (Glu) binding to SGLT1 in the outward facing conformation (Cout) followed by an electrogenic conformational transition from CoutGlu to Cout, fitGlu–likely representing an induced fit mechanism. Sugar binding is defined via the KD, while the conformational transition is defined via the rate constants kon and koff. The observed rate constant kobs,PSS = 1/τPSS can be written as a function of KD, kon, koff and the sugar concentration c. The time constant τ is the decay time from an exponential fit of the sugar-induced PSS current. (B) D-glucose concentration dependent traces are taken from Figure 1B. Two decay time constants are derived from bi-exponential fits of the current decay: τPSS for the fast-decaying PSS current and τSS for the slow-decaying transport phase. τPSS depends on the sugar concentration according to the model equation. τSS is a result of the vesicles being charged upon transport, leading to decreasing transport rates over time; it is virtually independent of sugar concentration. (C) Concentration dependent values for kobs,PSS were determined from n = 5 different sensors and averaged, then fitted using the model equation shown in (A). For the fit, the Hill coefficient n was fixed to 1 representing one sugar molecule binding to SGLT1, while values for KD = 26.5 ± 3.4 mM, kon = 208 ± 3 s−1 and koff = 56 ± 4 s−1 were determined. The great fit (R2 > 0.999) validates the use of the model equation for our data. The KD is slightly higher compared to the KDapp values obtained from the analysis procedures given in Figure 1. (D) Values for kobs,SS were averaged from the same n = 5 sensors as used for the kobs,PSS analysis shown in (C). Averaged values were plotted to show that the decay of the transport phase is independent of sugar concentration. kobs of 10.3 ± 0.3 s−1 represents the average for all sugar concentrations.
The rate constants kon and koff may be derived from the concentration dependent decay time constant τPSS = 1/kobs of the sugar-induced PSS currents, as demonstrated earlier for sugar-induced PSS currents of H+-coupled sugar transporters recorded via SSME (Garcia-Celma et al., 2010; Bazzone et al., 2022b). τPSS is accessible via exponential fit of the current decay. Surprisingly, and as mentioned above, τPSS in the absence of Na+—reflecting sugar binding to the empty carrier—did not depend on sugar concentration (Figure 2C). In contrast, in the presence of Na+, τPSS does depend on sugar concentration. τPSS in the presence of Na+ was determined using a bi-exponential fit of the current decay (Figure 4B). The decay time constant of the fast current reflects τPSS. It increases when sugar concentrations are reduced. This correlates with a slower reaction rate kobs = 1/τPSS. The highest concentration of 250 mM D-glucose corresponds with the lowest decay time constant of 4.10 ± 0.03 ms (kobs = 244 ± 2 s−1), which is close to the time resolution of the measurement for 1 mm sensors (Bazzone et al., 2017a). Hence the maximum kobs may be considered a lower limit. The highest PSS decay time constant of 12.05 ± 0.47 ms (kobs = 83 ± 3 s−1) was determined for 4 mM D-glucose. Based on the kobs values and using the model equation provided in Figure 4A, we found kon = 208 ± 3 s−1 and koff = 56 ± 4 s−1 and a KD,Naapp of 26.5 ± 3.4 mM (Figure 4C). The KD,Naapp determined with the model equation is slightly higher compared to the KD,Naapp determined from the peak currents (14.5 ± 1.6 mM, Figure 1H). As mentioned above, using the peak currents might underestimate the KD, due to the overlay with transport current phases with lower EC50 values.
In contrast to τPSS, the slow decay time constant τSS representing the transport current phase does not depend on sugar concentration (Figure 4D). τSS is a result of the increasing membrane potential - due to Na+/sugar cotransport - that acts as a counter force for the sugar concentration gradient. This leads to decreasing transport rates over the course of the real-time measurement until a new equilibrium is reached at which no net transport occurs. For our analysis, τSS contains no interesting information about the transporter, but needs to be considered to achieve a proper fit of the bi-exponential current decay, when transport and PSS current phases are detected.
3.1.6 Cooperativity of Na+ and sugar binding
Na+ binding triggers the opening of an extracellular gate within SGLT1, allowing glucose to bind in the central cavity (Peerce and Wright, 1984; Hirayama et al., 2007; Sala-Rabanal et al., 2012; Loo et al., 2013; Adelman et al., 2016; Gorraitz et al., 2017). Seemingly contradictory to this, we previously found that glucose binds to SGLT1, even in the absence of Na+ (Bazzone et al., 2022a). In the results described above we showed that Na+ availability increases the affinity for D-glucose from 200 mM (Figure 2E) to 15 mM (Figure 1H). In order to investigate the extent of cooperativity between sodium and sugar, we used five glucose concentrations (1 mM, 4 mM, 20 mM, 100 mM, 250 mM) to activate SGLT1 in the presence of six different sodium concentrations (0 mM, 20 mM, 50 mM, 100 mM, 200 mM, 300 mM), making up for 30 different conditions; All 30 experiments were performed sequentially on a single 1 mm sensor (Figure 5A). We have repeated this set of experiments with 5 sensors in total.
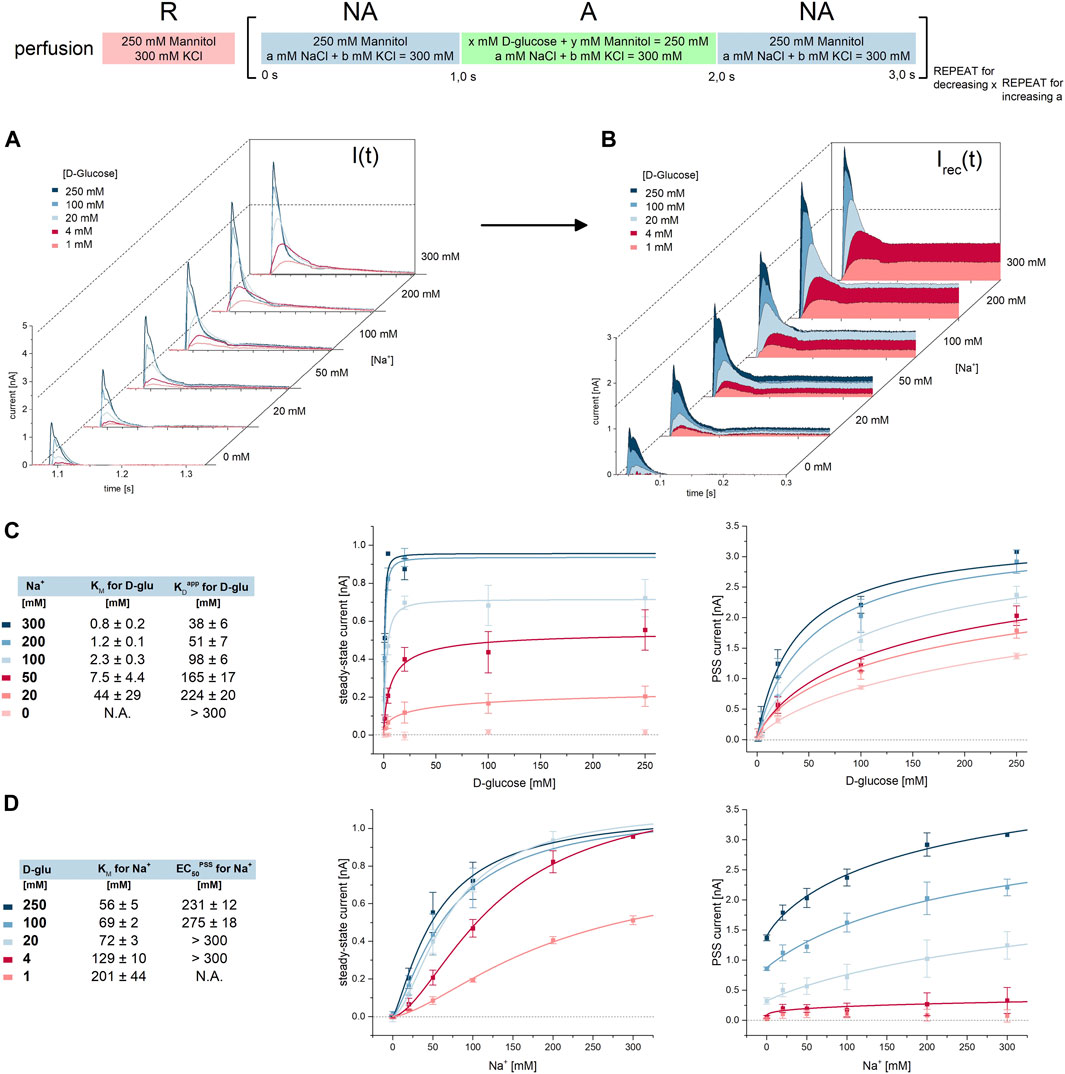
FIGURE 5. Cooperativity between D-glucose and Na+ during Na+/D-glucose cotransport. All current traces were recorded on 1 mm sensors at pH 7.4 in the presence of 0 mM–300 mM Na+ in all measurement solutions and upon D-glucose concentration jumps between 1 mM and 250 mM. All 30 combinations of Na+ and D-glucose concentrations were measured on the same sensor, for n = 5 sensors in total. (A) Representative current traces recorded on one sensor. D-glucose concentrations are color-coded according to the figure legend. One graph shows all traces for one given Na+ concentration, which is indicated to the right of the graph. (B) Via circuit analysis, transporter currents were reconstructed from the current traces shown in (A) (Tadini-Buoninsegni and Fendler, 2015). Steady-state currents are used to derive KM values for D-glucose and Na+ in the presence of different concentrations of co-substrate. PSS peak currents are used to derive KDapp values for D-glucose and EC50PSS values for Na+, depending on co-substrate concentration. (C) Hyperbolic fits of ISS and IPSS for different D-glucose concentrations to derive KM and KDapp values for D-glucose in the presence of different Na+ concentrations. (D) Hyperbolic fits of ISS and IPSS for different Na+ concentrations to derive KM and EC50PSS values for Na+ in the presence of different D-glucose concentrations.
To determine KM and KDapp values for D-glucose and KM and EC50PSS values for Na+ we reconstructed the transporter currents, allowing read-out of steady-state and PSS currents individually (Figure 5B). We then plotted the concentration dependent steady-state and PSS currents to determine KM and KDapp or EC50PSS values, respectively.
For D-glucose we obtained KM and KDapp values in the presence of six sodium concentrations (Figure 5C): when the Na+ concentration is reduced from 300 mM to 20 mM, KM for the sugar increases 55-fold from 0.8 mM to 44 mM, while KDapp for the sugar increases 6-fold from 38 mM to 224 mM. Compared to the analysis of the dataset shown in Figure 1, the determined KDapp value is somewhat higher, and KM is somewhat lower. This is probably due to the lower amount of data points per fit. In the literature we found that KM for MDG increases 2.3-fold at −150 mV and 5.8-fold at −70 mV, when the Na+ concentration decreases from 100 mM to 25 mM (Wright et al., 2011). If the impact of Na+ concentration on the KM for MDG is higher when voltage is further increased, the 55-fold increase in KM we observed at 0 mV conditions seems plausible.
For Na+ we obtained KM and EC50PSS values in the presence of five glucose concentrations (Figure 5D): reduction of D-glucose concentration from 250 mM to 1 mM leads to a 3.6-fold increase in KM from 56 mM to 201 mM. The EC50PSS increases from 231 mM to >300 mM. These values are consistent with the results from the analysis of the dataset shown in Figure 3. Comparing with the literature, Wright et al. found the KM for Na+ increased 2.7-fold at −150 mV and 2.1-fold at −70 mV, when MDG concentration decreases from 10 mM to 1 mM (Wright et al., 2011). Since the change in Na+ KM with sugar concentration is less affected by membrane voltage, it correlates well with the 3.6-fold increase we found at 0 mV.
The correlation between KM and co-substrate concentrations for both substrates support a random binding order. We also fitted the cooperativity data using model equations for sequential substrate binding, assuming that either Na+ or the sugar binds first. Both model fits approximate the respective datasets (Supplementary Results S2.2; Supplementary Figure S2).
3.2 Binding and transport of different sugar species
We performed concentration jumps using different sugar species to determine substrate specificity. We have tested D-glucose, α-methyl-D-glucose (MDG), D-galactose, 3-O-methyl-D-glucose (OMG), D-xylose and 2-desoxy-D-glucose (DOG) in the presence and absence of Na+ using both 1 mm and 3 mm sensors (Figure 6). All sugar substrates were applied on the same sensor to achieve direct comparison of relative signal amplitudes and we compared both peak currents and the overall charge translocation (current integrals), for all sugar substrates.
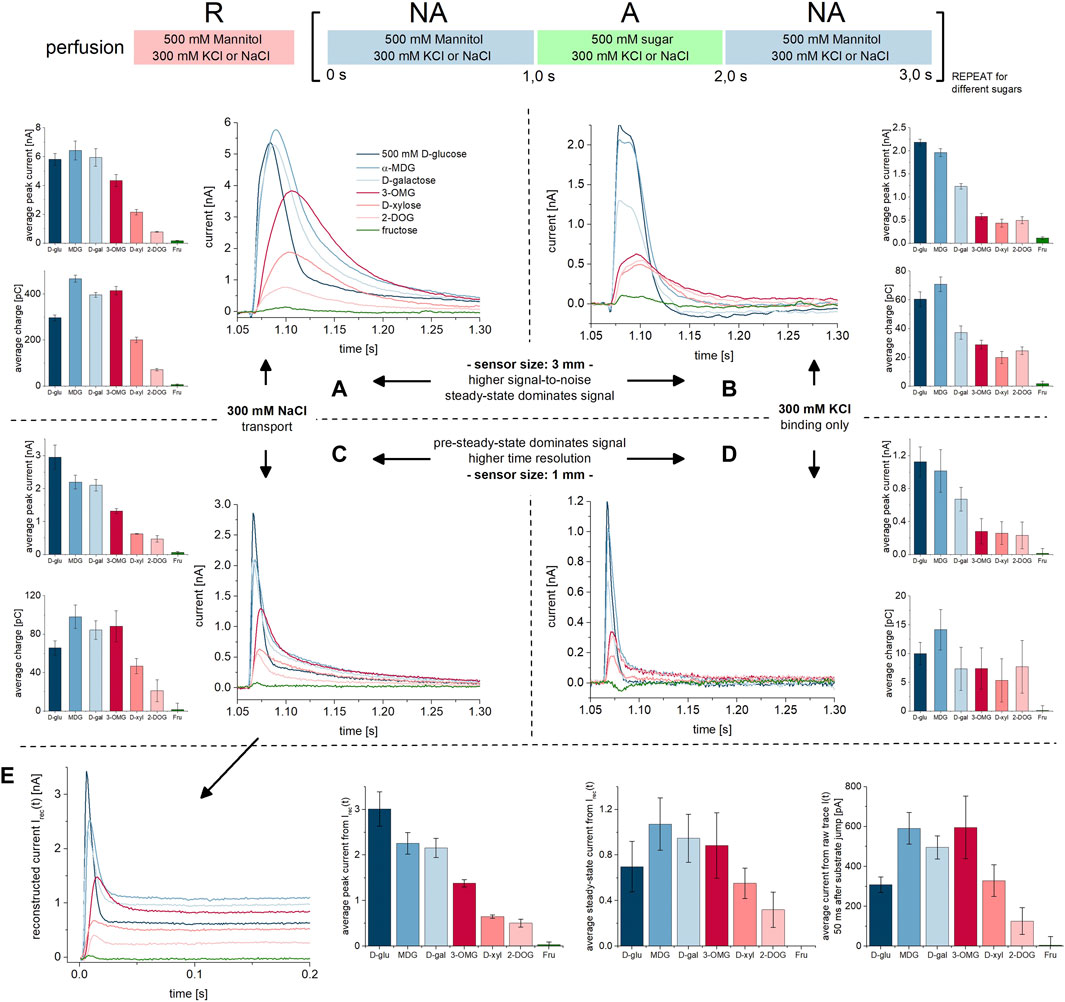
FIGURE 6. Na+/sugar transport and PSS current traces for different sugar substrates. All current traces were recorded at pH 7.4, either in the presence of 300 mM Na+ (left) or 300 mM K+ (right) in all measurement solutions and upon 500 mM concentration jumps of different sugars. We have compared the current traces recorded on 3 mm sensors (top) and 1 mm sensors (bottom). At given conditions, all sugar-induced traces were recorded on the same sensor. As a negative control D-fructose was used (green traces), which is not a substrate of SGLT1. The bar plots in (A–D) show averaged peak currents and charges (integrals) for all substrates under the given conditions and recorded from a total set of n = 3 sensors each. Standard deviations are a result of deviations across different sensors (no normalization was applied); the relative currents and charges between substrates are more accurate. The current traces shown are representative currents recorded from the same sensor. (A) Current traces recorded on 3 mm sensors in the presence of 300 mM Na+. The currents include transport and PSS current phases. From the right-shift of the peak current for OMG, D-xylose and DOG (red traces) we conclude that peaks are dominated by the transport current phase for the minor substrates. For D-glucose, MDG and D-galactose (blue traces) the fast PSS current phase dominates transport. (B) Current traces recorded on 3 mm sensors in the absence of Na+, which is replaced by 300 mM K+. The currents consist only of the PSS current phase resulting from sugar binding to the empty carrier. PSS current amplitudes are higher for the major substrates D-glucose, MDG and D-galactose, possibly due to a higher Qmax, faster kinetics and/or higher affinity. (C) Same experiment as shown in (A) but recorded on 1 mm sensors. In contrast to 3 mm sensors, the PSS component is pronounced due to the higher time resolution of the sensors. (D) Same experiment as shown in (B) but recorded on 1 mm sensors. The higher time resolution allows for conclusions about PSS kinetics. (E) Transporter currents were reconstructed from currents shown in (C) via circuit analysis (Tadini-Buoninsegni and Fendler, 2015). The first two bar plots show average peak currents and steady-state currents from the reconstructed transporter currents. Peak currents approximate the PSS currents. The third bar plot shows average currents 50 ms after substrate jump from the raw current traces shown in (C), which was used as a potential read-out for the transport current and mostly matches with the relative change of the steady-state current from Irec(t).
We used 500 mM sugar in order to detect binding and transport, also for sugars with very low apparent affinities such as DOG [KM>100 mM (Díez-Sampedro et al., 2001; Tyagi et al., 2007)] and D-xylose [KM≈50–100 mM (Hager et al., 1995; Díez-Sampedro et al., 2001)]. Tyagi et al. could not detect transport for DOG using radiolabeled substrates in the presence of a Na+ gradient (Tyagi et al., 2007). However, we measured transport currents (Figure 6), showing that SSME provides a higher resolution combined with a shorter measurement time compared to radiolabeled assays.
As a negative control we also included D-fructose which is not a substrate of SGLT1 (Wright et al., 2011; Kamitori et al., 2022): accordingly, D-fructose does not generate any significant currents when applied, independent of the availability of Na+ or sensor type used (Figure 6, green traces). All other tested sugars generate currents in the presence (Figures 6A,C) and absence (Figures 6B,D) of Na+, reflecting a combination of PSS and transport currents, and PSS currents alone, respectively.
In the presence of Na+, and using saturating concentrations of D-glucose, MDG and D-galactose (major substrates), PSS currents have a major impact on the detected peak currents, while OMG, D-xylose and DOG (minor substrates) -induced peak currents are dominated by transport. This is concluded from three different observations: (1) When PSS currents dominate the signal, peak currents are high, but the translocated charge is low–as observed for D-glucose (Figure 6C, dark blue bars). When transport dominates the signal, translocated charge is high, but not necessarily the peak current, as clearly visible for OMG (Figure 6C, dark red bars). (2) The currents induced by the major substrates show a faster decay and a left shift of the peak compared to the currents induced by minor substrates, best visible when 3 mm sensors are used (Figure 6A). A steep current rise indicates an early electrogenic step in the transport cycle, potentially generating a PSS current. In addition, the currents induced by major substrates show a bi-exponential instead of mono-exponential decay, which is best resolved on 1 mm sensors (Figure 6C). Bi-exponential currents indicate the presence of a PSS current in addition to the slow transport current. (3) Our data recorded in the absence of Na+ show that the major substrates (Figures 6B,D, blue traces) indeed induce larger PSS currents compared to the minor substrates (Figures 6B,D, red traces).
Following this analysis, we performed concentration-dependent measurements of all sugars in the presence and absence of Na+ and derived relative Imax, KM and KDapp values, and rate constants (kobs, kon and koff) for the electrogenic PSS reaction. We applied the same assays and analysis methods as discussed for D-glucose and as shown in Figures 1, 2, 4. The results are presented in the following paragraphs. All traces and fits are shown in Supplementary Figures S3–S5. An overview of all kinetic and thermodynamic parameters for the different sugar species is shown in Table 1.
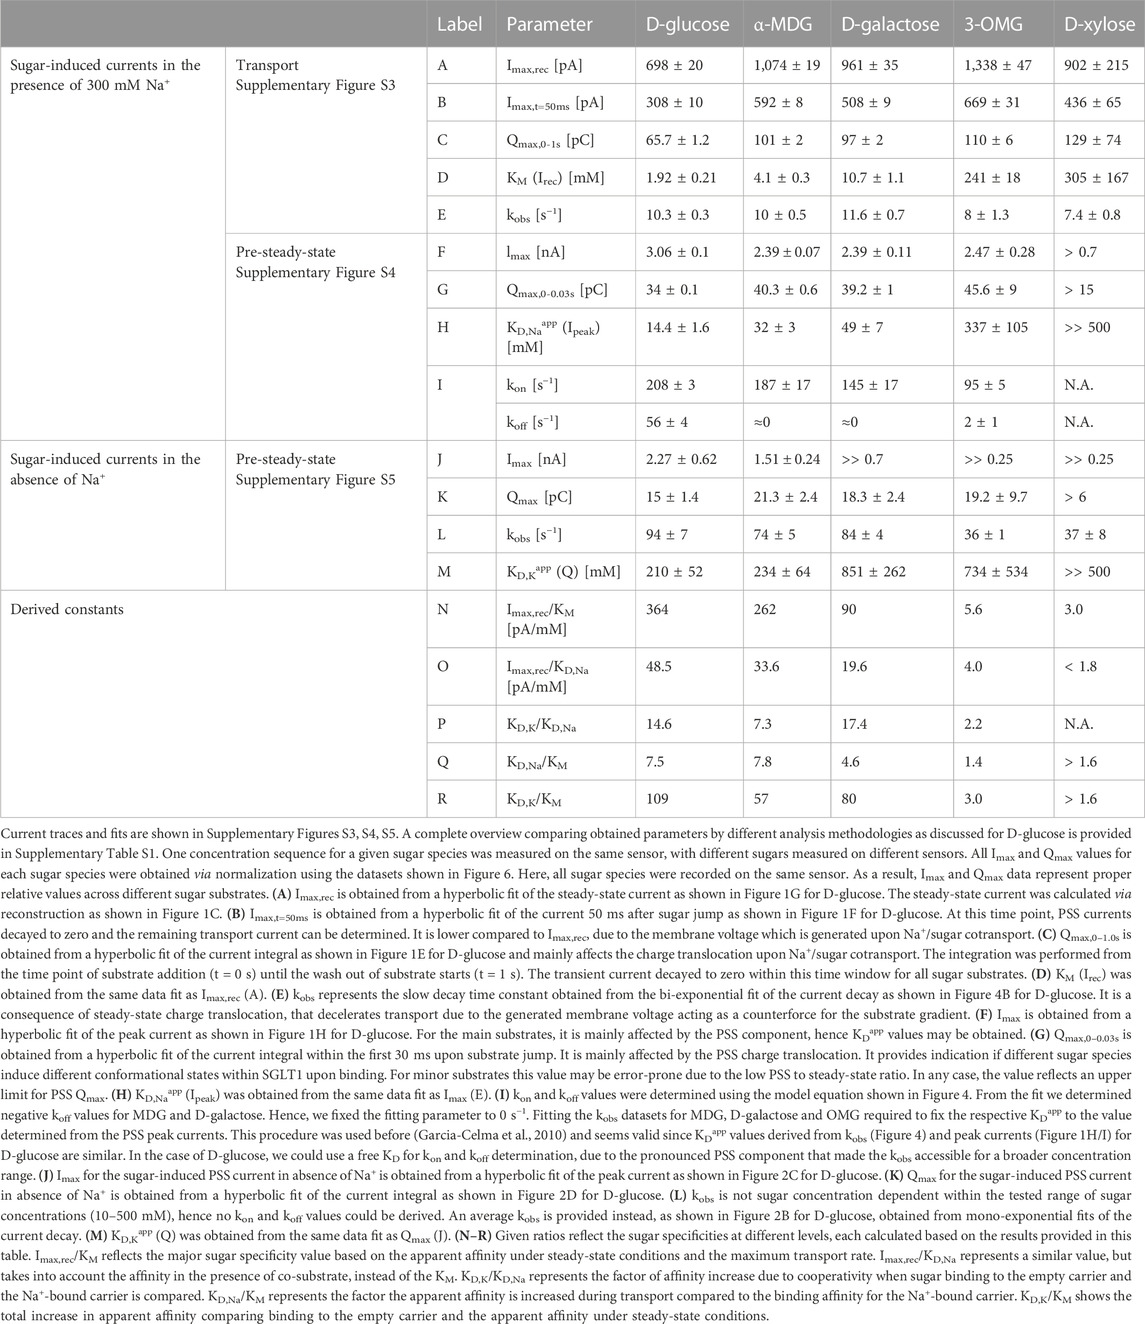
TABLE 1. Kinetic parameters obtained from transport and PSS currents using different sugar substrates in the presence and absence of Na+.
3.2.1 Substrate specificity is determined by increased apparent affinity
We determined relative Imax and KM values for all sugar species using sugar concentration jumps in the presence of 300 mM Na+ on 1 mm sensors. All concentration jumps of one given sugar species were performed on the same sensor. We reconstructed the transporter currents via circuit analysis (Tadini-Buoninsegni and Fendler, 2015) and used the steady-state currents to derive KM and Imax values. Imax values are a consequence of steady-state Na+ translocation coupled to the respective sugar species and driven by the sugar gradient alone. SSME does not allow for conclusions about absolute turnover rates (Vmax in molecules per second) since the total amount of transporters on the sensor surface is unknown. But relative Imax corresponds to the relative translocation rates for different sugar species. To determine relative Imax values for different sugars, we normalized all datasets to the relative steady-state current obtained from 500 mM sugar jumps on the same sensor (Figure 6E). This way we removed the current deviation obtained when measurements on different sensors are compared.
Sugar substrates can be ordered by their relative Imax values (Supplementary Figure S3; Table 1): OMG (1.34 nA) > MDG (1.08 nA) > D-galactose (0.96 nA) > D-xylose (0.9 nA) > D-glucose (0.7 nA). Interestingly, the sugars with higher Imax mostly show lower apparent affinity (higher KM values), indicating a relation between the affinity and the maximum transport rate, Vmax. The order of substrates from low to high KM is: D-glucose (1.9 mM) < MDG (4.1 mM) < D-galactose (10.7 mM) < OMG (241 mM) < D-xylose (305 mM). Substrate specificity can be represented as Vmax/KM. While Imax only varies by a factor of 1.9 between tested substrates, KM values differ by more than 2 orders of magnitude, hence defining the substrate specificity in the order: D-glucose (364 pA/mM) > MDG (262 pA/mM) > D-galactose (90 pA/mM) > OMG (5.6 pA/mM) > D-xylose (3.0 pA/mM).
3.2.2 Comparison of relative Imax and KM values with the literature
Differences in KM values between D-glucose, MDG and D-galactose seem to be only minor or not detectable in many published studies (Panayotova-Heiermann et al., 1995; Díez-Sampedro et al., 2000; Díez-Sampedro et al., 2001; Tyagi et al., 2007). One study found KM values of 1.8 mM, 3.8 mM and 6.1 mM for the three substrates at −60 mV and 37°C (Hummel et al., 2011) that do match with our results at 0 mV and room temperature (1.9 ± 0.2 mM, 4.1 ± 0.3 mM and 10.7 ± 1.1 mM, respectively).
One discrepancy is the high KM value obtained for OMG of 241 ± 18 mM. In the literature we found values between 3.3 mM and 22 mM (Hirayama et al., 1996; Díez-Sampedro et al., 2001; Yoo and Lee, 2006; Tyagi et al., 2007). On the other hand, the KM value of 305 ± 167 mM we determined for D-xylose is closer to the values of 50–100 mM reported in the literature (Hager et al., 1995; Díez-Sampedro et al., 2001).
Information about relative Imax values for different sugar species is limited. However there are indications that Imax is very similar across different sugar species (Birnir et al., 1991; Hirayama et al., 1997; Díez-Sampedro et al., 2001). Using SSME we found small, but significant, differences in Imax between substrates, which were not resolved before.
3.2.3 Binding cooperativity and improved kinetics are mechanisms to enhance substrate specificity
When sugar substrates are ordered by their KD,Naapp values, it is the same sequence as for the KM (Supplementary Figure S4; Table 1). However, KD,Naapp values are dramatically increased compared to KM values, especially for the major substrates: D-glucose (14.4 mM) < MDG (32 mM) < D-galactose (49 mM) < OMG (337 mM) < D-xylose (>500 mM). Interestingly, the ratio between KD,Naapp and KM is only >>1 for the major substrates D-glucose (7.5), MDG (7.8) and D-galactose (4.6), but not for OMG (1.4) and D-xylose (>1.6). This may indicate that evolution optimized steady-state transport kinetics around the major substrates to reduce KM for D-glucose transport.
In the absence of Na+, no transport currents are observed. To determine KD,Kapp values we have used integral analysis (Supplementary Figure S5; Table 1). When sugars are ordered by their KD,Kapp values, the sequence matches with those sequences stated above for KD,Naapp and KM values, although differences across substrates are not as strong. The affinity is massively decreased for almost all sugar substrates, when Na+ is not available: D-glucose (210 ± 52 mM) ≈ MDG (234 ± 64 mM) < D-galactose (851 ± 262 mM) ≈ D-xylose (734 ± 534 mM) < OMG (>>500 mM). Sugars may be ordered by KD,K/KD,Na ratio reflecting the degree of cooperativity between Na+ and sugar binding. The highest KD,K/KD,Na ratio is observed for D-galactose (17.4), followed by D-glucose (14.6) and MDG (7.3), while the apparent affinity for OMG (2.2) is not as much affected by Na+ binding. This shows that binding cooperativity is optimized for the major substrates as well. The KD,K/KD,Na ratio for D-xylose could not be determined due to the high KDapp in both the presence and absence of Na+.
In summary, both major and minor substrates have poor affinities for SGLT1 in the empty carrier state, i.e., a high KD,Kapp. Substrate specificity for the main substrates is a result of optimized cooperative binding with Na+ as well as improved transport kinetics to further enhance the KM below the KD,Naapp.
3.2.4 Sugar binding is fast for all sugars
We determined kobs values from the PSS current decay in the presence and absence of Na+ for all sugar species and found that the sugar-induced conformational transition is faster than the estimated transport rate of 28 s−1 found in literature (Loo et al., 2005). Thus, the sugar-induced conformational transition unlikely represents the rate limiting step in Na+/D-glucose co-transport. However, rates differ for each sugar species (Supplementary Figures S4, S5; Table 1).
In the presence of Na+, the sugar species may be ordered via kon rates of the conformational transition: D-glucose (208 s−1) > MDG (187 s−1) > D-galactose (145 s−1) > OMG (95 s−1); the kon rate for D-xylose could not be determined due to the low ratio of PSS to steady-state currents. The respective koff rates are close to 0 s−1 for all sugars, but D-glucose (56 s−1). Given errors of data fitting (Figure 4C), koff values not distinguishable from 0 s−1 may represent values of up to 5 s−1. The low koff rates for all tested sugars but D-glucose suggest that most sugars enable a higher stability of sugar-bound SGLT1, once the conformational transition after sugar binding is completed. Interestingly, this contrasts with the observation that all tested sugars show a lower affinity (higher KD) compared to D-glucose (Section 3.2.3).
As for D-glucose binding to the empty carrier (Figure 2), we could not determine kon and koff values for the electrogenic conformational transition induced by other sugar species, when Na+ is absent. kobs is independent of sugar concentrations within the tested concentration ranges, but it depends on the sugar species: D-glucose (94 s−1) > D-galactose (84 s−1) > MDG (74 s−1) > D-xylose (37 s−1) ≈ OMG (36 s−1). This demonstrates again that the sugar-induced conformational transition is faster for D-glucose compared to the minor substrates. Since the transport Imax of OMG is 2.3 times larger compared to D-glucose (Table 1) and OMG triggers a slower electrogenic conformational transition within the loaded carrier at the same time, this transition may become rate limiting during Na+/sugar cotransport of minor substrates.
3.2.5 Pre-steady-state charge translocation induced by different sugar substrates
Beside affinities and rate constants, PSS currents also reveal information about how the PSS charge translocations (Qmax) compare across different sugar species (Table 1). Variations in Qmax indicate different conformational states after binding of different sugar species, as discussed for the H+/D-xylose cotransporter XylE (Bazzone et al., 2022b).
Qmax for the PSS current is determined via hyperbolic fit of the current integral. In the absence of Na+, the total current integral is used, since only PSS currents are recorded. In the presence of Na+, we integrated the first 30 ms of the current to approximate for the PSS charge translocation. However due to overlap with the transport current phase, the resulting values are only rough estimates.
In the absence of Na+, D-glucose (15 pC), D-galactose (18.3 pC), OMG (19.3 pC) and MDG (21.3 pC) induce similar charge translocations under saturating conditions. Qmax for D-xylose (>6 pC) was only estimated due to the high KD,Kapp. In the presence of Na+, Qmax is larger, but again similar for D-glucose (34 pC), D-galactose (39.2 pC), MDG (40.3 pC), OMG (45.6 pC) and D-xylose (>15 pC). These results indicate that the bound sugar species does not determine the conformational state of SGLT1.
3.3 Sugar translocation coupled to H+ and Li+ and the role of Cl−
It is known that SGLT1 is able to catalyze sugar symport coupled to Li+ and H+, but not to K+, Rb+, Cs+ or choline+ (Wright et al., 2011). We previously showed that in the presence of K+, Rb+ and choline+ no transport currents can be detected using SSME (Bazzone et al., 2022a). Here, we used Li+ and measurements at acidic pH to investigate sugar binding and transport coupled to Li+ and H+. Results are summarized in Table 2.
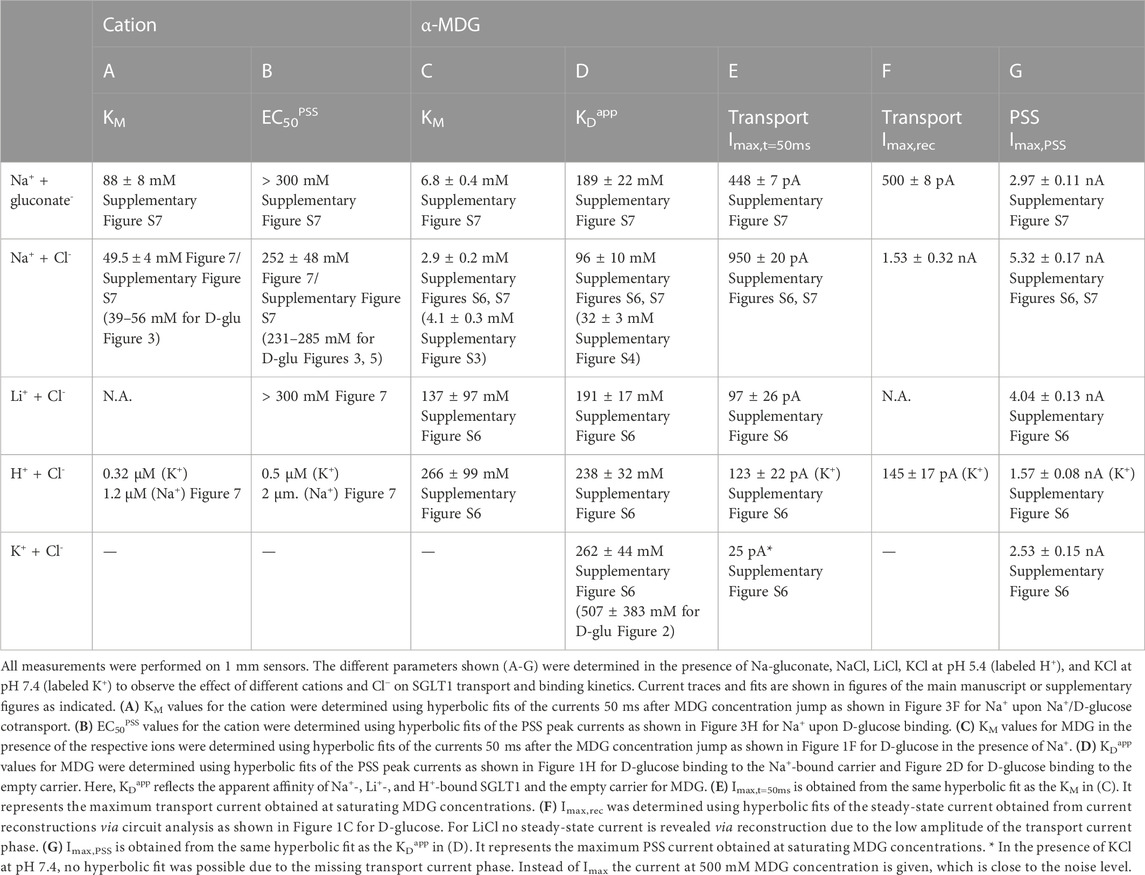
TABLE 2. Kinetic parameters obtained from transport and PSS currents using different cations and anions upon MDG concentration jumps.
3.3.1 Na+/sugar cotransport using α-methyl-D-glucose
For characterization of Li+ and H+/sugar cotransport, we used MDG instead of D-glucose as we anticipated reduced transport currents for Li+- and H+-coupled sugar translocation compared to Na+/sugar cotransport. MDG concentration jumps achieve higher transport Imax values (Table 1), therefore improving the signal-to-noise ratio for the transport current.
The Na+ concentration dependence upon 250 mM MDG jumps (Figure 7A) is similar compared to D-glucose (Figure 3B), but with a more pronounced transport phase, as expected. The EC50PSS for Na+ in the presence of MDG is 252 ± 48 mM (Figure 7C), in good agreement with the value in the presence of D-glucose (285 ± 39 mM, Figure 3H). The KM value for Na+ in the presence of MDG is 50 ± 4 mM (Figure 7C) and agrees with the KM in the presence of D-glucose (52 ± 13 mM, Figure 3F).
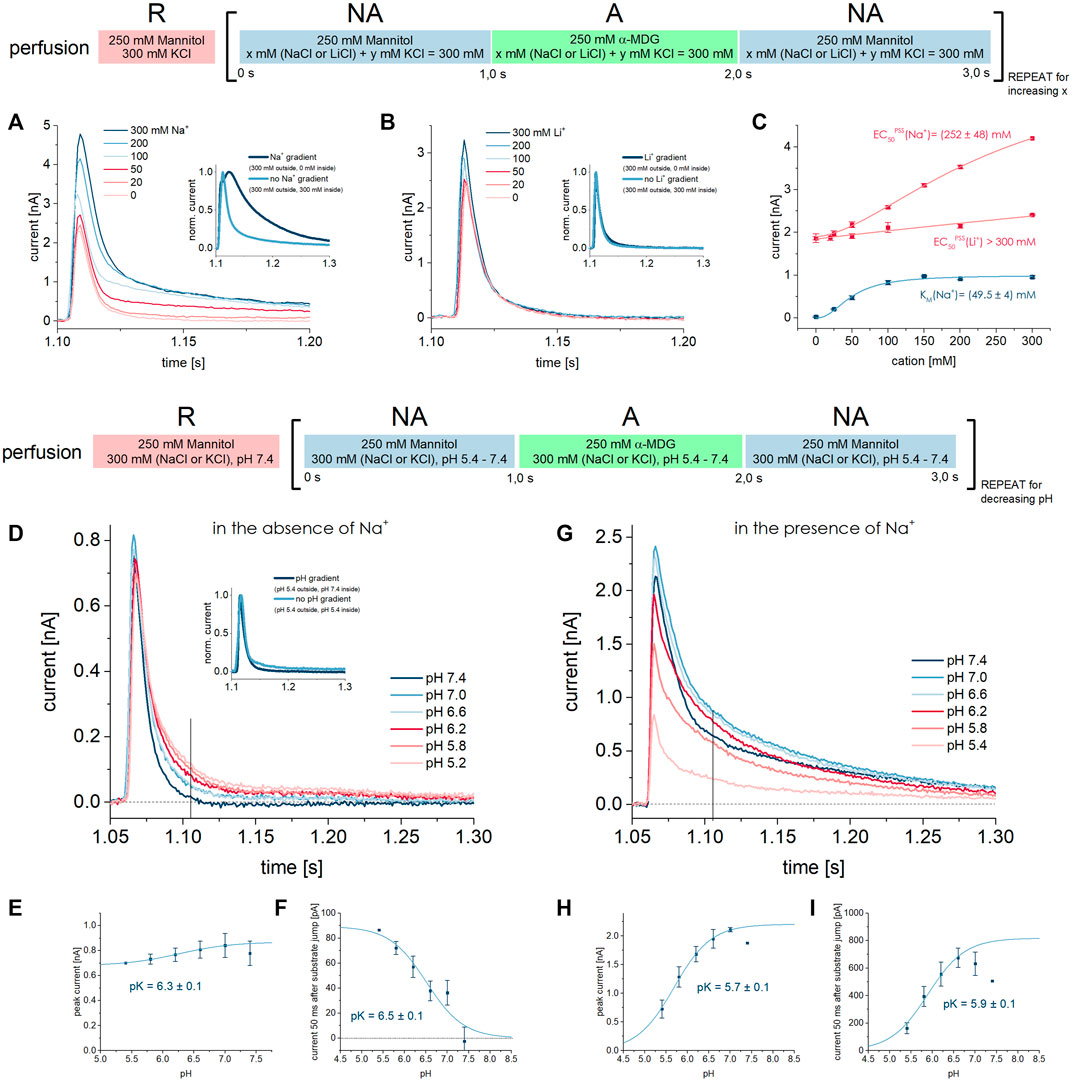
FIGURE 7. Effect of Na+, Li+, and H+ on PSS and transport currents. All current traces were recorded in the presence of different Na+, Li+ or H+ concentrations in all measurement solutions upon 250 mM MDG concentration jumps. Averaged data of n = 5 different sensors is shown. (A) Current traces were recorded at pH 7.4 in the presence of different Na+ concentrations in all measurement solutions. The inset compares the current trace where Na+ is only available in the external NA and A solutions and absent in the internal R solution (dark blue trace), leading to an inward directed Na+ gradient and consequently to an increased transport phase. (B) Same as (A) but with different Li+ concentrations as indicated. The inset shows that a Li+ gradient does not affect the current trace. (C) Li+ and Na+ dependent peak currents and currents 50 ms after substrate jump are fitted using a hyperbolic equation to derive EC50PSS or KM values, respectively. The PSS peak current observed in the Li+ dataset at 0 mM Li+ was normalized to the PSS peak current observed in the Na+ dataset at 0 mM Na+. The EC50PSS for Li+ could only be estimated to be > 300 mM. (D) Current traces were recorded in the absence of Na+ at different pH values as indicated. The inset shows that a H+ gradient does not affect the current trace. The vertical line indicates the time point at which the transport current is measured. (E) PSS peak currents are fitted using the titration equation I(t) = Imax/(1 + 10^(pK-pH)) to determine an apparent pK of 6.3 ± 0.1 for MDG binding in absence of Na+. (F) Currents 50 ms after substrate jump are fitted using the titration equation I(t) = Imax/(1 + 10^(pH-pK)) to determine an apparent pK of 6.5 ± 0.1 for H+/MDG cotransport in absence of Na+. (G) Current traces were recorded in the presence of 300 mM Na+ at different pH values as indicated. The vertical line indicates the time point at which the transport current is measured. (H) PSS peak currents are fitted using the titration equation I(t) = Imax/(1 + 10^(pK-pH)) to determine an apparent pK of 5.7 ± 0.1 for MDG binding in the presence of Na+. (I) Currents 50 ms after the substrate jump are fitted using the titration equation I(t) = Imax/(1 + 10^(pK-pH)) to determine an apparent pK of 5.9 ± 0.1 for H+/MDG cotransport in the presence of Na+.
We also applied a Na+ gradient by reducing the internal Na+ concentration to zero before activating SGLT1 in the presence of 300 mM Na+ (inset of Figure 7A). As shown before, the transport current phase increased 3-fold (Bazzone et al., 2022a). This confirms that the transport rate depends on the Na+ release step, as previously reported (Parent et al., 1992b; Loo et al., 2006).
3.3.2 Li+/sugar cotransport is 10 times slower
When repeating the assay discussed in Section 3.3.1, but replacing Na+ with Li+, we observed current signals that behaved drastically different (Figure 7B): (1) there is no clearly visible transport current phase and no Li+ dependence of the slow current component; (2) the sugar-induced PSS peak current increases with increasing Li+ concentrations, but to a much lower extent than with Na+; (3) the EC50PSS value for Li+ is >300 mM (Figure 7C) and likely much higher than for Na+ (252 ± 48 mM).
To potentially enhance a transport current below resolution, we applied a Li+ gradient by reducing the internal Li+ concentration to zero (inset of Figure 7B). An inward directed Li+ gradient did not increase the slow current component significantly. This indicates that cation release is not the rate limiting step in Li+/sugar cotransport and/or that Li+/sugar cotransport is below the resolution limit, hence at least 10 times slower than Na+/sugar cotransport. Hirayama et al. found that the KM for Li+ is three times higher than for Na+ and that Imax for Li+/sugar cotransport is reduced to 80% compared to Na+/sugar cotransport (Hirayama et al., 1997). In addition, apparent affinity for Li+ was shown to be much more sensitive to membrane voltage, leading the authors to conclude that Li+-coupled transport might not be detectable at 0 mV (Hirayama et al., 1997).
3.3.3 H+ and Na+ compete for the same binding site
It is long known that protons can rescue electrogenic sugar transport in SGLT1 when Na+ is not available (Hoshi et al., 1986; Hirayama et al., 1994). We have measured sugar-induced currents in SGLT1 in absence of Na+ at different pH values. While the peak current reflecting the PSS current component slightly decreases with acidification (Figures 7D,E), the slowly decaying transport current component increases when more protons are available (Figures 7D,F).
At acidic pH, when H+/sugar transport is saturated, transport Imax is about 8 times lower compared to Na+/MDG cotransport at saturating Na+ concentrations (Table 2). Hence, in our system H+-coupled transport appears slower than Na+-coupled transport. The corresponding relative transport rate observed in TEVC experiments is 1.7 (Longpré and Lapointe, 2011), and significantly lower compared to our result. Other authors described a relative Imax of 0.5 (Hirayama et al., 1994; Wright et al., 1994; Hirayama et al., 1997); they found that H+-coupled transport appeared faster than Na+-coupled transport, even at a low membrane voltage of −10 mV. Quick et al. found that replacing Na+ with H+ has no impact on Imax at −110 mV (Quick et al., 2001).
We used a titration equation to derive an apparent pK of proton binding to SGLT1 of 6.5 ± 0.1 from the pH dependence of the transport current 50 ms after the sugar jump (Figure 7F). We will refer to this value as pKSS since the pK is derived from the (steady-state) transport current. It corresponds to an apparent affinity for H+ of 0.3 µM. In the literature we found pK values in the absence of Na+, which range from 5.2 (7 µM) (Hirayama et al., 1997; Quick et al., 2001) and 5.5 (3 µM) (Hirayama et al., 1994) to 5.7–6.0 (1–2 µM) (Wright et al., 1994), which is close to our result. When the PSS peak currents are used for analysis, we derive an apparent pKPSS of 6.3 ± 0.1 (Figure 7E). Interestingly, the pH dependence of both PSS and transport currents yields similar pK values; hence, the H+ KM for H+/sugar transport and the H+ EC50PSS are essentially the same, in contrast to the Na+ KM and Na+ EC50PSS that differ by a factor of 5 (Figure 3).
Like a Li+ gradient, a pH gradient does not affect transport Imax, indicating that H+ release is not rate limiting in H+/sugar cotransport (Figure 7D inset). Since the external H+ concentration clearly affects transport Imax, the H+ binding step affects the rate limiting reaction under the given conditions.
In the presence of Na+, the pH dependence is more complex due to competition between Na+ and H+ for the same binding site. At alkaline pH Na+-bound transporters dominate. Here, the PSS peak current induced by 250 mM MDG is maximized and SGLT1 performs Na+/sugar cotransport, which is observed by the increased transport phase (Figure 7G). With acidification, the dominated transporter state is H+-bound. In the H+-bound state, 250 mM MDG generates lower PSS peak currents and lower transport currents at the same time. Lower transport currents may be explained by reduced Imax and/or increased sugar KM in H+/sugar cotransport compared to Na+/sugar cotransport. Lower PSS peak currents may be a consequence of higher KDapp for MDG binding to the H+-bound state and/or a reduced PSS charge translocation upon MDG binding to H+-bound SGLT1. Both will be addressed within the next two sections, when the MDG concentration dependence during H+/sugar cotransport is investigated.
In the presence of Na+, the pKPSS (5.7 ± 0.1) (Figure 7H) and pKSS (5.9 ± 0.1) (Figure 7I) are both decreased compared to measurements in the absence of Na+, because more protons are required to saturate the common binding site due to competition with Na+.
3.3.4 Cation dependent KM and transport Imax for α-methyl-D-glucose
To understand why transport and PSS peak currents are affected when Na+ is replaced by Li+ or H+, we determined KM, KDapp and relative Imax values for transport and PSS currents (Supplementary Figure S6). We used MDG concentrations from 1 to 512 mM to activate SGLT1 in the presence of Na+, Li+, H+ and K+. To compare KM and Imax values, we have analyzed the MDG-dependent currents about 50 ms after the sugar jump.
Transport currents are best resolved in the presence of Na+ with an Imax value of 950 pA. When Na+ is replaced by K+, no transport phase is observed (I ≈ 25 pA). In the presence of Li+ and H+ Imax values for the transport current are 10 and 8 times lower compared to Na+/MDG cotransport, 97 pA and 123 pA, respectively. This is close to the resolution limit of the technique.
The KM value for MDG transport coupled to H+ is 266 mM and 92-fold higher compared to Na+/MDG cotransport. The cation dependence of sugar KM also strongly depends on membrane voltage: in the H+-coupled transport mode, at −150 mV the KM for MDG increases 25-fold (Hirayama et al., 1997); at −110 mV, KM increases about 20-fold (Quick et al., 2001); at −50 mV it increases 45-fold (Hirayama et al., 1997) to 100-fold (Hirayama et al., 1994). These values correlate well with the 92-fold increase in KM we observed at 0 mV.
For Li+/MDG cotransport we determined a KM value for MDG of 137 mM which is 47-fold higher compared to Na+/MDG cotransport. This also approximates values found in the literature: the KM for MDG increased 11-fold at −150 mV and 187-fold at −50 mV when Na+ is replaced with Li+ (Hirayama et al., 1997).
Taken together, the reduced transport current in H+- and Li+-coupled compared to Na+-coupled transport modes is caused by both reduced Imax and increased sugar KM, in agreement with literature.
3.3.5 Cation-dependent KDapp and pre-steady-state Imax for α-methyl-D-glucose
KDapp values for MDG are derived from PSS peak currents. Apparent MDG affinity is highest in the presence of Na+ and decreases in the order: Na+ (96 mM) > Li+ (191 mM) > H+ (238 mM) > K+ (262 mM). The change in KDapp in the presence of Li+, H+ and K+ is minor. This shows that binding cooperativity between MDG and the cation is only observed in the presence of Na+; the affinity for MDG increases in the presence of Na+, but not as strikingly in the presence of Li+ or H+. In this series of experiments, the KDapp for MDG was higher compared to the analysis of the dataset in Table 1 and Supplementary Figure S4, possibly due to the combined effects of changing to a different sample batch, and a different range of concentrations used.
The cation species has a large effect on the PSS charge translocation, indicated by different Imax values for the sugar-induced PSS peak current (Table 2). PSS Imax values increase in the order: H+ (1.57 nA) < K+ or empty carrier (2.53 nA) < Li+ (4.04 nA) < Na+ (5.32 nA). Since Li+, H+ and Na+ are all monovalent cations, the differences within the PSS charge translocations may not be attributed to the charge of the bound cation before the sugar binds. Rather, it is a consequence of the bound cation dictating different conformational states upon sugar binding as also proposed for the H+/sugar transporter XylE (Bazzone et al., 2022b).
Taken together, the reduced PSS current in Li+ and H+/sugar cotransport compared to Na+/sugar cotransport is caused by both a higher KDapp value–due to the lack of cooperativity between Li+ or H+ and the sugar–and a reduced PSS electrogenicity (lower Imax) when sugar binds to the Li+- or H+-bound carriers.
3.3.6 Chloride affects all kinetic parameters during Na+/D-glucose cotransport
We performed SSME experiments in the presence and absence of Cl−, replacing it with gluconate and found a high impact of Cl− on SGLT1 kinetics as discussed in Supplementary Results S2.3.1 (Table 2; Supplementary Figure S7). In brief, in the presence of Cl− KD,Naapp and KM values for the sugar are decreased, while the transport rate (Imax) is increased. In addition, Cl− affects the PSS charge translocation, indicating a large impact on the conformational state of SGLT1 upon sugar binding, similarly as described for the cations.
We also performed SSME experiments using different Cl− concentrations, determining the KM and EC50PSS for Cl− being 6.8 ± 2.8 mM and 21 ± 2 mM, respectively (Supplementary Results S2.3.2, Supplementary Figure S8).
3.4 The 11-state kinetic model
Based on the experimental results we developed an 11-state kinetic model (Figure 8). The model differs from previously described models (Loo et al., 2006; Longpré et al., 2012), mainly because these models are based on data derived from conventional electrophysiology which includes voltage triggered PSS currents that are attributed to steps within the empty carrier translocation. We discussed previously that we do not detect these PSS currents in SSME (Bazzone et al., 2022a), because SSME is based on substrate jumps. Hence, we simplified the empty carrier translocation into one single step (8→1).
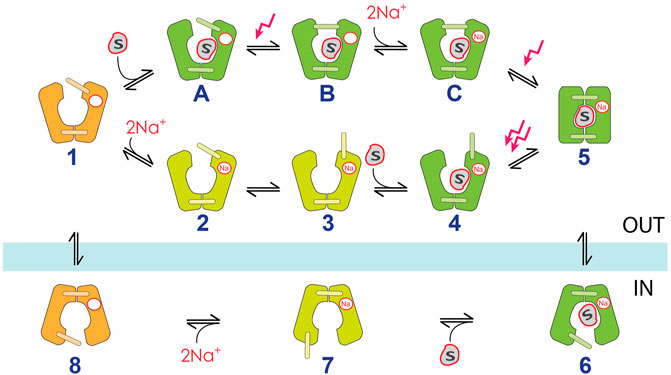
FIGURE 8. 11-state kinetic model for Na+/D-glucose cotransport in SGLT1. Empty carrier conformations are shown in orange, SGLT1 conformations only bound to Na+ are shown in yellow and sugar-bound conformations are highlighted green. Inward-facing conformations are shown below the blue bar, outward-facing conformations are shown above. Rate and equilibrium constants used for the simulation of the model are provided in Supplementary Table S3. They were derived based on experimental data, calculations or literature. The states within the main transport cycle are labelled numerically from 1 to 8 and includes the ordered binding model when Na+ binds before the sugar (states 2–4, “Na+ first”). When sugar binds before Na+, an alternative pathway is followed, involving the states A–C (“sugar first”). Electrogenic steps are indicated as red arrows: the only required electrogenic reactions to simulate PSS and steady-state currents observed in SSME are related to substrate binding to the outward facing carrier. Within the “Na+ first” pathway, only the transition upon sugar binding to the Na+-bound carrier (4→5) is electrogenic. We therefore assume the total charge displacement for this transition being 2 elementary charges. Within the “sugar first” pathway, the transition upon sugar binding to the empty carrier (A→B) translocates 1.2 of an elementary charge, while the transition upon Na+ binding to the sugar-bound carrier (C→5) translocates 0.8 of an elementary charge as found previously (Bazzone et al., 2022a). The total transporter current is calculated by I = 1.2*([A]*kAB—[B]*kBA) + 0.8*([C]*kC5—[5]*k5C) + 2.0*([4]*k45—[5]*k54). Please note that the different conformational states within the substrate-bound carrier are illustrations that not necessarily represent the occurring conformational changes. For visualization purposes, we pictured the conformational states using different positions of the extracellular gate (states B and 3) and a major conformational transition to a fully occluded conformation (state 5). Electrogenic conformational transitions do represent local conformational transitions, which may rather follow an induced fit mechanism upon substrate binding, rearranging the local structure of the binding pockets, as proposed previously for H+-coupled sugar transporters (Bazzone et al., 2022b).
The model considers a random binding order of Na+ and the sugar in the outward open carrier. This is required to explain the ability of the sugar to bind to the empty carrier and the different apparent affinities of the sugar to SGLT1 in the absence (Figure 2) and presence of Na+ (Figure 1/Figure 4). The outward open carrier (state 1) can either bind Na+ first (1→2), following sugar binding and alternating access–as assumed in previously proposed kinetic models–or it binds the sugar first (1→A), following Na+ binding and alternating access. The respective pathways will be referred to as “Na+ first” and “sugar first”.
The sugar-induced PSS current observed in SSME is attributed to an electrogenic reaction following sugar binding to the empty (1→A→B) or Na+-bound (3→4→5) carrier (Bazzone et al., 2022a). We also showed that Na+ binding triggers a PSS current when sugar was bound before (B→C→5), but not when Na+ binds to the empty carrier (1→2→3) (Bazzone et al., 2022a). Hence, we introduce 4 intermediate states within the transport cycle following the binding of each substrate within the outward facing carrier, accounting for one non-electrogenic and three electrogenic reactions. These reactions represent substrate-induced local conformational transitions within the carrier, displayed as different movements of the extracellular gate (Figure 8). However, they may be also attributed to substrate occlusion or transitions within the binding pocket potentially representing an induced fit mechanism. While the exact origin of the substrate-induced electrogenic events remains unclear, we do not observe electrogenic binding, as sugar binding is described to happen with a rate of 111.000 M−1s−1 (Longpré et al., 2012) or 45.000 M−1s−1 (Loo et al., 2008). Electrogenic binding is not consistent with our data, since (1) kobs,PSS would depend on sugar concentration in a linear manner–not hyperbolic (Figure 4C)—and (2) kobs would be 450 s−1 at 10 mM sugar and beyond the time resolution of the measurement (300 s−1), instead of 100 s−1 and even lower for other sugars (Supplementary Figure S4).
Upon substrate binding, the outward-facing substrate occluded state then undergoes alternating access to the inward-facing conformation (5→6). Since all experiments were carried out via substrate jumps from the extracellular side, only PSS currents representing transitions in the outward-facing carrier are observed. To simplify the model, we neglected similar electrogenic transitions and the random order substrate release in the inward facing carrier (6→7→8).
Many parameters within the model were established during SSME measurements. Other parameters were set based on existing models by Loo et al. (2006) and Longpré et al. (2012) and a few parameters were required to be set to a specific range for the simulation to match the experimental data for steady-state and/or PSS currents or to fulfill the law of detailed balance (Alberty, 2004). A comparison between experimental data and model output can be found in Supplementary Table S2, which is also discussed in Supplementary Results S2.4. An overview of all model parameters and their reasoning is shown in Supplementary Table S3.
4 Discussion
SGLT1 is a well-characterized model for Na+/sugar cotransport (Wright et al., 2011). However, information about substrate/transporter interactions are scarce due to the lack of technologies to measure sugar binding and the following conformational transitions directly. Sugar specificity for SGLT1 was analyzed using substrate jumps in TEVC experiments, but without visible sugar-induced PSS components, possibly due to low time resolution of the solution exchange (Kamitori et al., 2022). We recently showed that SSME opens a new perspective, being able to detect sugar binding and transport triggered by sugar concentration jumps in real-time and at high time resolution in one single assay (Bazzone et al., 2022a).
Based on this finding, we characterized the kinetics of the sugar translocation pathway for various sugar substrates and cations in SGLT1, concluding information about cooperativity, KM and KDapp values and rate constants for the sugar-induced conformational transitions. We investigated the effects of sugar and cation species on the PSS charge translocation and relative sugar translocation rates. The data was used to develop a kinetic model to describe PSS and steady-state kinetics observed in SSME. The discussion will guide the reader through the different steps of the proposed kinetic model, presenting experimental evidence for the specific reactions.
4.1 Order of substrate binding and cooperativity between cation and sugar
It has long been known, that binding of external Na+ changes the conformation of the sugar-binding domain so that residues involved in sugar recognition are exposed to the external medium (Peerce and Wright, 1984; Hirayama et al., 2007). Na+ binding increases the open probability of the extracellular gate, enabling glucose to enter its binding site (Sala-Rabanal et al., 2012; Loo et al., 2013; Adelman et al., 2016; Gorraitz et al., 2017). Sugar binding then triggers closing of the extracellular gate to occlude the substrate from the external solution. The conclusion was a strict order of substrate binding, with Na+ binding first (Wright et al., 2011).
4.1.1 Sugar binding occurs in the absence of Na+
While Na+ binding is not observed in SSME experiments (Bazzone et al., 2022a), sugar binding triggers an electrogenic conformational transition, allowing its detection. Interestingly, we detected sugar binding in the absence of Na+, clearly indicating that sugar can bind to the empty carrier and that Na+ binding is not a prerequisite for sugar binding (Figure 2). However, KDapp for the sugar is massively increased in the absence of Na+ (Figures 2D,E), consistent with previously described observations.
4.1.2 KM for Na+ depends on sugar concentration
Following the investigation of sugar binding in the absence of Na+, we studied cooperativity between Na+ and sugar binding. It was previously shown that KM values for the sugar depend on external Na+ concentration and vice versa (Parent et al., 1992a; Wright et al., 2011). We confirmed that the KM for the sugar decreases with increasing Na+ concentration, in agreement with Na+ binding before the sugar (Figure 5C). However, we see a similar effect in the opposite direction: the KM for Na+ also decreases when higher sugar concentrations are used (Figure 5D). This clearly indicates that under transport conditions, a fraction of the transporter population binds sugar before Na+, supporting a random binding order. The KM for Na+ decreases most for sugar concentrations between 1 and 20 mM (Figure 5D) and sugar concentrations in the small intestine may reach up to 50 mM (Ferraris et al., 1990). Hence, sugar binding to the empty carrier is relevant under physiological conditions. Using physiological Na+ and sugar concentrations, the 11-state model predicts that 4.1% of SGLT1 molecules use the ‘sugar first’ pathway.
4.1.3 Cooperativity between Na+ and sugar has two root causes
Like KM values, we found that KDapp values for Na+ and the sugar depend on the concentration of the respective co-substrate (Figure 5), indicating an allosteric binding mechanism. However, the decrease of KDapp is lower compared to the decrease of KM when co-substrate concentrations increase. KDapp values for D-glucose increase 5.9-fold when the Na+ concentration is decreased from 300 mM to 20 mM. The increase of the respective KM value is 55-fold (Figure 5C). We conclude that cooperativity between Na+ and the sugar is not only achieved by enhancing the sugar affinity, but also because Na+ binding improves the energy landscape for the conformational transitions leading to transport, adjusting the rate constants and consequently lowering the KM below the KD,Na.
4.1.4 Cooperativity is not observed when Na+ is replaced by H+ or Li+
For MDG we determined KM values between 2.9 mM (Supplementary Figure S6) and 4.1 mM (Supplementary Figure S3) and KD,Naapp values between 32 mM (Supplementary Figure S4; Table 1) and 96 mM (Supplementary Figure S6; Table 2). Since the KM is strikingly decreased compared to KD,Naapp, MDG transport coupled to Na+ is kinetically driven - similar to D-glucose. In contrast, KM values for MDG in the presence of H+ (266 mM) and Li+ (137 mM) are not decreased compared to the respective KDapp values (238 mM and 191 mM, respectively) and are also identical to the KD,Kapp for MDG binding to the empty carrier (262 mM) (Table 2). Hence, Na+ binding—but not binding of H+ or Li+—causes a conformational state of SGLT1 that is required for efficient sugar binding and translocation. Since Vmax is also dramatically reduced in Li+- and H+-coupled cotransport (about 90%, Figure 7 and Table 2), low KM values and a high transport capacity are only achieved with Na+ as the co-ion. In addition, the missing binding cooperativity between H+ or Li+ and the sugar indicates a higher probability for the “sugar first” pathway in H+- or Li+-coupled sugar cotransport.
4.2 The road to real sugar affinities
In contrast to the vast amount of available steady-state data for SGLT1, experimental KD values are scarce. Binding is more difficult to assess compared to substrate transport. A number of equilibrium techniques are available to assess binding of a ligand to a receptor (Ma et al., 2018), but they are not suitable for transporters because substrates are translocated. KD values for transporter substrates may be derived from PSS measurements: substrate binding induces conformational transitions within the protein, which can be detected, e.g., using optical assays. But depending on the number of reaction steps between binding and the detected transition and depending on the rate constants of the individual reaction steps, the determined KD might be an apparent KD and significantly different from the real KD (Johnson, 2019; Jarmoskaite et al., 2020).
4.2.1 Sugar-induced pre-steady-state reveals KD for sugar binding
The sugar-induced PSS current recorded in SSME is a direct real-time response to sugar binding. We proposed before it may represent an electrogenic induced fit of SGLT1 following sugar binding (Bazzone et al., 2022a). A similar model was applied for H+/sugar transporters (Bazzone et al., 2022b). We concluded that the EC50 value for the PSS current is very close to the real KD, hence defining it as KDapp.
To establish how close the real sugar KD and the experimentally determined KDapp are, we simulated PSS currents using the 11-state model. For the simulations we used the experimentally determined KDapp values as KD. From the simulated PSS currents we found EC50 values very close to the defined KD values (Supplementary Table S2): (1) for sugar binding to the Na+-bound carrier we defined KD = 26 mM as experimentally obtained via the analysis of concentration dependent kobs values in the presence of Na+ (Figure 4C). We found an EC50 from the simulated PSS currents of 27 mM using the same analysis procedure. When peak currents are analyzed from the simulated PSS currents an EC50 of 20 mM is obtained, close to the experimentally determined value of 15.9 ± 1.2 mM (Figure 1I). (2) For sugar binding to the empty carrier we defined the KD = 200 mM as experimentally observed (Figure 2). From the simulated PSS currents we obtained an EC50 of 183 mM. Both clearly demonstrate that the EC50 of the PSS current in fact may be used as a measure for KD.
4.2.2 Comparison of KD values with the literature
Experimentally determined KM values are often equated with KD values in order to perform kinetic simulations on SGLT1 (Loo et al., 2006; Loo et al., 2008). For vSGLT, sugar binding and transport were measured using radiolabeled galactose. Here, the determined KDapp value of 180 µM (Li et al., 2015) indeed equals the KM for steady-state transport (158 µM) (Turk et al., 2000). In contrast, using SSME we found that for a given SGLT1 substrate, the KDapp value is always higher than the KM value (Table 1).
Potential discrepancies between KDapp values determined by different techniques may originate from different read-outs. For DNA polymerase it was shown that initial weak binding of a nucleotide to an open state is followed by a conformational transition to a closed state, which yields an apparent KD three orders of magnitude lower than the KD of nucleotide binding (Johnson, 2019). SGLT1 and other transporters might be very similar: while the real KD is hardly accessible during an experiment, the apparent KD (or associated rate constants) determined using most techniques is a consequence of substrate occlusion or major conformational transitions upon alternating access. The detection is often limited to the equilibrium between the substrate-free, open; and the substrate-bound, closed transporter state, with optimum interaction between the substrate and the transporter leading to high apparent affinities or low KDapp values.
As for DNA polymerase, the real KD for sugar binding to SGLT1 might be several orders of magnitude higher than the apparent KD derived from equilibrium techniques. The real KD may only be identified from kinetic measurements. In SSME, a fast reaction is measured in real-time (250 s−1, Figure 4), likely representing an induced fit mechanism - a fast substrate-induced, local conformational transition. This is in contrast to the formation of an occluded state which is believed to represent a high energy intermediate on the road to alternating access (Forrest et al., 2011) that was considered to be slow, with a rate of 50 s−1 (Loo et al., 2006) or 100 s−1 (Longpré et al., 2012).
4.2.3 KD values for cations cannot be determined, but EC50PSS was calculated
Since Na+ binding to the empty carrier does not induce PSS currents in SSME, KD values for Na+ are not accessible (Bazzone et al., 2022a). When examining the cation concentration dependence of the sugar-induced PSS current, we estimate an EC50PSS for the cation instead. Within the 11-state model, the sugar-induced PSS reaction is separated by two steps from the Na+ binding. Hence, the sugar binding kinetics likely affects the cation dependence of the sugar-induced PSS current and a real Na+ KD may not be derived. However, for Na+ a KD value of 20 mM was determined experimentally using a thermodynamic approach (Loo et al., 2013) that was used for our model simulations.
4.3 The electrogenic induced fit detected via solid supported membrane-based electrophysiology upon sugar binding
Beside sugar affinity, the sugar-induced PSS current contains two more key information about the mechanism of sugar translocation in SGLT1. First, the impact of different sugar and cation substrates on the PSS charge translocation reveals the existence of different conformational states (Bazzone et al., 2022b). Second, rate constants for the underlying conformational transition can be derived from the current decay.
4.3.1 The molecular origin of the sugar-induced electrogenic conformational transition
Sugar-induced PSS currents have been detected in SSME recordings of other sugar transporters, such as the Na+/melibiose transporter MelB (Ganea et al., 2011) and the H+/sugar transporters LacY (Garcia-Celma et al., 2010), FucP (Bazzone et al., 2016) and XylE (Bazzone et al., 2016; Bazzone et al., 2022b). We have shown previously that the sugar-induced PSS charge translocation within the H+-coupled sugar transporter XylE reflects an electrogenic conformational transition of the sugar-bound carrier, potentially an induced fit of SGLT1 upon sugar binding (Bazzone et al., 2022b). Since sugars carry no charge, different charge translocations must result from the movement of charged protein residues. This indicates that different charge translocations correlate with different conformational transporter states upon sugar binding, resulting from different degrees of movement of charged protein residues along the membrane axis. Interestingly, this charge movement does not seem to correlate with the movement of a single charged amino acid within the transporter, but rather represents a change in the surface potential of the transporter upon substrate binding. This is indicated by mutagenesis studies on the H+/sugar cotransporter LacY: fast electrogenic PSS currents have been observed in SSME recordings for all tested mutants unless the mutation completely blocks sugar binding (Gaiko et al., 2013). Similarly, voltage steps triggered PSS currents recorded on SGLT1 have not been attributed to the movement of single amino acids during empty carrier translocation, but to the movement of protein dipoles (Wright et al., 2011).
4.3.2 The cation affects the conformational state of SGLT1 after sugar binding
A substantial PSS charge translocation upon binding of the major sugar substrates potentially reduces the energy barrier of the following conformational transition leading to alternating access of the binding sites, since a lower amount of charge needs to be transferred across the membrane. The alternating access was described to be rate limiting within the substrate translocation pathway for H+- (Madej et al., 2014) and Na+-coupled cotransporters (Forrest et al., 2011). Binding of the major substrates already transfers a fraction of charge across the membrane, possibly leading to a reduced energy barrier and thus faster translocation rates. In fact, binding of the major sugar substrate D-xylose generates the greatest PSS charge translocation in XylE (Bazzone et al., 2022b).
In contrast to the H+/xylose transporter XylE, we could not find major differences in Qmax, induced by different sugar substrates in SGLT1 (Table 1, Supplementary Figures S4, S5). When Qmax does not depend on the sugar species, similar conformations may result upon binding of different sugar substrates. This is in agreement with the observation that different sugar substrates in SGLT1 show also very similar transport Imax values, since substrate specificity in SGLT1 is defined by KM (Table 1).
On the other hand, the PSS charge translocation changes dramatically depending on the bound cation. The greatest PSS peak currents are observed for the Na+-bound carrier (100%), followed by the Li+-bound carrier (76%), the empty carrier (48%) and the H+-bound carrier (30%) (Table 2). The PSS charge translocation does not correlate with the charge of the cation, which is the same for Na+, Li+, and H+. PSS charge translocation rather correlates with different local conformational transitions around the cation binding site, induced by the sugar. Upon sugar binding, cations and charged protein residues are shielded from the water environment to a different extent. This leads to different transporter states, depending on the type of cation, potentially comprising different energy levels which enhance or inhibit the following transition leading to cation/sugar cotransport. It might be energetically beneficial for cation/sugar cotransport, when the extent of cation shielding upon sugar binding is high (as for Na+), since the charge required to translocate the cation across the membrane barrier is reduced, leading to higher rates for cation/sugar translocation. This is in agreement with the drastically reduced Vmax in Li+- and H+-coupled sugar cotransport (Table 2; Figure 7). Our results also match with previous conclusions that the type of cation determines the conformation of SGLT1 upon sugar binding and that this conformation mainly affects translocation rates (Hirayama et al., 1997). As a side note, the PSS charge translocation is also affected by chloride: In the presence of Na+ the PSS peak current is reduced to 56%, when chloride is removed (Table 2; Supplementary Figure S7), indicating that Cl−—in addition to the bound cation—plays a crucial role for achieving a favorable conformational state upon sugar binding.
4.3.3 Rate constants for the electrogenic induced fit of SGLT1 upon sugar binding
From the decay time of the PSS currents, we have determined rate constants kobs for the underlying electrogenic reaction (Figures 2B, 4B). In the presence of Na+, kobs is sugar concentration dependent, allowing the derivation of kon and koff values using a model equation that was used for similar PSS currents previously (Garcia-Celma et al., 2010; Bazzone et al., 2022b). For D-glucose we determined forward and reverse rates for the electrogenic induced fit of 208 s−1 and 56 s−1, respectively (Figure 4C). In the absence of Na+ we found kobs ≈ 90 s−1, independent of sugar concentration between 5 mM and 500 mM (Figure 2). The concentration dependence of both types of sugar-induced PSS currents is described by the 11-state kinetic model (Supplementary Results S2.4, Supplementary Table S2).
kobs values in the presence of Na+ are similar for different sugar substrates (Supplementary Figure S4). In the absence of Na+ kobs is between 35 s−1 and 95 s−1 (Table 1; Supplementary Figure S5). Moreover, kobs values are not noticeably affected when Na+ is replaced by Li+ or H+ (Figure 7). Altogether, the kinetics of the sugar-induced conformational transition seems to vary in a very limited frame and seems to be faster than the transport rate of SGLT1 under all conditions tested, hence likely not rate limiting for steady-state transport.
4.4 Evidence for rate limiting steps during sugar translocation
Steady-state transport rates for SGLT1-mediated Na+/D-glucose translocation were independently reported to be 28 s−1 (Loo et al., 2006) and 35 s−1 (Longpré et al., 2012). For natural substrates and at −150 mV two different kinetic models assume the rate limiting steps to be either the voltage independent internal Na+ release with 5 s−1 (Loo et al., 2006) or the voltage independent empty carrier translocation with 59 s−1 (Longpré et al., 2012).
4.4.1 Empty carrier translocation is the slowest step during Na+/D-glucose cotransport
To estimate the rate limiting step at 0 mV, we tested the transport rate in the presence and absence of 300 mM internal Na+. When internal Na+ is replaced by K+, the slowly decaying transport current—corresponding to the transport rate—increased by a factor of 3.5 (inset of Figure 7A), in agreement with our previous study (Bazzone et al., 2022a). This may indicate that Na+ release is the rate limiting step. However, the internal Na+ concentration also affects the equilibrium of the Na+ release step. At high Na+ concentrations, the concentration of the inward facing empty carrier and therefore the rate of the empty carrier translocation will be reduced. Thus, the alternating access of the empty carrier may be rate limiting as well. In our model we assumed the slowest rate constant being the empty carrier translocation with k81 = 15 s−1 as used by Loo et al. (2006), but a fast Na+ release step with k78 = 500 s−1.
This observation is only valid for Na+-coupled sugar transport, but not when Na+ is replaced by Li+ or H+. In Li+- and H+-coupled transport modes, Vmax is decreased 10-fold compared to Na+/sugar cotransport (Figure 7; Table 2), and independent of the cation gradient (insets of Figures 7B,D). Hence, cation binding or the alternating access of the substrate-bound carrier becomes the rate limiting step in Li+- and H+-coupled transport modes at 0 mV.
4.4.2 Induced fit of SGLT1 upon sugar binding might be rate limiting for minor substrates
For natural substrates the rate constant for the sugar translocation step or alternating access of the substrate-bound carrier was assumed to be 50 s−1 (Loo et al., 2006) and 100 s−1 (Longpré et al., 2012) and slightly faster than Vmax, hence not rate limiting. However, it was already shown that sugar translocation becomes rate limiting when substrates with lower turnover rates are used, as demonstrated for indican (Loo et al., 2008).
We found an indication of a rate limiting step in the sugar translocation pathway for transport of D-glucose and other natural sugars: Using SSME, all tested sugar substrates show higher transport rates than D-glucose (Table 1; Supplementary Figure S3), indicating that the rate for D-glucose translocation is limited compared to other substrates.
For the major substrates (D-glucose, MDG, D-galactose), as discussed before, the sugar-induced transition detected as a fast PSS current in SSME is unlikely to represent the rate limiting step during sugar translocation. First, kobs for D-glucose under saturating conditions [≈250 s−1, Figure 4C and Table 1) is faster than the reported Vmax values (28–35 s−1, (Loo et al., 2006; Longpré et al., 2012)]. Second, slower kobs for the sugar-induced PSS reaction do not correlate with a reduced transport rate: the minor substrates (OMG, D-xylose) kobs values are reduced 2-3-fold, while the transport Imax is increased up to 2-fold compared to the major substrates (Table 1, Supplementary Figures S3, S4). On the other hand, the induced fit of SGLT1 might become rate limiting for the minor substrates, because transport Imax is increased and kobs for the induced fit is decreased.
4.4.3 Substrate occlusion or alternating access is the slowest step in the sugar translocation pathway
For the major substrates with low transport Imax and high kobs, the rate limiting step within the sugar translocation pathway must be after the fast sugar-induced transition, but still within the sugar translocation pathway, since the transport rate–proportional to Imax–depends on the sugar species (Table 1). We propose that the rate limiting reaction directly follows the sugar-induced electrogenic conformational transition we observe in SSME, and likely represents the sugar occlusion as previously proposed for the H+-coupled sugar transporter XylE (Bazzone et al., 2022b) or the alternating access of the substrate-bound carrier as illustrated in the 11-state model (Figure 8). In fact, alternating access of the substrate-bound carrier is believed to occur with a slow rate of 100 s−1 (Longpré et al., 2012) or 50 s−1 (Loo et al., 2006), which we adopted to use in our 11-state model (Figure 8, 5→6), thus defining it as the rate limiting step within the sugar translocation pathway for the major substrates.
We recently showed that substrates being transported with higher Imax exhibit lower apparent affinities (Bazzone et al., 2022b). In SGLT1 a similar observation was made: D-glucose holds the lowest KDapp and Imax values across all tested substrates, while D-xylose and OMG show high KDapp values and high transport rates. This observation can be explained by a simple energy landscape: when the energy level of the substrate-bound transporter is low (low KD, high affinity), the energy barrier for the subsequent conformational transition—which we assume to be the rate limiting step—is increased (lower Vmax). A transporter can increase transport capacity either by increasing Vmax for substrate translocation (increasing the energy level of the substrate-bound outward-facing carrier, hence reducing the energy barrier for the subsequent transition) or by increasing substrate affinity (decreasing its energy level), not both. Similar observations were made for indican: compared to MDG a five times higher affinity and a 100-fold decreased rate for the alternating access was described (Loo et al., 2008). We therefore suppose the rate of the alternating access of the substrate-bound carrier is increased for the minor substrates (OMG, D-xylose) compared to D-glucose due to their higher KDapp values.
4.5 Substrate specificity determinants
Substrate specificity is usually defined by the ratio Vmax/KM or kcat/KM as commonly used for enzymes (Johnson, 2019). However, there is substrate specificity on the level of substrate recognition and binding that may be different compared to steady-state conditions, because co-substrates might affect substrate affinity and energy barriers for conformational transitions during steady-state to different extents. In order to understand the molecular mechanisms behind substrate specificity, parameters beyond KM values may be considered.
4.5.1 KM defines substrate specificity over Vmax
The most frequently used parameters for assessing substrate specificity are KM and Vmax values. Transporters may increase their transport capacity for one substrate by either increasing the transport rate (Vmax) or increasing apparent affinity for transport (decreasing KM), as long as the physiological substrate concentration is not saturating. Hence, substrate specificity is indicated by an increased Vmax/KM ratio.
Vmax/KM is highest for D-glucose, but most interestingly D-glucose shows the lowest steady-state current (lowest Vmax), but highest apparent affinity (lowest KM) across all tested substrates, indicating that the determinant of sugar specificity in SGLT1 is given by low KM values; Overall, Imax is less affected than KM when different sugars are compared. Imax differs by a factor of 1.9, while KM values differ 160-fold across all tested sugars. We conclude that evolution did not optimize the transport capacity of SGLT1 by increasing Imax, but by increasing the apparent affinity for D-glucose.
4.5.2 Substrate specificity is not a result of sugar affinity to the empty carrier, but of cooperativity with Na+
Interestingly, compared to the 160-fold difference in KM between sugars with highest and lowest specificities, KD,Kapp values among different sugar substrates—representing the affinity to the empty carrier—seems to differ by a much lower factor (Table 1). The exact factor could not be determined, since KD,Kapp for D-xylose was only estimated to be > 500 mM. However, the factor across the remaining four substrates is only 4-fold. Thus, the affinity of the empty carrier for the sugar is not a crucial factor for substrate specificity.
KD,Naapp values—representing the affinity of the Na+-bound carrier for sugar—show larger differences when compared across sugar substrates; they differ by a factor of 23 (Table 1). The different sugar affinities in the presence and absence of Na+ for one specific sugar substrate is a result of different degrees of cooperativity (KD,K/KD,Na) between Na+ and sugar binding. The degree of cooperativity is maximized for the major substrates, indicating that the binding of Na+ to SGLT1 adjusts the sugar binding site in a way that favors binding to the major substrates.
As mentioned before, Na+ binding was shown to trigger the opening of the extracellular gate, leading to increased accessibility for the sugar and higher apparent affinities (Sala-Rabanal et al., 2012; Loo et al., 2013; Adelman et al., 2016; Gorraitz et al., 2017). However, if cooperativity is solely explained by the opening of the extracellular gate, it is unclear why the extent of cooperativity differs for different sugars. We propose that the observed cooperativity is also a result of Na+-induced local conformational transitions within the sugar binding pocket—rather than the opening of the extracellular gate only—leading to more favored binding interactions with D-glucose, but not with minor substrates.
4.5.3 The effect of steady-state kinetics on substrate specificity
While cooperativity between Na+ and the sugar enhances the specificity for D-glucose on the level of binding affinity (Section 4.5.2), specificity for D-glucose is further enhanced on the level of apparent affinity as observed during steady-state transport. KM values are decreased compared to KD,Na values, specifically for D-glucose and the major substrates, not for minor substrates (Table 1). Reducing KM below KD,Na is achieved by an energetically optimized pathway for the sugar dependent conformational transitions. The highest KD,Na/KM ratios are observed for the major substrates, indicating that the conformational transitions leading to sugar translocation are optimized around the interactions between SGLT1 and D-glucose across the translocation pathway. The energy landscape and thus the rate constants for the sugar dependent transitions were optimized for D-glucose, since the KM is a consequence of the specific combination of rate constants within the transport cycle (Johnson, 2019).
4.5.4 There are four substrate specificity determinants
In summary, there are four major mechanisms to adjust substrate specificity and enhance transport capacity: 1) increasing the sugar affinity for the empty carrier (KD,K), 2) increasing Imax values at the cost of lower sugar affinity, 3) enhancing sugar affinity to the Na+-bound carrier by increasing the degree of cooperativity (KD,K/KD,Na), and 4) enhancing the apparent sugar affinity by optimizing the kinetics of the sugar translocation pathway (KM). Improving the KD,K/KM ratio throughout evolution reflects the major mechanism to generate substrate specificity in SGLT1 for D-glucose. The minor sugar substrates show virtually no improvement of KM compared to KD,K. Transport of MDG and D-galactose is still possible with low KM due to their structural similarities with D-glucose, allowing for effective binding cooperativity and an energetically optimized pathway for the sugar dependent conformational transitions, optimizing KM.
5 Conclusion
The sugar-induced PSS charge translocation opens a new perspective to analyze sugar binding and determine kinetic and thermodynamic parameters such as rate constants and real affinity values (KD). Estimating KD values is important to understand mechanisms such as binding cooperativity, since KM values do not relate in any way to the real binding affinity when complex transport mechanisms are investigated (Johnson, 2019).
Summarizing, the sugar-induced PSS charge translocation in SSME is a good read-out for sugar binding, also observed in other sugar transporters (Ganea et al., 2011; Bazzone et al., 2016; Bazzone et al., 2022b). The capability of detecting substrate binding in a label-free, real-time assay enhances the possibilities for functional transporter studies and fills the gap of knowledge about substrate binding kinetics.
Recently we described partially uncoupled modes in the H+/glucose transporter GlcP (Bazzone et al., 2017b). For SGLT1 we found a random binding order and several electrogenic conformational transitions within the sugar translocation pathway which were not reported before. These findings once again show that reality is more complex than expected and that simple kinetic models may never account for every possible event.
Data availability statement
The original contributions presented in the study are included in the article/Supplementary Material, further inquiries can be directed to the corresponding author.
Author contributions
AB was responsible for the conception and design of the study. AB and RZ performed the experiments. AB wrote the first draft of the manuscript. All authors contributed to manuscript revision, read, and approved the submitted version.
Funding
This project has received funding from the Europeans Union’s Horizon 2020 research and innovation programme under the Marie Skłodowska-Curie grant agreement No. 860954.
Acknowledgments
We thank Valentin Prinz and Alexander Wendler for their excellent assistance in the lab. We are also grateful to Alison Obergrussberger for proofreading the manuscript.
Conflict of interest
All authors are employed by Nanion Technologies GmbH.
Publisher’s note
All claims expressed in this article are solely those of the authors and do not necessarily represent those of their affiliated organizations, or those of the publisher, the editors and the reviewers. Any product that may be evaluated in this article, or claim that may be made by its manufacturer, is not guaranteed or endorsed by the publisher.
Supplementary material
The Supplementary Material for this article can be found online at: https://www.frontiersin.org/articles/10.3389/fphys.2023.1058583/full#supplementary-material
References
Adelman J. L., Ghezzi C., Bisignano P., Loo D. D. F., Choe S., Abramson J., et al. (2016). Stochastic steps in secondary active sugar transport. Proc. Natl. Acad. Sci. U. S. A. 113, E3960–E3966. doi:10.1073/pnas.1525378113
Alberty R. A. (2004). Principle of detailed balance in kinetics. J. Chem. Educ. 81, 1206. doi:10.1021/ed081p1206
Arthur S., Coon S., Kekuda R., Sundaram U. (2014). Regulation of sodium glucose co-transporter SGLT1 through altered glycosylation in the intestinal epithelial cells. Biochimica biophysica acta 1838, 1208–1214. doi:10.1016/j.bbamem.2014.01.002
Barfuss D. W., Schafer J. A. (1981). Differences in active and passive glucose transport along the proximal nephron. Am. J. physiology 241, F322–F332. doi:10.1152/ajprenal.1981.241.3.F322
Bazzone A., Barthmes M., Fendler K. (2017a). SSM-based electrophysiology for transporter research. Methods Enzym. 594, 31–83. doi:10.1016/bs.mie.2017.05.008
Bazzone A., Barthmes M. (2020). Functional characterization of SLC transporters using solid supported membranes. Methods Mol. Biol. Clift. N.J.) 2168, 73–103. doi:10.1007/978-1-0716-0724-4_4
Bazzone A., Körner A., Meincke M., Bhatt M., Dondapati S., Barthmes M., et al. (2022a). SSM-based electrophysiology, a label-free real-time method reveals sugar binding & transport events in SGLT1. Biosens. Bioelectron. 197, 113763. doi:10.1016/j.bios.2021.113763
Bazzone A., Madej M. G., Kaback H. R., Fendler K. (2016). pH regulation of electrogenic sugar/H+ symport in MFS sugar permeases. PloS one 11, e0156392. doi:10.1371/journal.pone.0156392
Bazzone A., Tesmer L., Kurt D., Kaback H. R., Fendler K., Madej M. G. (2022b). Investigation of sugar binding kinetics of the E. coli sugar/H+ symporter XylE using solid-supported membrane-based electrophysiology. J. Biol. Chem. 298, 101505. doi:10.1016/j.jbc.2021.101505
Bazzone A., Zabadne A. J., Saliso wski A., Madej M. G., Fendler K. (2017b). A loose relationship: Incomplete H+/Sugar coupling in the MFS sugar transporter GlcP. Biophysical J. 113, 2736–2749. doi:10.1016/j.bpj.2017.09.038
Birnir B., Loo D. D., Wright E. M. (1991). Voltage-clamp studies of the Na+/glucose cotransporter cloned from rabbit small intestine. Pflugers Archiv Eur. J. physiology 418, 79–85. doi:10.1007/BF00370455
Díez-Sampedro A., Lostao M. P., Wright E. M., Hirayama B. A., Diez-Sampedro A. (2000). Glycoside binding and translocation in Na(+)-dependent glucose cotransporters: Comparison of SGLT1 and SGLT3. J. Membr. Biol. 176, 111–117. doi:10.1007/s00232001081
Díez-Sampedro A., Wright E. M., Hirayama B. A., Diez-Sampedro A. (2001). Residue 457 controls sugar binding and transport in the Na(+)/glucose cotransporter. J. Biol. Chem. 276, 49188–49194. doi:10.1074/jbc.M108286200
Drew D., Boudker O. (2016). Shared molecular mechanisms of membrane transporters. Annu. Rev. Biochem. 85, 543–572. doi:10.1146/annurev-biochem-060815-014520
Eskandari S., Wright E. M., Loo D. D. F. (2005). Kinetics of the reverse mode of the Na+/glucose cotransporter. J. Membr. Biol. 204, 23–32. doi:10.1007/s00232-005-0743-x
Ferraris R. P., Yasharpour S., Lloyd K. C., Mirzayan R., Diamond J. M. (1990). Luminal glucose concentrations in the gut under normal conditions. Am. J. physiology 259, G822–G837. doi:10.1152/ajpgi.1990.259.5.G822
Forrest L. R., Krämer R., Ziegler C. (2011). The structural basis of secondary active transport mechanisms. Biochimica biophysica acta 1807, 167–188. doi:10.1016/j.bbabio.2010.10.014
Forrest L. R., Rudnick G. (2009). The rocking bundle: A mechanism for ion-coupled solute flux by symmetrical transporters. Physiology 24, 377–386. doi:10.1152/physiol.00030.2009
Forrest L. R., Zhang Y.-W., Jacobs M. T., Gesmonde J., Xie L., Honig B. H., et al. (2008). Mechanism for alternating access in neurotransmitter transporters. Proc. Natl. Acad. Sci. U. S. A. 105, 10338–10343. doi:10.1073/pnas.0804659105
Gaiko O., Bazzone A., Fendler K., Kaback H. R. (2013). Electrophysiological characterization of uncoupled mutants of LacY. Biochemistry 52, 8261–8266. doi:10.1021/bi4013269
Ganea C., Meyer-Lipp K., Lemonnier R., Krah A., Leblanc G., Fendler K. (2011). G117C MelB, a mutant melibiose permease with a changed conformational equilibrium. Biochimica biophysica acta 1808, 2508–2516. doi:10.1016/j.bbamem.2011.07.017
Garcia-Celma J. J., Ploch J., Smirnova I., Kaback H. R., Fendler K. (2010). Delineating electrogenic reactions during lactose/H+ symport. Biochemistry 49, 6115–6121. doi:10.1021/bi100492p
Gerbeth-Kreul C., Pommereau A., Ruf S., Kane J. L., Kuntzweiler T., Hessler G., et al. (2021). A solid supported membrane-based Technology for electrophysical screening of B0AT1-modulating compounds. SLAS Discov. Adv. life Sci. R D 26, 783–797. doi:10.1177/24725552211011180
Ghezzi C., Loo D. D. F., Wright E. M. (2018). Physiology of renal glucose handling via SGLT1, SGLT2 and GLUT2. Diabetologia 61, 2087–2097. –2097. doi:10.1007/s00125-018-4656-5
Gorraitz E., Hirayama B. A., Paz A., Wright E. M., Loo D. D. F. (2017). Active site voltage clamp fluorometry of the sodium glucose cotransporter hSGLT1. Proc. Natl. Acad. Sci. U. S. A. 114, E9980–E9988. doi:10.1073/pnas.1713899114
Hager K., Hazama A., Kwon H. M., Loo D. D., Handler J. S., Wright E. M. (1995). Kinetics and specificity of the renal Na+/myo-inositol cotransporter expressed in Xenopus oocytes. J. Membr. Biol. 143, 103–113. doi:10.1007/BF00234656
Han L., Qu Q., Aydin D., Panova O., Robertson M. J., Xu Y., et al. (2022). Structure and mechanism of the SGLT family of glucose transporters. Nature 601, 274–279. doi:10.1038/s41586-021-04211-w
Hirayama B. A., Loo D. D. F., Díez-Sampedro A., Leung D. W., Meinild A.-K., Lai-Bing M., et al. (2007). Sodium-dependent reorganization of the sugar-binding site of SGLT1. Biochemistry 46, 13391–13406. doi:10.1021/bi701562k
Hirayama B. A., Loo D. D., Wright E. M. (1997). Cation effects on protein conformation and transport in the Na+/glucose cotransporter. J. Biol. Chem. 272, 2110–2115. doi:10.1074/jbc.272.4.2110
Hirayama B. A., Loo D. D., Wright E. M. (1994). Protons drive sugar transport through the Na+/glucose cotransporter (SGLT1). J. Biol. Chem. 269, 21407–21410. doi:10.1016/s0021-9258(17)31817-3
Hirayama B. A., Lostao M. P., Panayotova-Heiermann M., Loo D. D., Turk E., Wright E. M. (1996). Kinetic and specificity differences between rat, human, and rabbit Na+-glucose cotransporters (SGLT-1). Am. J. physiology 270, G919–G926. doi:10.1152/ajpgi.1996.270.6.G919
Hoshi T., Takuwa N., Abe M., Tajima A. (1986). Hydrogen ion-coupled transport of d-glucose by phlorizin-sensitive sugar carrier in intestinal brush-border membranes. Biochimica Biophysica Acta (BBA) - Biomembr. 861, 483–488. doi:10.1016/0005-2736(86)90458-x
Hummel C. S., Lu C., Loo D. D. F., Hirayama B. A., Voss A. A., Wright E. M. (2011). Glucose transport by human renal Na+/D-glucose cotransporters SGLT1 and SGLT2. Am. J. physiology Cell physiology 300, C14–C21. doi:10.1152/ajpcell.00388.2010
Jardetzky O. (1966). Simple allosteric model for membrane pumps. Nature 211, 969–970. doi:10.1038/211969a0
Jarmoskaite I., AlSadhan I., Vaidyanathan P. P., Herschlag D. (2020). How to measure and evaluate binding affinities. eLife 9, e57264. doi:10.7554/eLife.57264
Johnson K. A. (2019). New standards for collecting and fitting steady state kinetic data. Beilstein J. Org. Chem. 15, 16–29. doi:10.3762/bjoc.15.2
Kamitori K., Shirota M., Fujiwara Y. (2022). Structural basis of the selective sugar transport in sodium-glucose cotransporters. J. Mol. Biol. 434, 167464. doi:10.1016/j.jmb.2022.167464
Karpowich N. K., Wang D.-N. (2008). Structural biology. Symmetric transporters for asymmetric transport. Sci. (New York, N.Y.) 321, 781–782. doi:10.1126/science.1161495
Kazmier K., Claxton D. P., Mchaourab H. S. (2017). Alternating access mechanisms of LeuT-fold transporters: Trailblazing towards the promised energy landscapes. Curr. Opin. Struct. Biol. 45, 100–108. doi:10.1016/j.sbi.2016.12.006
Koepsell H. (2017). The Na+-D-glucose cotransporters SGLT1 and SGLT2 are targets for the treatment of diabetes and cancer. Pharmacol. Ther. 170, 148–165. doi:10.1016/j.pharmthera.2016.10.017
Krofchick D., Huntley S. A., Silverman M. (2004). Transition states of the high-affinity rabbit Na(+)/glucose cotransporter SGLT1 as determined from measurement and analysis of voltage-dependent charge movements. Am. J. physiology. Cell physiology 287, C46–C54. doi:10.1152/ajpcell.00008.2004
Li Z., Lee A. S. E., Bracher S., Jung H., Paz A., Kumar J. P., et al. (2015). Identification of a second substrate-binding site in solute-sodium symporters. J. Biol. Chem. 290, 127–141. doi:10.1074/jbc.M114.584383
Lolkema J. S., Slotboom D.-J. (2008). The major amino acid transporter superfamily has a similar core structure as Na+-galactose and Na+-leucine transporters. Mol. Membr. Biol. 25, 567–570. doi:10.1080/09687680802541177
Longpré J.-P., Lapointe J.-Y. (2011). Determination of the Na(+)/glucose cotransporter (SGLT1) turnover rate using the ion-trap technique. Biophysical J. 100, 52–59. doi:10.1016/j.bpj.2010.11.012
Longpré J.-P., Sasseville L. J., Lapointe J.-Y. (2012). Simulated annealing reveals the kinetic activity of SGLT1, a member of the LeuT structural family. J. general physiology 140, 361–374. doi:10.1085/jgp.201210822
Loo D. D., Eskandari S., Boorer K. J., Sarkar H. K., Wright E. M. (2000). Role of Cl-in electrogenic Na+-coupled cotransporters GAT1 and SGLT1. J. Biol. Chem. 275, 37414–37422. doi:10.1074/jbc.M007241200
Loo D. D. F., Hirayama B. A., Cha A., Bezanilla F., Wright E. M. (2005). Perturbation analysis of the voltage-sensitive conformational changes of the Na+/glucose cotransporter. J. general physiology 125, 13–36. doi:10.1085/jgp.200409150
Loo D. D. F., Hirayama B. A., Karakossian M. H., Meinild A.-K., Wright E. M. (2006). Conformational dynamics of hSGLT1 during Na+/glucose cotransport. J. general physiology 128, 701–720. doi:10.1085/jgp.200609643
Loo D. D. F., Hirayama B. A., Sala-Rabanal M., Wright E. M. (2008). How drugs interact with transporters: SGLT1 as a model. J. Membr. Biol. 223, 87–106. doi:10.1007/s00232-008-9116-6
Loo D. D. F., Jiang X., Gorraitz E., Hirayama B. A., Wright E. M. (2013). Functional identification and characterization of sodium binding sites in Na symporters. Proc. Natl. Acad. Sci. U. S. A. 110, E4557–E4566. doi:10.1073/pnas.1319218110
Ma W., Yang L., He L. (2018). Overview of the detection methods for equilibrium dissociation constant KD of drug-receptor interaction. J. Pharm. analysis 8, 147–152. doi:10.1016/j.jpha.2018.05.001
Madej M. G., Sun L., Yan N., Kaback H. R. (2014). Functional architecture of MFS D-glucose transporters. Proc. Natl. Acad. Sci. U. S. A. 111, E719–E727. doi:10.1073/pnas.1400336111
Mitchell P. (1957). A general theory of membrane transport from studies of bacteria. Nature 180, 134–136. doi:10.1038/180134a0
Panayotova-Heiermann M., Loo D. D., Kong C. T., Lever J. E., Wright E. M. (1996). Sugar binding to Na+/glucose cotransporters is determined by the carboxyl-terminal half of the protein. J. Biol. Chem. 271, 10029–10034. doi:10.1074/jbc.271.17.10029
Panayotova-Heiermann M., Loo D. D., Wright E. M. (1995). Kinetics of steady-state currents and charge movements associated with the rat Na+/glucose cotransporter. J. Biol. Chem. 270, 27099–27105. doi:10.1074/jbc.270.45.27099
Parent L., Supplisson S., Loo D. D., Wright E. M. (1992b). Electrogenic properties of the cloned Na+/glucose cotransporter: II. A transport model under nonrapid equilibrium conditions. J. Membr. Biol. 125, 63–79. doi:10.1007/BF00235798
Parent L., Supplisson S., Loo D. D., Wright E. M. (1992a). Electrogenic properties of the cloned Na+/glucose cotransporter: I. Voltage-Clamp studies. J. Membr. Biol. 125, 49–62. doi:10.1007/BF00235797
Peerce B. E., Wright E. M. (1984). Conformational changes in the intestinal brush border sodium-glucose cotransporter labeled with fluorescein isothiocyanate. Proc. Natl. Acad. Sci. U. S. A. 81, 2223–2226. doi:10.1073/pnas.81.7.2223
Pintschovius J., Fendler K., Bamberg E. (1999). Charge translocation by the Na+/K+-ATPase investigated on solid supported membranes: Cytoplasmic cation binding and release. Biophysical J. 76, 827–836. doi:10.1016/S0006-3495(99)77246-2
Quick M., Loo D. D., Wright E. M. (2001). Neutralization of a conserved amino acid residue in the human Na+/glucose transporter (hSGLT1) generates a glucose-gated H+ channel. J. Biol. Chem. 276, 1728–1734. doi:10.1074/jbc.M005521200
Sala-Rabanal M., Hirayama B. A., Loo D. D. F., Chaptal V., Abramson J., Wright E. M. (2012). Bridging the gap between structure and kinetics of human SGLT1. Am. J. physiology. Cell physiology 302, C1293–C1305. doi:10.1152/ajpcell.00397.2011
Tadini-Buoninsegni F., Fendler K. (2015). “Recording of pump and transporter activity using solid-supported membranes (SSM-Based electrophysiology),” in Pumps, channels, and transporters Editors R. J. Clarke, and M. A. A. Khalid (Hoboken, NJ: John Wiley & Sons), 147–177.
Thomas N. E., Feng W., Henzler-Wildman K. A. (2021). A solid-supported membrane electrophysiology assay for efficient characterization of ion-coupled transport. J. Biol. Chem. 297, 101220. doi:10.1016/j.jbc.2021.101220
Tsujihara K., Hongu M., Saito K., Inamasu M., Arakawa K., Oku A., et al. (1996). Na(+)-glucose cotransporter inhibitors as antidiabetics. I. Synthesis and pharmacological properties of 4'-dehydroxyphlorizin derivatives based on a new concept. Chem. Pharm. Bull. 44, 1174–1180. doi:10.1248/cpb.44.1174
Turk E., Kim O., Le Coutre J., Whitelegge J. P., Eskandari S., Lam J. T., et al. (2000). Molecular characterization of Vibrio parahaemolyticus vSGLT: A model for sodium-coupled sugar cotransporters. J. Biol. Chem. 275, 25711–25716. doi:10.1074/jbc.M003127200
Tyagi N. K., Kumar A., Goyal P., Pandey D., Siess W., Kinne R. K. H. (2007). D-Glucose-recognition and phlorizin-binding sites in human sodium/D-glucose cotransporter 1 (hSGLT1): A tryptophan scanning study. Biochemistry 46, 13616–13628. doi:10.1021/bi701193x
Weyand S., Shimamura T., Yajima S., Suzuki S.'i., Mirza O., Krusong K., et al. (2008). Structure and molecular mechanism of a nucleobase-cation-symport-1 family transporter. Sci. (New York, N.Y.) 322, 709–713. doi:10.1126/science.1164440
Wright E. M., Loo D. D. F., Hirayama B. A. (2011). Biology of human sodium glucose transporters. Physiol. Rev. 91, 733–794. doi:10.1152/physrev.00055.2009
Wright E. M., Loo D. D., Panayotova-Heiermann M., Lostao M. P., Hirayama B. H., Mackenzie B., et al. (1994). Active' sugar transport in eukaryotes. J. Exp. Biol. 196, 197–212. doi:10.1242/jeb.196.1.197
Yoo O., Lee D.-H. (2006). Inhibition of sodium glucose cotransporter-I expressed in Xenopus laevis oocytes by 4-acetoxyscirpendiol from Cordyceps takaomantana (anamorph = Paecilomyces tenuipes). Med. Mycol. 44, 79–85. doi:10.1080/13693780500142379
Glossary
Abbreviations
A activating solution
NA nonactivating solution
R resting solution
SSME solid supported membrane-based electrophysiology
PSS pre-steady-state
SS steady-state
Glu D-glucose
Gal D-galactose
MDG α-methyl-D-glucose
OMG 3-O-methyl-D-glucose
Xyl D-xylose
DOG 2-desoxy-D-glucose
Fru D-fructose
Half saturation and equilibrium constants
KM Michaelis Menten constant derived from transport related currents or charge translocation under steady-state or close-to steady-state conditions.
KD dissociation constant, i.e., as used for model simulations.
KDapp apparent dissociation constant for the sugar, derived from sugar-induced PSS currents.
KD,Naapp KDapp in the presence of 300 mM Na+.
KD,Kapp KDapp in the absence of Na+ (Na+ is replaced by 300 mM K+).
EC50 the empirical half saturation constant is used when values did not relate to either substrate transport (KM) or substrate binding induced transitions (KDapp).
EC50PSS half saturation constant for the PSS current, as determined for the cation and Cl− concentration dependence of the sugar-induced PSS current.
Rate and time constants
τPSS decay time constant of PSS current phase from exponential fit.
τSS decay time constant of transport current phase from exponential fit.
kobs observed rate constant associated with a current decay (SS or PSS phases) for a given sugar concentration. kobs = 1/τ.
kon and koff on- and off-rate constants for the sugar-induced electrogenic conformational transition in the presence of Na+, derived via model equation fit of concentration dependent kobs.
Current and charge
I(t) time resolved current trace as recorded in SSME.
Irec(t) reconstructed transporter current using I(t), based on circuit analysis (Tadini-Buoninsegni and Fendler, 2015).
ISS steady-state current obtained from Irec(t).
IPSS PSS current. Either the peak current recorded from 1 mm sensors with high time resolution or the peak current from Irec(t).
Imax maximum current under saturating substrate concentration derived from a Hill fit of a concentration dependence. May be either of the PSS or the transport current component. Imax derived from the transport current correlates with the transport rate Vmax.
Imin minimum current derived from a modified Hill fit of the cation concentration dependent sugar-induced PSS current. For sugar concentration dependencies, Imin was always set to 0.
Qmax as Imax, but here the translocated charge (peak current integral) was used for analysis.
Keywords: SGLT1, pre-steady-state kinetics, transport mechanism, solid supported membrane-based electrophysiology, SLC transporters, binding assay, kinetics, membrane transporter
Citation: Bazzone A, Zerlotti R, Barthmes M and Fertig N (2023) Functional characterization of SGLT1 using SSM-based electrophysiology: Kinetics of sugar binding and translocation. Front. Physiol. 14:1058583. doi: 10.3389/fphys.2023.1058583
Received: 30 September 2022; Accepted: 17 January 2023;
Published: 07 February 2023.
Edited by:
Tiziano Verri, University of Salento, ItalyReviewed by:
Stephen James Fairweather, Australian National University, AustraliaIgor Vorobyov, University of California, Davis, United States
Copyright © 2023 Bazzone, Zerlotti, Barthmes and Fertig. This is an open-access article distributed under the terms of the Creative Commons Attribution License (CC BY). The use, distribution or reproduction in other forums is permitted, provided the original author(s) and the copyright owner(s) are credited and that the original publication in this journal is cited, in accordance with accepted academic practice. No use, distribution or reproduction is permitted which does not comply with these terms.
*Correspondence: Andre Bazzone, YW5kcmUuYmF6em9uZUBuYW5pb24uZGU=