- 1Doctoral Program in Sports Medicine, Graduate School of Comprehensive Human Sciences, University of Tsukuba, Tsukuba, Japan
- 2Department of Medical Science, Faculty of Medicine, University of Tsukuba, Tsukuba, Japan
- 3Department of Internal Medicine (Neurology), Faculty of Medicine, University of Tsukuba, Tsukuba, Japan
- 4Laboratory Animal Resource Center in Transborder Medical Research Center, and Department of Anatomy and Embryology, Faculty of Medicine, University of Tsukuba, Tsukuba, Japan
- 5Doctoral Program in Clinical Sciences, Graduate School of Comprehensive Human Sciences, University of Tsukuba, Tsukuba, Japan
- 6Doctoral Program in Medical Sciences, Graduate School of Comprehensive Human Sciences, University of Tsukuba, Tsukuba, Japan
- 7Department of Internal Medicine (Endocrinology and Metabolism), Faculty of Medicine, University of Tsukuba, Tsukuba, Japan
- 8From the Department of Surgery, Institute of Gastroenterology, Tokyo Women’s Medical University, Shinjuku, Japan
Introduction: Obesity is a risk factor for many diseases because it leads to a reduction in skeletal muscle mass and promotes insulin resistance. p62/Sqstm1-knockout mice are a model of metabolic syndrome; show obesity, insulin resistance, and non-alcoholic fatty liver (NAFL); and develop non-alcoholic steatohepatitis (NASH) in response to the feeding of a high-fat diet (HFD). These phenotypes suggest that muscle p62 may prevent obesity-induced muscle dysfunction. In the present study, we aimed to determine the effects of muscle p62 on skeletal muscle mass, muscle strength, insulin resistance, and NASH pathology.
Methods: We generated muscle-specific p62 gene rescue mice (p62-mRes), which express p62 only in muscle and were derived from p62-knock out mice (p62KIKI) using the cre/loxp system. p62KIKI and p62-mRes mice were fed an HFD for 20 weeks and their phenotypes were compared.
Results: HFD-feeding caused severe obesity in both p62KIKI and p62-mRes mice, but there was no effect of muscle p62 on body mass. Limb skeletal muscle mass, grip strength, and the cross-sectional area of muscle fibers were higher in p62-mRes mice than in p62KIKI. The glucose tolerance and insulin sensitivity of the p62-mRes mice were also superior. The protein expression of mechanistic target of rapamycin, which promotes muscle protein synthesis, and GLUT4, a glucose transporter in skeletal muscle, were higher in the p62-mRes mice. p62KIKI mice developed severe NASH when fed an HFD, but the progression of NASH was retarded by p62 gene rescue in muscle, and the expression of Tgf-β1, which encodes a factor that promotes hepatic fibrosis, was reduced.
Conclusion: Rescue of muscle-specific p62 in the whole-body p62 knock-out mice ameliorates the insulin resistance and retards the progression of NASH caused by systemic p62 ablation.
Introduction
Obesity is a serious social problem, and in 2016 the World Health Organization reported that approximately 39% of adults were overweight worldwide. In obesity, an excessive accumulation of adipocytes results in greater secretion of certain hormones and proinflammatory cytokines (adipokines), induces chronic inflammation, and promotes insulin resistance (Kahn et al., 2006; Shoelson et al., 2006). The failure of glucose homeostasis associated with insulin resistance increases the risks of several diseases, including type 2 diabetes mellitus (T2DM), dyslipidemia, and non-alcoholic fatty liver disease (NAFLD) (Kodama et al., 2014; Younossi, 2019). NAFLD is a generic term for the most common chronic liver disease (Younossi, 2019; Loomba et al., 2021), which involves the accumulation of fat in the liver, and the number of patients with NAFLD is increasing rapidly alongside the increase in the prevalence of obesity. As part of the spectrum of this disease, non-alcoholic steatohepatitis (NASH), which is characterized by liver inflammation and fibrosis, is a serious disease that can progress to cirrhosis and hepatocellular carcinoma. Because obesity-induced insulin resistance is fundamental to the development and progression of NASH, it is important to prevent this.
Skeletal muscle is the largest organ in the body and it has roles in locomotor function and posture maintenance, but also in whole-body metabolism. Skeletal muscle is a key target of insulin, and approximately 40% of the glucose ingested is taken up by this tissue and stored as glycogen (Argiles et al., 2016). There are close relationships between obesity, T2DM, and skeletal muscle mass. A previous cohort study (Hong et al., 2017) showed that the incidence of T2DM during the follow-up period was higher in participants with low skeletal muscle mass index (SMI; total skeletal muscle mass/body mass (kg/kg) × 100). Furthermore, in our previous study, we performed a quartile analysis using an index of sarcopenic obesity, the SV ratio (skeletal muscle mass/visceral fat area (g/cm2), which showed that participants in the group with the lowest SV ratio had the highest levels of insulin resistance, hepatic fat accumulation, and hepatic inflammation (Shida et al., 2018). In contrast, the increase in skeletal muscle mass induced by resistance training causes an improvement in insulin resistance (Bucci et al., 2016). The maintenance of skeletal muscle mass and function plays an important role in the management of insulin-glucose metabolism in obesity.
Insulin binds to its receptor, a transmembrane protein, which promotes the phosphorylation of AKT, leading to the translocation of the glucose transport GLUT4 to the sarcolemma and an increase in glucose uptake into muscle (Zierath et al., 2000). In insulin resistance, defects in this signal transduction reduce insulin-stimulated glucose uptake (Guo, 2014). Insulin also regulates skeletal muscle mass. Insulin activates mechanistic target of rapamycin complex 1 (mTORC1) via AKT (Bodine et al., 2001; Rommel et al., 2001), leading to the activation of factors that induce protein synthesis, such as p70S6K, and inhibits muscle atrophy through an effect on 4EBP-1(Glass, 2005). These effects mediate an increase in skeletal muscle mass. Additionally, AKT inhibits muscle atrophy by reducing the expression of MuRF-1 and atrogin-1 via the phosphorylation of FoXO3/4 (Glass, 2005). Furthermore, compensatory hyperinsulinemia occurs in insulin resistance, and there is a positive relationship between the circulating concentrations of insulin and myostatin, which promotes muscle atrophy (Tanaka et al., 2018). Thus, in insulin resistance, which is associated with both obesity and T2DM, a decrease in muscle synthesis and an increase in muscle degradation occur, which results in skeletal muscle atrophy.
Mice with a deletion of p62/Sqstm1 (p62-KO), a regulator of selective autophagy, show hyperphagia-induced obesity owing to abnormal leptin signaling, and develop a phenotype similar to that of metabolic syndrome in humans (Okada et al., 2009; Harada et al., 2013), including glucose intolerance, insulin resistance, and non-alcoholic fatty liver (NAFL). In addition, p62-KO mice develop severe obesity and non-alcoholic steatohepatitis (NASH) when fed a high-fat diet (Duran et al., 2016; Miura et al., 2021). It has previously been shown that p62 is involved in the progression of human hepatocellular carcinoma (Umemura et al., 2016), suggesting that p62 also plays a role in liver pathology in humans. In the skeletal muscle of aging mice, excessive accumulation of p62 has been observed (Sakuma et al., 2016), which suggests that disordered autophagy is involved in age-related muscle atrophy (sarcopenia), and it has been suggested that the loss of p62 function may promote skeletal muscle atrophy. The phenotype of the p62-KO mice also suggests that skeletal muscle p62 helps minimize obesity-related glucose intolerance and insulin resistance. However, to our knowledge, the effects of muscle p62 on obesity-induced glucose intolerance, insulin resistance, and NASH have not been investigated.
In the present study, we aimed to assess the role of p62 in muscle by generating muscle-specific p62 gene rescue mice (p62-mRes), in which p62 is only expressed in muscle. We determined the effects of p62 expression in muscle on skeletal muscle mass and function, glucose intolerance, insulin resistance, and NASH pathology in HFD-fed mice.
Materials and methods
Animals
Mice on C57BL/6 background were used. We generated p62-knock-in mice (p62KIKI), in which a transcription termination signal flanked by loxp sequences and a polyA-FRT-neomycin resistance gene cassette (neo)-FRT sequence were inserted into the intron between exons 1 and 2 of the p62 gene (Figure 1). These mice have whole-body p62 deficiency. Muscle-specific p62 gene rescue mice (p62KIKI:ACTA1-Cre/+: p62-mRes) were obtained by crossing p62KIKI and human alpha-skeletal actin (ACTA1)-Cre mice using the cre/loxp system (Sauer, 1987). The mice were housed at 20–23°C under a 12-h light/dark cycle. Male 5-week-old p62KIKI and p62-mRes mice were fed normal chow (NC) or a 60% high-fat/high-sucrose diet (HFD, Oriental Yeast, Tokyo, Japan) for 20 weeks. When the mice were 25 weeks of age, liver, skeletal muscle, epididymal adipose tissue (WAT), and blood samples were collected under isoflurane anesthesia. Blood samples were centrifuged at 1,500 × g for 10 min to collect serum. All the samples collected were stored at −80°C. The study was approved by the Animal Care and Use Committee of the University of Tsukuba, and was conducted in accordance with the Regulations on Animal Care and Use in Research; the Welfare and Management of Animals Act, and the Standards for Husbandry, Housing, and Pain Relief of Experimental Animals.
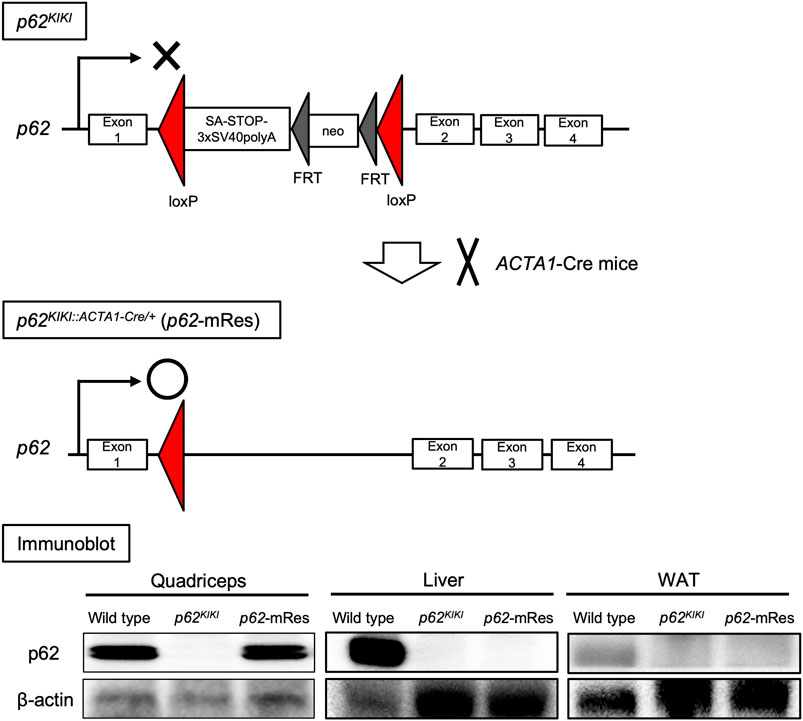
FIGURE 1. Generation of muscle-specific p62 gene rescue mice. Schematic diagram of the design of the p62 knock-in gene (p62KIKI) and the procedure for generating muscle-specific p62 gene rescue mice (p62-mRes). p62-mRes mice were generated by crossing with human alpha-skeletal actin (ACTA1)-Cre mice. p62 gene rescue in muscle was confirmed by immunoblotting of quadriceps, liver, and white adipose tissue (WAT).
Grip strength
The limb grip strength of the mice was measured at 17, 21, and 25 weeks of age using a grip strength meter for mice (MK-380K, Muromachi Kikai, Tokyo, Japan). The measurements were made by pulling the tail backward with the limbs touching the meter. The measurements were repeated five times and the mean values were recorded. All the measurements were performed by the same investigator.
Histological analysis
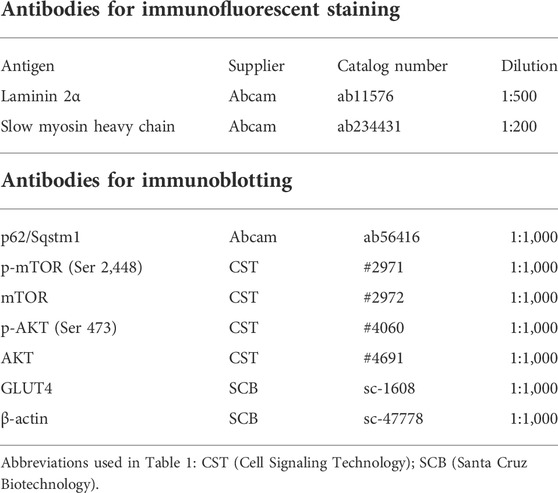
The excised tibialis anterior (TA) muscles were snap-frozen in liquid nitrogen-cooled isopentane, cut into 10-μm-thick sections, and stained with hematoxylin and eosin (H&E) or for succinate dehydrogenase (SDH) activity. Immunofluorescence staining of muscle cryosection was performed after blocking with Blocking One Histo (nacalai tesque, Kyoto, Japan). The sections were incubated with primary antibodies diluted in PBS at 4°C overnight. After washing with PBS, sections were incubated with secondary antibodies labeled with Alexa 488 or Alexa 568 for 1 h at room temperature and mounted using Fluro KEEPER Antifade Reagent (nacalai tesque). The antibodies used for immunofluorescence staining are shown in Table 1. Liver sections were immersed in 4% paraformaldehyde, embedded in paraffin, cut into 5-μm-thick sections, and stained with H&E or Sirius Red. The liver pathologic grade was determined by a specialist using the SAF score (Bedossa et al., 2012) by assessing steatosis, activity (inflammation), and fibrosis. An all-in-one fluorescence microscope (BZ-X800, Keyence, Osaka, Japan) was used for imaging. Muscle fiber cross-sectional area (CSA), the percentage of type 1 fibers, and the percentages of the sections that were Sirius red-positive were calculated using BZ-H4C analysis software (Keyence).
Serum biochemistry
The serum concentrations of triglyceride (TG), non-esterified fatty acids (NEFA), high-density lipoprotein-cholesterol (HDL-C), low-density lipoprotein-cholesterol (LDL-C); and the activities of aspartate aminotransferase (AST), alanine aminotransferase (ALT), and lactate dehydrogenase (LDH) were measured by the Oriental Yeast using a Hitachi 7,180 Auto Analyzer. TG and NEFA were measured by enzymatic methods (L type Wako TG-M and NEFA HF, FUJIFILM, Tokyo, Japan). HDL-C and LDL-C were measured by direct methods (CHOLESTEST N LDL and HDL, S SEKISUI MEDICAL, Tokyo, Japan). AST and ALT activities were measured using the JSCC transferable method with L type Wako AST and ALT-J2 kits (FUJIFILM).
Intraperitoneal glucose (ipGTT) and insulin (ipITT) tolerance testing
ipGTT was performed at 13 and 21 weeks of age, and ipITT at 14 and 22 weeks of age. For GTT, glucose solution (2 mg/g body mass) was administered intraperitoneally and the glucose concentration of tail vein blood was measured 0, 15, 30, 60, and 120 min later. For ITT, insulin (1 mU/g body mass) was administered intraperitoneally and the glucose concentration of tail vein blood was measured 0, 15, 30, 45, and 60 min later. The mice were fasted for 16 h before each test. A glucometer (SUGL-001, SHINYO GIKEN KOGYO Co., Ltd., Niigata, Japan) was used to measure the blood glucose concentrations.
Real-time quantitative PCR (qPCR)
The expression levels of mRNAs were analyzed using qPCR, as described previously (Miura et al., 2021). RNA was extracted from gastrocnemius muscle or liver and cDNA was synthesized using a PrimeScript RT reagent kit (Takara Bio, Shiga, Japan). qPCR was performed using the cDNA and SYBR Green Master Mix (Thermo Fisher Scientific, MA, United States). The mRNA expression of target genes was normalized to that of the glyceraldehyde 3-phosphate dehydrogenase gene (Gapdh). The primers used for qPCR are shown in Table 2.
Immunoblot analysis
Tissue samples were homogenized in RIPA buffer (FUJIFILM) and the total protein concentration of each was measured using a BCA protein assay kit (Thermo Fisher Scientific). Protein lysate was mixed with Laemmli sample loading buffer (BioRad, CA, United States), and aliquots containing equal amounts of protein were separated by SDS-PAGE. The isolated proteins were transferred to PVDF membranes (BioRad), which were blocked using Blocking One (nacali tesque) and then incubated with primary antibodies. The target proteins were visualized using Chemi-Lumi One Super (nacali tesque). The antibodies used for immunoblotting are shown in Table 1. The target protein expression levels were quantified using Image J (NIH, MD, United States).
Statistical analysis
SPSS statistics for Mac, version 26 (IBM Corp., Armonk, NY, United States) was used for the statistical analysis. Dates are expressed as mean ± standard error of the mean (SEM). Unpaired t-tests were used to compare two groups consuming the same diet. p < 0.05 was considered to represent statistical significance.
Results
p62 expression in muscle increases skeletal muscle mass, strength, and muscle fiber size, without affecting body mass
The p62 gene rescue in muscle was confirmed by immunoblotting, and its expression in this tissue was comparable to that of wild-type mice (Figure 1). The p62KIKI and p62-mRes mice became obese with age (approximately 40 g) when consuming NC (Supplementary Figure S1A), and the consumption of an HFD accelerated the development of the obesity (Figure 2A), but muscle p62 did not affect their body mass. The masses of the quadriceps, TA, and soleus muscles tended to be higher in the p62-mRes mice, and the masses of all the muscles were higher in p62-mRes fed an HFD than in p62KIKI mice that consumed the same diet (Figure 2B, Supplementary Figure S1B). The masses of the epididymal adipose tissue (WAT) and liver did not change by genotype (Figure 2C, Supplementary Figure S1C). The grip strengths of p62-mRes mice fed NC at 17 and 21 weeks of age were higher than in p62KIKI mice consuming NC (Supplementary Figure S1D), and at 25 weeks of age, it was higher in p62-mRes mice consuming an HFD than in p62KIKI mice consuming the same diet (Figure 2D). No morphological differences were identified in the skeletal muscle of mice that did or did not locally express p62, and none of the mice showed abnormal skeletal muscle morphology (Figure 2E, Supplementary Figure S1E). Similar to the skeletal muscle mass and strength, the CSAs of the muscle fibers were also higher in HFD-fed p62-mRes mice, and a comparison of the distributions of the CSAs of the fibers showed that the HFD-fed p62-mRes mice had many large fibers (Figure 3A). The percentage of type 1 fibers was not affected by muscle p62 expression (Figure 3A, Supplementary Figure S2A). There were no differences in SDH staining between mice that consumed the different diets or those of differing genotype (Figure 3A, Supplementary Figure S2A), which suggests that p62 did not affect the mitochondrial content of the skeletal muscle of the mice. qPCR analysis showed that the expression of Pgc-1a, which is involved in mitochondrial biosynthesis, was lower in p62-mRes mice (Figure 3B), whereas other markers of mitochondrial biosynthesis and function (Tflam and Ucp3) were similar in the two mouse strains (Figure 3B). In the NC-fed mice, only Tfam expression differed (Supplementary Figure S2B). These results indicate that p62 in muscle does not affect the obesity associated with p62 gene deletion, but increases skeletal muscle mass, strength, and fiber size.
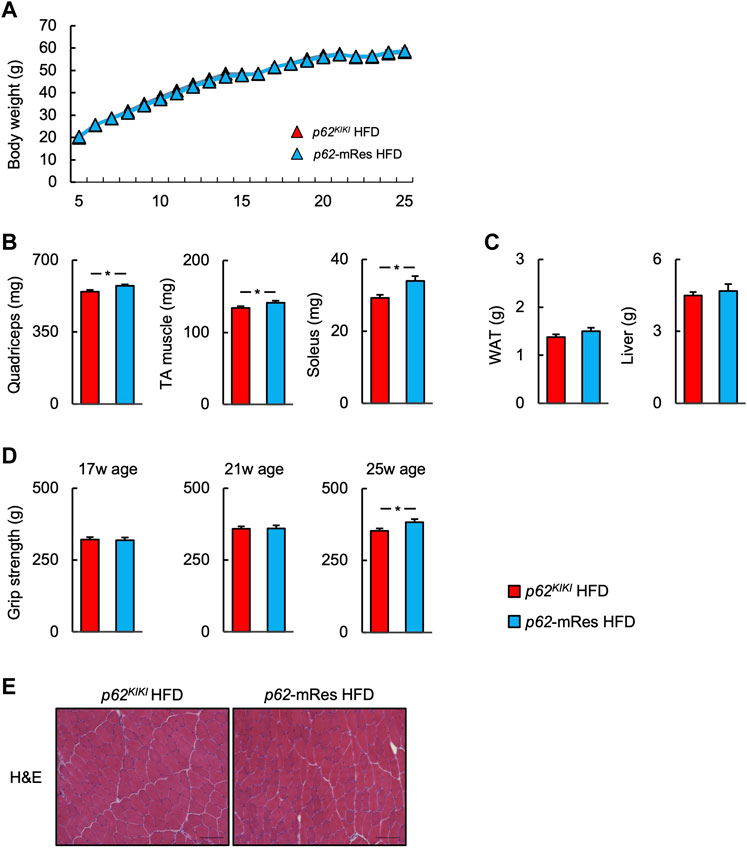
FIGURE 2. p62 gene rescue in muscle does not affect body mass but increases skeletal muscle mass and grip strength. (A) Time course of the changes in body mass in p62KIKI and p62-mRes mice fed a high-fat diet (HFD, p62KIKI; n = 13, p62-mRes; n = 14). (B) Masses of the quadriceps, tibialis anterior (TA), and soleus muscles of mice in each group at 25 weeks of age (n = 13–14/group). (C) Masses of the epididymal adipose tissue (WAT) and liver of mice in each group at 25 weeks of age (n = 13–14/group). (D) Grip strength at 17, 21, and 25 weeks of age (n = 13–14/group). (E) Representative hematoxylin and eosin (H&E)-stained sections of TA muscles from 25-week-old p62KIKI and p62-mRes mice fed an HFD. Scale bars represent 100 μm. Values are mean ± SEM. *p < 0.05 (unpaired t-test).
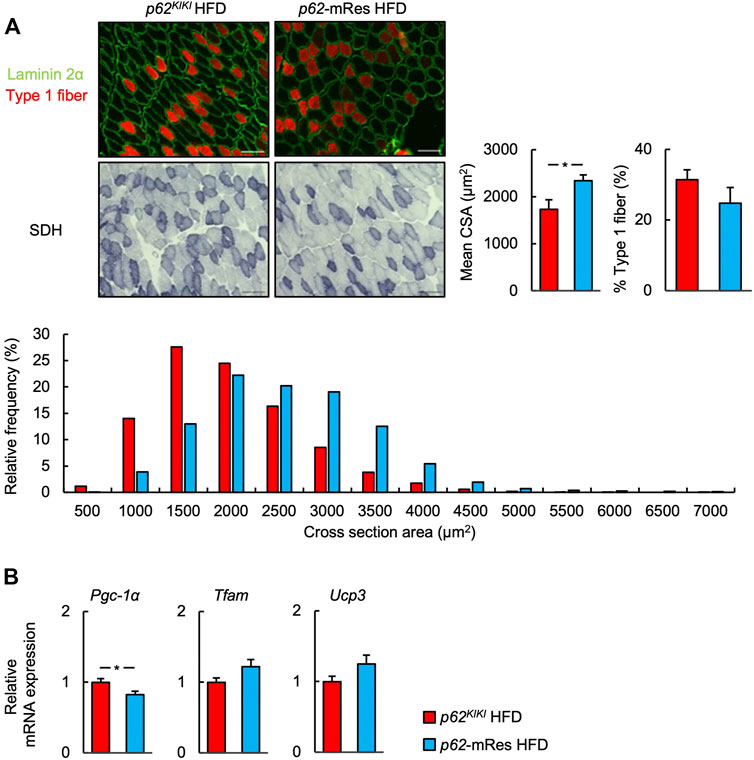
FIGURE 3. p62 in muscle increases muscle skeletal muscle fiber size. (A) Representative images of fluorescence immunostaining for laminin 2α (green) and slow myosin heavy chain (type 1 fibers, red), and succinate dehydrogenase (SDH)-stained sections of tibialis anterior muscles from 25-week-old p62KIKI and p62-mRes mice fed an HFD. Scale bars represent 100 μm. Skeletal muscle fiber cross-sectional area (CSA), percentage of type 1 fibers, and skeletal muscle fiber CSA distribution histograms for 25-week-old p62KIKI and p62-mRes mice fed an HFD (n = 4–5/group). (B) mRNA expression of mitochondria-related genes (Pgc-1α, Tfam, and Ucp3) by qPCR analysis (n = 8/group). Values are mean ± SEM. *p < 0.05 (unpaired t-test).
p62 expression in muscle reduces the serum concentrations of NEFA and LDL-C
Serum biochemical parameters were measured under fed conditions (Figure 4, Supplementary Figure S3A). Although the serum TG concentration was not affected by p62 expression in muscle, the serum NEFA concentration of p62-mRes mice consuming an HFD was significantly lower than that of p62KIKI mice consuming the same diet. The serum HDL-C concentration was not significant. The serum LDL-C concentration was lower in p62-mRes mice consuming an HFD than in p62KIKI mice consuming same diet. The circulating ALT, AST, and LDH activities were not affected by p62 expression in muscle.
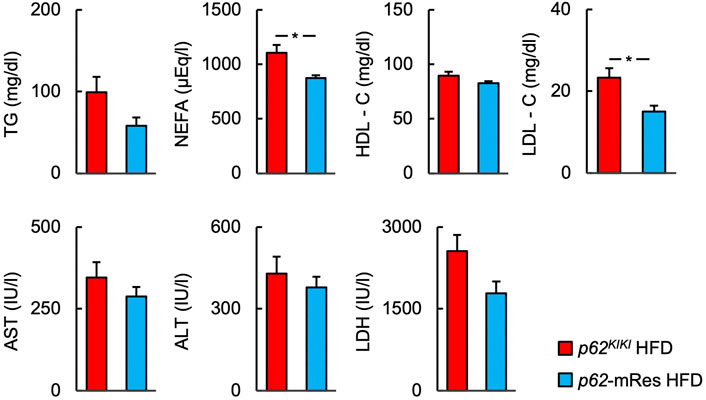
FIGURE 4. p62 in muscle reduces the serum concentrations of NEFA and LDL-C. Serum biochemistry [the triglyceride (TG), non-esterified fatty acids (NEFA), high-density lipoprotein-cholesterol (HDL-C), and low-density lipoprotein-cholesterol (LDL-C) concentrations; and the aspartate aminotransferase (AST), alanine aminotransferase (ALT), and lactate dehydrogenase (LDH) activities] in the fed state (n = 6/group). Values are mean ± SEM. *p < 0.05 (unpaired t-test).
p62 in muscle ameliorates obesity-induced glucose intolerance and insulin resistance
The glucose tolerance and insulin resistance of mice with or without muscle p62 expression were evaluated using ipGTT and ipITT. In both the NC and HFD-fed groups, ipGTT at 13 weeks of age was characterized by lower blood glucose concentrations following glucose administration and a smaller area under the glucose curve in those with p62 gene rescue in muscle (Figure 5A, Supplementary Figure S3B). However, only the NC group showed lower post-glucose load blood glucose concentration, and area under the curve on ipGTT at 21 weeks of age (Supplementary Figure S3B). These findings imply that p62 in muscle improves obesity-associated glucose intolerance. At 14 and 22 weeks of age, there were no clear differences on ipITT in the NC group (Supplementary Figure S3B), but at 22 weeks of age, HFD-fed p62-mRes mice showed lower fasting and post-insulin blood glucose concentrations and area under the curve (Figure 5B). Thus, p62 in muscle protects against severe obesity-induced insulin resistance in mice.
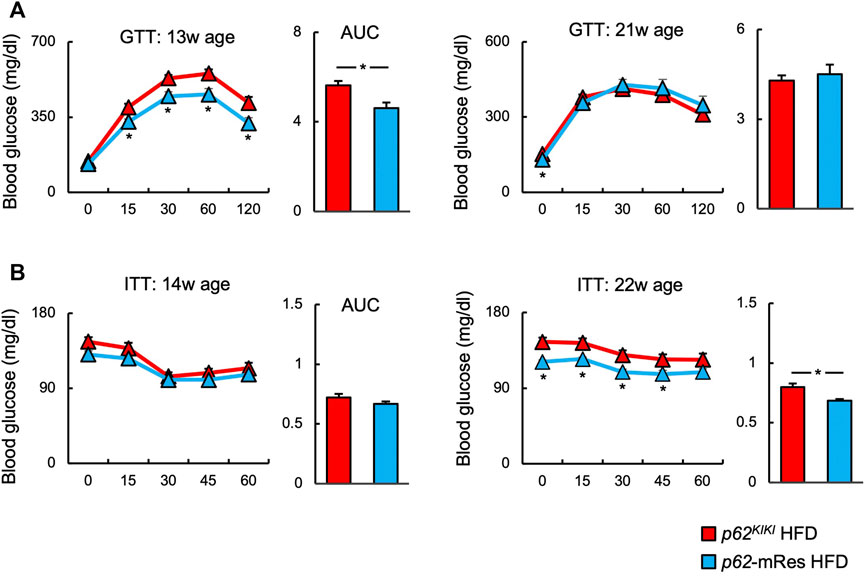
FIGURE 5. p62 in muscle ameliorates obesity-associated glucose intolerance and insulin resistance. (A) Changes in blood glucose concentration and area under the curve (AUC) during intraperitoneal glucose tolerance testing (ipGTT) at 13 and 21 weeks of age in HFD-fed (n = 8–14/group) mice. (B) Changes in blood glucose concentration and area under the curve during intraperitoneal insulin tolerance testing (ipITT) at 14 and 22 weeks of age in HFD-fed (n = 10–14/group) mice. Values are mean ± SEM. *p < 0.05 (unpaired t-test).
p62 in muscle is involved in the activation of mTOR and helps determine GLUT4 expression in skeletal muscle
Immunoblotting analyses were performed to investigate the molecular mechanism by which p62 in muscle increases muscle mass and ameliorates insulin resistance in HFD-fed mice (Figure 6). The phosphorylation (p-mTOR ser 2,448) and total protein expression of mTOR were higher in the muscle of p62-mRes mice than in p62KIKI mice, implying that mTOR activation is increased by p62. The phosphorylation of AKT (p-AKT Ser 473) also tended to be higher. Furthermore, the expression of the insulin-stimulated glucose transporter GLUT4 in skeletal muscle was higher in HFD-fed p62-mRes. Thus, p62 in muscle may promote skeletal muscle protein synthesis by activating mTOR and ameliorate insulin resistance via the AKT-GLUT4 pathway.
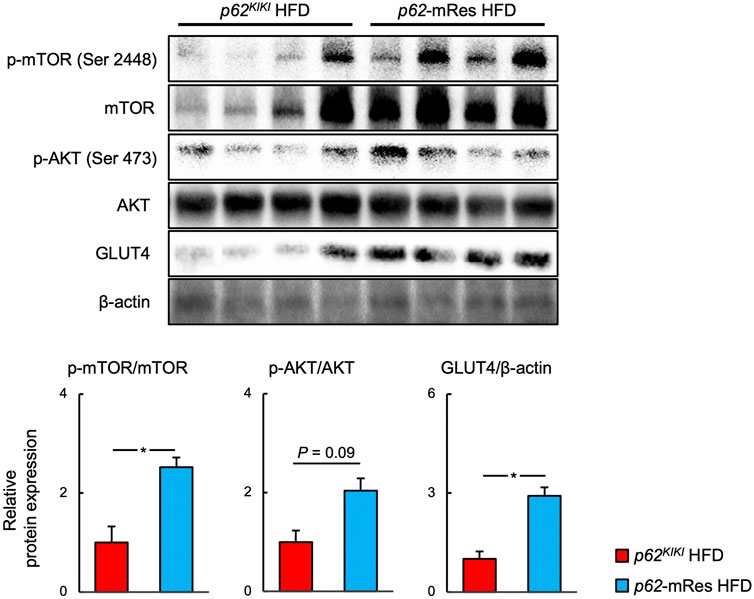
FIGURE 6. p62 in muscle activates mTOR and increases the expression of GLUT 4. Representative immunoblots of quadriceps muscle for the phosphorylation of mTOR (p-mTOR, Ser 2,448), total mTOR, phosphorylation of AKT (p-AKT, Ser 473), total AKT, GLUT4, and β-actin in p62KIKI and p62-mRes mice fed an HFD. Quantification of protein levels. p-mTOR and p-AKT levels were normalized to those of total mTOR or total AKT. GLUT4 levels were normalized to those of β-actin (n = 5–6/group). Values are mean ± SEM. *p < 0.05 (unpaired t-test).
p62 in muscle retards the progression of NASH
p62-KO mice develop NASH, featuring hepatic inflammation and fibrosis, when fed an HFD (Duran et al., 2016; Miura et al., 2021). Because skeletal muscle insulin resistance is associated with the development and progression of NASH (Bhanji et al., 2017), we next investigated whether the maintenance of skeletal muscle function by p62 would affect the liver pathology of the mice. Histological analysis using the SAF score showed that HFD-feeding caused NASH. Interestingly, the hepatic steatosis and inflammation of p62-mRes mice were less marked compared with those of p62KIKI mice (Figure 7A). There was no significant difference in the fibrosis score, but there tended to be less fibrosis in p62-mRes mice and there was a significantly smaller area of Sirius red staining (Figure 7A). Similar to the findings of previous studies, the NC-fed mice did not develop NASH (Supplementary Figure S4). qPCR analysis showed that the expression of Tgf-β1, which promotes liver fibrosis, was lower in p62-mRes mice, but the expression of other markers of inflammation (Tnfa and Il-1β) and fibrosis (Col1a1) were unaffected (Figure 7B). Thus, there were no differences in the expression of genes encoding pro-inflammatory cytokines; the cytokine gene that was expressed at changes in p62-mRes mice may be considered to be anti-inflammatory and pro-fibrotic. These findings imply that p62 in muscle retards the progression of NASH via a muscle-liver axis.
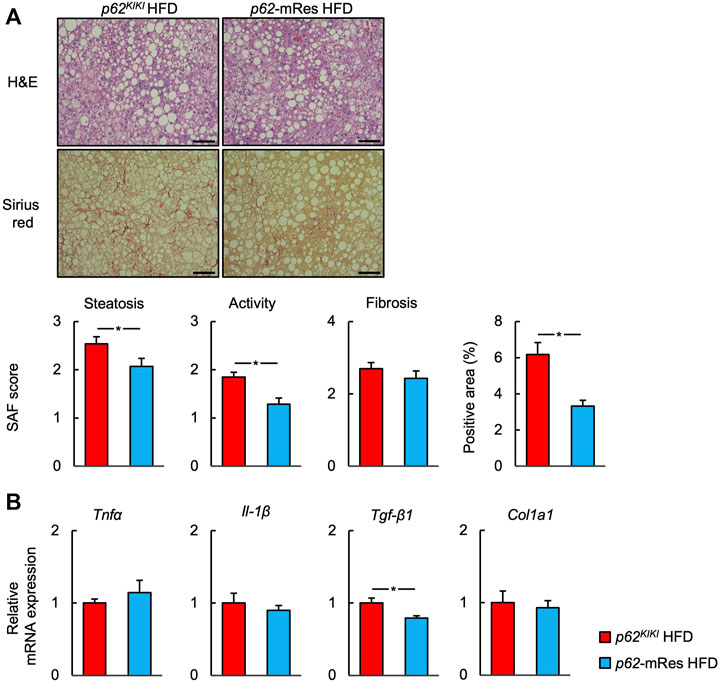
FIGURE 7. p62 expression in muscle retards the progression of NASH. (A) Representative hematoxylin and eosin (H&E) and Sirius red-stained sections of liver from 25-week-old p62KI/KI and p62-mRes mice fed an HFD. Scale bars represent 100 μm. The steatosis, activity, and fibrosis (SAF) score and area positive for Sirius red staining (n = 13–14/group). (B) mRNA expression of proinflammatory cytokines (Tnfα and Il-1β) and fibrosis-related genes (Tgf-β1, and Col1a1) (n = 8/group). Values are mean ± SEM. *p < 0.05 (unpaired t-test).
Discussion
In the present study, we have used our newly generated muscle-specific p62 gene rescue mice (p62-mRes) to demonstrate that p62 in muscle 1) increases muscle mass and strength during HFD-feeding, 2) improves glucose tolerance and insulin resistance without affecting body mass, 3) activates mTOR signaling and increases GLUT4 expression, and 4) retards the progression of NASH, a common of feature of the metabolic syndrome.
The insulin resistance associated with overweight/obesity is a risk factor for many diseases (Kodama et al., 2014; Younossi, 2019), and it is important to understand the mechanisms whereby organisms may protect themselves against this. p62-KO mice show hyperphagia-induced obesity secondary to abnormal leptin signaling. They exhibit a phenotype similar to metabolic syndrome in humans, which includes insulin resistance, glucose intolerance, and NAFL; and HFD-feeding exacerbates these defects (Okada et al., 2009; Harada et al., 2013; Duran et al., 2016; Miura et al., 2021). However, it remains to be determined whether the phenotype of the p62-KO mice is the result of the deletion of the p62 gene or is simply obesity-related. Additionally, the skeletal muscle is an important target of insulin, given that represents the largest glucose store in the body, but the role of p62 in muscle remains to be fully characterized. To address these deficiencies, we generated p62-mRes mice, which express p62 only in muscle, and were derived from p62-knock-in mice (p62KIKI, Figure 1). Both the p62KIKI and p62-mRes mice developed severe obesity when fed an HFD, but p62 expression in muscle did not affect the body mass of the mice (Figure 2A). The masses of the epididymal adipose tissue (WAT) depots were also not affected by genotype (Figure 2C, Supplementary Figure S1C), despite the HFD-induced increase in body mass. These results suggest that the HFD-fed p62/Sqstm1 knock-out mice may have a lipodystrophic phenotype. This implies that p62 in muscle does not affect energy expenditure or prevent the development of obesity.
p62 gene rescue in muscle increased the limb skeletal muscle mass, strength, and fiber size of the HFD-fed mice (Figures 2B,D, Figure 3A). We also identified the activation of mTOR in the skeletal muscle of the muscle p62-expressing mice (Figure 6), which may be responsible for this phenotype. mTOR is a key positive regulator of muscle protein synthesis (Bodine et al., 2001; Glass, 2005). The relationship between p62 and mTOR in skeletal muscle is unclear, but it has been reported that p62 increases mTOR activity in other tissues and cells (Duran et al., 2011; Katsuragi et al., 2015). Although it has previously been shown that overweight is associated with higher skeletal muscle mass (Newman et al., 2003), in the present study, the muscle mass and muscle fiber size were greater in HFD-fed p62-mRes mice, but not in HFD-fed p62KIKI mice (Figures 2B,D, Figure 3A). These results suggest that p62 gene deletion causes abnormal mTOR signaling and attenuates muscle protein synthesis in p62KIKI, but p62 gene rescue in muscle restores mTOR activation, which may result in muscle hypertrophy. Thus, p62 may be a positive regulator of protein synthesis in skeletal muscle.
Muscle-specific p62 expression reduced the fasting blood glucose concentration of the mice and improved their glucose tolerance and insulin resistance when consuming an HFD (Figure 5). Increases in circulating NEFA concentrations cause insulin resistance (Kahn et al., 2006), and p62 expression in muscle may at least in part ameliorate insulin resistance by reducing serum NEFA and LDL-C concentrations (Figure 4). It has been reported that p62 is involved in mitochondrial function in brown adipose tissue, and that p62 deficiency causes decreases in mitochondrial oxygen consumption capacity and thermogenesis in brown adipose tissue (Muller et al., 2013). However, the relationship between p62 and mitochondrial respiratory capacity in muscle has not been characterized. In the present study, the gene expression of Pgc1a in muscle was lower in HFD-fed p62-mRes mice, which was not consistent with the expression of Tfam and Ucp3. Moreover, no difference in SDH staining was observed, so we have no evidence that muscle mitochondrial content or activity is altered by muscle p62 expression. However, in a previous study, p62 deficiency was associated with lower expression of Pgc-1α in BAT (Muller et al., 2013). Thus, when taken together with the lower serum NEFA and LDL-C concentrations in p62-mRes mice, the results of the present study suggest that p62 may promote mitochondrial fatty acid uptake and β-oxidation in skeletal muscle by different mechanisms to its expression in BAT. Thus, it is possible that p62 may contribute to the amelioration of insulin resistance by enhancing lipid metabolism in skeletal muscle. In addition, the translocation of GLUT4 to the cell membrane in response to the phosphorylation of AKT is a critical step in insulin-stimulated glucose uptake in skeletal muscle. In HFD-fed p62-mRes mice, the phosphorylation of AKT (Ser 473) tended to be higher and GLUT4 protein expression was higher than that of p62KIKI mice (Figure 6). It has been reported that the phosphorylation of AKT (Ser 473) is increased via the activation of NF-E2-related factor 2 (Nrf2) in mice overexpressing p62 in hepatocytes, resulting in a reduction in serum glucose concentration (He et al., 2020). Because there were no differences in the body mass of the p62-mRes and p62KIKI mice, it is possible that p62 gene rescue in muscle ameliorates the glucose intolerance and insulin resistance of the mice through an increase in GLUT4 expression.
AKT is a regulator of mTOR, and its phosphorylation induces mTOR activation via the inhibition of TSC1/2 (Bodine et al., 2001). The most likely explanation is that p62 is involved in phosphorylation of AKT, and thereby both promotes glucose uptake in skeletal muscle via GLUT4, and activates mTOR, contributing to the increases in skeletal muscle mass and strength. However, although amino acid stimulation induces mTOR activation independently of AKT signaling (Yoon, 2017), a previous study showed that p62 increases the sensitivity of mTOR to amino acids (Duran et al., 2011; Sugiyama et al., 2017). p62 interacts with raptor, a component of mTOR complex 1 (mTORC1) in the presence of amino acids and plays an important role in the recruitment of mTORC1 to lysosomes, a critical step in mTORC1 activation (Duran et al., 2011). Furthermore, p62-deficient MEF cells show lower amino acid-induced mTOR activation than wild-type cells, but the deletion of p62 does not affect AKT-mediated mTOR activation in response to insulin, suggesting that p62 promotes mTOR activation independently of AKT. Because there is a link between skeletal muscle mass and insulin resistance, a resistance training-induced increase in skeletal muscle mass ameliorates insulin resistance (Bucci et al., 2016). Therefore, the AKT-independent activation of mTOR by p62 and the resulting increase in skeletal muscle mass might at least in part provide the mechanism by which p62 in muscle ameliorates insulin resistance independent of the AKT-GLUT4 pathway. The association of p62 with AKT and GLUT4, or mTOR, and the detailed molecular mechanisms whereby p62 induces an increase in skeletal muscle mass and an amelioration of insulin resistance require further study.
A number of extra-hepatic factors are involved in the development and progression of NASH (Tilg and Moschen., 2010), and it has been shown that skeletal muscle loss (sarcopenia) and insulin resistance in skeletal muscle promote the progression of NASH via a muscle-liver axis (Bhanji et al., 2017). In the present study, HFD-feeding induced NASH, including hepatic inflammation and fibrosis, in p62KIKI mice, whereas p62 gene rescue in muscle retarded the progression of NASH, including hepatic steatosis, inflammation, and fibrosis, without affecting body mass (Figure 7A). Additionally, the hepatic mRNA expression of Tgf-β1, a profibrotic factor, was low in p62-mRes mice (Figure 7B). The hyperglycemia and hyperinsulinemia associated with insulin resistance activate hepatic stellate cells (HSCs) and promote hepatic fibrosis (Svegliati-Baroni et al., 1999; Sugimoto et al., 2005), suggesting that the improvement in glucose metabolism induced by p62 in muscle may contribute to the retardation of NASH progression via a muscle-liver axis. There is no established means of preventing or treating NAFLD/NASH, other than diet and exercise therapy. Exercise ameliorates the hepatic steatosis and fibrosis independently of weight loss (Oh et al., 2021), and in addition, regular exercise activates p62 in skeletal muscle (Yamada et al., 2019). The results of the present study suggest that muscle p62 may play a role in the amelioration of insulin resistance and NAFLD/NASH induced by regular exercise, and imply that further studies should be performed regarding the relationship between exercise training and p62.
There were several limitations to the present study. First, because wild-type mice were not used in the present study, we could not directly evaluate the extent to which muscle-specific p62 gene expression restores the muscle atrophy, insulin resistance, and NASH induced by p62 deficiency. Therefore, in the future, more detailed analysis, including of wild-type mice and muscle-specific p62 knock-out mice will be necessary. Second, we did not conduct a detailed analysis of body composition. Therefore, it would be important to analyze the changes in visceral fat mass induced by p62 expression in muscle, which influences the development of insulin resistance and NASH, by means of magnetic resonance imaging and other methods. Third, although muscle p62 expression reduced the serum NEFA concentration, the underlying mechanism has not been fully established. Because high circulating serum NEFA concentration is a risk factor for insulin resistance, an investigation of the direct effects of muscle p62 expression on fatty acid uptake and mitochondrial respiratory capacity in skeletal muscle should also be performed in the future. Fourth, although adipose tissue, along with skeletal muscle and liver, is involved in the pathogenesis of insulin resistance, there has been a lack of analysis of the relationship between insulin resistance in adipose tissue and parameters such as the fasting circulating insulin and NEFA concentrations. The muscle-fat and muscle-liver-fat axes represent important avenues of research to improve understanding of the mechanism of whole-body insulin resistance. Future studies should analyze the mechanism of cross-talk between organs mediated by p62 that are involved in insulin resistance.
In summary, we have shown that p62 expression in muscle increases muscle mass and strength and ameliorates glucose intolerance and insulin resistance, all of which likely contribute to a retardation of the HFD-induced progression of NASH in a transgenic mouse model. The p62-associated improvements in skeletal muscle mass and function may be mediated through greater activation of mTOR and an increase in GLUT4 in muscle. Thus, muscle p62 may represent a molecular target for the management of skeletal muscle mass and function in obesity.
Data availability statement
The raw data supporting the conclusions of this article will be made available by the authors, without undue reservation.
Ethics statement
The animal study was reviewed and approved by Animal Care and Use Committee of the University of Tsukuba.
Author contributions
Conception and design of research: IM, KO, EW, HS, and JS. Performed experiments: IM, KO, AI, TW, and KT. Analyzed data: IM, KO, AI, and SA. Interpreted results of experiments: IM, KO, AI, EW, HS, SA, and JS. Prepared figures: IM and KO. Drafted manuscript: IM and KO. Edited and revised manuscript: KO and JS. Approved final version of manuscript: IM, KO, AI, EW, TW, KT, HS, SA, and JS.
Funding
This work was supported in part by the Japan Society for the Promotion of Science (JSPS) KAKENHI (Grant numbers 20K08275, 21K07933, 21H03372, 22K08072, 21K19694, 20H04119, 21H03010, 22H03527) and the Japanese Society of Gastroenterology (JSGE) Grant, and Support for Pioneering Research Initiated by the Next Generation (JPMJSP2124)
Conflict of interest
The authors declare that the research was conducted in the absence of any commercial or financial relationships that could be construed as a potential conflict of interest.
Publisher’s note
All claims expressed in this article are solely those of the authors and do not necessarily represent those of their affiliated organizations, or those of the publisher, the editors and the reviewers. Any product that may be evaluated in this article, or claim that may be made by its manufacturer, is not guaranteed or endorsed by the publisher.
Supplementary material
The Supplementary Material for this article can be found online at: https://www.frontiersin.org/articles/10.3389/fphys.2022.993995/full#supplementary-material
Supplementary Figure 1 | Changes in body composition in the NC-fed mice. (A) Time course of the changes in body mass in p62KIKI and p62-mRes mice fed normal chow (NC, p62KIKI; n = 12, p62-mRes; n = 8). (B) Masses of the quadriceps, tibialis anterior (TA), and soleus muscles of mice in each group at 25 weeks of age (n = 8–12/group). (C) Masses of the epididymal adipose tissue (WAT) and liver of mice in each group at 25 weeks of age (n = 8–12/group). (D) Grip strength at 17, 21, and 25 weeks of age (n = 7–12/group). (E) Representative hematoxylin and eosin (H&E)-stained sections of TA muscles from 25-week-old p62KIKI and p62-mRes mice fed NC. Scale bars represent 100 μm. Values are mean ± SEM. * p < 0.05 (unpaired t-test).
Supplementary Figure 2 | Analysis of muscle fiber size and type and mitochondria-related parameters in the NC-fed mice. (A) Representative images of fluorescence immunostaining for laminin 2α (green) and slow myosin heavy chain (type 1 fibers, red), and succinate dehydrogenase (SDH)-stained sections of tibialis anterior muscles from 25-week-old p62KIKI and p62-mRes mice fed NC. Scale bars represent 100 μm. Skeletal muscle fiber cross-sectional area (CSA), percentage of type 1 fibers, and skeletal muscle fiber CSA distribution histograms for 25-week-old p62KIKI and p62-mRes mice fed NC (n = 4/group). (B) mRNA expression of mitochondria-related genes (Pgc-1α, Tfam, and Ucp3) by qPCR analysis (n = 8/group). Values are mean ± SEM. * p < 0.05 (unpaired t-test).
Supplementary Figure 3 | Evaluation of blood biochemistry, glucose tolerance and insulin resistance in the NC-fed mice. (A) Serum biochemistry (the triglyceride [TG], non-esterified fatty acids [NEFA], high-density lipoprotein-cholesterol [HDL-C], and low-density lipoprotein-cholesterol [LDL-C] concentrations; and the aspartate aminotransferase [AST], alanine aminotransferase [ALT], and lactate dehydrogenase [LDH] activities) in the fed state (n = 6/group). (B) Changes in blood glucose concentration and area under the curve (AUC) during intraperitoneal glucose tolerance testing (ipGTT) at 13 and 21°weeks of age in NC-fed (n = 7–12/group) mice. Changes in blood glucose concentration and area under the curve during intraperitoneal insulin tolerance testing (ipITT) at 14 and 22°weeks of age in NC-fed (n = 7–12/group) mice. Values are mean ± SEM. * p < 0.05 (unpaired t-test)
Supplementary Figure 4 | Evaluation of liver lesions in the NC-fed mice. (A) Representative hematoxylin and eosin (H&E) and Sirius red-stained sections of liver from 25-week-old p62KI/KI and p62-mRes mice fed NC. Scale bars represent 100 μm. (B) mRNA expression of proinflammatory cytokines (Tnfα and Il-1β) and fibrosis-related genes (Tgf-β1, and Col1a1) (n = 8/group). Values are mean ± SEM. * p < 0.05 (unpaired t-test).
Abbreviations
AKT, Protein kinase B; ALT, alanine aminotransferase; AST, aspartate aminotransferase; Col1a1, collagen type 1 alpha; GLUT4, glucose transporter type 4; H&E, hematoxylin and eosin; HDL-C, high-density lipoprotein cholesterol; Il-1β, interleukin 1 beta; LDH, lactate dehydrogenase; LDL-C, low-density lipoprotein cholesterol; mTOR, mechanistic target of rapamycin; NEFA, non-esterified fatty acid; Pgc-1α, peroxisome proliferator-activated receptor gamma coactivator 1 alpha; SDH, succinate dehydrogenase; Tfam, mitochondrial transcription factor A; TG, triglyceride; Tgf-β1, transforming growth factor beta 1; Tnfα, tumor necrosis factor alpha; Ucp3, uncoupling protein 3.
References
Argiles J. M., Campos N., Lopez-Pedrosa J. M., Rueda R., Rodriguez-Manas L. (2016). Skeletal muscle regulates metabolism via interorgan crosstalk: Roles in health and disease. J. Am. Med. Dir. Assoc. 17 (9), 789–796. doi:10.1016/j.jamda.2016.04.019
Bedossa P., Poitou C., Veyrie N., Bouillot J. L., Basdevant A., Paradis V., et al. (2012). Histopathological algorithm and scoring system for evaluation of liver lesions in morbidly obese patients. Hepatology 56 (5), 1751–1759. doi:10.1002/hep.25889
Bhanji R., Narayanan P., Allen A. M., Malhi H., Watt K. D. (2017). Sarcopenia in hiding: The risk and consequence of underestimating muscle dysfunction in nonalcoholic steatohepatitis. Hepatology 66 (6), 2055–2065. doi:10.1002/hep.29420
Bodine S. C., Stitt T. N., Gonzalez M., Kline W. O., Stover G. L., Bauerlein R., et al. (2001). Akt/mTOR pathway is a crucial regulator of skeletal muscle hypertrophy and can prevent muscle atrophy in vivo. Nat. Cell Biol. 3 (11), 1014–1019. doi:10.1038/ncb1101-1014
Bucci M., Huovinen V., Guzzardi M. A., Koskinen S., Raiko J. R., Lipponen H., et al. (2016). Resistance training improves skeletal muscle insulin sensitivity in elderly offspring of overweight and obese mothers. Diabetologia 59 (1), 77–86. doi:10.1007/s00125-015-3780-8
Duran A., Amanchy R., Linares J. F., Joshi J., Abu-Baker S., Porollo A., et al. (2011). p62 is a key regulator of nutrient sensing in the mTORC1 pathway. Mol. Cell 44 (1), 134–146. doi:10.1016/j.molcel.2011.06.038
Duran A., Hernandez E. D., Reina-Campos M., Casrilla E. A., Sunbramaniam S., Raghunandan S., et al. (2016). p62/SQSTM1 by binding to vitamin D receptor inhibits hepatic stellate cell activity, fibrosis, and liver cancer. Cancer Cell 30 (4), 595–609. doi:10.1016/j.ccell.2016.09.004
Glass D. J. (2005). Skeletal muscle hypertrophy and atrophy signaling pathways. Int. J. Biochem. Cell Biol. 37 (10), 1974–1984. doi:10.1016/j.biocel.2005.04.018
Guo S. (2014). Insulin signaling, resistance, and the metabolic syndrome: Insights from mouse models into disease mechanisms. J. Endocrinol. 220 (2), T1–T23. doi:10.1530/JOE-13-0327
Harada H., Warabi E., Matsuki T., Yanagawa T., Okada K., Uwayama J., et al. (2013). Deficiency of p62/sequestosome 1 causes hyperphagia due to leptin resistance in the brain. J. Neurosci. 33 (37), 14767–14777. doi:10.1523/JNEUROSCI.2954-12.2013
He L., Antonucci L., Yamachika S., Zhang Z., Taniguchi K., Umemura A., et al. (2020). NRF2 activates growth factor genes and downstream AKT signaling to induce mouse and human hepatomegaly. J. Hepatol. 72 (6), 1182–1195. doi:10.1016/j.jhep.2020.01.023
Hong S., Chang Y., Jung H. S., Yun K. E., Shin H., Ryu S. (2017). Relative muscle mass and the risk of incident type 2 diabetes: A cohort study. PLos One 12 (11), e0188650. doi:10.1371/journal.pone.0188650
Kahn S. E., Hull R. L., Utzschneider K. M. (2006). Mechanisms linking obesity to insulin resistance and type 2 diabetes. nature 444 (7121), 840–846. doi:10.1038/nature05482
Katsuragi Y., Ichimura Y., Komatsu M. (2015). p62/SQSTM1 functions as a signaling hub and an autophagy adaptor. FEBS J. 282 (24), 4672–4678. doi:10.1111/febs.13540
Kodama S., Horikawa C., Fujihara K., Yoshizawa S., Yachi Y., Tanaka S., et al. (2014). Quantitative relationship between body weight gain in adulthood and incident type 2 diabetes: A meta-analysis. Obes. Rev. 15 (3), 202–214. doi:10.1111/obr.12129
Loomba R., Friedman S. L., Shulman G. I. (2021). Mechanisms and disease consequences of nonalcoholic fatty liver disease. Cell 184 (10), 2537–2564. doi:10.1016/j.cell.2021.04.015
Miura I., Komine S., Okada K., Wada S., Warabi E., Uchida F., et al. (2021). Prevention of non-alcoholic steatohepatitis by long-term exercise via the induction of phenotypic changes in Kupffer cells of hyperphagic obese mice. Physiol. Rep. 9 (9), e14859. doi:10.14814/phy2.14859
Muller T. D., Lee S. J., Jastroch M., Kabra D., Stemmer K., Aicheler M., et al. (2013). p62 links β-adrenergic input to mitochondrial function and thermogenesis. J. Clin. Invest. 123 (1), 469–478. doi:10.1172/JCI64209
Newman A. B., Kupelian V., Visser M., Simonsick E., Nevitt M., Goodpaster B., et al. (2003). Sarcopenia: Alternative definitions and associations with lower extremity function. J. Am. Geriatr. Soc. 51 (11), 1602–1609. doi:10.1046/j.1532-5415.2003.51534.x
Oh S., Tsujimoto T., Kim B., Uchida F., Suzuki H., Iizumi S., et al. (2021). Weight-loss-independent benefits of exercise on liver steatosis and stiffness in Japanese men with NAFLD. JHEP Rep. 3 (3), 100253. doi:10.1016/j.jhepr.2021.100253
Okada K., Yanagawa T., Warabi E., Yamastu K., Uwayama J., Takeda K., et al. (2009). The alpha-glucosidase inhibitor acarbose prevents obesity and simple steatosis in sequestosome 1/A170/p62 deficient mice. Hepatol. Res. 39 (5), 490–500. doi:10.1111/j.1872-034X.2008.00478.x
Rommel C., Bodine S. C., Clarke B. A., Rossman R., Nunez L., Stitt T. N., et al. (2001). Mediation of IGF-1-induced skeletal myotube hypertrophy by PI(3)K/Akt/mTOR and PI(3)K/Akt/GSK3 pathways. Nat. Cell Biol. 3 (11), 1009–1013. doi:10.1038/ncb1101-1009
Sakuma K., Kinoshita M., Ito Y., Aizawa M., Aoi W., Yamaguchi A. (2016). p62/SQSTM1 but not LC3 is accumulated in sarcopenic muscle of mice. J. Cachexia Sarcopenia Muscle 7 (2), 204–212. doi:10.1002/jcsm.12045
Sauer B. (1987). Functional expression of the cre-lox site-specific recombination system in the yeast Saccharomyces cerevisiae. Mol. Cell. Biol. 7 (6), 2087–2096. doi:10.1128/mcb.7.6.2087
Shida T., Akiyama K., Oh S., Sawai A., Isobe T., Okamoto Y., et al. (2018). Skeletal muscle mass to visceral fat area ratio is an important determinant affecting hepatic conditions of non-alcoholic fatty liver disease. J. Gastroenterol. 53 (4), 535–547. doi:10.1007/s00535-017-1377-3
Shoelson S. E., Lee J., Goldfine A. B. (2006). Inflammation and insulin resistance. J. Clin. Invest. 116 (7), 1793–1801. doi:10.1172/JCI29069
Sugimoto R., Enjoji M., Kojima M., Tsuruta S., Fukushima M., Iwao M., et al. (2005). High glucose stimulates hepatic stellate cells to proliferate and to produce collagen through free radical production and activation of mitogen-activated protein kinase. Liver Int. 25 (5), 1018–1026. doi:10.1111/j.1478-3231.2005.01130.x
Sugiyama M., Yoshizumi T., Yoshida Y., Bekki Yuki., Matsumoto Y., Yoshiya S., et al. (2017). p62 promotes amino acid sensitivity of mTOR pathway and hepatic differentiation in adult liver stem/progenitor cells. J. Cell. Physiol. 232 (8), 2112–2124. doi:10.1002/jcp.25653
Svegliati-Baroni G., Ridolfi F., Di Sario A., Casini A., Marucci L., Gaggiotti G., et al. (1999). Insulin and insulin-like growth factor-1 stimulate proliferation and type I collagen accumulation by human hepatic stellate cells: Differential effects on signal transduction pathways. Hepatology 29 (6), 1743–1751. doi:10.1002/hep.510290632
Tanaka M., Masuda S., Yamakage H., Inoue T., Ohue-Kitano R., Yokota S., et al. (2018). Role of serum myostatin in the association between hyperinsulinemia and muscle atrophy in Japanese obese patients. Diabetes Res. Clin. Pract. 142, 195–202. doi:10.1016/j.diabres.2018.05.041
Tilg H., Moschen A. R. (2010). Evolution of inflammation in nonalcoholic fatty liver disease: The multiple parallel hits hypothesis. Hepatology 52 (5), 1836–1846. doi:10.1002/hep.24001
Umemura A., He F., Taniguchi K., Nakagawa H., Yamachika S., Font-Burgada J., et al. (2016). p62, upregulated during preneoplasia, induces hepatocellular carcinogenesis by maintaining survival of stressed HCC-initiating cells. Cancer Cell 29 (6), 935–948. doi:10.1016/j.ccell.2016.04.006
Yamada M., Iwata M., Warabi E., Oishi H., Lisa V. A., Okutsu M. (2019). p62/SQSTM1 and Nrf2 are essential for exercise-mediated enhancement of antioxidant protein expression in oxidative muscle. FASEB J. 33 (7), 8022–8032. doi:10.1096/fj.201900133R
Yoon M. S. (2017). mTOR as a key regulator in maintaining skeletal muscle mass. Front. Physiol. 8, 788. doi:10.3389/fphys.2017.00788
Younossi Z. M. (2019). Non-alcoholic fatty liver disease - a global public health perspective. J. Hepatol. 70 (3), 531–544. doi:10.1016/j.jhep.2018.10.033
Keywords: p62/SQSTM1, obesity, skeletal muscle, insulin resistance, non-alcoholic steatohepatitis
Citation: Miura I, Okada K, Ishii A, Warabi E, Watahiki T, To K, Shimano H, Ariizumi S and Shoda J (2022) p62/Sqstm1 rescue in muscle retards the progression of steatohepatitis in p62/Sqstm1-null mice fed a high-fat diet. Front. Physiol. 13:993995. doi: 10.3389/fphys.2022.993995
Received: 14 July 2022; Accepted: 12 October 2022;
Published: 01 November 2022.
Edited by:
Vassilis Mougios, Aristotle University of Thessaloniki, GreeceReviewed by:
Lionel Hebbard, James Cook University, AustraliaVictoria Jeanne Vieira-Potter, University of Missouri, United States
Copyright © 2022 Miura, Okada, Ishii, Warabi, Watahiki, To, Shimano, Ariizumi and Shoda. This is an open-access article distributed under the terms of the Creative Commons Attribution License (CC BY). The use, distribution or reproduction in other forums is permitted, provided the original author(s) and the copyright owner(s) are credited and that the original publication in this journal is cited, in accordance with accepted academic practice. No use, distribution or reproduction is permitted which does not comply with these terms.
*Correspondence: Junichi Shoda, U2hvZGFqQG1kLnRzdWt1YmEuYWMuanA=
†These authors have contributed equally to this work
 Ikuru Miura
 Kosuke Okada2†
 Akiko Ishii
 Eiji Warabi
 Hitoshi Shimano
 Junichi Shoda