 Christos Kotsalos1
 Franck Raynaud1
 Jonas Lätt1
 Ritabrata Dutta2Frank Dubois3
 Karim Zouaoui Boudjeltia4
 Bastien Chopard1*
- 1Computer Science Department, University of Geneva, Geneva, Switzerland
- 2Department of Statistics, University of Warwick, Warwick, United Kindom
- 3Microgravity Research Center, Ecole Polytechnique, Université Libre de Bruxelles, Bruxelles, Belgium
- 4Laboratory of Experimental Medicine (ULB222), Faculty of Medicine, Université Libre de Bruxelles & CHU-Charleroi, Charleroi, Belgium
The transport of platelets in blood is commonly assumed to obey an advection-diffusion equation with a diffusion constant given by the so-called Zydney-Colton theory. Here we reconsider this hypothesis based on experimental observations and numerical simulations including a fully resolved suspension of red blood cells and platelets subject to a shear. We observe that the transport of platelets perpendicular to the flow can be characterized by a non-trivial distribution of velocities with and exponential decreasing bulk, followed by a power law tail. We conclude that such distribution of velocities leads to diffusion of platelets about two orders of magnitude higher than predicted by Zydney-Colton theory. We tested this distribution with a minimal stochastic model of platelets deposition to cover space and time scales similar to our experimental results, and confirm that the exponential-powerlaw distribution of velocities results in a coefficient of diffusion significantly larger than predicted by the Zydney-Colton theory.
1 Introduction
Platelets, or thrombocytes, are an essential blood constituent, from a physiological and heamodynamical point of view. Their motion is mainly a consequence of mechanical and hydrodynamic interactions with deformable red blood cells and the plasma, which makes an accurate description of their transport challenging.
Among the blood constituents, platelets are the second most numerous cells in blood, after red blood cells, with a concentration of 150–450 × 109/L. They are involved in multiple physiological and pathophysiological processes such as haemostasis, thrombosis, clot retraction, vessel constriction and repair, inflammation, including promotion of atherosclerosis, host defense, and even tumor growth/metastasis (Harrison (2005)). When needed, platelets respond rapidly through activation, adhesion, aggregation, release of the materials stored in their granules, etc. Any disorder in these physiological processes results in impaired haemostasis and inappropriate thrombus formation. For example, arterial thrombi can develop within atherosclerotic lesions resulting in stroke and heart attack, two of the major causes of morbidity and mortality in the western world Harrison (2005).
From a physical point of view, platelets are small rigid suspensions interacting with other, larger, deformable suspensions, the red blood cells. It is well recognized that the physics of such systems is rich and complicated Eckstein and Belgacem (1991); Kumar and Graham (2012). Processes such as margination and segregation are observed in which platelets move towards the wall of the system, while red blood cells concentrate in the center of the vessel, producing the so-called cell free layer at the wall (Kim et al. (2009); Fedosov et al. (2010); Carboni et al. (2016)).
Adhesion and aggregation of platelets depend not only on their affinity with the endothelium or the deposition surface but also on their flow towards this surface. Platelets movement in the blood is affected by their interactions with red blood cells (D’Apolito et al. (2015)). In order to properly interpret platelet function tests and evaluate if platelets are dysfunctional in a patient, it is important to identify and separate the effect of transport properties to the wall from the intrinsic biochemical platelets properties (adhesion and aggregation). In several diseases, the shape of red blood cells is modified, affecting platelet motion Boudjeltia et al. (2020). When analyzing the way platelets deposit on a surface, their adhesion and aggregation rates can only be determined if their flow is correctly known.
In a blood flow subject to a shear rate, platelets experience an enhanced random motion in the direction perpendicular to the flow. The accepted description of this process, the so-called Zydney-Colton theory (Zydney and Colton (1988)), is that platelets are subject to a diffusion process, whose diffusion coefficient depends on the shear rate
where DPRP is the diffusivity of platelets in a platelet-rich plasma (i.e. without red blood cells) with a typical value of
The present study was motivated by the determination of platelets adhesion and aggregation rates from in-vitro experiments with the Impact-R platelet analyzer device. It is made of a cylinder filled with whole blood and closed by two disks. The upper disk rotates to produce a prescribed shear flow and the lower disk is a deposition surface on which platelets can adhere and aggregate. In Chopard et al. (2017); Dutta et al. (2018, 2022) we show that platelet adhesion and aggregation rates can be computed from the in-vitro observations (deposition patterns in the Impact-R), by combining a mathematical model of platelets deposition and a machine learning technique. However, to explain the deposition pattern observed in our experiments, platelets must experience a large flow towards the deposition surface. More precisely, we found that with H = 0.35 and
The Zydney-Colton model has been extensively validated by numerous numerical studies in which red blood cells and platelets were resolved (Zhao and Shaqfeh (2011); Zhao et al. (2012); Reasor et al. (2013); Vahidkhah et al. (2014); Mehrabadi et al. (2015, 2016); Závodszky et al. (2019)). However, divergence from Zydney-Colton has also been observed and attributed to the presence of a drift term (Eckstein and Belgacem (1991); Crowl and Fogelson (2011); Kumar and Graham (2012)). While this leads to much higher diffusion than Zydney-Colton, it remains challenging to understand why such symmetry breaking occurs, at least with the geometry of the Impact-R.
In this context, we have developed a high-fidelity numerical blood flow solver, Palabos-npFEM, described and validated in Kotsalos et al. (2019, 2020). This computational framework is based on a lattice Boltzmann fluid solver with suspensions (red blood cells and platelets), whose deformable membranes are described with the finite element method (FEM). The fluid-blood cell interaction is computed with the immersed boundary method. Although not the purpose of the present discussion, we emphasize the fact that such numerical simulations are extremely demanding in computing resources, even for relatively small system sizes (much less than a cubic millimeter) and short periods (of the order of a second). In the present paper, we revisit platelets transport and propose a new characterization based on a probability distribution of their velocity. We estimate this distribution from high-fidelity blood flow simulations resolved at typical length and time scales similar to those considered in Müller et al. (2016); Závodszky et al. (2019), and we extrapolate platelets trajectory at much greater spatiotemporal scales using a surrogate stochastic model of platelets motion. We find that the resulting random walk process leads to a diffusion coefficient whose magnitude tends towards our in-vitro observations. We also argue that the traditional ways to compute the diffusion coefficient from the particle mean square displacement is very sensitive to finite size effects, hence resulting, for small systems, in a significant underestimation of the diffusion coefficient and questioning limitations of the Zydney-Colton theory at large spatiotemporal scales.
2 Methods
2.1 Palabos-npFEM framework
Palabos-npFEM is a computational framework for the simulation of blood flow with fully resolved constituents. The software computes the movement and deformation of red blood cells and platelets, and the complex interaction between them. The tool combines the lattice Boltzmann solver Palabos for the simulation of blood plasma (fluid phase), a finite element method (FEM) solver for the resolution of blood cells (solid phase), and an immersed boundary method (IBM) for the coupling of the two phases. Palabos-npFEM provides, on top of a CPU-only version, the option to simulate the deformable bodies on Graphic Processing Units (GPUs), thus the code is tailored for the fastest supercomputers Kotsalos et al. (2021).
In more details, the framework resolves blood cells like red blood cells and platelets individually (both trajectories and deformed state), including their detailed non-linear viscoelastic behavior and the complex interaction between them.
The fluid solver is based on the lattice Boltzmann method (LBM) and solves indirectly the weakly compressible Navier-Stokes equations. The solid solver is based on the nodal projective finite elements method (npFEM) Kotsalos et al. (2019), which offers an alternative way of describing elasticity. The npFEM framework is a mass-lumped linear finite element solver that resolves both the trajectories and deformations of the blood cells with high accuracy. The solver has the capability of capturing the rich and non-linear viscoelastic behaviour of red blood cells as shown and validated in Kotsalos et al. (2019). The platelets are simulated as nearly-rigid bodies by modifying the stiffness of the material. The implicit nature of the npFEM solver renders it capable of resolving extreme deformations with unconditional stability for arbitrary time steps. The fluid-solid interaction is realized by the immersed boundary method (IBM) and more specifically by the multi-direct forcing scheme proposed in Ota et al. (2012). The IBM imposes a no-slip boundary condition, so that each point of the surface and the ambient fluid moves with the same velocity.
Collisions between blood particles, whether red blood cells or platelets, are implemented through a repulsive force acting as a spring, when the surfaces delimiting two particles are getting too close to each other. In the current study, we employ the same parameters as reported in Kotsalos et al. (2019, 2020).
2.2 Probability distribution function of platelets absolute velocities
From the fully resolved simulations we have recorded the position yi(t), perpendicular to the flow, of the ith platelet, at every time interval δt = 10–5 s. We define the absolute velocity as:
and computed the mean absolute velocity vmoy:
where N is the total number of platelets and n the number of iterations.
We find that the probability distribution function of the platelets absolute velocities P(v) is well described by the relation:
where p0, λ, vmin and α are parameters to be determined. The quantity vmin, a velocity threshold separating the exponentially decreasing bulk of the distribution to its heavy tail, and α were estimated with the python package powerlaw Alstott et al. (2014), which is the python implementation of the seminal work of Clauset et al. (2009). Note that there has to be a lower bound as power-law distributions diverge when the variable tends to zero. More generally, power laws are observed in the tail, and these distributions deviate from the power law exhibiting various behaviors below some threshold value of the measured variable Redner (1998); Ioannides and Skouras (2013). We obtain the following values:
The values of p0 and λ are obtained from the conditions
and
These two equations for p0 and λ can be solved numerically, knowing α, vmin and vmoy. The solution is p0 = 1015.24 and λ = 1017.36.
Here we assume that v can be arbitrarily large. This is of course not true in practice but adding to P(v) the numerically observed cut-off speed does not change our results because the probability of such high velocity decreases fast enough for the α value we have here. Similarly, imposing a low velocity threshold did not modify our results.
2.3 Stochastic model for platelets velocities
From the expression of P(v), one can sample the distribution and generate platelets velocities that mimic the behavior of the fully resolved blood flow simulation. We call this velocity sampling a stochastic model for platelets velocities. Concretely if r is a random number uniformly distributed in [0, 1], the value of v is sampled through the relation:
The resulting velocity is:
Of course, when generating a velocity from P(v) we should remember that here, v is the absolute velocity, without its sign. The data from the simulation show that both signs of the platelets velocities are equally likely. This is expected due to the symmetry of the problem with respect to the y-axis. Therefore the sign of v is chosen at random with a probability 1/2 for both directions, independently of the value v. This is obtained by generating a second random number r′.
For each stochastic simulation we used the following procedure. First, we set the initial positions yi (0) by placing randomly N platelets on a segment of length L. Then at each iteration the velocities vi were drawn from the distribution described previously and the platelets positions were updated accordingly 3. A platelet i with a position yi ≤ 0 is removed from the system (deposited platelet), while the boundary yi > L is reflective. Based on velocity auto-correlation measurements discussed below, we set δt = 0.5 ms.
3 Results and discussion
We have performed simulations of the system depicted in Figure 1A, for shear rates 100 s−1 and an hematocrit of 35% as in the Impact-R experiments. We have analyzed platelets trajectories along the vertical direction, that is perpendicular to the flow. We consider these simulations for 1s of physical time and for a system of size 50μm × 50 μm horizontally, and of height L, with L ∈ {50, 100, 250, 500} μm in the vertical direction. Periodic boundary conditions are imposed horizontally along the x and z directions, while the y direction (or wall direction) is bounded by walls. The upper moving wall has a constant velocity Vmw so as to produce the desired shear flow. Although these simulations are significantly smaller in size and time than the actual Impact-R experiment, they require supercomputing capabilities.
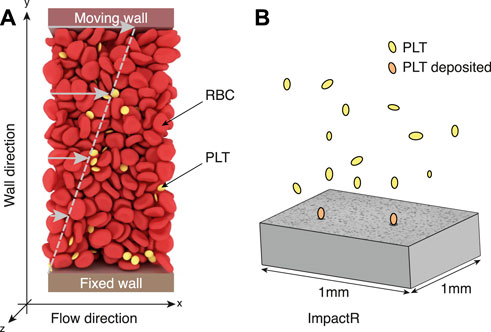
FIGURE 1. (A) A typical configuration of our high-fidelity blood simulation, with deformable red blood cells and platelets (yellow particles) in suspension in a Newtonian flow subject to a shear rate. In this setup, fluid velocity increases linearly from 0 (at the bottom fixed wall) to Vmw (velocity of the top moving wall). The system has periodic boundary conditions along the x and z axis, while the y-direction (or wall direction) is bounded by walls. (B) Illustration of the process taking place in the Impact-R platelets analyzer. Under the action of a shear flow and their interaction with red blood cells, platelets move towards the bottom of the system where they deposit, forming aggregates displayed on the gray slab as dark clusters.
In what follows, we focus on shear rate 100s−1 as in the Impact-R experiments, and on the smallest system of size L = 50 μm. The reason is two-fold. First this is the typical size that has been already considered in the literature for high-fidelity blood flow numerical simulation. Second, due to the small size, the flow reaches much faster a steady state on which reliable measurements can be considered.
A typical trajectory is shown in Figure 2A. Note that we consider the trajectory as long as the platelet stays far enough from the boundaries. Indeed, we observe in our high-fidelity simulations that the trajectory of the platelets is strongly affected by the presence of the walls (see Figure 2A). This is the so-called margination process that naturally brings and traps platelets close to walls. To obtain data not affected by the system boundaries, the region we consider goes from y = 10 μm to y = L − 10μm, which corresponds to discarding from the analysis a bottom and a top layer of about one red blood cell diameter. Note also that, due to the symmetry of the flow, the density of red blood cells is uniform along y so that the vertical platelets transport is independent of y as shown by the profiles of the velocity and its variance along the wall direction (Figure 2B). Such symmetry consideration does not hold anymore in different geometries, for instance in a tube, where the shear rate is not uniform.
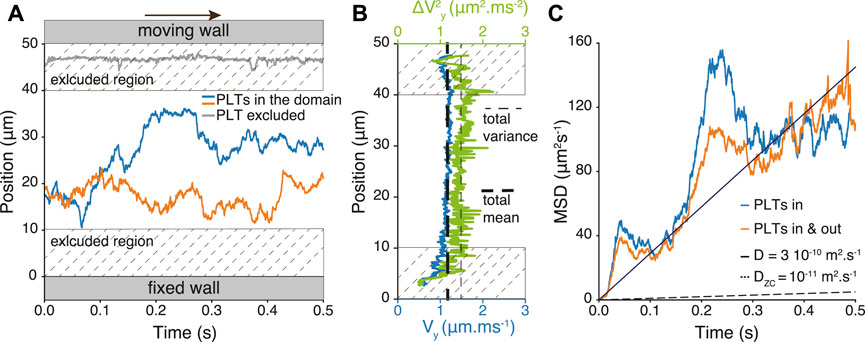
FIGURE 2. (A) Sketch of the system with the region in which platelets trajectories are recorded. Trajectories y(t) of two representative platelets along the direction perpendicular to the flow. Platelets (gray) with trajectory inside the excluded region are not considered for analysis. The situation shown in this figure corresponds to a wall to wall distance of L = 50μm, hematocrit H = 0.35 and shear rate
From the values of yi(t), it is traditional to compute the platelets mean square displacement MSD(t) as
where ⟨⋅⟩i indicates an average over the platelets, in our case those that are still in the domain at time t. The diffusion coefficient is linked to the means square displacement, as DMSD = MSD(t)/(2t) for 1D systems (Figure 2B).
We consider platelets that remain in the domain of interest during all the simulation time to compute a first quantity Din. Further, we compute Din&out from the trajectories of all the platelets until they leave the domain.
We obtain, for the present small system, Din&out = 1.71 × 10⁻¹⁰m2s−1 and Din = 1.99 × 10⁻¹⁰m2s−1 (Figure 2), which is compatible with previous numerical observations (see for instance Reasor et al. (2013)), but larger than the MSD(t) that would emerge from a diffusion constant given by DZC. However, as shown below, the determination of D directly from the platelets trajectories in such small spatial system is not accurate and we claim that it underestimates D. Therefore we will consider below a different procedure, relating the diffusion coefficient to the velocity probability distribution (Figure 3A and Method) and velocity auto-correlation function.
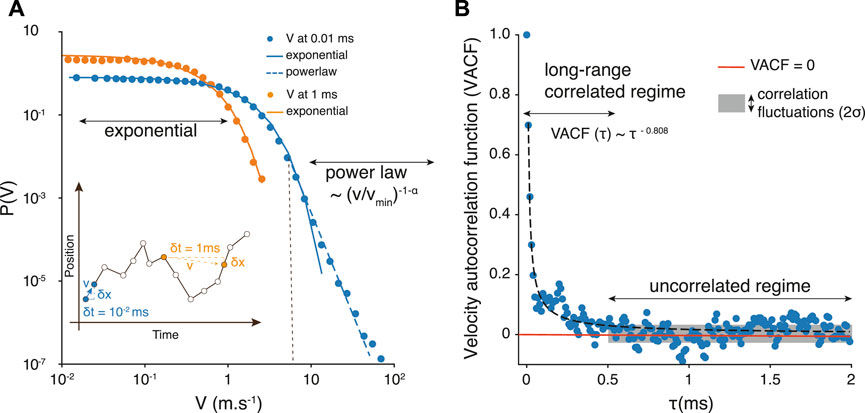
FIGURE 3. (A) Velocity probability distribution P(v) obtained from sampling the platelets trajectories at a time resolution δt = 10–5 s (blue), and δt = 10–3 s (orange). The straight lines represent an exponential decrease and the dashed one a powerlaw behavior, hence suggesting a velocity distribution described by Eq. 5. The distributions were computed with logarithmically spaced bins. The inset indicates how velocities are measured from trajectories samples at different values of δt. (B) Platelet velocity auto-correlation function
Our goal with this stochastic model is to generate representative platelets trajectories, much faster than with the fully resolved blood flow simulation, and in any geometry, including scales and time span similar to the Impact-R experiment. To do so, we still need to determine the mean time between two random changes of v. This is obtained by measuring the velocity auto-correlation function
with a = 0.017 × 10⁻³s (SD = 0.0015) and b = 0.808 (SD = 0.029), when τ is expressed in ms.
The fact that VACF(t) is not an exponential function indicates that platelets keep a memory of their velocity over a rather large time interval Δt. The effect of these long-range correlations is significant when sampling the trajectories at different rates. For δt = 10−3s, the velocity histogram captures only the exponential part of the distribution, suggesting that the tail of the distribution results from short-time correlated platelets displacements (see the inset in Figure 3A). To determine the value of Δt we compute the standard deviation σ of the distribution of values in the tail of VACF(τ) (gray box in Figure 3B). The value of τ above which measurement points match the value of σ is considered as the typical time Δt after which the velocity is randomized. Therefore we define
From the value of Δt and the distribution P(v), we can use the stochastic model to generate representative platelets trajectories at much larger spatial and temporal scales, since it requires very modest computational resources.
A typical trajectory is obtained as
with
where the notation ∼±P(v) means that a new velocity is drawn from P(v) with an equally likely positive or negative sign.
Figure 4A compares the velocity distributions of the stochastic model, the high-fidelity model and the analytical expression. We measure a Pearson correlation coefficient 0.999 (pval < 10–64) between the analytical expression and the distribution of velocity of the stochastic model, and a correlation coefficient 0.995 (pval < 10–35) between the analytical expression and the distribution of velocity of the fully resolved model.
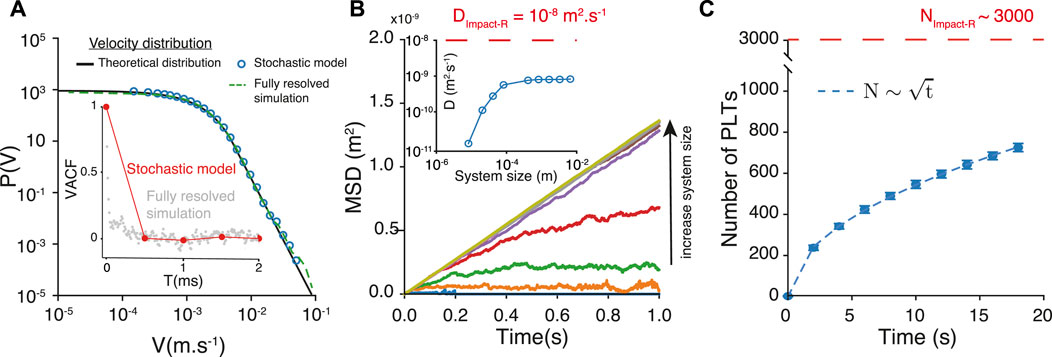
FIGURE 4. (A) Velocity probability distribution obtained from the fully resolved simulation, the analytical expression and the stochastic model. (B) Mean square displacement obtained with the stochastic model of trajectories, for different system sizes. The inset show of the corresponding diffusion coefficient is sensitive to the size of the system, for small systems. The red dashed line represents the diffusion coefficient estimated from the Impact-R experiments. (C) The number
Figure 4B shows the mean square displacement MSD(t) corresponding to particles following this stochastic model. We investigate the finite size effects on the measure of the MSD(t) and the estimation of the diffusion coefficient D. For small system sizes, the MSD saturates, hence resulting in spurious estimation of the diffusion coefficient (inset Figure 4B). Note that the asymptotic value of D can only be found at large system sizes. Increasing only the simulation time is not sufficient as the saturation of the MSD is still present after 20s. For the largest system, 10−2m, the diffusion coefficient associated with MSD(t) is:
which is more than 65 times larger than Dzc. It is also about 4 times larger than the value obtained from a direct measurement of MSD(t) as shown in Figure 4B.
One can further use our stochastic model to simulate the number
It is important to notice that our results are sensitive to the values α, vmin and vmoy measured from the velocity distribution given in Figure 3A. We first investigate the effect of the parameterα in Figures 5A–C. Changing the value of α only modifies the tail of the distribution, whereas the exponentially decreasing bulk of the distribution remains unchanged (see Figure 5A). We explored the set of following values α = 1.8, 2, 3, 4, and 5. This set of values includes the very peculiar Levy-flight regime that is characterized by infinite variance Viswanathan et al. (2008). We do not observe significant change, both for the number of platelets and the diffusion coefficient, for values of α above 2 (Figures 5B,C). Instead, the diffusion coefficient D increases as α decreases below 2, and we measure D = 4.4 10−9m2s−1 and approximately 1300 deposited platelets. Our fully resolved simulation does not show such values for α, but we cannot exclude totally the existence of such a regime for simulated systems with size and time scales comparable to those of the Impact-R setup. Yet speculative, these results show that except for the Levy-flight regime, the parameter α does not modify significantly the transport properties of the platelets.
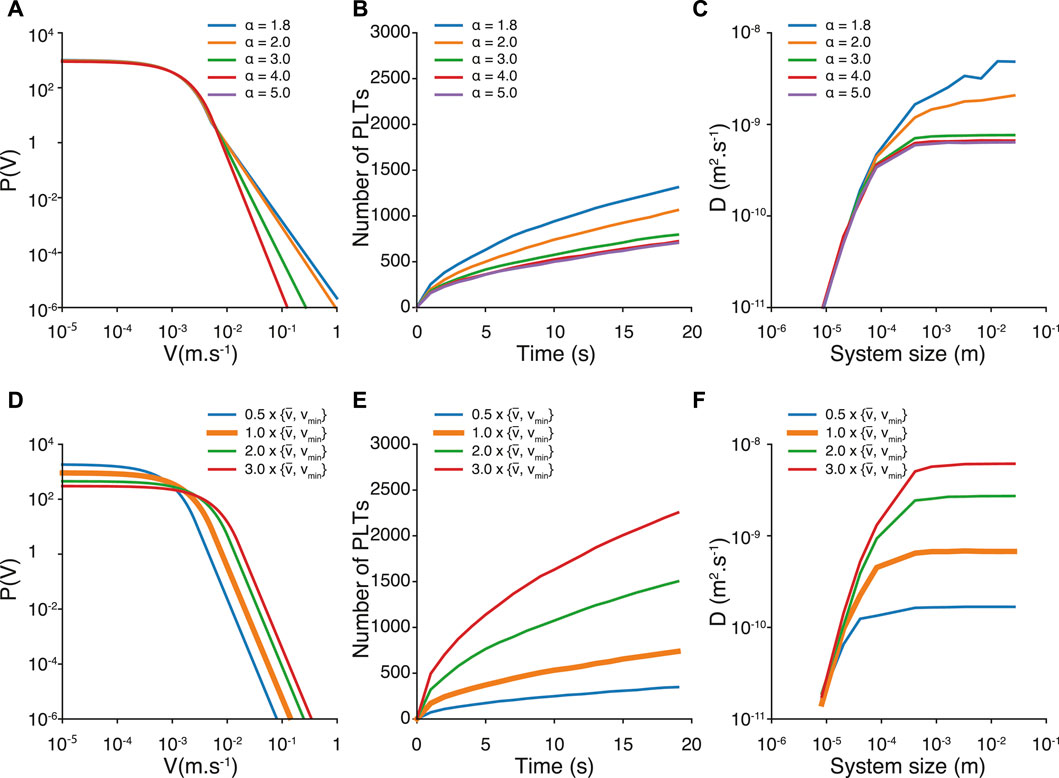
FIGURE 5. Velocity distribution, number of deposited platelets and finite size effect of the diffusion coefficient for different values of α (A–C) and different values of vmoy and vmin (D–F). In Figures (D–F), the orange curve represents our reference values of vmoy and vmin.
We then investigate the effect of changing vmoy and vmin. For a sake of simplicity, and also to keep the distribution of velocity smooth, we multiply concordantly vmoy and vmin by values between 0.5 and 3 (see Figure 5C). We were motivated to increase the mean velocity by the fact that the observed mean velocity in the fully resolved model is related to the actual time resolution of the model. Indeed, decreasing the time resolution results in an increase of the mean velocity. Typically, the mean velocity increases by a factor 2 when the time resolution is decreased by a factor 100. This implies that at the fluid resolution time δt = 10−7s, one could expect a platelets mean velocity twice greater than the one measured at δt = 10−5s. Simulations at lower time resolution can be envisioned for future work, however at a dramatic computational cost. According to the different velocity distributions (see Figure 5D), we observe that both the number of deposited platelets and diffusion coefficient increase with the values of vmoy and vmin. Interestingly, for the highest vmoy we tested, we find a diffusion coefficient similar to the one obtained with α < 2 (D = 6.11 10–9 m2s−1), but a number
4 Conclusion
This paper proposes a detailed analysis of the statistics of platelets velocities when subject to an imposed shear flow of red blood cells and plasma. Our motivation was to better understand the deviation between the transport properties and deposition of platelets predicted by the Zydney-Colton relation 1) and those inferred from our Impact-R experiments.
Using fully resolved blood flow numerical simulations, in which deformable red blood cells and platelets are in suspension in a shear rate flow created between two walls, we were able to reconstruct the probability distribution P(v) of the platelets velocities. Such simulations are extremely time consuming as they have to solve the flow, the deformability of red blood cells, and the interaction between the fluids and the blood cells, as well as the interaction between these blood cells. Due to this high computational requirement, our study is limited here to systems of size 50μm × 50μm × 50μm, for 1 s of physical time.
From the simulation data, we found that P(v) is made of an exponential part followed by a power law tail. We also determine the velocity auto-correlation function and its characteristic time scale Δt for velocity decorrelation. From P(v) and Δt one can propose a stochastic model to generate platelets trajectories that mimic actual trajectories. However, with this stochastic model one can consider much larger spatial and temporal scales. At such larger scales, we found that the platelets diffusion coefficient perpendicular to the flow direction is about 65 times larger than DZC, predicted by the Zydney-Colton theory. However, for small system sizes, the diffusion coefficient inferred from the evaluation of the MSD within the systems boundaries gives a value of the same order than predicted by the ZC relation. More in-silico experiments, yet at high computational cost, are critical to extend our findings in a broader parameter space, including higher shear rate values, and validate our description in terms of probability of velocities distribution and diffusion coefficient at larger scales.
Overall our results go in the direction of the experimental observation about the flux of platelets in the Impact-R device, which requires a much larger diffusion coefficient than DZC but still a diffusion constant at least one order of magnitude larger than what is found here. More analysis is still needed to clarify this discrepancy.
In view of the importance of a right characterization of platelets transport in clinical devices to correctly test platelets functionality, we hope that this study will stimulate more experimental and numerical work.
Data availability statement
The datasets generated and analyzed for this study can be found on Zenodo: https://zenodo.org/record/7028165.
Author contributions
CK, FR and BC contributed equally to this work. CK developed the code for the fully resolved blood Palabos-npFEM model and performed the simulations. FR analyzed the data and developed the code to analyze them, including the stochastic model. He contributed to the interpretation of the results, produced figures and wrote parts of the manuscript. JL contributed to the development of the Palabos-npFEM code and the interpretation of the results. RD contributed to the interpretation of the results. FD contributed to the experimental data acquisition. KZ brought the biomedical questions and knowledge, collected experimental data, interpreted the results and contributed to the design of the research and the writing of the paper. BC designed the research project proposed the interpretation of the results, contributed to the data analysis and wrote the first draft of the paper. All authors contributed to the writing and reading of the manuscript.
Funding
This project has received funding from the European Union’s Horizon 2020 research and innovation programme under grant agreement No 823712 (CompBioMed2 project). Furthermore, this work was supported by grants from the CHU Charleroi (Fonds pour la Chirurgie Cardiaque; Fonds de la Recherche Medicale en Hainaut) and by the Swiss PASC project “Virtual Physiological Blood: an HPC framework for blood flow simulations in vasculature and in medical devices”. Open access funding was provided by the University of Geneva.
Acknowledgments
We acknowledge support from 1) the Swiss National Supercomputing Center, project ID 323, Digital blood: a study of platelet transport in blood, 2) the National Supercomputing Center in the Netherlands (Surfsara, Cartesius supercomputer), and 3) the HPC Facilities of the University of Geneva (Baobab cluster). This work also got support from EUREKA Eurostar project 3DPlts.
Conflict of interest
The authors declare that the research was conducted in the absence of any commercial or financial relationships that could be construed as a potential conflict of interest.
Publisher’s note
All claims expressed in this article are solely those of the authors and do not necessarily represent those of their affiliated organizations, or those of the publisher, the editors and the reviewers. Any product that may be evaluated in this article, or claim that may be made by its manufacturer, is not guaranteed or endorsed by the publisher.
References
Affeld, K., Goubergrits, L., Watanabe, N., and Kertzscher, U. (2013). Numerical and experimental evaluation of platelet deposition to collagen coated surface at low shear rates. J. Biomech. 46, 430–436. doi:10.1016/j.jbiomech.2012.10.030
Alstott, J., Bullmore, E., and Plenz, D. (2014). Powerlaw: A python package for analysis of heavy-tailed distributions. PLoS ONE 9, e85777. doi:10.1371/journal.pone.0085777
Boudjeltia, K. Z., Kotsalos, C., Ribeiro, D., Rousseau, A., Lelubre, C., Sartenaer, O., et al. (2020). Spherization of red blood cells and platelet margination in COPD patients. Ann. N. Y. Acad. Sci. 1485, 71–82. doi:10.1111/nyas.14489
Carboni, E. J., Bognet, B. H., Bouchillon, G. M., Kadilak, A. L., Shor, L. M., Ward, M. D., et al. (2016). Direct tracking of particles and quantification of margination in blood flow. Biophys. J. 111, 1487–1495. doi:10.1016/j.bpj.2016.08.026
Chopard, B., de Sousa, D. R., Lätt, J., Mountrakis, L., Dubois, F., Yourassowsky, C., et al. (2017). A physical description of the adhesion and aggregation of platelets. R. Soc. Open Sci. 4, 170219. doi:10.1098/rsos.170219
Clauset, A., Shalizi, C. R., and Newman, M. E. J. (2009). Power-law distributions in empirical data. SIAM Rev. Soc. Ind. Appl. Math. 51, 661–703. doi:10.1137/070710111
Crowl, L., and Fogelson, A. L. (2011). Analysis of mechanisms for platelet near-wall excess under arterial blood flow conditions. J. Fluid Mech. 676, 348–375. doi:10.1017/jfm.2011.54
D’Apolito, R., Tomaiuolo, G., Taraballi, F., Minardi, S., Kirui, D., Liu, X., et al. (2015). Red blood cells affect the margination of microparticles in synthetic microcapillaries and intravital microcirculation as a function of their size and shape. J. Control. Release 217, 263–272. doi:10.1016/j.jconrel.2015.09.013
Dutta, R., Chopard, B., Lätt, J., Dubois, F., Zouaoui Boudjeltia, K., and Mira, A. (2018). Parameter estimation of platelets deposition: Approximate bayesian computation with high performance computing. Front. Physiol. 9, 1128. doi:10.3389/fphys.2018.01128
Dutta, R., Zouaoui-Boudjeltia, K., Kotsalos, C., Rousseau, A., de Sousa, D. R., Desmetand, J. M., et al. (2022). Personalized pathology test for cardio-vascular disease: Approximate bayesian computation with discriminative summary statistics learning. PLoS Comput. Biol. 18, e1009910. doi:10.1371/journal.pcbi.1009910
Eckstein, E. C., and Belgacem, F. (1991). Model of platelet transport in flowing blood with drift and diffusion terms. Biophys. J. 60, 53–69. doi:10.1016/S0006-3495(91)82030-6
Fedosov, D. A., Caswell, B., Popel, A. S., and Karniadakis, G. E. (2010). Blood flow and cell-free layer in microvessels. Microcirculation 17, 615–628. doi:10.1111/j.1549-8719.2010.00056.x
Harrison, P. (2005). Platelet function analysis. Blood Rev. 19, 111–123. doi:10.1016/j.blre.2004.05.002
Ioannides, Y., and Skouras, S. (2013). Us city size distribution: Robustly pareto, but only in the tail. J. Urban Econ. 73, 18–29. doi:10.1016/j.jue.2012.06.005
Kim, S., Ong, P. K., Yalcin, O., Intaglietta, M., and Johnson, P. C. (2009). The cell-free layer in microvascular blood flow. Biorheology 46, 181–189. doi:10.3233/BIR-2009-0530
Kotsalos, C., Latt, J., Beny, J., and Chopard, B. (2020). Digital blood in massively parallel cpu/gpu systems for the study of platelet transport. Interface Focus 11, 20190116. doi:10.1098/rsfs.2019.0116
Kotsalos, C., Latt, J., and Chopard, B. (2019). Bridging the computational gap between mesoscopic and continuum modeling of red blood cells for fully resolved blood flow. J. Comput. Phys. 398, 108905. doi:10.1016/j.jcp.2019.108905
Kotsalos, C., Latt, J., and Chopard, B. (2021). Palabos-npfem: Software for the simulation of cellular blood flow (digital blood). J. Open Res. Softw. 9, 16–12. doi:10.5334/JORS.343
Kumar, A., and Graham, M. D. (2012). Margination and segregation in confined flows of blood and other multicomponent suspensions. Soft Matter 8, 10536–10548. doi:10.1039/c2sm25943e
Mehrabadi, M., Ku, D. N., and Aidun, C. K. (2015). A continuum model for platelet transport in flowing blood based on direct numerical simulations of cellular blood flow. Ann. Biomed. Eng. 43, 1410–1421. doi:10.1007/s10439-014-1168-4
Mehrabadi, M., Ku, D. N., and Aidun, C. K. (2016). Effects of shear rate, confinement, and particle parameters on margination in blood flow. Phys. Rev. E 93, 023109. doi:10.1103/PhysRevE.93.023109
Müller, K., Fedosov, D. A., and Gompper, G. (2016). Understanding particle margination in blood flow - a step toward optimized drug delivery systems. Med. Eng. Phys. 38, 2–10. doi:10.1016/j.medengphy.2015.08.009
Ota, K., Suzuki, K., and Inamuro, T. (2012). Lift generation by a two-dimensional symmetric flapping wing: Immersed boundary-lattice Boltzmann simulations. Fluid Dyn. Res. 44, 045504. doi:10.1088/0169-5983/44/4/045504
Reasor, D. A., Mehrabadi, M., Ku, D. N., and Aidun, C. K. (2013). Determination of critical parameters in platelet margination. Ann. Biomed. Eng. 41, 238–249. doi:10.1007/s10439-012-0648-7
Redner, S. (1998). How popular is your paper? An empirical study of the citation distribution. Eur. Phys. J. B 4, 131–134. doi:10.1007/s100510050359
Vahidkhah, K., Diamond, S. L., and Bagchi, P. (2014). Platelet dynamics in three-dimensional simulation of whole blood. Biophys. J. 106, 2529–2540. doi:10.1016/j.bpj.2014.04.028
Viswanathan, G., Raposo, E., and da Luz, M. (2008). Lévy flights and superdiffusion in the context of biological encounters and random searches. Phys. Life Rev. 5, 133–150. doi:10.1016/j.plrev.2008.03.002
Závodszky, G., Rooij, B. V., Czaja, B., Azizi, V., Kanter, D. D., and Hoekstra, A. G. (2019). Red blood cell and platelet diffusivity and margination in the presence of cross-stream gradients in blood flows. Phys. Fluids 31, 031903. doi:10.1063/1.5085881
Zhao, H., Shaqfeh, E. S., and Narsimhan, V. (2012). Shear-induced particle migration and margination in a cellular suspension. Phys. Fluids. 24, 011902. doi:10.1063/1.3677935
Zhao, H., and Shaqfeh, E. S. (2011). Shear-induced platelet margination in a microchannel. Phys. Rev. E Stat. Nonlin. Soft Matter Phys. 83, 061924. doi:10.1103/PhysRevE.83.061924
Keywords: platelets transport, platelets diffusion coefficient, shear induced diffusion, high-fidelity blood simulation, lattice Boltzmann method, high performance computing
Citation: Kotsalos C, Raynaud F, Lätt J, Dutta R, Dubois F, Zouaoui Boudjeltia K and Chopard B (2022) Shear induced diffusion of platelets revisited. Front. Physiol. 13:985905. doi: 10.3389/fphys.2022.985905
Received: 04 July 2022; Accepted: 21 September 2022;
Published: 13 October 2022.
Edited by:
Mariano Vázquez, Barcelona Supercomputing Center, SpainReviewed by:
Ascânio Dias Araújo, Federal University of Ceara, BrazilDavid Bark, Washington University in St. Louis, United States
Copyright © 2022 Kotsalos, Raynaud, Lätt, Dutta, Dubois, Zouaoui Boudjeltia and Chopard. This is an open-access article distributed under the terms of the Creative Commons Attribution License (CC BY). The use, distribution or reproduction in other forums is permitted, provided the original author(s) and the copyright owner(s) are credited and that the original publication in this journal is cited, in accordance with accepted academic practice. No use, distribution or reproduction is permitted which does not comply with these terms.
*Correspondence: Bastien Chopard, YmFzdGllbi5jaG9wYXJkQHVuaWdlLmNo