
94% of researchers rate our articles as excellent or good
Learn more about the work of our research integrity team to safeguard the quality of each article we publish.
Find out more
ORIGINAL RESEARCH article
Front. Physiol., 19 September 2022
Sec. Cardiac Electrophysiology
Volume 13 - 2022 | https://doi.org/10.3389/fphys.2022.976925
This article is part of the Research TopicAtrial Fibrillation: Technologies for Investigation, Monitoring and Treatment, Volume IIView all 16 articles
Background: The autonomic nervous system (ANS) is known as a potent modulator of the initiation and perpetuation of atrial fibrillation (AF), hence information about ANS activity during AF may improve treatment strategy. Respiratory induced ANS variation in the f-waves of the ECG may provide such information.
Objective: This paper proposes a novel approach for improved estimation of such respiratory induced variations and investigates the impact of deep breathing on the f-wave frequency in AF patients.
Methods: A harmonic model is fitted to the f-wave signal to estimate a high-resolution f-wave frequency trend, and an orthogonal subspace projection approach is employed to quantify variations in the frequency trend that are linearly related to respiration using an ECG-derived respiration signal. The performance of the proposed approach is evaluated and compared to that of a previously proposed bandpass filtering approach using simulated f-wave signals. Further, the proposed approach is applied to analyze ECG data recorded for 5 min during baseline and 1 min deep breathing from 28 AF patients from the Swedish cardiopulmonary bioimage study (SCAPIS).
Results: The simulation results show that the estimates of respiratory variations obtained using the proposed approach are more accurate than estimates obtained using the previous approach. Results from the analysis of SCAPIS data show no significant differences between baseline and deep breathing in heart rate (75.5 ± 22.9 vs. 74 ± 22.3) bpm, atrial fibrillation rate (6.93 ± 1.18 vs. 6.94 ± 0.66) Hz and respiratory f-wave frequency variations (0.130 ± 0.042 vs. 0.130 ± 0.034) Hz. However, individual variations are large with changes in heart rate and atrial fibrillatory rate in response to deep breathing ranging from −9% to +5% and −8% to +6%, respectively and there is a weak correlation between changes in heart rate and changes in atrial fibrillatory rate (r = 0.38, p < 0.03).
Conclusion: Respiratory induced f-wave frequency variations were observed at baseline and during deep breathing. No significant changes in the magnitude of these variations in response to deep breathing was observed in the present study population.
Atrial fibrillation is known as the most common heart arrhythmia and is a growing public health concern worldwide. Atrial fibrillation has been estimated to affect 10 million people in the United States by 2050 (Miyasaka et al., 2006) and 17.9 million in Europe by 2060, with more than half of these patients aged 80 years or older (Krijthe et al., 2013). Atrial fibrillation is associated with increased mortality and morbidity resulting from stroke and congestive heart failure, and increased hospitalization costs (Patel et al., 2014). Despite progression in AF treatment, including medications aimed at controlling heart rate, rhythm, or both, and ablative therapy, finding the most accurate therapy for an individual patient is still problematic (Crandall et al., 2009). Historically, research has shown that multiple etiological mechanisms, such as atrial fibrosis, ion-channel dysfunction, autonomic imbalance, and genetic background, likely drive the factors associated with the maintenance and progression of AF (Lip et al., 2010; Fabritz et al., 2016).
This study focuses on respiratory modulation in the atrial activity during AF. It is well established from a variety of studies that the refractory period of the atria during atrial fibrillation can be influenced by various underlying mechanisms, including pathological changes, electrophysiological dynamics, and an imbalanced autonomic tone (Waldo, 2003; Nitta et al., 2004; Saksena et al., 2005). The refractory period of the atria has been found to have linear correlation with f-waves frequency (Capucci et al., 1995). The frequency of the f-waves in the ECG, also referred to as the atrial fibrillatory rate (AFR) (Platonov et al., 2014), has previously been analyzed with respect to ANS induded changes during AF. For instance (Stridh et al., 2003; Holmqvist et al., 2005), have shown that variation in the f-wave frequency during controlled respiration can be linked to the parasympathetic activity. Östenson et al. studied changes in the f-wave frequency in response to changes in ANS tone induced by tilt-test in 40 patients with persistent AF, results showed f-wave frequency decreased during head-down tilt (HDT) compared to baseline and increased during head-up tilt (HUT) (Östenson et al., 2017). In a previous study, we investigated changes in f-wave frequency variations in response to controlled respiration (Abdollahpur et al., 2021). In a study population of eight pacemaker patients with permanent AF recorded at baseline, during controlled respiration, and during controlled respiration after injection of atropine. Briefly, a high-resolution f-wave frequency trend obtained using model-based approach was filtered using a narrow bandpass filter with center frequency corresponding to respiration rate and fixed bandwidth. The envelope of the filtered frequency trend served as an estimate of the magnitude of the respiratory variation; the results indicated that this magnitude was affected by parasympathetic regulation (Abdollahpur et al., 2021).
The present study addresses main weaknesses of our previous study. In contrast to the previous study, where the AF patients had pacemakers set at a fixed heart rate, the present study is based on AF patients without pacemaker whose heart rate varies over time. Such variations in heart rate may affect the ANS and hence the ANS induced variations in atrial electrical activity. Second, the previous approach to quantify respiratory variation in the f-wave frequency is sensitive to noise and cannot handle time-varying respiration rates. Hence, the objectives of the present study were twofold: 1) To propose a novel subspace projection approach to quantify respiratory variation in the f-wave frequency trend that is robust to noise and can handle time-varying respiration, and 2) to investigate the impacts of deep breathing on the f-wave frequency in a population of AF patients without a pacemaker.
A schematic overview of the methodology is shown in Figure 1. The clinical data is described in Section 2.1, the ECG processing aiming to obtain an f-wave signal x(n) is explained in Section 2.2. As follow, a model-based approach is applied to the extracted signal x(n) to estimate an f-wave frequency trend f(n) (Section 2.3). An ECG-derived respiration signal r(n) is estimated using the slope range approach (Section 2.4). Respiratory variation in f(n) is estimated using orthogonal subspace projection method (Section 2.5). Simulated f-wave signals are used to evaluate the performance of the proposed methodology (Section 2.6). Finally, statistical tests are applied to the results from analysis of clinical data to determine if there is a significant differences in heart rate, f-wave frequency, and respiratory variation in f-wave frequency trend between deep breathing phase and baseline (Section 2.7).
The study population consists of a subset of 28 participants from the Swedish cardiopulmonary bioimage study (SCAPIS) (Bergström et al., 2015) that were diagnosed with AF. The clinical characteristics of the study population are summarized in Table 1. The subjects performed a deep breathing task. The task was 5-s inhalation and 5-s exhalation as deep-breathing (D) phase for 1 min, and as follows 5 min during baseline (B); the patients were in AF during the recordings. For further details on the study protocol, the reader is referred to (Engström et al., 2022). A standard 12-lead ECG at 500 Hz sampling rate was recorded throughout the protocol.
The CardioLund ECG parser (CardioLund Research AB, Lund, Sweden) is used for preprocessing, beat-detection, and beat classification and QRST cancellation. Briefly, in this software, a linear-phase high-pass filter is applied to the ECG to eliminate baseline wander, and fiducial points in the QRS complexes are detected; also, the QRS complexes are classified based on their morphology. The ectopic beats were identified based on correlation to template beats and were clustered and treated as a separate class for the QRST-cancellation. The QRS interval
For the estimation of a high-resolution f-wave frequency trend, a harmonic f-wave model (Henriksson et al., 2018) is employed. The model f-wave signal is defined as the sum of a complex exponential signal with fundamental frequency f and its second harmonic,
where Am and ϕm denote the amplitude and phase of m:th harmonic, respectively, and fs is sampling frequency. The use of two harmonics in the model is motivated by the observations in (Henriksson et al., 2018), that additional harmonic results in more noise due to the additional degrees of freedom of this model. The parameters
The model is fitted to 20 ms overlapping 0.5-second segments of xa(n). For this fitting, f is constrained to the interval [f0 ± 1.5] Hz, where global frequency estimate (f0) is the maximum peak in the interval [4,12] Hz of the Welch periodogram of the whole x(n). The estimates of f result in an f-wave frequency trend f(n) sampled at 50 Hz. Then, correspond to the sampling rate of the respiration signal (cf. Section 2.4), f(n) is resampled to 5Hz. To quantify accuracy of the fitted model, a signal quality index, denoted
where
The slope range method (Kontaxis et al., 2019) is applied to each lead of the ECG separately to obtain a respiratory signal. The method quantifies variations in the QRS morphology, which are assumed to reflect respiratory activity, using the difference between the maximum and minimum derivative in the QRS interval,
where i and l denotes beat-number and lead, respectively, and
To extract variations in the f-wave frequency trend that are linearly related to the respiration, an orthogonal subspace projection approach is employed (Chang, 2005). The demeaned f(n) denoted as
The model order m is determined by analysis of the simulated data (cf. Section 3.1). After creating the matrix V, the signal
where f is a length N vector of
In the present study,
Simulated f-wave signals were used in order to assess the performance of the orthogonal subspace projection approach and its dependence on model order m (Section 2.5), signal quality
where F defines the average fundamental frequency, and respiratory f-wave frequency variation is quantified by Fr and ΔF, defining the variation frequency and the variation magnitude, respectively. To incorporate other forms of variation in the f-wave frequency, random phase variation, Φ(n), is added; it is modeled as white Gaussian noise with standard deviation σΦ. The amplitude of the k:th harmonic is given by
where A is the average f-wave amplitude, and ΔA(n) quantifies random amplitude variation and is assumed to have a Gaussian distribution with mean zero and standard deviation A/5; the parameter A was chosen to obtain a signal standard deviation of signal σx equal to 50. The following parameters were used for simulating one minute-long f-wave signals: F = {4, 5, 6, 7, 8, 9, 10} Hz, Fr = {0.1, 0.15, 0.20, 0.25, 0.30} Hz, ΔF = {0, 0.025, 0.05, … , 0.3} Hz, σΦ = {0.27, 0.40, 0.55, 0.67, 0.80}. White Gaussian noise v(n) with σv = {0.1A, 0.2A, 0.3A, 0.4A, 0.5A} is added to form realistic f-wave signals and the sampling frequency was set to Fs = 50 Hz. Ten realizations of xsim(n) for each parameter setting were considered, resulting in a total of 113,750 simulated signals.
Through these simulated signals, the accuracy of
Results are presented as mean ± std, and as median (range) for Gaussian and non-gaussian variables, respectively; the Lilliefors test is used to test for gaussianity. Student’s t-test and Wilcoxon signed-rank test are applied to determine if differences are significant for Gaussian and non-gaussian variables, respectively. Hence, a paired t-test is applied to evaluate the difference between ϵOSP and ϵBP, and a Wilcoxon signed-rank test is applied to determine whether differences in HR, AFR, and ΔfOSP between baseline and deep breathing are significant. Further, Spearman rank correlation is used to evaluate the relationship between changes in HR, AFR, and ΔfOSP in response to deep breathing. The level of statistical significance is considered p < 0.05.
Results from the analysis of simulated data are presented in Figures 2–5. From Figure 2, it is apparent that the smallest ϵOSP was achieved for m = 15, and hence, m was set to 15 for the remaining analysis. The effect of the time-varying respiration is illustrated in Figure 3 where Fr changes from 0.1 to 0.3 Hz during 1 minute. As shown in Figure 3, the respiratory variations can be accurately extracted using the orthogonal subspace projection approach, while the previously proposed bandpass filtering approach fails. The ϵOSP was significantly smaller than ϵBP (0.017 ± 0.012 vs. 0.021 ± 0.015, p < 0.001). The improved accuracy obtained with the orthogonal subspace projection approach is more prominent for lower values of S, corresponding to higher noise levels, cf. Figure 4. The accuracy of the estimates was not affected by the f-wave frequency and the respiration rate (results not shown). However, for both approaches the estimates were less accurate for respiratory variations of small magnitudes (Δf < 0.075 Hz), cf. Figure 5.
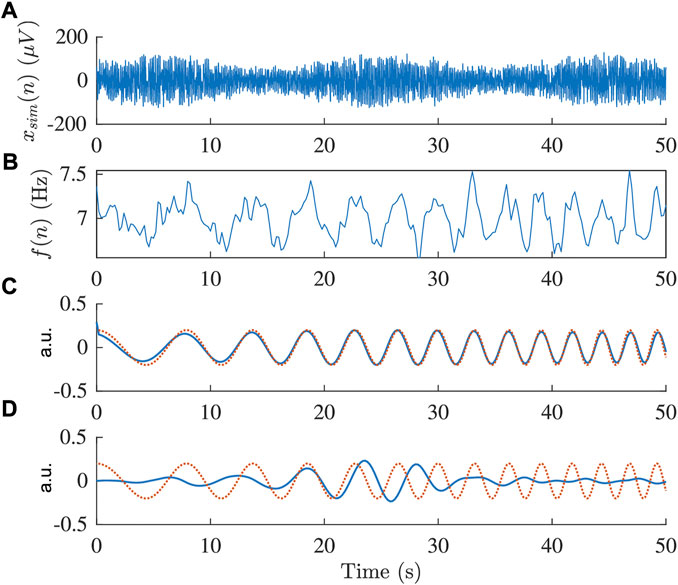
FIGURE 3. (A) Simulated signal xsim(n) and (B) corresponding estimated frequency trend f(n), respectively. (C,D) Modeled respiration signal (red) and extracted respiratory component (blue) obtained using (C) orthogonal subspace projection and (D) bandpass filtering.
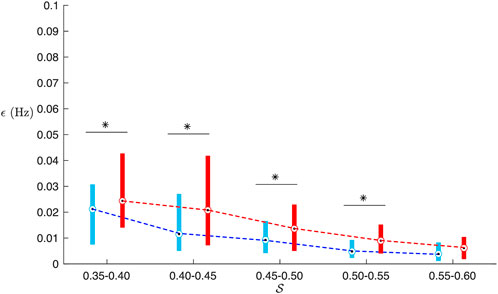
FIGURE 4. Box-plot of ϵBP (red) and ϵOSP (blue) from simulation as a function of signal quality
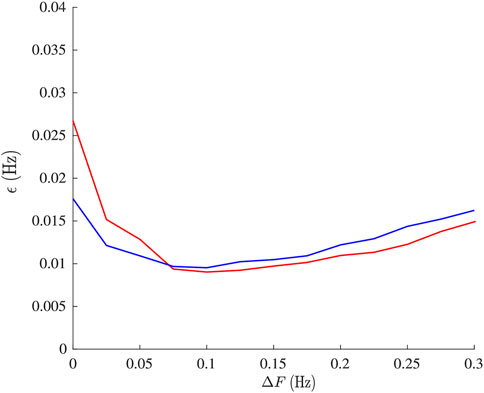
FIGURE 5. Mean estimation error ϵOSP (red) and ϵBP (blue) from simulations plotted versus the magnitude of respiratory modulation ΔF.
An example of a 30-second f-wave signal x(n) and the corresponding model signal s (n; θ), signal quality index
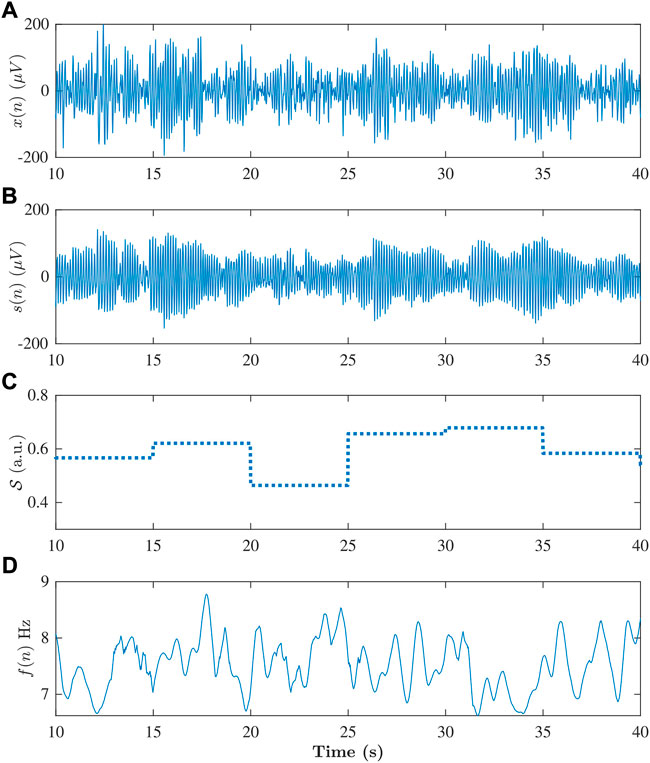
FIGURE 6. (A) Extracted f-wave signal x(n), and (B) corresponding modeled signal s(n), (C) signal quality index
Figure 8 gives an example of extracted respiratory signals rl(n) and the corresponding principal components for one patient during deep breathing. In this example, both
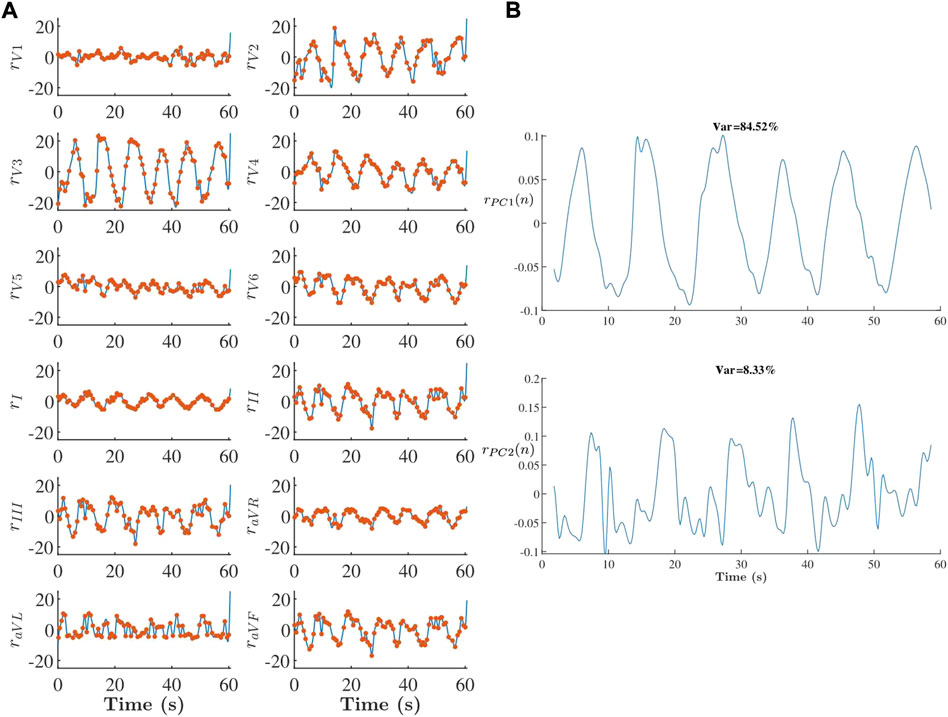
FIGURE 8. (A) Respiration signals rl(n) (blue line) and rl(i) (red dots) derived from 1-min ECG during deep breathing and (B) corresponding PCA components. In this example r(n) is set to
The
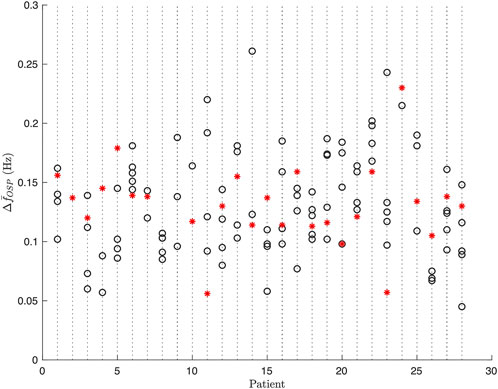
FIGURE 9. Estimates of respiratory f-wave frequency variations
In the present study, we propose a novel methodology, based on orthogonal subspace projection, for quantifying respiratory variations in the f-wave frequency trend. Results from analysis of simulated data show that the estimation accuracy of the proposed approach is comparable to that of our previously proposed bandpass filtering approach (Abdollahpur et al., 2021). However, the proposed approach is better suited for analysis of standard ECG recordings since it can handle time-varying respiration (Figure 3) and provides more accurate estimates of respiratory variations at low SNR (Figure 4).
Orthogonal subspace projection has previously been proposed for removing respiratory influences in heart rate variability signal for improved estimation of sympathovagal balance (Varon et al., 2018). In contrast, in this study we aimed to keep variations in f-wave frequency trend that were linearly related to respiration and remove other variations. Such respiratory–induced f-wave frequency variations have previously been shown to be affected by parasympatetic regulation in a cohort of AF patients with complete AV block and pacemaker set at a fixed pacing rate (Abdollahpur et al., 2021).
The orthogonal subspace projection relies on an ECG-derived respiration (EDR) signal. It should be noted that standard RR interval-based algorithms for ECG-derived respiration (Widjaja et al., 2014) are not applicable during AF since variations in heart rate during AF do not originate from the sinus node. Hence, the slope range method was selected for this since previous studies (Kontaxis et al., 2019) has shown that this method is robust during AF and provides more accurate estimates compared to QRS loop rotation angle (Bailón et al., 2006) and the R-wave angle (Lázaro et al., 2014). In the slope range method f-wave suppression is not needed and its performance is less affected by the presence of f-waves (Kontaxis et al., 2019). An EDR signal is derived from each lead separately, and PCA is employed to merge respiratory information from EDR signals from different leads. It is assumed that the PCA component that has a significant periodicity in the 0.1–0.4 Hz interval and accounts for the largest part of the variations in the EDR signals contains the respiratory information. Respiration signals couldn’t be obtained from 30% of the analyzed 1-min segments due to criteria defined in Section 2.4. Since this methodology aimed for the effect of time-varying respiration on the f-wave frequency, we used PCA to find respiration signal. The PCA uses a maximum-variance criteria to separate respiration signal and noise into orthogonal subspaces. Its components are sensitive to the high variance noise, which may not be the best way to find respiration signals. An alternative solution would be to use periodic component analysis (Saul and Allen, 2000), which has previously been proposed for decomposition of multilead ECG (Sameni et al., 2008) and applied for analysis of, e.g., t-wave alternans (Monasterio et al., 2010; Palmieri et al., 2021). Whereas PCA uses a maximum-variance criteria to decompose signals, periodic component analysis maximizes the periodic structure. Periodic component analysis has the advantage of being less sensitive to large amplitude noise, however, it is requires prior knowledge on the periodicity of the desired signal.
Respiratory induced f-wave frequency variations has previously been shown to be affected by parasympathetic regulation. In our previous study, (Abdollahpur et al., 2021), 5-min ECGs recorded from eight patients during controlled respiration before and after full vagal blockade were analyzed; in 50% of the patients, respiratory variation was significantly reduced after the vagal blockade. Moreover, results from computational simulations of human atrial tissues confirmed that the pattern of the parasympathetic neurotransmitter acetylcholine release could be an important factor involved in f-wave frequency variation (Celotto et al., 2020). These results suggest that respiratory f-wave frequency variations can potentially be used to quantify ANS activity, which is of clinical interest since ANS activity is an important factor on the maintenance and progression of AF (Linz et al., 2019). For example, vagus nerve stimulation has been shown to shorten the atrial effective refractory period and suppress autonomic remodeling in dogs with obstructive apnea induced AF (Yu et al., 2017). Further, it has been shown that AF progression through cellular remodeling could be reduced by minimizing sympathetic or increasing parasympathetic tone (Bashir et al., 2019). In a recent study (Sohinki et al., 2021), investigated the impact of low-level electromagnetic fields (LL-EMF) which is specifically targeted for vagal stimulation, on AF inducibility in humans.
In present study no significant differences were found between f-wave frequency variations at baseline and during deep breathing. Several factors could contribute to this observation. Firstly, the duration of the deep breathing task was just 1 min which may not be sufficient time to observe the effect of changes in autonomic tone on the f-wave frequency trend. Further, considering the large variation of
We propose a novel orthogonal subspace projection approach to quantify respiratory variations in the f-wave frequency trend obtained from the ECG during AF. Results from simulated f-wave signals show that the proposed approach offers more robust performance in respiratory variation estimation compared to the previously proposed bandpass filtering approach. Results from analysis of clinical data were heterogeneous and no significant differences in HR, AFR and respiratory f-wave frequency variations
The data analyzed in this study is subject to the following licenses/restrictions: The data is owned by Lund University. Requests to access these datasets should be directed to the steering committee of SCAPIS. Requests to access these datasets should be directed to scapis@scapis.org.
The studies involving human participants were reviewed and approved by the Written informed consent was obtained from all SCAPIS participants. The project was approved by the ethics committee at Lund University (2016/1031). The patients/participants provided their written informed consent to participate in this study.
FS devised the project and the main conceptual ideas and was responsible for overseeing the research and providing critical insight and recommendations regarding the focus, structure, and content of the paper. MA processed the data, performed the analysis, drafted the manuscript and designed the figures. GE was responsible for the clinical data acquisition protocol. PP helped supervise the project focusing on clinical aspects. All authors contributed to the final version of the manuscript.
This work was supported by the European Union’s Horizon 2020 research and innovation programme under the Marie Sklodowska-Curie Grant Agreement No. 766082, the Swedish Research Council (Grant VR2019-04272) and the Crafoord Foundation (Grant 20200605). The main funding body of SCAPIS is the Swedish Heart and Lung Foundation. The study was also supported by grants from Swedish Research Council (2019-01236), Swedish Heart Lung Foundation (20200173) and grant from the Swedish state under the agreement between the Swedish government and the county councils (ALF-project 2018-0030).
The authors declare that the research was conducted in the absence of any commercial or financial relationships that could be construed as a potential conflict of interest.
All claims expressed in this article are solely those of the authors and do not necessarily represent those of their affiliated organizations, or those of the publisher, the editors and the reviewers. Any product that may be evaluated in this article, or claim that may be made by its manufacturer, is not guaranteed or endorsed by the publisher.
Abdollahpur M., Holmqvist F., Platonov P., Sandberg F. (2021). Respiratory induced modulation in f-wave characteristics during atrial fibrillation. Front. Physiol. 12, 653492. doi:10.3389/fphys.2021.653492
Bailón R., Sornmo L., Laguna P. (2006). A robust method for ecg-based estimation of the respiratory frequency during stress testing. IEEE Trans. Biomed. Eng. 53, 1273–1285. doi:10.1109/TBME.2006.871888
Bashir M. U., Bhagra A., Kapa S., McLeod C. J. (2019). Modulation of the autonomic nervous system through mind and body practices as a treatment for atrial fibrillation. Rev. Cardiovasc. Med. 20, 129–137. doi:10.31083/j.rcm.2019.03.517
Bergström G., Berglund G., Blomberg A., Brandberg J., Engström G., Engvall J., et al. (2015). The Swedish cardiopulmonary bioimage study: Objectives and design. J. Intern. Med. 278, 645–659. doi:10.1111/joim.12384
Capucci A., Biffi M., Boriani G., Ravelli F., Nollo G., Sabbatani P., et al. (1995). Dynamic electrophysiological behavior of human atria during paroxysmal atrial fibrillation. Circulation 92, 1193–1202. doi:10.1161/01.cir.92.5.1193
Celotto C., Sánchez C., Mountris K. A., Abdollahpur M., Sandberg F., Laguna P., et al. (2020). Relationship between atrial oscillatory acetylcholine release pattern and f-wave frequency modulation: A computational and experimental study. Comput. Cardiol., 1–4.
Chang C.-I. (2005). Orthogonal subspace projection (osp) revisited: A comprehensive study and analysis. IEEE Trans. Geosci. Remote Sens. 43, 502–518. doi:10.1109/tgrs.2004.839543
Crandall M. A., Bradley D. J., Packer D. L., Asirvatham S. J. (2009). Contemporary management of atrial fibrillation: Update on anticoagulation and invasive management strategies. Mayo Clin. Proc. 84, 643–662.
Engström G., Hamrefors V., Fedorowski A., Persson A., Johansson M. E., Ostenfeld E., et al. (2022). Cardiovagal function measured by the deep breathing test: Relationships with coronary atherosclerosis. J. Am. Heart Assoc. 11, e024053. doi:10.1161/JAHA.121.024053
Fabritz L., Guasch E., Antoniades C., Bardinet I., Benninger G., Betts T. R., et al. (2016). Expert consensus document: Defining the major health modifiers causing atrial fibrillation: A roadmap to underpin personalized prevention and treatment. Nat. Rev. Cardiol. 13, 230–237. doi:10.1038/nrcardio.2015.194
Henriksson M., Petrenas A., Marozas V., Sandberg F., Sornmo L. (2018). Model-based assessment of f-wave signal quality in patients with atrial fibrillation. IEEE Trans. Biomed. Eng. 65, 2600–2611. doi:10.1109/TBME.2018.2810508
Holmqvist F., Stridh M., Waktare J. E. P., Brandt J., Sörnmo L., Roijer A., et al. (2005). Rapid fluctuations in atrial fibrillatory electrophysiology detected during controlled respiration. Am. J. Physiol. Heart Circ. Physiol. 289, H754–H760. doi:10.1152/ajpheart.00075.2005
Kontaxis S., Lázaro J., Corino V. D., Sandberg F., Bailón R., Laguna P., et al. (2019). Ecg-derived respiratory rate in atrial fibrillation. IEEE Trans. Biomed. Eng. 67, 905–914. doi:10.1109/TBME.2019.2923587
Krijthe B. P., Kunst A., Benjamin E. J., Lip G. Y., Franco O. H., Hofman A., et al. (2013). Projections on the number of individuals with atrial fibrillation in the European Union, from 2000 to 2060. Eur. Heart J. 34, 2746–2751. doi:10.1093/eurheartj/eht280
Lázaro J., Alcaine A., Romero D., Gil E., Laguna P., Pueyo E., et al. (2014). Electrocardiogram derived respiratory rate from qrs slopes and r-wave angle. Ann. Biomed. Eng. 42, 2072–2083. doi:10.1007/s10439-014-1073-x
Linz D., Elliott A. D., Hohl M., Malik V., Schotten U., Dobrev D., et al. (2019). Role of autonomic nervous system in atrial fibrillation. Int. J. Cardiol. 287, 181–188. doi:10.1016/j.ijcard.2018.11.091
Lip G. Y., Nieuwlaat R., Pisters R., Lane D. A., Crijns H. J. (2010). Refining clinical risk stratification for predicting stroke and thromboembolism in atrial fibrillation using a novel risk factor-based approach: The euro heart survey on atrial fibrillation. Chest 137, 263–272. doi:10.1378/chest.09-1584
Miyasaka Y., Barnes M. E., Gersh B. J., Cha S. S., Bailey K. R., Abhayaratna W. P., et al. (2006). Secular trends in incidence of atrial fibrillation in olmsted county, Minnesota, 1980 to 2000, and implications on the projections for future prevalence. Circulation 114, 119–125. doi:10.1161/CIRCULATIONAHA.105.595140
Monasterio V., Clifford G. D., Laguna P., MARTInez J. P. (2010). A multilead scheme based on periodic component analysis for t-wave alternans analysis in the ecg. Ann. Biomed. Eng. 38, 2532–2541. doi:10.1007/s10439-010-0029-z
Nitta T., Ishii Y., Miyagi Y., Ohmori H., Sakamoto S.-i., Tanaka S. (2004). Concurrent multiple left atrial focal activations with fibrillatory conduction and right atrial focal or reentrant activation as the mechanism in atrial fibrillation. J. Thorac. Cardiovasc. Surg. 127, 770–778. doi:10.1016/j.jtcvs.2003.05.001
Östenson S., Corino V. D. A., Carlsson J., Platonov P. G. (2017). Autonomic influence on atrial fibrillatory process: Head-up and head-down tilting. Ann. Noninvasive Electrocardiol. 22, e12405. doi:10.1111/anec.12405
Palmieri F., Gomis P., Ruiz J. E., Ferreira D., Martín-Yebra A., Pueyo E., et al. (2021). Ecg-based monitoring of blood potassium concentration: Periodic versus principal component as lead transformation for biomarker robustness. Biomed. Signal Process. Control 68, 102719. doi:10.1016/j.bspc.2021.102719
Patel N. J., Deshmukh A., Pant S., Singh V., Patel N., Arora S., et al. (2014). Contemporary trends of hospitalization for atrial fibrillation in the United States, 2000 through 2010: Implications for healthcare planning. Circulation 129, 2371–2379. doi:10.1161/CIRCULATIONAHA.114.008201
Platonov P. G., Corino V. D., Seifert M., Holmqvist F., Sörnmo L. (2014). Atrial fibrillatory rate in the clinical context: Natural course and prediction of intervention outcome. Europace 16, iv110–iv119. iv110–iv119. doi:10.1093/europace/euu249
Saksena S., Skadsberg N. D., Rao H. B., Filipecki A. (2005). Biatrial and three-dimensional mapping of spontaneous atrial arrhythmias in patients with refractory atrial fibrillation. J. Cardiovasc. Electrophysiol. 16, 494–504. doi:10.1111/j.1540-8167.2005.40531.x
Sameni R., Jutten C., Shamsollahi M. B. (2008). Multichannel electrocardiogram decomposition using periodic component analysis. IEEE Trans. Biomed. Eng. 55, 1935–1940. doi:10.1109/TBME.2008.919714
Saul L., Allen J. (2000). Periodic component analysis: An eigenvalue method for representing periodic structure in speech. Adv. Neural Inf. Process. Syst. 13.
Sohinki D., Thomas J., Scherlag B., Stavrakis S., Yousif A., Po S., et al. (2021). Impact of low-level electromagnetic fields on the inducibility of atrial fibrillation in the electrophysiology laboratory. Heart Rhythm O2 2, 239–246. doi:10.1016/j.hroo.2021.04.004
Stridh M., Meurling C., Olsson B., Sörnmo L. (2003). Detection of autonomic modulation in permanent atrial fibrillation. Med. Biol. Eng. Comput. 41, 625–629. doi:10.1007/bf02349969
Stridh M., Sörnmo L. (2001). Spatiotemporal QRST cancellation techniques for analysis of atrial fibrillation. IEEE Trans. Biomed. Eng. 48, 105–111. doi:10.1109/10.900266
Varon C., Lázaro J., Bolea J., Hernando A., Aguiló J., Gil E., et al. (2018). Unconstrained estimation of hrv indices after removing respiratory influences from heart rate. IEEE J. Biomed. Health Inf. 23, 2386–2397. doi:10.1109/JBHI.2018.2884644
Waldo A. L. (2003). Mechanisms of atrial fibrillation. J. Cardiovasc. Electrophysiol. 14, S267–S274. doi:10.1046/j.1540-8167.2003.90401.x
Widjaja D., Caicedo A., Vlemincx E., Van Diest I., Van Huffel S. (2014). Separation of respiratory influences from the tachogram: A methodological evaluation. PloS one 9, e101713. doi:10.1371/journal.pone.0101713
Keywords: atrial fibrillation, autonomic nervous system, respiratory variation, f-wave frequency, ECG processing
Citation: Abdollahpur M, Engström G, Platonov PG and Sandberg F (2022) A subspace projection approach to quantify respiratory variations in the f-wave frequency trend. Front. Physiol. 13:976925. doi: 10.3389/fphys.2022.976925
Received: 01 July 2022; Accepted: 23 August 2022;
Published: 19 September 2022.
Edited by:
Ruben Coronel, University of Amsterdam, NetherlandsReviewed by:
Andrius Petrėnas, Kaunas University of Technology, LithuaniaCopyright © 2022 Abdollahpur, Engström, Platonov and Sandberg. This is an open-access article distributed under the terms of the Creative Commons Attribution License (CC BY). The use, distribution or reproduction in other forums is permitted, provided the original author(s) and the copyright owner(s) are credited and that the original publication in this journal is cited, in accordance with accepted academic practice. No use, distribution or reproduction is permitted which does not comply with these terms.
*Correspondence: Mostafa Abdollahpur, bW9zdGFmYS5hYmRvbGxhaHB1ckBibWUubHRoLnNl
Disclaimer: All claims expressed in this article are solely those of the authors and do not necessarily represent those of their affiliated organizations, or those of the publisher, the editors and the reviewers. Any product that may be evaluated in this article or claim that may be made by its manufacturer is not guaranteed or endorsed by the publisher.
Research integrity at Frontiers

Learn more about the work of our research integrity team to safeguard the quality of each article we publish.