- Department of Thoracic Surgery, The Second Affiliated Hospital of Nanchang University, Nanchang, China
Background: The serum albumin level is reflective of the function of multiple organs, such as the liver and kidneys. However, the association between serum albumin and pulmonary function is unclear; therefore, this study aimed to determine the relationship between pulmonary function and serum albumin, including the threshold of serum albumin at the changes of the pulmonary function in the total population and in different strata of population.
Methods: In this cross-sectional study, We examined the relationship between serum albumin and two independent indicators of pulmonary function: forced vital capacity (FVC) and forced expiratory volume in one second (FEV 1), using data from National Health and Nutrition Examination Survey (NHANES 2013–2014) (n = 3286). We used univariate analysis, stratified analysis, and multiple regression equation analysis to examine the correlation between serum albumin levels and FVC and FEV 1, and performed smoothed curve fitting, threshold effect, and saturation effect analysis (for stratification) to determine the threshold serum albumin level at which FVC and FEV 1 begin to change.
Results: The adjusted smoothed curve fit plot showed a linear relationship between serum albu-min levels and FVC: for every 1 g/dl increase in the serum albumin level, FVC increased by 80.40 ml (11.18, 149.61). Serum albumin and FEV 1 showed a non-linear relationship. When serum al-bumin reached the inflection point (3.8 g/dl), FEV 1 increased with increasing serum albumin and the correlation coefficient β was 205.55 (140.15, 270.95).
Conclusion: Serum albumin is a core indicator of liver function, and abnormal liver function has a direct impact on pulmonary function. In the total population, serum albumin levels were linearly and positively correlated with FVC. Above 3.6 g/dl, serum albumin was positively correlated with FEV 1. Based on the total population and different population strata, this study revealed a positive association between the serum albumin level and pulmonary function, and identified the threshold of serum albumin when Indicators of pulmonary function tests starts to rise, providing a new early warning indicator for people at high risk of pulmonary insufficiency and has positive implications for the prevention of combined respiratory failure in patients with liver insufficiency.
1 Introduction
The National Health and Nutrition Examination Survey (NHANES) database is a rigorous and comprehensive database, and many influential studies have been derived from NHANES data. For example, Chen et al. (Chen et al., 2019) used the NHANES database to study the relationship between weight change and mortality in American adults. Pulmonary function tests are valuable in the treatment of patients with suspected or previously diagnosed respiratory disease. They help with diagnosis, monitoring the response to therapy, and guiding decisions regarding further treatment and intervention. Forced vital capacity (FVC), forced expiratory volume in one second (FEV 1), and other parameters have been used in the diagnosis and monitoring of respiratory disorders, such as chronic obstructive pulmonary disease (COPD), interstitial lung disease, and asthma (Kazemi, 1968; Wells, 2007; Mohamed Hoesein et al., 2011; Johnson and Theurer, 2014; Dempsey and Scanlon, 2018; Langan and Goodbred, 2020). However, pulmonary function tests might be contraindicated in some cases, such as, bullae, severe chest trauma, within 1 month of myocardial infarction, and in patients in an intensive care unit (ICU). In addition, pulmonary function tests are routinely performed before thoracic surgery; however, they are only one-time tests, and there is no ideal dynamic method to monitor pulmonary function, because 3 weeks after surgery is also a contraindication for pulmonary function tests (Cooper, 2011). Therefore, the current and commonly used pulmonary function tests are sometimes inadequate to support decisions regarding necessary respiratory support. Therefore, we wondered if there is a better way to solve these problems. We examined many data and literature and found that the serum albumin level might be a good indicator.
The serum albumin level is the main determinant of plasma colloidal osmotic pressure (Coward, 1975; Caraceni et al., 2013), and is a possible indicator of general physical health. Physiologically, serum albumin has the functions of binding and transporting endogenous and exogenous substances, scavenging free radicals, anti-oxidation, inhibiting platelets, anti-coagulation, and affecting the permeability of arteries and blood vessels (Roche et al., 2008; Fanali et al., 2012; Infusino and Panteghini, 2013; Lam et al., 2013; Wang et al., 2015; Sun et al., 2019). Serum albumin is closely related to multiple organ functions, such as the liver and kidney, which are closely related to pulmonary function.
A study involving 35 participants with COPD and cachexia showed that serum albumin levels were independently related to FVC and FEV 1 values (Görek Dilektaşli et al., 2009). However, in the general healthy population, or the larger population, this has not been studied so far. Therefore, we believe that a more in-depth and comprehensive study is warranted.
The aim of our research was to use representative samples of normal individuals to evaluate the relationship between serum albumin and pulmonary function based on NHANES samples (Ahluwalia et al., 2016). Our study provides a new method to assess pulmonary function and judge prognosis, a new strategy to prevent and treat respiratory failure, and a theoretical basis for the supplementation of albumin in patients with poor pulmonary function.
2 Materials and methods
2.1 Study population
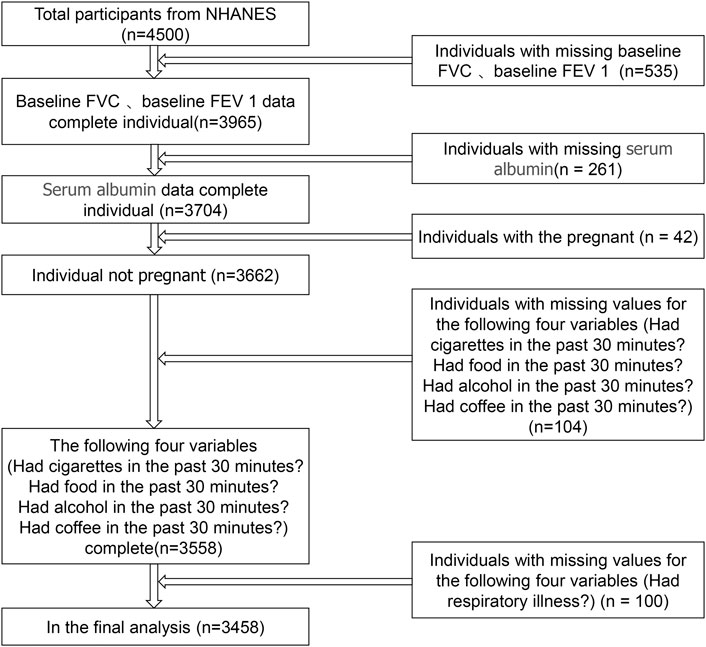
The data were obtained from NHANES III, which is a representative investigation of the American civilian and non-institutionalized population conducted by the NCHS of the Centers for Disease Control and Prevention. Details of survey design and methods can be found at the NCHS website (http://www.cdc.gov/). In brief, an individual accepts an interview at home and is then invited to a mobile test center for further interviews, tests, and examinations. Our analysis is based on data recorded from 2013 to 2014, which represents a cycle of the NHANES database. The 2013–2014 database has the most recent data for FVC and FEV 1. The total number of participants exported from the NHANES database was 4,500. We excluded individuals with missing data on FVC, FEV 1, and serum albumin levels, and individuals whose data were collected 30 minutes after smoking, 30 minutes after eating, 30 minutes after drinking alcohol, or 30 minutes after drinking coffee. In addition, individuals who were pregnant or had missing data for respiratory illness history were also excluded. Ultimately, there were 3458 participants in our study (Figure 1).
2.2 Variables
Serum albumin (g/dl) was the exposure variable in this study. Certified laboratory specialists collected and processed blood samples at the mobile examination center, and then stored them in biorepositories. To maintain the integrity of the samples, certain methods and criteria were followed. As a bichromatic digital endpoint approach, the DcX800 method was used to detect the serum albumin concentration, in which serum albumin forms a complex with the Bromcresol Purple (BCP) reagent. The system then measures the change in absorbance at 600 nm. The content of albumin in the sample is directly proportional to the change in absorbance. We divided serum albumin levels into three groups according to low, medium, and high. The low group was ≥2.1–4.2 g/dl, the medium group was ≥4.2–4.5 g/dl, and the high group was ≥4.5 to ≤5.4 g/dl. These groupings were predetermined based on research literature that previously demonstrated an association between serum albumin and liver function or kidney function or respiratory function (Razeghi et al., 2012; Abbatecola et al., 2014; Labgaa et al., 2016; Hattori et al., 2018; Li et al., 2020). The outcome variables were FVC and FEV 1. We used the functional spirometry assessment procedure based on the latest standards of the American Thoracic Society (ATS). The prompts of the spirometry system were followed to begin the examination. The standardized patient (SP) took a deep breath and after the chart driver began to roll, the SP placed the tube in his or her mouth and began to blow out rapidly. The SP was encouraged to continue blowing for a minimum of 6 s, as required by the ATS. The SP was then asked to stop blowing and the mouthpiece was removed. The test was repeated as prompted by the spirometry system. The examination ended after five acceptable/repeatable tests were obtained. The following continuous covariates were included in our analysis: age, weight (kg), standing height (cm), systolic blood pressure (mmHg), serum glucose (mmol/L), cholesterol (mmol/L), alanine aminotransferase (ALT) (U/L), total calcium (mmol/L), sodium (mmol/L), potassium (mmol/L). In our analysis, the following categorical variables were included as covariates: Sex, race, cigarette smoking, education level, previous surgery, and respiratory disease. For more information about serum albumin, FVC, FEV 1, and covariates, please visit https://www.cdc.gov/nchs/nhanes/.
2.3 Statistical analysis
All analyses were performed using Empower (R) (www.empowerstats.com, X&Y solutions, inc. Boston, MA, United States) and R version 3.6.3 (http://www.R-project.org). Empower Stats is a statistical software based on the R language for data analysis. The software has powerful data processing functions, as well as comprehensive analysis functions. p < 0.05 was accepted to indicate statistical significance. To explain the considerable variance in the data set, we used a weighted variance estimation analysis. The relationship between the serum albumin level and FVC and FEV 1 was studied using a weighted multivariate logistic regression model. To compute the difference between groups, we used a weighted chi-squared test for the categorical data and a weighted linear regression model for the continuous variables. Subgroup analysis was carried out using hierarchical multiple regression analysis. The non-linear link between the serum albumin level and FVC and FEV 1 was addressed using smooth curve fitting and a generalized additive model. A recursive algorithm was used to compute the in-flection point of the association between the serum albumin level and FVC and FEV 1 when non-linearity was discovered. A piecewise linear regression model was used on both sides of the inflection point.
3 Results
3.1 Baseline characteristics of selected participants subsection
Our study included 3,458 participants (1,797 male and 1,661 female), and tertiles were used as a subcdivision of the weighted characteristics of the participants (Table 1). The results showed that as the albumin level increased, both FVC and FEV 1 showed a gradual upward trend in the low, medium, and high serum albumin groups, with a statistically significant difference (p < 0.001). Details of the statistically significant variables for the three groups (low, medium, and high albumin) are shown in Table 1, all with p < 0.05. There were no significant differences in diastolic blood pressure, creatinine, and cigarette smoking within the low, middle, and high tertiles of the serum albumin level (Table 1).
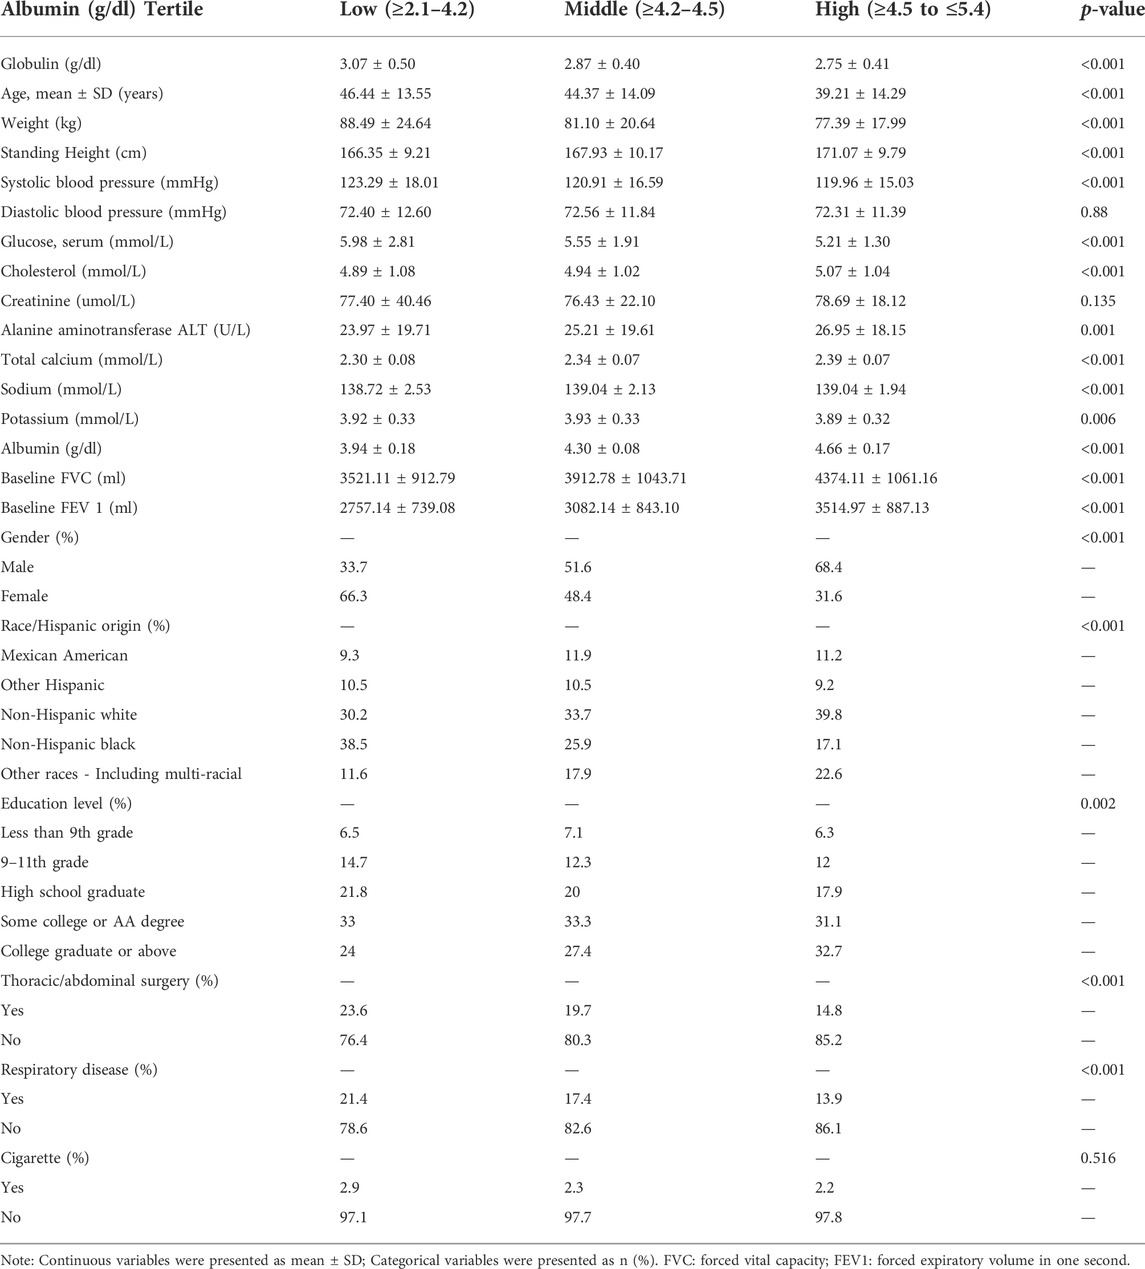
TABLE 1. Baseline characteristics of participants stratified by serum albumin tri-sectional quantiles.
3.2 Univariate analysis and stratified analysis of the association between serum albumin and pulmonary function
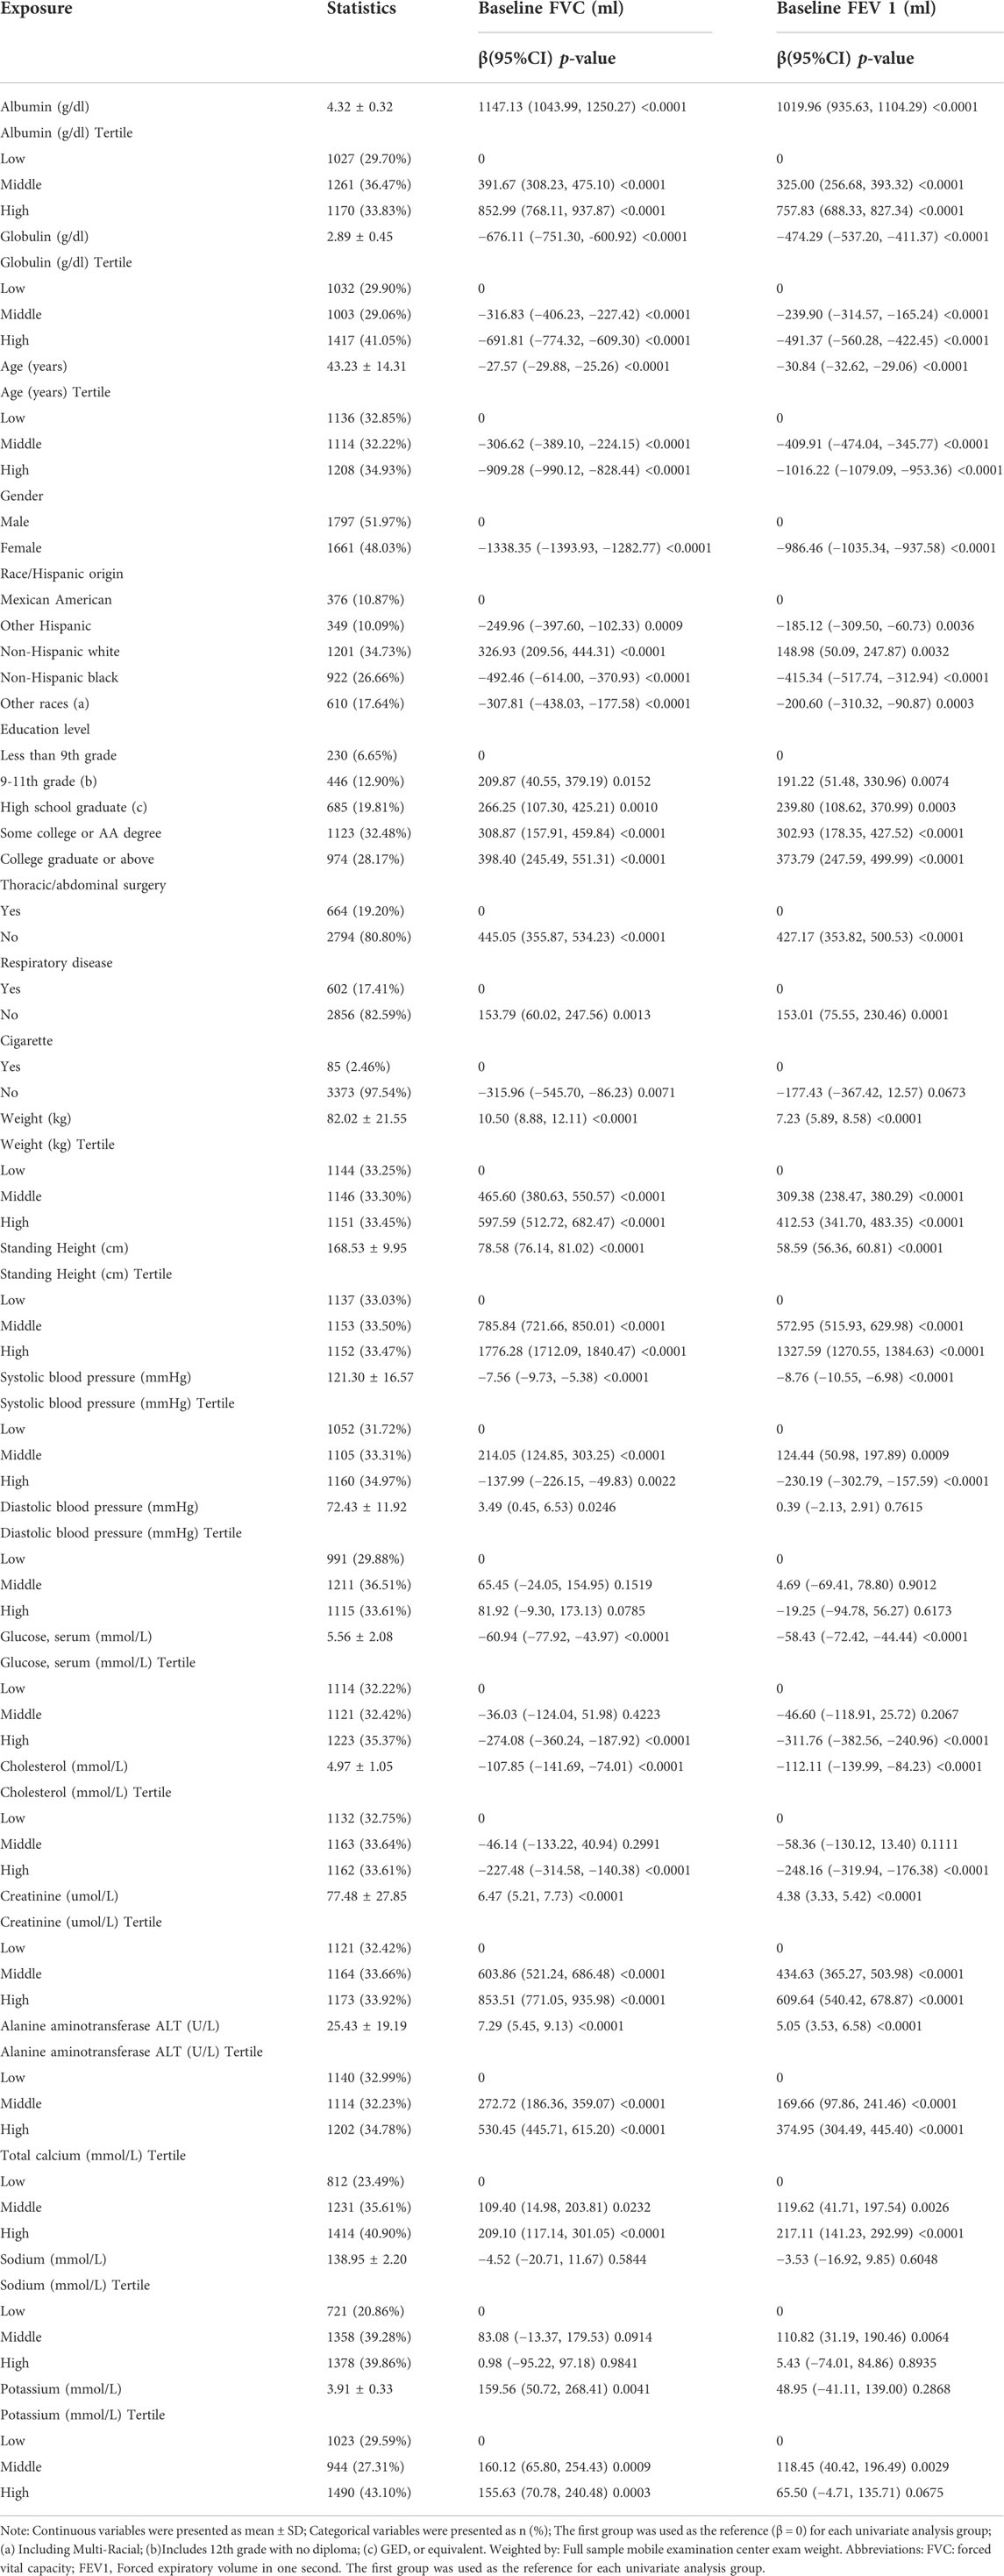
A positive association between the serum albumin level and pulmonary function was demonstrated by crude univariate analysis (Table 2). The reference group for each variable was the first group. For the baseline FVC analysis, compared with that the lower tertile group, the beta value (confidence interval (CI)) of the serum albumin level was 391.67 (308.23, 475.10) in the middle tertile group and 852.99 (768.11, 937.87) in the high tertile group, all at p < 0.0001. For the baseline FEV 1 analysis, compared with that in the lower tertile group, the beta value (CI) of the serum albumin level was 325 (256.68, 392.32) in the middle tertile group and 757.83 (688.33, 827.34) in the high tertile group, all at p < 0.0001. FVC and FEV 1 were also associated with globulin, age, gender, race, weight, education level, thoracic/abdominal surgery, respiratory disease, weight, standing height, systolic blood pressure, serum glucose, creatine, cholesterol, ALT, total calcium, sodium, potassium. In addition, smoking was associated with FVC, while it had no significant association with FEV 1. Diastolic blood pressure was not significantly associated with FVC and FEV 1. For further study, stratified analysis (Supplementary Table S1) was performed. In the stratified analysis, serum albumin levels and pulmonary function were positively correlated in almost all strata (Supplementary Table S1).
3.3 Multiple regression equation analysis of the association between serum albumin and pulmonary function
Similarly, multivariate analysis revealed a positive relationship between serum albumin and pulmonary function (Table 3). In different models, the beta values of both FVC and FEV 1 increased approximately with increasing albumin levels. In the unadjusted model, compared with that in the lower tertile group, higher albumin levels were associated with higher FVC (β = 852.99, 95% CI = 768.11–937.87, p < 0.0001) and FEV 1 (β = 325.00, 95% CI = 256.68–393.32, p < 0.0001). In the model I which adjusted for gender, high albumin levels were also associated with higher FVC (β = 421.00, 95% CI = 349.7–492.2, p < 0.05) and FEV 1 (β = 450.10, 95% CI = 388.10–512.20, p < 0.001). In the fully adjusted model IV, high albumin levels were associated with higher FVC (β = 63.61, 95% CI = 1.99–125.23, p < 0.05) and FEV 1 (β = 119.90, 95% CI = 65.77–174.02, p < 0.0001). The rough model was unadjusted. The covariates used for adjustment in models are detailed in Table 3.
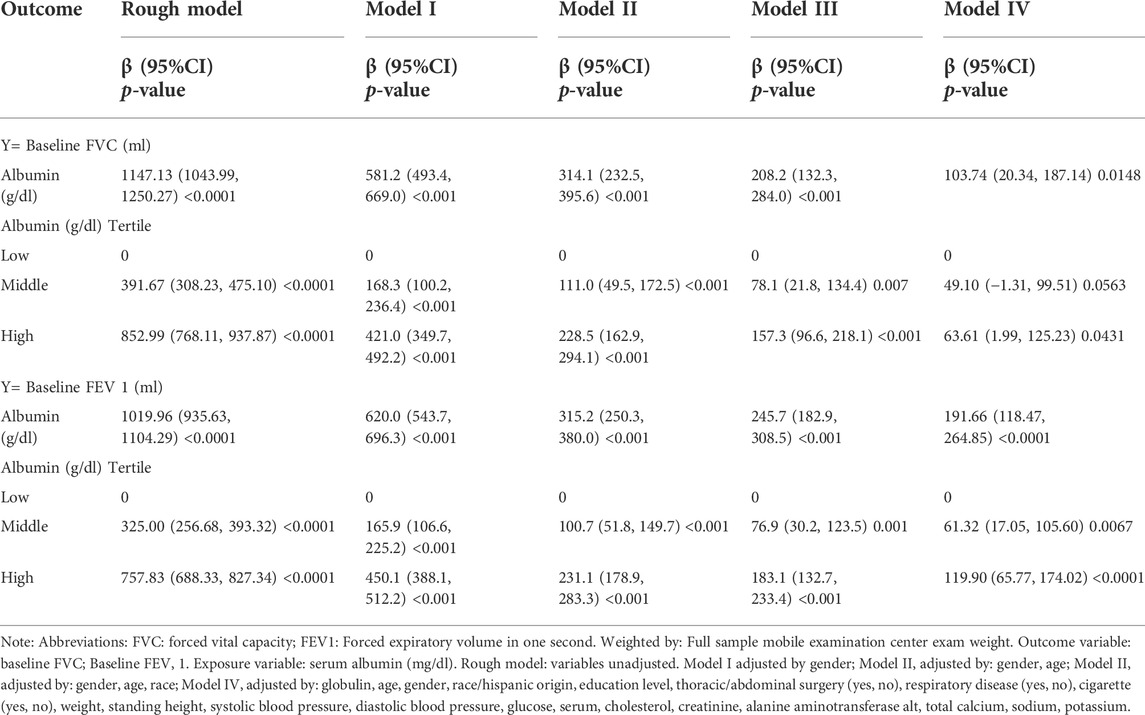
TABLE 3. Relationship between serum and serum albumin and Pulmonary Function (multiple regression equation analysis).
3.4 Smooth curve fitting, threshold effect and saturation effect analyses between serum albumin levels and pulmonary function
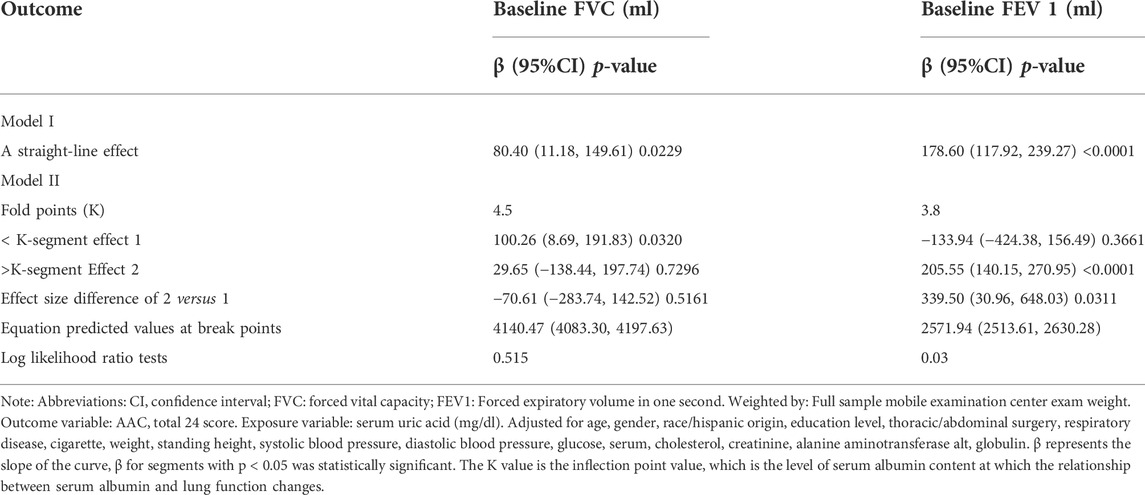
To further clarify the relationship between the serum albumin level and pulmonary function, we performed smooth curve fitting (Figure 2) between serum albumin levels and pulmonary function. To identify the serum albumin level at which the baseline FVC and FEV 1 start to increase, threshold effect and saturation effect analyses were per-formed (Table 4). The adjusted smoothed curve fit plot showed a linear relationship between serum albumin levels and FVC: for every 1 g/dl increase in serum albumin level, FVC increased by 80.40 ml (95% CI = 11.18–149.61, p = 0.0229) (Figure 2A,B, Table 4). In addition, serum albumin and FEV 1 showed a non-linear relationship. When the serum albumin level reached the inflection point (3.8 g/dl), FEV 1 increased with in-creasing serum albumin and the correlation coefficient β was 205.55 (95% CI = 140.15–270.95, p < 0.0001). When serum albumin was less than 3.8 g/dl, there was no significant relationship between serum albumin and FVC (p = 0.3661) (Table 4). The covariates used for adjustment are detailed in Table 4.
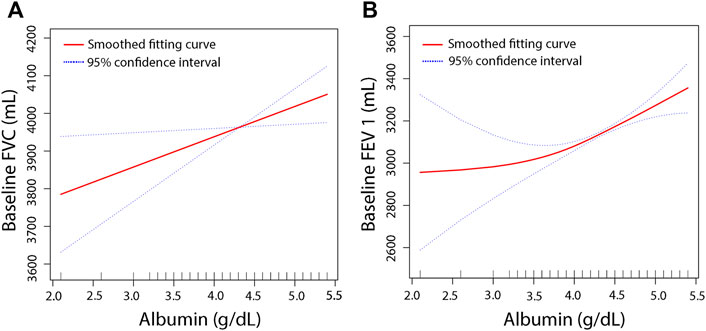
FIGURE 2. The association between serum albumin and pulmonary function. The smooth curve fit between the variables is indicated by the red line. The fit’s 95 percent confidence interval is represented by the blue bar. Weighted by: Full sample mobile examination center exam weight. Adjusted for, globulin (smooth), age (smooth), gender, education level, race, surgery (yes, no), respiratory disease (yes, no), cigarette (yes, no), weight (smooth), standing height (smooth), diastolic blood pressure (smooth), systolic blood pressure (smooth), glucose, serum (smooth), cholesterol (smooth), creatinine (smooth), ALT (smooth), total calcium (smooth), sodium (smooth), potassium (smooth). (A) Solid line plot of curve fit whose main variables are baseline albumin and FVC. (B) Solid line plot of curve fit whose main variables are baseline albumin and FEV 1.
3.5 Smooth curve fitting for stratification, threshold effect and saturation effect analyses for stratification
For more detailed analysis, smooth fitting curves were drawn for different strata of the six covariates (Figure 3, Figure 4). Threshold effect and saturation effect analysis were performed to clarify the changes in baseline FEV and FEV 1 with increase of serum albumin in the different strata of each covariate (Supplementary Table S3–S13) respectively. The K value in tables is the inflection point value, which is the level of serum albumin content at which the relationship between serum albumin and lung function changes. There is no K value when the relationship between serum albumin and the outcome variable shows a straight-line effect.
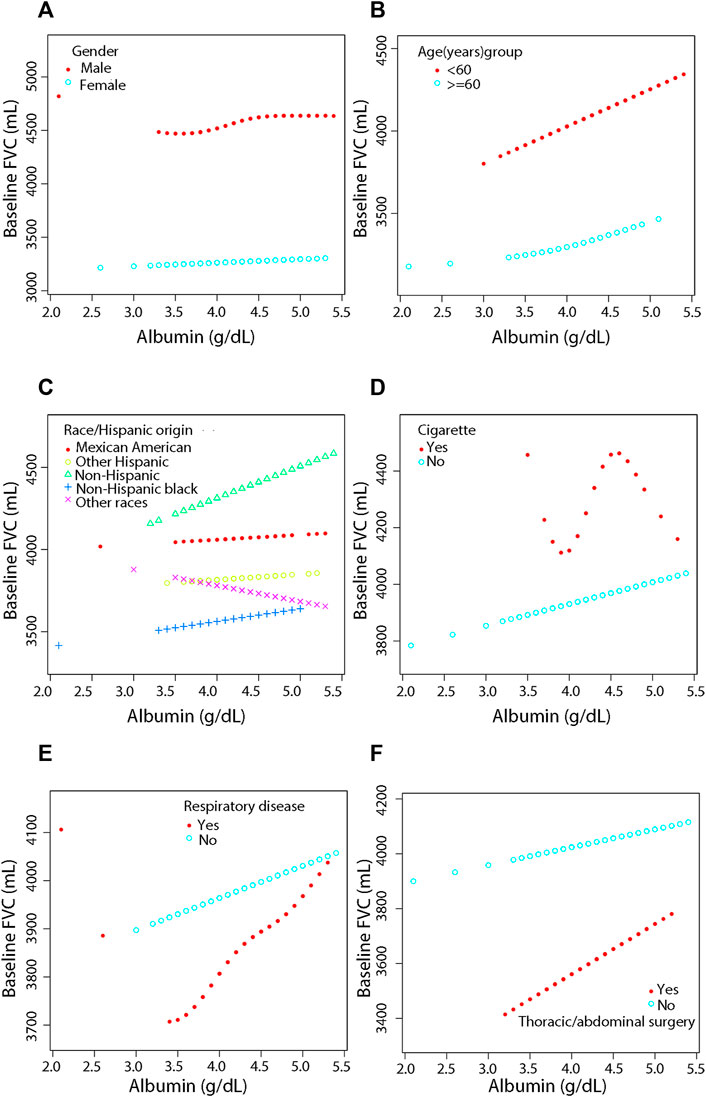
FIGURE 3. Association between serum albumin and Pulmonary Function (FVC) by covariate variables (gender, age, race, cigarette, respiratory disease, surgery). Weighted by: Exam weight in a full sample mobile examination center. Adjusted for globulin (smooth), age (smooth), gender, race, education level, surgery (yes, no), respiratory disease (yes, no), cigarette (yes, no), weight (smooth), standing height (smooth), diastolic blood pressure (smooth), systolic blood pressure (smooth), glucose, serum (smooth), cholesterol (smooth), creatinine (smooth), ALT (smooth), total calcium (smooth), sodium (smooth), potassium (smooth). (A) Stratified by gender. (B) Stratified by age dichotomy. (C) Stratified race. (D) Stratified by cigarette. (E) Stratified by respiratory disease. (F) Stratified by surgery.
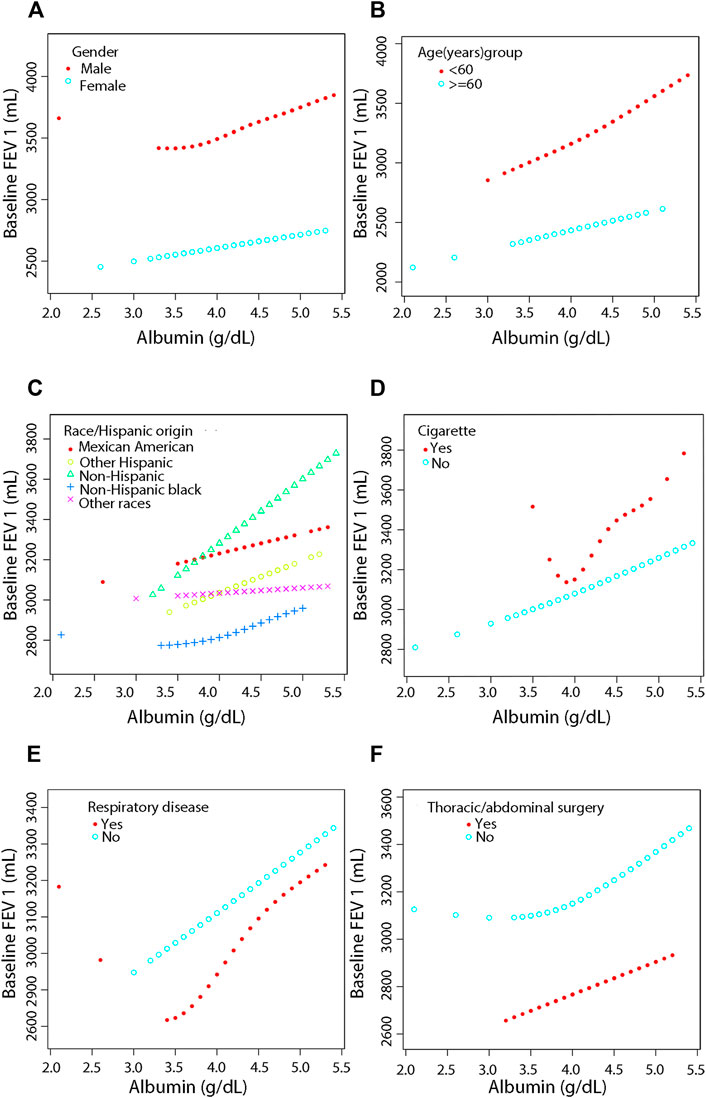
FIGURE 4. Association between serum albumin and Pulmonary Function (FEV 1) by covariate variables (gender, age, race, cigarette, respiratory disease, surgery). Weighted by: Exam weight in a full sample mobile examination center. Adjusted for globulin (smooth), age (smooth), gender, education level, race, surgery (yes, no), respiratory disease (yes, no), cigarette (yes, no), weight (smooth), standing height (smooth), diastolic blood pressure (smooth), systolic blood pressure (smooth), glucose, serum (smooth), cholesterol (smooth), creatinine (smooth), ALT (smooth), total calcium (smooth), sodium (smooth), potassium (smooth). (A) Stratified by gender. (B) Stratified by age dichotomy. (C) Stratified race. (D) Stratified by cigarette. (E) Stratified by respiratory disease. (F) Stratified by surgery.
After adjustment, the results showed a linear positive correlation between serum albumin and both FVC (β = 236.20, 95% CI = 156.51–315.90, p < 0.0001) (Figure 3B) and FEV 1 (β = 375.12, 95% CI = 301.32–448.92, p < 0.0001) (Figure 4B) in those aged less than 60 years (Supplementary Table S3). In the stratification of race, serum albumin and FVC were linearly and positively (β = 127.80, 95% CI = 0.84–254.75, p = 0.0488) correlated in the Non-Hispanic black population (Supplementary Table S4, Figure 3C). In the Mexican American population (β = 174.48, 95% CI = 21.52–327.44, p = 0.0260), Non-Hispanic white population (β = 266.81, 95% CI = 151.56–382.05, p < 0.0001), and Non-Hispanic black population (β = 155.27, 95% CI = 38.09–272.45, p = 0.0096), serum albumin was linearly and positively correlated with FEV 1 in all three populations and the correlations were significantly different (P-interaction = 0.001) (Supplementary Table S4, Figure 4C).
In the smoking population, serum albumin and FEV 1 showed a segmental effect, and when serum albumin was <3.8 g/dl, serum albumin and FEV 1 were negatively correlated (β = -3577.38, 95% CI = −6506.52 to −648.24, p = 0.0199) (Supplementary Table S5, Figure 4D). In addition, serum albumin was linearly and positively correlated with both FVC (β = 80.95, 95% CI = 11.11–150.79, p = 0.0232) and FEV 1 (β = 178.72, 95% CI = 117.44–239.99, p < 0.0001) in the nonsmoking population (Supplementary Table S5, Figure 3D and Figure 4D).
Serum albumin was linearly and positively correlated with FEV 1 in those with previous respiratory disease (β = 228.90, 95% CI = 73.89–383.91, p = 0.0040). Serum albumin was also linearly and positively correlated with FEV 1 in those who had not had respiratory disease (β = 163.86, 95% CI = 98.00–229.73, p < 0.0001), and the correlation was similar in both groups (P-interaction = 0.256) (Supplementary Table S6, Figure 4E). In those who had thoracic or abdominal surgery, serum albumin showed a linear positive correlation with FEV 1 with a correlation coefficient of 160.38 (95% CI = 28.63–292.13, p = 0.0173). In those who did not have thoracic or abdominal surgery, serum albumin showed a segmental effect with FEV 1, with serum albumin levels increasing with FEV 1 when serum albumin levels were >3.8 g/dl with a correlation coefficient of 209.36 (95% CI = 136.42–282.30, p < 0.0001). The covariates used for adjustment are detailed in Supplementary Table S2–S7.
4 Discussion
Worldwide, respiratory diseases are one of the leading causes of mortality and represent a serious health threat (Wang et al., 2013; Heron, 2019; Gayle et al., 2005-2015; Siegel et al., 2022; Koskela et al., 2005; Faustini et al., 2013). The many components of pulmonary function provide a valuable tool to assess respiratory system health and disorders in clinical settings (Liang et al., 2012). However, pulmonary function tests are contraindicated in pulmonary maculopathy, severe chest trauma, in the ICU, within 1 month of myocardial infarction, and for 3 weeks after thoracic surgery; therefore, the currently used pulmonary function tests are sometimes insufficient to support the decision to provide necessary respiratory support (Cooper, 2011; Altree et al., 2019; Rivero-Yeverino, 2019).
Many previous studies have explored alternatives to pulmonary function tests. We reviewed a large amount of data and literature, which suggested that serum albumin might a good indicator. We then analyzed the relationship between the serum albumin level and pulmonary function based on the NHANES database, which is a rigorous and comprehensive database. Many scholars have used this database to obtain meaningful results. Chen et al. used the NHANES database to analyze the relationship between weight change and mortality in Americans across adulthood (Chen et al., 2019). They found that stable obesity in adulthood, weight gain from young adulthood to midlife, and weight loss from midlife to late adulthood were associated with an increased risk of death. Based on Big Data, more unknown disease risk factors can be discovered, more accurate diagnosis and prognosis predictions become possible, and further innovative disease solutions can be proposed (Big hopes for big data, 2020). Large amounts valuable data were obtained from this database for analysis.
Serum albumin is related to cerebral ischemia (Turhan et al., 2006), Alzheimer’s disease (Skillbäck et al., 2017; Bode et al., 2018; Kim et al., 2020), Crohn’s disease (Su et al., 2019), liver cirrhosis (Chen et al., 2011; Oettl et al., 2013; Arroyo et al., 2014), chronic heart failure (Jabbour et al., 2014), acute kidney injury (Bang et al., 2018; Thongprayoon et al., 2018; Lv et al., 2021), chronic kidney disease (Stoycheff et al., 2009; Zhang et al., 2015) and other diseases; however, the relationship between serum albumin and pulmonary function is unclear. Several studies have shown that in some acute respiratory diseases that lead to reduced pulmonary function, such as acute respiratory distress and acute lung, serum albumin increases capillary permeability, causing it to leak from blood vessels into tissue fluid or to escape into the alveolar space, resulting in reduced serum albumin levels (Fanali et al., 2012). Besides, a reduced serum albumin level is a recognized clinical sign of malnutrition, and malnutrition causes respiratory muscle weakness and reduces pulmonary function (Kuzuya et al., 2007; Itoh et al., 2013; Rozga et al., 2013; Zhang et al., 2017; Arigliani et al., 2018; Eckart et al., 2020; Ferdous et al., 2021). Therefore, serum albumin can be increased to prevent respiratory failure. The results of the present study indicated that serum albumin correlated positively with important indicators of pulmonary function, which corroborates the above point.
Asl et al. carried out a cross-sectional study of 35 patients with COPD and cachexia found that serum albumin correlated positively with pulmonary function (Görek Dilektaşli et al., 2009), which agrees with our results. That study was the first cross-sectional study to include the association between albumin and pulmonary function; however, the study population was limited and the sample size was small. Compared with that study, our study has a higher sample size, a broader study population, and a more statistically rigorous approach by removing the effect of confounding factors.
The association of serum albumin with liver and kidney function has been widely demonstrated. In the rough endoplasmic reticulum, hepatocytes manufacture serum albumin in circular polysomes. Therefore, serum albumin levels will drop as liver function is impaired (Spinella et al., 2016). In contrast, there is a direct loss of albumin during nephrotic syndrome, peritoneal dialysis, and high-flux hemodialysis (Mehrotra et al., 2011). Whether the intrinsic mechanism of the effect of serum albumin on pulmonary function is achieved by affecting liver and kidney function should be the subject of further clinical and basic research. However, this study provides a guide for predicting pulmonary function and predicting respiratory failure in specific populations.
There are still certain limits to our research. First, although the sample size was relatively large, increasing the number of subjects would make the research results more convincing. Second, the cross-sectional study itself has certain limitations. For example, it cannot explain the causal relationship and can only indicate the correlation between two factors on a cross-sectional basis. Moreover, although we controlled for related confounding factors, interference by other confounding factors cannot be ruled out, thus further large-sample prospective studies and more refined data are needed for confirmation.
5 Conclusion
The apparent positive correlation between serum albumin levels and pulmonary function provides a credible complement to pulmonary function monitoring in specific populations, and serum albumin might become a promising indicator of when to administer respiratory support therapy in the future. Our results also provide the theoretical basis and data support for improving pulmonary function in critically ill patients via albumin administration. Appropriate supplementation with albumin might provide a ventilator-free treatment for those with critical pulmonary function values.
Data availability statement
The publicly available datasets used in this study can be found on the Centers for Disease Control and Prevention (CDC) website at: https://www.cdc.gov/nchs/nhanes/index.htm.
Ethics statement
The studies involving human participants were reviewed and approved by National Center for Health Statistics. The patients/participants provided their written informed consent to participate in this study.
Author contributions
Conceptualization, SH, QG, SW, YW and JX; methodology, SH, QG, SW, YW and JX; software, SH, QG and SW; validation, DZ, YZ, SZ, LS and JY; formal analysis, SH, QG, SW; investigation, DZ, YZ, SZ, LS and JY; resources, SH, QG, SW; data curation, SH, QG, SW and WZ; writing—original draft preparation, SH, QG, and SW; writing—review and editing, SH, QG, SW, YW, JX, WZ and DY; visualization, SH, QG, SW; supervision, YW; project administration, YW; funding acquisition, YW. All authors have read and agreed to the published version of the manuscript.
Funding
This research was funded by the National Natural Science Foundation of China (81860379, 82160410 and 81560345) and the Science and Technology Planning Project at the Department of Science and Technology of Jiangxi Province, China (20171BAB 205075 and 20162BCB 23058).
Acknowledgments
We hereby thank the participants for their time and energy in the data collection phase of NHANES project.
Conflict of interest
The authors declare that the research was conducted in the absence of any commercial or financial relationships that could be construed as a potential conflict of interest.
Publisher’s note
All claims expressed in this article are solely those of the authors and do not necessarily represent those of their affiliated organizations, or those of the publisher, the editors and the reviewers. Any product that may be evaluated in this article, or claim that may be made by its manufacturer, is not guaranteed or endorsed by the publisher.
Supplementary material
The Supplementary Material for this article can be found online at: https://www.frontiersin.org/articles/10.3389/fphys.2022.948370/full#supplementary-material
References
Abbatecola A. M., Fumagalli A., Spazzafumo L., Betti V., Misuraca C., Corsonello A., et al. (2014). Body composition markers in older persons with COPD. Age Ageing 43 (4), 548–553. doi:10.1093/ageing/aft196
Ahluwalia N., Dwyer J., Terry A., Moshfegh A., Johnson C. (2016). Update on NHANES dietary data: Focus on collection, release, analytical considerations, and uses to inform public policy. Adv. Nutr. 7 (1), 121–134. doi:10.3945/an.115.009258
Altree T., Bussell L., Nguyen P., Johnston S. (2019). Adverse cardiac outcomes after pulmonary function testing with recent myocardial infarction. Respir. Med. 155, 49–50. doi:10.1016/j.rmed.2019.07.003
Arigliani M., Spinelli A. M., Liguoro I., Cogo P. (2018). Nutrition and lung growth. Nutrients 10 (7), E919. doi:10.3390/nu10070919
Arroyo V., García-Martinez R., Salvatella X. (2014). Human serum albumin, systemic inflammation, and cirrhosis. J. Hepatol. 61 (2), 396–407. doi:10.1016/j.jhep.2014.04.012
Bang J. Y., Kim S. O., Kim S. G., Song J. G., Kang J., Kim J. W., et al. (2018). Impact of the serum albumin level on acute kidney injury after cerebral artery aneurysm clipping. PloS one 13 (11), e0206731. doi:10.1371/journal.pone.0206731
Bode D. C., Stanyon H. F., Hirani T., Baker M. D., Nield J., Viles J. H. (2018). Serum albumin's protective inhibition of amyloid-β fiber formation is suppressed by cholesterol, fatty acids and warfarin. J. Mol. Biol. 430 (7), 919–934. doi:10.1016/j.jmb.2018.01.008
Caraceni P., Domenicali M., Tovoli A., Napoli L., Ricci C. S., Tufoni M., et al. (2013). Clinical indications for the albumin use: Still a controversial issue. Eur. J. Intern. Med. 24 (8), 721–728. doi:10.1016/j.ejim.2013.05.015
Chen C., Ye Y., Zhang Y., Pan X. F., Pan A. (2019). Weight change across adulthood in relation to all cause and cause specific mortality: Prospective cohort study. BMJ Clin. Res. ed) 367, l5584. doi:10.1136/bmj.l5584
Chen C. Y., Tsai W. L., Lin P. J., Shiesh S. C. (2011). The value of serum ischemia-modified albumin for assessing liver function in patients with chronic liver disease. Clin. Chem. Lab. Med. 49 (11), 1817–1821. doi:10.1515/CCLM.2011.675
Cooper B. G. (2011). An update on contraindications for lung function testing. Thorax 66 (8), 714–723. doi:10.1136/thx.2010.139881
Coward W. A. (1975). Serum colloidal osmotic pressure in the development of kwashiorkor and in recovery: Its relationship to albumin and globulin concentrations and oedema. Br. J. Nutr. 34 (3), 459–467. doi:10.1017/s0007114575000517
Dempsey T. M., Scanlon P. D. (2018). Pulmonary function tests for the generalist: A brief review. Mayo Clin. Proc. 93 (6), 763–771. doi:10.1016/j.mayocp.2018.04.009
Eckart A., Struja T., Kutz A., Baumgartner A., Baumgartner T., Zurfluh S., et al. (2020). Relationship of nutritional status, inflammation, and serum albumin levels during acute illness: A prospective study. Am. J. Med. 133 (6), 713–722. e7. doi:10.1016/j.amjmed.2019.10.031
Fanali G., di Masi A., Trezza V., Marino M., Fasano M., Ascenzi P. (2012). Human serum albumin: From bench to bedside. Mol. Asp. Med. 33 (3), 209–290. doi:10.1016/j.mam.2011.12.002
Faustini A., Stafoggia M., Colais P., Berti G., Bisanti L., Cadum E., et al. (2013). Air pollution and multiple acute respiratory outcomes. Eur. Respir. J. 42 (2), 304–313. doi:10.1183/09031936.00128712
Ferdous F., Raqib R., Ahmed S., Faruque A., Chisti M. J., Ekström E. C., et al. (2021). Early childhood malnutrition trajectory and lung function at preadolescence. Public Health Nutr. 24 (5), 1009–1020. doi:10.1017/S1368980019004853
Gayle A. V., Axson E. L., Bloom C. I., Navaratnam V., Quint J. K. (2005-20152019). Changing causes of death for patients with chronic respiratory disease in England, 2005-2015. Thorax 74 (5), 483–491. doi:10.1136/thoraxjnl-2018-212514
Görek Dilektaşli A., Ulubay G., Bayraktar N., Eminsoy I., Oner Eyüboğlu F. (2009). The effects of cachexia and related components on pulmonary functions in patients with COPD. Tuberk. Toraks 57 (3), 298–305.
Hattori K., Matsuda T., Takagi Y., Nagaya M., Inoue T., Nishida Y., et al. (2018). Preoperative six-minute walk distance is associated with pneumonia after lung resection. Interact. Cardiovasc. Thorac. Surg. 26 (2), 277–283. doi:10.1093/icvts/ivx310
Infusino I., Panteghini M. (2013). Serum albumin: Accuracy and clinical use. Clin. Chim. Acta. 419, 15–18. doi:10.1016/j.cca.2013.01.005
Itoh M., Tsuji T., Nemoto K., Nakamura H., Aoshiba K. (2013). Undernutrition in patients with COPD and its treatment. Nutrients 5 (4), 1316–1335. doi:10.3390/nu5041316
Jabbour R., Ling H. Z., Norrington K., Amaral N., Zaman N., Aggarwal S., et al. (2014). Serum albumin changes and multivariate dynamic risk modelling in chronic heart failure. Int. J. Cardiol. 176 (2), 437–443. doi:10.1016/j.ijcard.2014.07.096
Johnson J. D., Theurer W. M. (2014). A stepwise approach to the interpretation of pulmonary function tests. Am. Fam. Physician 89 (5), 359–366.
Kazemi H. (1968). Pulmonary-function tests. JAMA J. Am. Med. Assoc. 206 (10), 2302–2304. doi:10.1001/jama.206.10.2302
Kim J. W., Byun M. S., Lee J. H., Yi D., Jeon S. Y., Sohn B. K., et al. (2020). Serum albumin and beta-amyloid deposition in the human brain. Neurology 95 (7), e815–e826. doi:10.1212/WNL.0000000000010005
Koskela R. S., Mutanen P., Sorsa J. A., Klockars M. (2005). Respiratory disease and cardiovascular morbidity. Occup. Environ. Med. 62 (9), 650–655. doi:10.1136/oem.2004.017111
Kuzuya M., Izawa S., Enoki H., Okada K., Iguchi A. (2007). Is serum albumin a good marker for malnutrition in the physically impaired elderly? Clin. Nutr. 26 (1), 84–90. doi:10.1016/j.clnu.2006.07.009
Labgaa I., Joliat G. R., Demartines N., Hübner M. (2016). Serum albumin is an early predictor of complications after liver surgery. Dig. Liver Dis. 48 (5), 559–561. doi:10.1016/j.dld.2016.01.004
Lam F. W., Cruz M. A., Leung H. C., Parikh K. S., Smith C. W., Rumbaut R. E. (2013). Histone induced platelet aggregation is inhibited by normal albumin. Thromb. Res. 132 (1), 69–76. doi:10.1016/j.thromres.2013.04.018
Langan R. C., Goodbred A. J. (2020). Office spirometry: Indications and interpretation. Am. Fam. Physician 101 (6), 362–368.
Li L., Li Z., Bi J., Li H., Wang S., Shao C., et al. (2020). The association between serum albumin/prealbumin level and disease severity in non-CF bronchiectasis. Clin. Exp. Pharmacol. Physiol. 47 (9), 1537–1544. doi:10.1111/1440-1681.13331
Liang B-M., Lam D. C. L., Feng Y-L. (2012). Clinical applications of lung function tests: A revisit. Respirology 17 (4), 611–619. doi:10.1111/j.1440-1843.2012.02149.x
Lv J., Wang H., Sun B., Gao Y., Zhang Z., Pei H. (2021). Serum albumin before CRRT was associated with the 28- and 90-day mortality of critically ill patients with acute kidney injury and treated with continuous renal replacement therapy. Front. Nutr. 8, 717918. doi:10.3389/fnut.2021.717918
Mehrotra R., Duong U., Jiwakanon S., Kovesdy C. P., Moran J., Kopple J. D., et al. (2011). Serum albumin as a predictor of mortality in peritoneal dialysis: Comparisons with hemodialysis. Am. J. Kidney Dis. 58 (3), 418–428. doi:10.1053/j.ajkd.2011.03.018
Mohamed Hoesein F. A., Zanen P., Lammers J. W. (2011). Lower limit of normal or FEV1/FVC < 0.70 in diagnosing COPD: An evidence-based review. Respir. Med. 105 (6), 907–915. doi:10.1016/j.rmed.2011.01.008
Oettl K., Birner-Gruenberger R., Spindelboeck W., Stueger H. P., Dorn L., Stadlbauer V., et al. (2013). Oxidative albumin damage in chronic liver failure: Relation to albumin binding capacity, liver dysfunction and survival. J. Hepatol. 59 (5), 978–983. doi:10.1016/j.jhep.2013.06.013
Razeghi E., Pazoki M., Ahmadi F., Bagherzadeh M., Miri M. B., Sahraiean M., et al. (2012). Relation between pulmonary function and inflammatory biomarkers in hemodialysis patients. Ren. Fail. 34 (1), 24–27. doi:10.3109/0886022X.2011.623495
Rivero-Yeverino D. (2019). Spirometry: Basic concepts. Rev. Alerg. Mex. 66 (1), 76–84. doi:10.29262/ram.v66i1.536
Roche M., Rondeau P., Singh N. R., Tarnus E., Bourdon E. (2008). The antioxidant properties of serum albumin. FEBS Lett. 582 (13), 1783–1787. doi:10.1016/j.febslet.2008.04.057
Rozga J., Piatek T., Malkowski P. (2013). Human albumin: Old, new, and emerging applications. Ann. Transpl. 18, 205–217. doi:10.12659/AOT.889188
Siegel R. L., Miller K. D., Fuchs H. E., Jemal A. (2022). Cancer statistics, 2022. Ca. Cancer J. Clin. 72 (1), 7–33. doi:10.3322/caac.21708
Skillbäck T., Delsing L., Synnergren J., Mattsson N., Janelidze S., Nägga K., et al. (2017). CSF/serum albumin ratio in dementias: A cross-sectional study on 1861 patients. Neurobiol. Aging 59, 1–9. doi:10.1016/j.neurobiolaging.2017.06.028
Spinella R., Sawhney R., Jalan R. (2016). Albumin in chronic liver disease: Structure, functions and therapeutic implications. Hepatol. Int. 10 (1), 124–132. doi:10.1007/s12072-015-9665-6
Stoycheff N., Stevens L. A., Schmid C. H., Tighiouart H., Lewis J., Atkins R. C., et al. (2009). Nephrotic syndrome in diabetic kidney disease: An evaluation and update of the definition. Am. J. Kidney Dis. 54 (5), 840–849. doi:10.1053/j.ajkd.2009.04.016
Su Q., Li X., Mo W., Yang Z. (2019). Low serum bilirubin, albumin, and uric acid levels in patients with Crohn's disease. Med. Baltim. 98 (19), e15664. doi:10.1097/MD.0000000000015664
Sun L., Yin H., Liu M., Xu G., Zhou X., Ge P., et al. (2019). Impaired albumin function: A novel potential indicator for liver function damage? Ann. Med. 51 (7-8), 333–344. doi:10.1080/07853890.2019.1693056
Thongprayoon C., Cheungpasitporn W., Mao M. A., Sakhuja A., Kashani K. (2018). U-shape association of serum albumin level and acute kidney injury risk in hospitalized patients. PloS one 13 (6), e0199153. doi:10.1371/journal.pone.0199153
Turhan N., Saraçgil N., Oztop P., Bayramoğlu M. (2006). Serum albumin and comorbidity relative to rehabilitation outcome in geriatric stroke, and possible links with stroke etiology. Int. J. Rehabil. Res. 29 (1), 81–85. doi:10.1097/01.mrr.0000191846.72821.dc
Wang C., Xiao F., Qiao R., Shen Y. H. (2013). Respiratory medicine in China: Progress, challenges, and opportunities. Chest 143 (6), 1766–1773. doi:10.1378/chest.12-1854
Wang Y., Wang S., Huang M. (2015). Structure and enzymatic activities of human serum albumin. Curr. Pharm. Des. 21 (14), 1831–1836. doi:10.2174/1381612821666150302113906
Wells A. U. (2007). Pulmonary function tests in connective tissue disease. Semin. Respir. Crit. Care Med. 28 (4), 379–388. doi:10.1055/s-2007-985610
Zhang X., Bansal N., Go A. S., Hsu C. Y. (2015). Gastrointestinal symptoms, inflammation and hypoalbuminemia in chronic kidney disease patients: A cross-sectional study. BMC Nephrol. 16, 211. doi:10.1186/s12882-015-0209-z
Keywords: serum albumin, pulmonary function, FVC, FEV 1, NHANES
Citation: Hu S, Guo Q, Wang S, Zhang W, Ye J, Su L, Zou S, Zhang D, Zhang Y, Yu D, Xu J and Wei Y (2022) Supplementation of serum albumin is associated with improved pulmonary function: NHANES 2013–2014. Front. Physiol. 13:948370. doi: 10.3389/fphys.2022.948370
Received: 23 May 2022; Accepted: 14 September 2022;
Published: 03 October 2022.
Edited by:
Zhanqi Zhao, Furtwangen University, GermanyReviewed by:
Rajeev Yadav, Michigan State University, United StatesMichela Rauseo, University of Foggia, Italy
Copyright © 2022 Hu, Guo, Wang, Zhang, Ye, Su, Zou, Zhang, Zhang, Yu, Xu and Wei. This is an open-access article distributed under the terms of the Creative Commons Attribution License (CC BY). The use, distribution or reproduction in other forums is permitted, provided the original author(s) and the copyright owner(s) are credited and that the original publication in this journal is cited, in accordance with accepted academic practice. No use, distribution or reproduction is permitted which does not comply with these terms.
*Correspondence: Yiping Wei, d2VpeWlwMjAwMEBob3RtYWlsLmNvbQ==
†These authors contributed equally to this work.
 Sheng Hu
 Qiang Guo
 Silin Wang
 Wenxiong Zhang
 Jiayue Ye
 Lang Su
 Sheng Zou
 Deyuan Zhang
 Yiping Wei