- 1Tokyo University of Agriculture and Technology, Graduate School of Bio-Applications and Systems Engineering, Tokyo, Japan
- 2EBA Japan Co., Ltd., Tokyo, Japan
- 3Department of Neurosurgery, Faculty of Medicine, Yamagata University, Yamagata, Japan
We propose a method to perform simultaneous measurements of percutaneous arterial oxygen saturation (SpO2), tissue oxygen saturation (StO2), pulse rate (PR), and respiratory rate (RR) in real-time, using a digital red–green–blue (RGB) camera. Concentrations of oxygenated hemoglobin (CHbO), deoxygenated hemoglobin (CHbR), total hemoglobin (CHbT), and StO2 were estimated from videos of the human face using a method based on a tissue-like light transport model of the skin. The photoplethysmogram (PPG) signals are extracted from the temporal fluctuations in CHbO, CHbR, and CHbT using a finite impulse response (FIR) filter (low and high cut-off frequencies of 0.7 and 3 Hz, respectively). The PR is calculated from the PPG signal for CHbT. The ratio of pulse wave amplitude for CHbO and that for CHbR are associated with the reference value of SpO2 measured by a commercially available pulse oximeter, which provides an empirical formula to estimate SpO2 from videos. The respiration-dependent oscillation in CHbT was extracted from another FIR filter (low and high cut-off frequencies of 0.05 and 0.5 Hz, respectively) and used to calculate the RR. In vivo experiments with human volunteers while varying the fraction of inspired oxygen were performed to evaluate the comparability of the proposed method with commercially available devices. The Bland–Altman analysis showed that the mean bias for PR, RR, SpO2, and StO2 were -1.4 (bpm), -1.2(rpm), 0.5 (%), and -3.0 (%), respectively. The precisions for PR, RR, Sp O 2, and StO 2 were ±3.1 (bpm), ±3.5 (rpm), ±4.3 (%), and ±4.8 (%), respectively. The resulting precision and RMSE for StO2 were pretty close to the clinical accuracy requirement. The accuracy of the RR is considered a little less accurate than clinical requirements. This is the first demonstration of a low-cost RGB camera-based method for contactless simultaneous measurements of the heart rate, percutaneous arterial oxygen saturation, and tissue oxygen saturation in real-time.
Introduction
Quantitative evaluation of biological chromophores is useful for monitoring vital signs and physiological conditions. The major biological chromophores in skin tissues are melanin, oxygenated hemoglobin (HbO), and deoxygenated hemoglobin (HbR), which have unique optical absorption spectra in the visible to near-infrared wavelength range (Tuchin, 2007). When the concentrations of HbO and HbR vary, the corresponding change may be observed on a diffusely reflectance spectrum. Peripheral tissues demand a continuous supply of oxygen, which is delivered through blood circulation. The light absorption spectrum of hemoglobin is changed by the binding of oxygen to hemoglobin (Prahl, 2022). Delivery of oxygen to peripheral tissues can be deduced from the spectral diffuse reflectance by comparing it with the absorption spectra of HbO and HbR. The percentage of HbO in a volume of tissue is evaluated as tissue oxygen saturation (StO2) (Boas and Franceschini, 2011) and can be used as an indicator for monitoring oxygen consumption and hypoperfusion in peripheral tissues and cyanosis. The diffuse reflectance and transmittance spectra of peripheral tissue are changed by the periodic temporal variation in blood volume due to the cardiac pulse traveling through the body. Photoplethysmography (PPG) has been widely used to assess systemic physiological parameters such as heart rate, blood pressure, cardiac output, vascular compliance, and percutaneous oxygen saturation (SpO2) (Kamal et al., 1989; Allen, 2007).
Recent advances in imaging technology and computational methods have enabled imaging-based monitoring of vital signs. Camera-based vital sensing can remove the need for uncomfortable contact sensors. Moreover, they provide spatio-temporal information on the peripheral hemodynamic signals with only one sensor. The use of contactless devices could eliminate the risk of infectious diseases caused by contact sensing. In the last few years, due to the COVID-19 pandemic, it has become increasingly necessary to measure SpO2 and RR with a contactless device. The pulse wave observed in peripheral tissues is the most widely studied vital sign that has been evaluated by camera-based imaging photoplethysmography (iPPG) (Takano and Ohta, 2007; Verkruysse et al., 2008; Poh et al., 2010a; Poh et al., 2010b; Sun et al., 2011). Most RGB camera-based iPPG for PR detection evaluate the periodic changes in raw signals of the red, green, and/or blue color channels, without the quantification of hemoglobin. A wide variety of approaches and applications of iPPG have been proposed and can be viewed in the existing literature (McDuff et al., 2015; Rouast et al., 2018; Chen et al., 2019). Various techniques have been developed to extract a respiratory signal from a video sequence with iPPG (Mirmohamadsadeghi et al., 2016). Several methods have been used for evaluating StO2 in human skin tissue using an RGB camera (Tsumura et al., 2001; O’Doherty et al., 2009; He and Wang, 2020). Researchers have explored different approaches to extract SpO2 from peripheral blood circulation using a camera with visible and near-infrared light (Humphreys et al., 2005; Wieringa et al., 2005; Humphreys et al., 2007; Guazzi et al., 2015; Verkruysse et al., 2017).
Our research group has developed a simple and affordable imaging technique to evaluate transcutaneously multiple physiological parameters by using a digital red–green–blue camera (Nishidate et al., 2008; Nishidate et al., 2011). In this method, the RGB values were converted into tristimulus values in the Commission Internationale de l’Eclairage (CIE) XYZ color space, which is compatible with the common RGB color spaces. Monte Carlo simulation for light transport in biological tissue was then performed to specify the relationship between the XYZ values and the concentrations of oxygenated hemoglobin, deoxygenated hemoglobin, bilirubin, and melanin. The concentrations of total hemoglobin (CHbT) and tissue oxygen saturation (StO2) were also calculated from the estimated concentrations of oxygenated and deoxygenated hemoglobin. Based on this imaging method, a camera-based contactless measurement of PR, StO2, and SpO2 has been demonstrated through experiments with rats (Nishidate et al., 2020).
In this study, we further extend the method to perform simultaneous measurements of SpO2, StO2, pulse rate (PR), and respiratory rate (RR) in real-time. The pulse signals for CHbO, CHbR, and CHbT are extracted by an FIR filter (low and high cut-off frequencies of 0.7 and 3 Hz, respectively). The value of the HR is calculated from the filtered CHbT signal. The ratio of PAHbO and PAHbR is associated with the reference value of SpO2 measured by a commercially available pulse oximeter, which provides an empirical formula to estimate SpO2 from the PPG signals for CHbO and CHbR. The value of the RR is calculated from the filtered signal for CHbT extracted from another FIR filter (low and high cut-off frequencies of 0.05 and 0.5 Hz, respectively). The aim of this study is to evaluate the comparability of the proposed method with commercially available devices for monitoring PR, RR, SpO2, and StO2 in humans.
Materials and methods
Imaging system
A white-light-emitting diode (LED) (LA-HDF158, Hayashi Watch Works Co., Ltd., Tokyo, Japan) illuminated the facial skin of volunteers via a ring-shaped illuminator with a light guide (LGC1-8L1000-R55, Hayashi Watch Works Co., Ltd., Tokyo, Japan). The diffusely reflected light is received by a 24-bit RGB charge-coupled device camera (DFK23U618, Imaging source LLC, Charlotte, NC, United States) via an analyzer and a camera lens (FL-CC3516-2M, Ricoh Company, Ltd., Tokyo, Japan) to acquire an RGB color video at a resolution of 640 × 480 pixels. The ring-shaped polarizer mounted on the ring-shaped illuminator and analyzer was placed in a crossed Nicols alignment to reduce the specular reflection of light from the skin surface. A standard white diffuser with 99% reflectance (SRS-99-020, Labsphere Incorporated, New Hampshire, United States) was used to ensure the white balance of the camera and to correct the spatial nonuniformity of illumination. The facial color video of each volunteer was acquired at a sampling (frame) rate of 15 Hz. The illumination powers at 450, 520, and 632 nm on a subject’s skin were 46.13, 7.87, and 4.17 μW, respectively. The head of the subject was fixed on a head support (SR-HDR, SR Research Ltd., Ottawa, Canada) so that the distance between the face and the camera was constant. The working distance from the illuminator to a subject’s skin was 32 cm whereas that from the camera lens to a subject’s skin was 34 cm.
Estimation of chromophore concentrations
We process the video recorded by the RGB imaging system based on a skin tissue model (Nishidate et al., 2008; Nishidate et al., 2011; Nishidate et al., 2020). First, the responses of the RGB channels in each pixel of the image are transformed into XYZ values with a matrix M1 as
where
We experimentally determined the coefficients αi, βi, and γi, (i = 0, 1, 2, 3) in Eq. 2 based on the measurements of a color checker (Color Checker, X-Rite Incorporated, Michigan, United States) that has 24 color standard patches and is supplied with datasets giving the XYZ values for each patch under specific illuminations and corresponding diffuse reflectance spectra. The calculated values of X, Y, and Z are then transformed into Cm, CHbO, and CHbR by matrix M2. To establish M2, 300 diffuse reflectance spectra in a wavelength range from 400–700 nm at intervals of 10 nm were numerically derived by Monte Carlo simulation (MCS) for light transport (Wang et al., 1995) in skin tissue under various values of Cm, CHbO, and CHbR and, then obtained the corresponding XYZ values. A more detailed description of the skin tissue model including optical parameters can be found elsewhere (Nishidate et al., 2011; Nishidate et al., 2020). Multiple regression analysis with 300 datasets established three multiple regression equations as empirical formulae for Cm, CHbO, and CHbR:
The estimations of Cm, CHbO, and CHbR obtained from the empirical formulae with only the first-order terms of XYZ values have been validated in a prior work (Nishidate et al., 2011; Nishidate et al., 2020). Although we leverage the approach proposed in the prior work (Nishidate et al., 2011; Nishidate et al., 2020) to estimate Cm, CHbO, and CHbR, we newly include the second-order terms of XYZ values into predictor variables in the multiple regression model to improve the accuracies of Cm, CHbO, and CHbR. The multiple regression coefficients ηi, ρi, and σi, (i = 0, 1, 2, ..., 9) in Eqs 3–5 represent the contributions of the XYZ values to Cm, CHbO, CHbR, and Cbil, respectively, and are used as the elements of matrix M2 as
The transformation with M2 from the XYZ values to concentrations of melanin, oxygenated hemoglobin, and deoxygenated hemoglobin is, thus, expressed as
To confirm the effect of the second-order terms of XYZ on the accuracy of the estimated concentrations, we evaluate the coefficient of determination R2 of the regression models. The values of R2 for Cm, CHbO, and CHbR in the regression model with only the first-order terms of XYZ values were 0.88, 0.81, and 0.70, respectively, whereas those in the regression model with the first- and second-order terms were 0.99, 0.98, and 0.93, respectively. Once we establish the matrices M1 and M2, images of Cm, CHbO, and CHbR are reconstructed from a digital RGB image without the MCS. The total hemoglobin concentration is simply calculated as CHbT = CHbO + CHbR and tissue oxygen saturation of hemoglobin as StO2% = (CHbO/CHbT) × 100.
Calculation of percutaneous arterial oxygen saturation, tissue oxygen saturation, heart rate, and respiratory rate
Figure 1 shows a flowchart describing the estimation process using the proposed method. In our previous works (Nishidate et al., 2008; Nishidate et al., 2011; Nishidate et al., 2020), we performed all the analysis and processing to calculate the physiological parameters offline, but in this study, we have newly developed a system that can process and display them online in real-time. Also, we added the calculation of RR to the system developed in this study although in the previous study (Nishidate et al., 2020) we did not consider the RR. The PPG signals for CHbO, CHbR, and CHbT are extracted by an FIR filter (low and high cut-off frequencies of 0.75 and 3 Hz, respectively). The value of the PR is calculated from the filtered CHbT signal. The value of the RR is calculated from the filtered signal for CHbT extracted from another FIR filter (low and high cut-off frequencies of 0.05 and 0.5 Hz, respectively). We assume that the pulse wave amplitude for CHbO (PAHbO) and for CHbR (PAHbR) is decreased and increased as SpO2 is decreased. The ratio of PAHbO and PAHbR is calculated as
The value of ϕ is associated with the reference value of SpO2 measured by a commercially available pulse oximeter, which provides an empirical formula to estimate SpO2 from the PPG signals for CHbO and CHbR. Figure 2 shows the dependence of SpO2 measured by the pulse oximeter on the value of ϕ obtained from the proposed method. Once the value of ϕ reaches 3.0, the curve is almost flat, indicating there is little change in SpO2 above this point. But, at less than 2.0 of ϕ, the curve is very steep, and small changes in ϕ greatly reduce SpO2. We approximated the function SpO2 (ϕ) as an exponential function as
The estimated value of SpO2 was obtained from the value of ϕ extracted from the iPPG signals for CHbO and CHbR through Eq. 8. StO2 is directly calculated from CHbO and CHbR as described in Estimation of chromophore concentrations. We integrated the aforementioned process using Matlab/simlink® and created a real-time monitoring system for PR, RR, SpO2, and StO2.
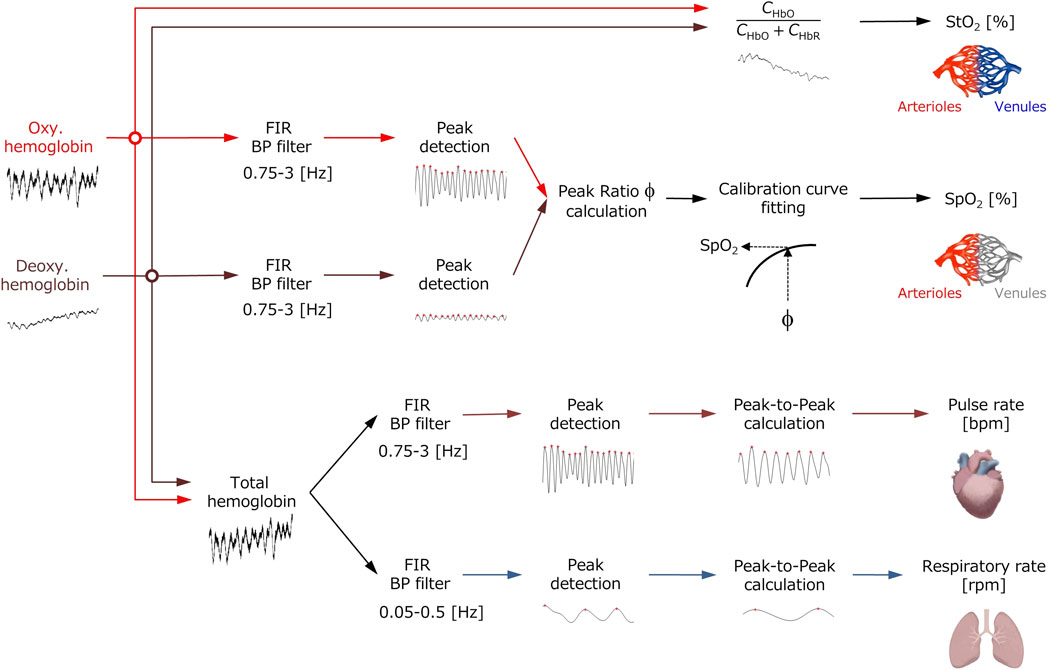
FIGURE 1. Flowchart of the process for extracting the values of pulse rate PR, respiratory rate RR, percutaneous arterial oxygen saturation SpO2, and tissue oxygen saturation StO2 from the time courses of oxygenated hemoglobin concentration CHbO, deoxygenated hemoglobin concentration CHbR, and total hemoglobin concentration CHbT.

FIGURE 2. Dependence of SpO2 measured by the pulse oximeter on the value of ϕ obtained from the proposed method.
Experimental protocols
Figure 3 shows the experimental setup used in this study. Our experiment features 13 healthy volunteers of both genders of different ages (22–45 years). Informed consent was obtained from all participants prior to the data being collected. During the experiment, for 9 min, participants were seated and the temperature of the room was held constant. Each volunteer was exposed to normoxia and hypoxia by inhaling the mixture of O2 and N2, with the fraction of inspired oxygen (FiO2) being 11% for 4 min, for which a breath mask connected with the Douglas bag was used under spontaneous respiration. The value of FiO2 was monitored by using an oxygen gas sensor (OM-25MS10; TAIEI DENKI, Tokyo, Japan). This protocol was approved by the institutional review board of the Tokyo University of Agriculture and Technology (approval numbers 200907-0241 and 210903-0338) and all methods were performed in accordance with the protocol. Simultaneously with optical imaging for skin tissue, SpO2 and PR were measured by a pulse oximeter (OxyTrue® A SMARTsat, bluepoint MEDICAL GmbH&Co.KG; Selmsdorf, Germany) with a finger sensor. The RR was measured by using a respiration wearable transducer (BIONOMADIX®; Biopac Systems Inc., Goleta, CA, United States). StO2 was measured by a laser tissue oxygen monitor (BOM-L1TRSF; OMEGAWAVE, Inc., Tokyo, Japan).
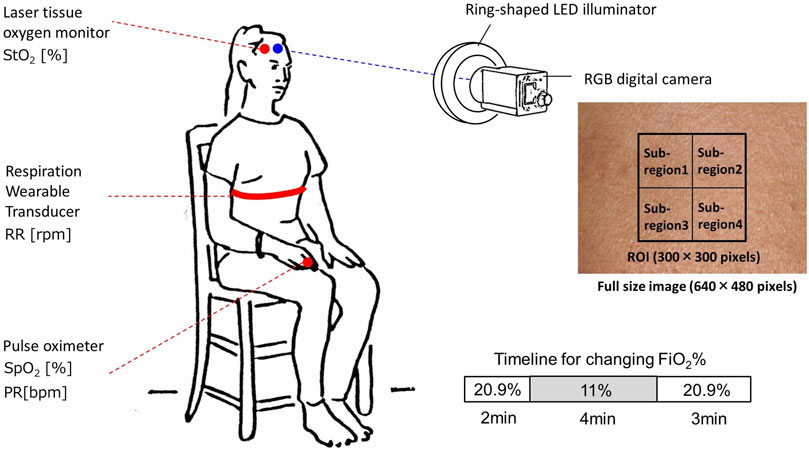
FIGURE 3. Schematic illustration of the experimental setup used for data collection while changing inspired oxygen.
Statistical considerations
We used only one area of the forehead of each volunteer for data analysis of the RGB video. Region of interest (ROI) of 300 × 300 pixels corresponding to the area of 1.76 × 1.76 cm2 was set in each video frame and the mean and the standard deviation (SD) over the ROI were calculated for the analysis of time courses in CHbO, CHbR, CHbT, and StO2. Therefore, data are expressed as mean ± SD. The ROI was divided into four sub-regions to evaluate the spatial variability of each physiological parameter in the ROI as shown in Figure 3. The root mean squared error (RMSE) and Pearson’s correlation coefficients were calculated using the ground truth values measured by the commercially available devices and estimated values by the proposed method. A probability value of p < 0.05 indicates statistical significance. To investigate the agreement between the estimated values obtained by the proposed method and the ground truth values, we performed a Bland–Altman (BA) analysis. In the BA analysis, a BA diagram with the horizontal axis representing the mean of the estimated values obtained by the proposed method and the ground truth values and the vertical axis representing the difference between the estimated values obtained by the proposed method and the ground truth values is used to graphically represent the data, displaying mean bias, precision (mean bias±SD), and limits of agreement (mean bias±2SD).
Results and discussion
Figure 4 compares the typical time courses of (a) PR, (b) RR, (c) SpO2, and (d) StO2 between the estimated values by the proposed method and the ground truth values measured by the commercially available devices obtained from a volunteer while changing FiO2. The estimated values of SpO2 and StO2 gradually decreased after the onset of hypoxia and fell to approximately 87 and 77%, respectively. After the end of hypoxia, SpO2 and StO2 returned to their normal levels. Time courses of SpO2 and StO2 while changing FiO2 were consistent with well-known physiological responses to changes in FiO2. The estimated value of the PR increased during hypoxia, which was indicative of compensating for hypoxia. The estimated value of the RR was slightly decreased during hypoxia, which is probably due to the decrease in the respiratory rate caused by an increase in tidal volume. Overall trends in PR, RR, SpO2, and StO2 estimated by the proposed method coincide with those measured by the commercially available devices.
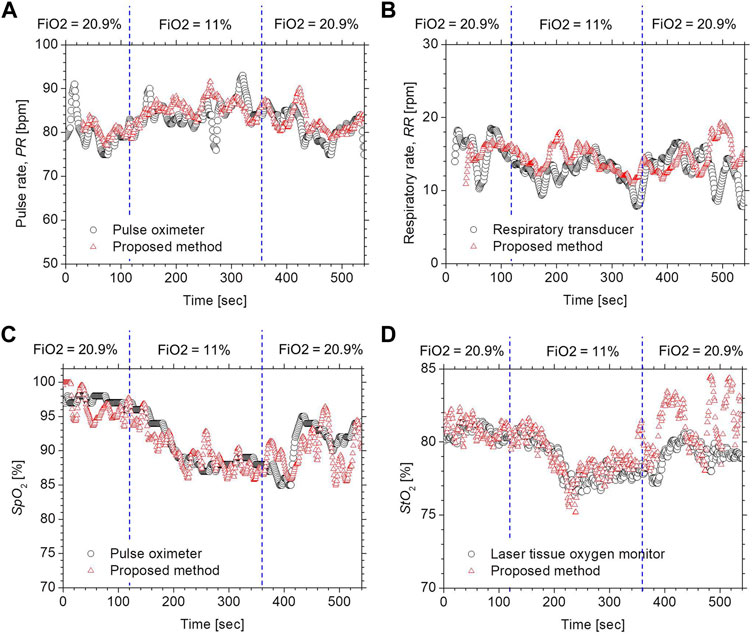
FIGURE 4. Typical time courses of (A) PR, (B) RR, (C) SpO2, and (D) StO2 while changing inspired oxygen. The black solid line and red solid line in each figure represent the measured value by a commercially available device and the estimated value obtained by the proposed method.
Figure 5 shows scatter plots comparing the estimated values by the proposed method with the ground truth values measured by commercially available devices for (a) PR, (b) RR, (c) SpO2, and (d) StO2. The correlation coefficients for PR and SpO2 were 0.96 (p < 0.0001) and 0.76 (p < 0.0001), respectively, indicating that those physiological parameters obtained by the proposed method are well-correlated with the measurements of existing devices. StO2 showed a moderate correlation between the two methods with a correlation coefficient of 0.46 (p < 0.0001). The correlation coefficient for StO2 was 0.46 (p < 0.0001), indicating that the measurements obtained by the proposed method were moderately correlated with those by the commercially available laser tissue oxygen monitor. On the other hand, the RR showed a low correlation between the two methods with a correlation coefficient of 0.22 (p < 0.0001).
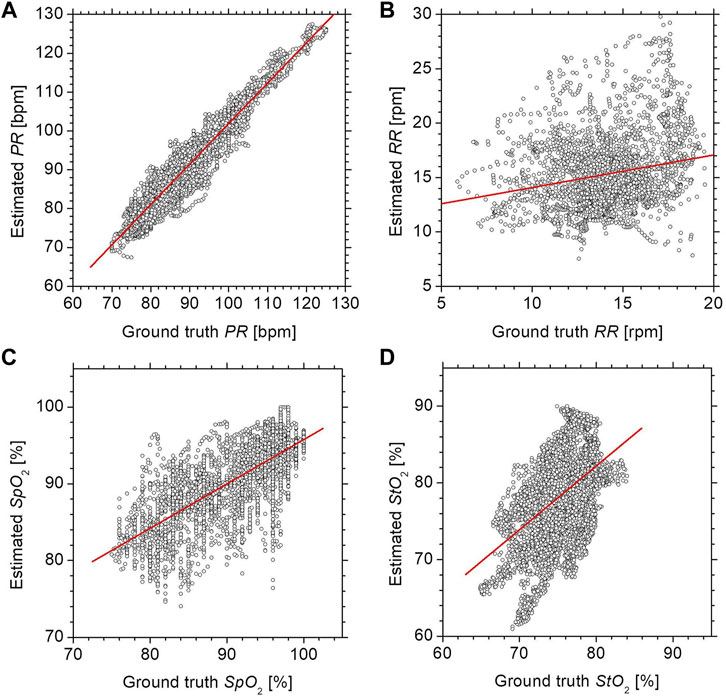
FIGURE 5. Scatter plots comparing the estimated values by the proposed method with the ground truth values measured by commercially available devices for (A) PR, (B) RR, (C) SpO2, and (D) StO2.
Figure 6 shows Bland–Altman plots for (a) PR, (b) RR, (c) SpO2, and (d) StO2. In Figure 6, the black solid line represents the mean bias (defined as the mean difference in measurements between the proposed method and commercially available devices), black dotted lines represent the mean difference ± precision (mean difference ±SD), and the dotted lines represent the accepted limits of agreement (mean difference ± 2SD). The values of mean bias for PR and SpO2 were -1.4 (bpm) and 0.5 (%), respectively. Limits of agreement ranged from -7.7–4.8 (bpm) and -8.1–9.1 (%) for PR and SpO2, respectively. The resulting precisions for PR and SpO2 were ±3.1 (bpm) and ±4.3 (%), respectively, whereas the RMSE for PR and SpO2 were 3.5 (%) and 4.3 (%), respectively. HR measurements were considered accurate if the mean absolute difference was within either ±10% or ±5 bpm (ANSI/AAMI, 2002) while SpO2 measurements were considered accurate if the mean RMSE was ≤3.0% (Center for Devices and Radiological Health Food and Drug Administration, 2013). The accuracy of PR and SpO2 is comparable with that required for the pulse oximeter devices. In contrast, the values of mean bias for RR and StO2 were -1.2 (rpm) and -3.0 (%), respectively. Limits of agreement ranged from -8.2–5.7 (rpm) and -12.6–6.6 (%) for RR and StO2, respectively. The resulting precisions for RR and StO2 were ±3.5 (rpm) and ±4.8 (%), respectively, whereas the RMSE for RR and StO2 were 3.7 (%) and 5.7 (%), respectively. The accuracy of the RR is considered a little less accurate than clinical requirements.
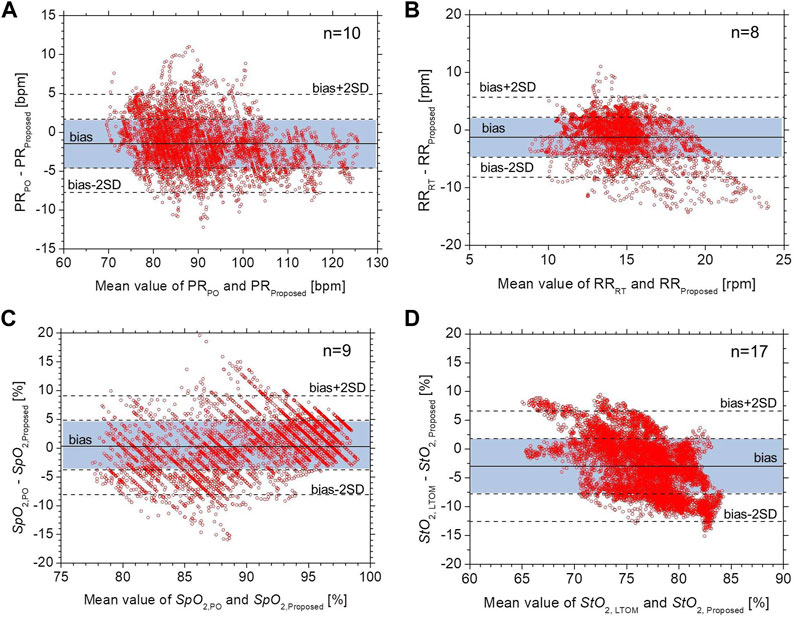
FIGURE 6. Bland–Altman plots for (A) PR, (B) RR, (C) SpO2, and (D) StO2. The black solid line represents the mean bias, black dotted lines represent the mean difference ± precision, and the dotted lines represent the accepted limits of agreement.
Our results suggest that the proposed RGB camera-based contactless method could provide equivalent precisions in PR and SpO2 to an existing pulse oximeter. However, the calculation of SpO2 depends on the optical path length difference between different wavelengths. Regular pulse oximeters with transillumination work due to the transmitted light from a finger being less variable than the diffusely reflected light in terms of wavelengths’ dependence on the optical path length. This could be a cause of deviations in SpO2 between the pulse oximeter and the proposed method as shown in Figure 5.
The resulting precision and RMSE for StO2 were pretty close to the clinical accuracy requirement. One possible explanation for the deviations in StO2 between the two instruments shown in Figure 5 may be because those are continuous wave instruments. The calculation of StO2 in the proposed method is an approximation and will probably be spatially variable across the ROI. We evaluated the spatial variability of each physiological parameter in the ROI. Figure 7 shows the typical time courses of the mean ± standard deviation of (a) PR, (b) RR, (c) SpO2, and (d) StO2 over the four sub-regions of ROI obtained from a subject. The average values of the standard deviation over the period for PR, RR, SpO2, and StO2 were 1.77 bpm, 0.98 rpm, 0.81%, and 0.75%, respectively. Moderate correlation with the existing device for StO2 may also be due to the difference in the probing depth between the proposed method and the laser tissue oxygen monitor. The laser tissue oxygen monitor used in this study calculates the concentrations of oxygenated hemoglobin and deoxygenated hemoglobin from measurements of spatially resolved diffuse reflectance at 635, 655, and 690 nm, and its probing depth is approximately 3 mm when the source-detector separation is 3 mm. The average probing depth of the proposed method in which the responses of red, green, and blue channels were used is expected to be smaller than that of the laser tissue oxygen monitor. This may contribute to the discrepancy in StO2. The calculation of StO2 in the laser tissue oxygen monitor used as the ground truth is also an approximation and will probably be spatially variable. Generally speaking, a continuous wave instrument based on diffuse reflectance without spatial-resolved and/or frequency domain measurements obtains relative changes in absorption but not absolute value as it does not work for measuring light scattering coefficients. However, the possibility of relative measurements of StO2 could still prove valuable.
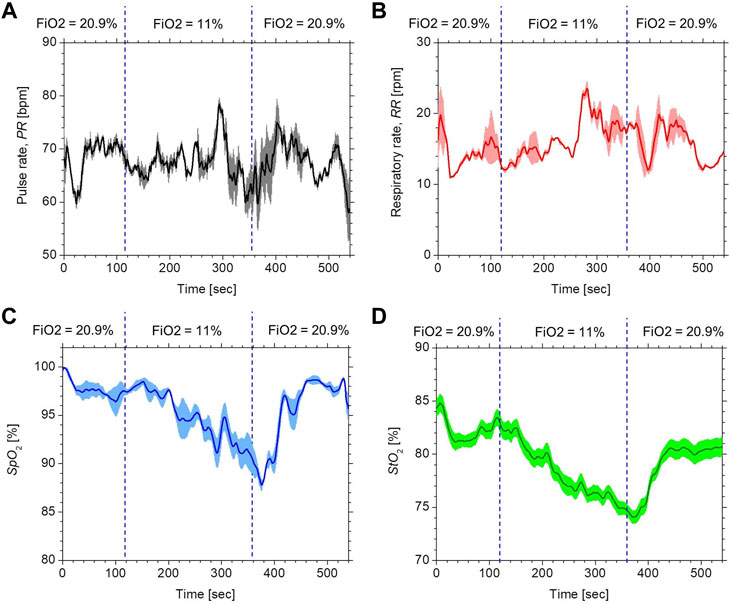
FIGURE 7. Typical time courses of the mean (bold line) ± standard deviation (shaded area) for (A) PR, (B) RR, (C) SpO2, and (D) StO2 over the four sub-regions of ROI obtained from a subject.
We used the skin tissue Monte Carlo simulation model with only one typical light scattering spectrum and a typical thickness for the epidermis and the dermis to establish the empirical formulae for estimating chromophore concentrations. However, the actual skin thickness and light scattering spectrum could vary with subjects and parts of the body. Changes in the light scattering properties of tissue and the thickness of each layer will impact the regression equations, and thus, the calculation of StO2. The skin tissue model with variations in the scattering spectrum and the thickness of each layer could improve the accuracy of StO2. Our results revealed that the current system needs to improve the accuracy of RR measurements. Using slow fluctuation in peripheral blood volume to measure the respiratory rate remains challenging. Our results of the RR showed the low precision and correlation coefficient between the proposed method and the respiration wearable transducer. Respiration-dependent fluctuation in CHbT was weak compared with the plethysmogram for CHbT. This may have contributed to the lack of accuracy in peak detection for calculating RR.
There are several smartphone applications for monitoring both PR and SpO2 such as Oximeter (Ox, digiDoc technologies, Egersund, Norway) and Heart Rate & Pulse Oximeter (Pox, produced by LIJUN LIU). However, those applications are based on contact measurements of diffusely reflected light that require a subject to cover the flash and camera lens with a fingertip. Moreover, the range of SpO2 is 93–100% in each application. As a non-contact device for SpO2, Verkruysse et al. reported a camera-based iPPG technique (Verkruysse et al., 2017). This is the first study that has been able to demonstrate that calibrated non-contact monitoring of SpO2, PR, and RR is possible. This technique is based on multispectral imaging using two tripod-mounted monochrome cameras with spectral bandpass filters with red and infrared (IR) center wavelengths of 675 and 842 nm, respectively, and not an RGB camera-based iPPG. Guazzi et al. developed a non-contact RGB-camera-based monitor method for SpO2 (Guazzi et al., 2015). This method calculates SpO2 and PR by analyzing the time series of raw signals for each of the R, G, and B channels. However, it cannot monitor StO2 since CHbO and CHbR are not estimated from the RGB values in this model. Therefore, our proposed method is unique and novel, different from any other smartphone applications or iPPG techniques mentioned previously.
In this study, we set the frequency bands of FIR filters as 0.75–3 Hz for the PPG signals and 0.05–0.5 Hz for the respiratory signal. These ranges correspond to pulse rates of 45–180 bpm and respiratory rates of 3–30 rpm. However, they do not necessarily include physiological extremes relevant in a medical setting. For example, in patients with atrioventricular block, the pulse rate could be ranged from 30–40 bpm. To detect such a slow heart rate, the low cut-off frequency of the FIR filter for the PPG signal should be set to 0.5 or less. In such a case, the frequency bands for the pulse rate and respiratory rate will partially overlap. As a result, it will be difficult to distinguish between pulse and respiratory signals. We took the variation in melanin concentration into account for the Monte Carlo model to establish the empirical formulae for CHbO and CHbR. However, if the actual melanin concentration is out of a setting range in the Monte Carlo model (e.g., subjects with darker skin tones), the estimation errors in CHbO and CHbR could be increased. Moreover, it will become difficult to detect temporal fluctuations of CHbO, CHbR, and CHbT due to the reduced diffuse reflection caused by the higher melanin concentration. In our experiments, the working distance of the camera, lighting, and body motions were carefully controlled while collecting data. Under real-world situations, the measurement is likely to be more challenging as the conditions could be variable and may not be strictly controlled. Using a real-time face detection and tracking technique with automatic exposure and white balance control in the developed system will be useful to reduce motion artifacts and prevent accuracy deterioration in each vital sign estimation. Although we evaluate peripheral hemodynamics in forehead skin to extract the four vital parameters, our method can be applied to the other parts of the body surface. The accuracy of the measurements of PR, RR, SpO2, and StO2 for different skin regions should be investigated in the future.
Conclusion
In summary, a method to perform simultaneous measurements of percutaneous arterial oxygen saturation, tissue oxygen saturation, pulse rate, and respiratory rate in real-time using an RGB camera was demonstrated in the present study. In vivo experiments with human volunteers while varying the fraction of inspired oxygen were performed to evaluate the comparability of the proposed method with commercially available devices. The results of correlation analysis and Bland–Altman plots showed that the proposed RGB camera-based contactless method could provide equivalent precisions in PR and SpO2 to an existing pulse oximeter. The resulting precision in StO2 was pretty close to the accuracy requirement. The current system needs to improve the accuracy of RR measurement. To the best of our knowledge, this is the first demonstration of simultaneous contactless measurements of pulse rate, percutaneous arterial oxygen saturation, and tissue oxygen saturation in human subjects using a digital RGB camera. The results in this study indicate the potential of this method for remote monitoring multiple physiological parameters and vital signs that enable cost-effective, easy-to-use, contactless, and point-of-care devices.
Data availability statement
The original contributions presented in the study are included in the article/Supplementary Material; further inquiries can be directed to the corresponding author.
Ethics statement
The studies involving human participants were reviewed and approved by the institutional review board of the Tokyo University of Agriculture and Technology. The patients/participants provided their written informed consent to participate in this study.
Author contributions
IN, YT, KO, FA, NN, and YK contributed to the study design. IN, RY, NN, and HS contributed to the experiments, data collection, and data analysis. IN, YT, KO, FA, and YK contributed to the interpretation of data. IN contributed to manuscript writing. IN and NN supervised the project. All authors reviewed the manuscript.
Funding
This study was supported by the Japan Agency for Medical Research and Development (AMED) under Grant Numbers JP20dk0110042 and JP21dk0110042.
Conflict of interest
YT, KO, FA, and NN were employed by the company Eba Japan Co, Ltd.
The remaining authors declare that the research was conducted in the absence of any commercial or financial relationships that could be construed as a potential conflict of interest.
Publisher’s note
All claims expressed in this article are solely those of the authors and do not necessarily represent those of their affiliated organizations, or those of the publisher, the editors, and the reviewers. Any product that may be evaluated in this article, or claim that may be made by its manufacturer, is not guaranteed or endorsed by the publisher.
References
Allen J. (2007). Photoplethysmography and its application in clinical physiological measurement. Physiol. Meas. 28 (3), R1–R39. doi:10.1088/0967-3334/28/3/R01
ANSI/AAMI (2002). Cardiac monitors, heart rate meters, and alarms. Arlington: American National Standards Institute Inc.
Boas D. A., Franceschini M. A. (2011). Haemoglobin oxygen saturation as a biomarker: The problem and a solution. Philos. Trans. A Math. Phys. Eng. Sci. 369, 4407–4424. doi:10.1098/rsta.2011.0250
Center for Devices and Radiological Health Food and Drug Administration (2013). Pulse oximeters - premarket notification submissions [510(k)s]: Guidance for industry and Food and Drug administration staff. Available at: https://www.fda.gov/regulatory-information/search-fda-guidance-documents/pulse-oximeters-premarket-notification-submissions-510ks-guidance-industry-and-food-and-drug (Accessed March 04 2013).
Chen X., Cheng J., Song R., Liu Y., Ward R., Wang Z. J. (2019). Video-based heart rate measurement:recent advances and future prospects. IEEE Trans. Instrum. Meas. 68 (10), 3600–3615. doi:10.1109/tim.2018.2879706
Guazzi A. R., Villarroel M., Jorge J., Daly J., Frise M. C., Robbins P. A., et al. (2015). Non-contact measurement of oxygen saturation with an RGB camera. Biomed. Opt. Express 6 (9), 3320–3338. doi:10.1364/BOE.6.003320
He Q., Wang R. (2020). Hyperspectral imaging enabled by an unmodified smartphone for analyzing skin morphological features and monitoring hemodynamics. Biomed. Opt. Express 11, 895–910. doi:10.1364/BOE.378470
Humphreys K., Ward T., Markham C. (2005). “A CMOS camera-based pulse oximetry imaging system,” in Proceedings of the IEEE Engineering in Medicine and Biology 27th Annual Conference, Shanghai, China: IEEE, 17-18 Jan. 2006, 3494–3497.
Humphreys K., Ward T., Markham C. (2007). Noncontact simultaneous dual wavelength photoplethysmography: A further step toward noncontact pulse oximetry. Rev. Sci. Instrum. 78 (4), 044304. doi:10.1063/1.2724789
Kamal A. A., Harness J. B., Irving G., Mearns A. J. (1989). Skin photoplethysmography–a review. Comput. Methods Programs Biomed. 28 (4), 257–269. doi:10.1016/0169-2607(89)90159-4
McDuff D. J., Estepp J. R., Piasecki A. M., Blackford E. B. (2015). A survey of remote optical photoplethysmographic imaging methods. Annu. Int. Conf. IEEE Eng. Med. Biol. Soc. 2015, 6398–6404. doi:10.1109/EMBC.2015.7319857
Mirmohamadsadeghi L., Fallet S., Moser V., Braun F., Vesin J. (2016). “Real-time respiratory rate estimation using imaging photoplethysmography inter-beat intervals,” in Proceedings of the Computing in Cardiology Conference, Vancouver, BC, Canada: IEEE, 11-14 September 2016, 861–864. CinC.
Nishidate I., Minakawa M., McDuff D., Wares M. A., Nakano K., Haneishi H., et al. (2020). Simple and affordable imaging of multiple physiological parameters with RGB camera-based diffuse reflectance spectroscopy. Biomed. Opt. Express 11 (2), 1073–1091. doi:10.1364/BOE.382270
Nishidate I., Sasaoka K., Yuasa T., Niizeki K., Maeda T., Aizu Y. (2008). Visualizing of skin chromophore concentrations by use of RGB images. Opt. Lett. 33 (19), 2263–2265. doi:10.1364/ol.33.002263
Nishidate I., Tanaka N., Kawase T., Maeda T., Yuasa T., Aizu Y., et al. (2011). Noninvasive imaging of human skin hemodynamics using a digital red-green-blue camera. J. Biomed. Opt. 16 (8), 086012. doi:10.1117/1.3613929
O’Doherty J., McNamara P., Clancy N. T., Enfield J. G., Leahy M. J. (2009). Comparison of instruments for investigation ofmicrocirculatory blood flow and red blood cell concentration. J. Biomed. Opt. 14, 034025. doi:10.1117/1.3149863
Poh M-Z., McDuff D. J., Picard R. W. (2010). Advancements in noncontact, multiparameter physiological measurements using a webcam. IEEE Trans. Biomed. Eng. 58 (1), 7–11. doi:10.1109/TBME.2010.2086456
Poh M. Z., McDuff D. J., Picard R. W. (2010). Non-contact, automated cardiac pulse measurements using video imaging and blind source separation. Opt. Express 18 (10), 10762–10774. doi:10.1364/OE.18.010762
Prahl S. A. (2022). Tabulated molar extinction coefficient for hemoglobin in water. Available at: http://omlc.ogi.edu/spectra/hemoglobin/summary.html (Accessed April 30, 2022).
Rouast P. V., Adam M. T. P., Chiong R. R., Cornforth D., Lux E. (2018). Remote heart rate measurement using low-cost RGB face video: A technical literature review. Front. Comput. Sci. 12, 12858–12872. doi:10.1007/s11704-016-6243-6
Sun Y., Hu S., Azorin-Peris V., Greenwald S., Chambers J., Zhu Y. (2011). Motion-compensated noncontact imaging photoplethysmography to monitor cardiorespiratory status during exercise. J. Biomed. Opt. 16 (7), 077010. doi:10.1117/1.3602852
Takano C., Ohta Y. (2007). Heart rate measurement based on a timelapse image. Med. Eng. Phys. 29 (8), 853–857. doi:10.1016/j.medengphy.2006.09.006
Tsumura N., Miyake Y., Imai F. H. (2001). “Medical vision: Measurement of skin absolute spectralreflectance image and the application to component analysis,” in Proceedings of the Third International Conference on Multispectral Color Science, Joensuu, Finland: IEEE, June 18-20, 2001, 25–28.
Tuchin V. (2007). Tissue optics: Light scattering methods and instruments for medical diagnosis. 2nd ed. Washington, United States: SPIE.
Verkruysse W., Bartula M., Bresch E., Rocque M., Meftah M., Kirenko I. (2017). Calibration of contactless pulse oximetry. Anesth. Analg. 124 (1), 136–145. doi:10.1213/ANE.0000000000001381
Verkruysse W., Svaasand L. O., Nelson J. S. (2008). Remote plethysmographic imaging using ambient light. Opt. Express 16 (26), 21434–21445. doi:10.1364/oe.16.021434
Wang L., Jacques S. L., Zheng L. (1995). Mcml: Monte Carlo modeling of light transport in multi-layered tissues. Comput. Methods Programs Biomed. 47, 131–146. doi:10.1016/0169-2607(95)01640-f
Keywords: percutaneous arterial oxygen saturation, tissue oxygen saturation, pulse rate, respiratory rate, RGB camera
Citation: Nishidate I, Yasui R, Nagao N, Suzuki H, Takara Y, Ohashi K, Ando F, Noro N and Kokubo Y (2022) RGB camera-based simultaneous measurements of percutaneous arterial oxygen saturation, tissue oxygen saturation, pulse rate, and respiratory rate. Front. Physiol. 13:933397. doi: 10.3389/fphys.2022.933397
Received: 04 May 2022; Accepted: 25 August 2022;
Published: 19 September 2022.
Edited by:
J. Chris McKnight, University of St Andrews, United KingdomReviewed by:
Gemma Bale, University of Cambridge, United KingdomGraham Spicer, Northwestern University, United States
Copyright © 2022 Nishidate, Yasui, Nagao, Suzuki, Takara, Ohashi, Ando, Noro and Kokubo. This is an open-access article distributed under the terms of the Creative Commons Attribution License (CC BY). The use, distribution or reproduction in other forums is permitted, provided the original author(s) and the copyright owner(s) are credited and that the original publication in this journal is cited, in accordance with accepted academic practice. No use, distribution or reproduction is permitted which does not comply with these terms.
*Correspondence: Izumi Nishidate, aW5pc2hpQGNjLnR1YXQuYWMuanA=
 Izumi Nishidate
 Riku Yasui1