 Min Zhuang
 Mengdie Jin3†
 Linqian Lu
 Barbara E. Ainsworth
 Yu Liu
 Nan Chen
- 1Key Laboratory of Exercise and Health Sciences of Ministry of Education, Shanghai University of Sport, Shanghai, China
- 2Department of Rehabilitation, Xinhua Hospital Chongming Branch, Shanghai, China
- 3Department of Rehabilitation, Xinhua Hospital Affiliated to Shanghai Jiaotong University School of Medicine, Shanghai, China
- 4College of Health Solutions, Arizona State University, Phoenix, AZ, United States
- 5School of Kinesiology, Shanghai University of Sport, Shanghai, China
Objective: This systematic review and meta-analysis assessed the effects of three modes of physical activity (PA) (aerobic training [AT], resistance training [RT], and aerobic combined with resistance training [MT]) on body composition (body weight [BW], body mass index [BMI] and percentage of body fat [BF%]), muscle mass (skeletal muscle mass [SM], appendicular skeletal muscle mass [ASM] and appendicular skeletal muscle mass index [ASMI]), muscle strength (handgrip strength [HG] and knee extension strength [KES]), physical performance (gait speed [GS]) and hematological parameters (inflammatory markers, insulin-like growth factor 1 [IGF-1] and lipid profiles) in older people with sarcopenic obesity (SO).
Methods: We searched all studies for PA effects in older people with SO from six databases published from January 2010 to November 2021. Two researchers independently screened studies, extracted data according to inclusion and exclusion criteria, and assessed the quality of included studies. Pooled analyses for pre-and post- outcome measures were performed by Review Manager 5.4. We calculated a meta-analysis with a 95% confidence interval (95% CI) and the standardized mean differences (SMD).
Results: 12 studies were analyzed. There were 614 older people (84.9% female) with SO, aged 58.4 to 88.4 years. Compared with a no-PA control group, AT decreased BW (SMD = −0.64, 95% CI: −1.13 to −0.16, p = 0.009, I2 = 0%) and BMI (SMD = −0.69, 95% CI: −1.18 to −0.21, p = 0.005, I2 = 0%); RT improved BF% (SMD = −0.43, 95% CI: −0.63 to −0.22, p < 0.0001, I2 = 38%), ASMI (SMD = 0.72, 95% CI: 0.24 to 1.21, p = 0.004, I2 = 0%), ASM (SMD = −0.94, 95% CI: −1.46 to −0.42, p = 0.0004), HG (SMD = 1.06, 95% CI: 0.22 to 1.91, p = 0.01, I2 = 90%) and KES (SMD = 1.06, 95% CI: 0.73 to 1.39, p < 0.00001, I2 = 14%); MT improved BMI (SMD = −0.77, 95% CI: −1.26 to −0.28, p = 0.002, I2 = 0%), BF% (SMD = −0.54, 95% CI: −0.83 to −0.25, p = 0.0003, I2 = 0%), ASMI (SMD = 0.70, 95% CI: 0.22 to 1.19, p = 0.005, I2 = 0%) and GS (SMD = 0.71, 95% CI: 0.23 to 1.18, p = 0.004, I2 = 37%). PA increased IGF-1 (SMD = 0.38, 95% CI: 0.11 to 0.66, p = 0.006, I2 = 0%), but had no effect on inflammatory markers and lipid profiles.
Conclusion: PA is an effective treatment to improve body composition, muscle mass, muscle strength, physical performance, and IGF-1 in older people with SO.
Introduction
Sarcopenic obesity (SO) refers to the combination of sarcopenia and obesity. Sarcopenia is an age-related decrease of skeletal muscle mass with a decline in muscle strength and reduced physical performance (Chen et al., 2020). Obesity is a risk factor for insulin resistance, dyslipidemia, type 2 diabetes mellitus, and cardiovascular disease (Rosen and Spiegelman, 2006). People with SO are less physically active, intake more calories, and have a higher risk of diabetes or dyslipidemia than nonobese people with and without sarcopenia (Batsis and Villareal, 2018; Lim et al., 2018). A meta-analysis of SO adults showed a 24% increased risk of all-cause mortality, especially in men, compared with adults without SO (Tian and Xu, 2016). Data from World Population Prospects: the 2019 Revision (United Nations, 2019) shows that by 2050, one in six people will be 65 years or older globally, and one in four people in Europe and North America will be 65 years or older. Currently, the global prevalence of SO is 11% in nursing homes, communities, and hospitals (Gao et al., 2021). With the aging population increasing, SO may affect 100–200 million people worldwide in the next 35 years. As SO increases the risk of hospitalization, it also can increase the economic burden on individuals and nations (Janssen et al., 2004; Withrow and Alter, 2011; Lee et al., 2016; Rossi et al., 2017). Accordingly, researchers, clinicians, and policymakers should be aware of SO, its complications, and its impact on society.
Inflammatory markers play a vital role in the progression of SO (Schrager et al., 2007). Obesity causes a chronic inflammatory state, which leads to an increase in inflammatory markers, such as interleukin-6 (IL-6) and C-reactive protein (CRP) (Sáinz et al., 2010). Elevated IL-6 (>5 Pg/ml) and elevated CRP (>6.1 μg/ml) increase the risk of losing >40% muscle strength by 2 to 3 times more than people with normal IL-6 and CRP levels (Schaap et al., 2006). Upregulation of the inflammatory marker IL-6 leads to a decrease in anabolic actions of insulin-like growth factor 1 (IGF-1) (Batsis and Villareal, 2018), which weakens the maintenance and growth of skeletal muscle (Mak et al., 2011). A low level of IGF-1 also increases the risk of hyperlipidemia (García-Fernández et al., 2008), which increases the risk of cardiovascular disease (CVD) (Nelson, 2013). In people with SO, lipid levels for triglyceride (TG) and total cholesterol (TC) are higher, and high-density lipoprotein (HDL) is lower compared to people without SO (Habib et al., 2020). Increasing IGF-1, decreasing inflammatory markers, and normalizing lipid levels may improve muscle mass and strength and reduce CVD risk in people with SO (Batsis and Villareal, 2018).
At present, there is still a lack of specific pharmacological interventions for SO (Evans et al., 2021). Non-pharmacological interventions are the most commonly used method for the treatment of SO. Many studies have indicated that physical activity (PA) is one of the most effective non-pharmacological interventions for the management of SO (Theodorakopoulos et al., 2017; Hita-Contreras et al., 2018; Hsu et al., 2019). Systematic reviews and meta-analyses in older people with SO demonstrate that PA improves body composition, muscle mass, strength, and physical performance. Changes have been observed in the percentage of body fat [BF%] (Hita-Contreras et al., 2018; Hsu et al., 2019), body weight [BW] (Hsu et al., 2019), body mass index [BMI] (Hsu et al., 2019), appendicular skeletal muscle mass [ASM] (Hita-Contreras et al., 2018), handgrip strength [HG] (Theodorakopoulos et al., 2017; Hita-Contreras et al., 2018; Hsu et al., 2019) and gait speed [GS] (Theodorakopoulos et al., 2017; Hita-Contreras et al., 2018; Hsu et al., 2019). Moreover, compared with other non-pharmacological interventions (e.g., electrical acupuncture, nutritional supplements, and dietary management), older people with SO benefit from PA in reducing BF% and increasing HG and GS (Yin et al., 2020). Studies also have shown that PA in older people with SO can decrease IL-6 (Wang et al., 2019), increase IGF-1 (Chen et al., 2017; Wang et al., 2019), and improve TC and LDL lipid profiles (Park et al., 2017), reducing inflammation and the risk of CVD.
There are some limitations to meta-analysis studies on PA and SO. Firstly, inconsistent diagnostic criteria, measurement indicators, and assessment methods of SO create high heterogeneity in the meta-analysis of SO (Martínez-Amat et al., 2018; Hsu et al., 2019; Yin et al., 2020). For example, the diagnostic criteria used to diagnose sarcopenia differ among the European Working Group on Sarcopenia (EWGSOP-2010) (Liao et al., 2017), the Foundation for the National Institutes of Health (FNIH) Sarcopenia Project (Wang et al., 2019) and others (Kim et al., 2016; Vasconcelos et al., 2016; Chen et al., 2017; Huang et al., 2017; Park et al., 2017; Liao et al., 2018). The cut-off points for measurement indicators differ for ASM, HG, and GS. Diagnosis of obesity status also was inconsistent. For example, studies used different methods to measure body fat [i.e., bioelectrical impedance analysis (BIA) and dual-energy X-ray absorptiometry (DXA)]. They also based the diagnosis of obesity on different measures of body fat [e.g., BF%, BMI, visceral fat area (VFA)]. Due to different diagnostic criteria, assessment methods, and cut-off points of sarcopenia and obesity, there are differences in the identification of SO in the included articles (Kim et al., 2016; Vasconcelos et al., 2016; Chen et al., 2017; Huang et al., 2017; Liao et al., 2017; Park et al., 2017; Chiu et al., 2018; Liao et al., 2018; Wang et al., 2019; Li et al., 2020; Banitalebi et al., 2021; Lee et al., 2021). Secondly, PA mainly included aerobic training (AT), resistance training (RT), and mixed training (MT), of which the most used is aerobic combined with resistance training. There is currently a lack of studies on the effects of AT on people with SO. In people without SO, regular AT prevents loss of skeletal muscle mass and strength (Gielen et al., 2003), increases maximal oxygen uptake (VO2max) (Katzmarzyk et al., 2001), decreases body fat mass (Katzmarzyk et al., 2001), improves physical performance (Bull et al., 2020), and reduces the risk of CVD (Fiuza-Luces et al., 2018). The International Exercise Recommendations in Older Adults (ICFSR): Expert Consensus Guidelines 2021 (Izquierdo et al., 2021) recommends that older people perform AT 3–7 times per week at 55%–70% of heart rate reserve. In the current meta-analysis of SO, only Hsu et al. (Hsu et al., 2019) investigated the effects of AT on older people with SO. Although they indicated that older people with SO could get benefits from RT and MT, there was not enough evidence showing AT’s effects on older people with SO. Many studies have proved the benefits of AT for healthy older people or older people with chronic diseases (Chodzko-Zajko et al., 2009; Bull et al., 2020; Izquierdo et al., 2021); however, there is insufficient evidence if AT is beneficial in the progression of SO. Thirdly, IGF-1 plays a vital role in the mechanism of SO and is closely related to CVD. Currently, among the meta-analyses of SO, only Hsu et al. (Hsu et al., 2019) explored the effects of different forms of PA on hematological parameters (IL-6, CRP, TC, TG, HDL, and LDL) in older people with SO. There is no meta-analysis of PA and IGF-1. Finally, up to now, few studies have investigated the effects of different modes of PA in older people with SO. It is necessary to integrate more individual studies in a meta-analysis to explore the effects of different modes of PA on the progression of SO to provide an effective intervention for the prevention and treatment of SO.
To the best of our knowledge, this is the first meta-analysis to comprehensively explore the effects of different modes of PA on physical fitness and performance outcomes in older people with SO. This meta-analysis aims to investigate the effects of three types of PA (AT, RT, and MT) on measures of body composition, muscle mass, muscle strength, physical performance, and hematological parameters in older people with SO.
Material and methods
Search strategy
This meta-analysis followed the Preferred Reporting Items for Systematic Reviews and Meta-Analysis (PRISMA) guidelines (Vrabel, 2015) and is registered in the PROSPERO (CRD42022301883). We searched the following six databases: PubMed, Embase, the Cochrane Library Database, Web of Science, the China National Knowledge Infrastructure (CNKI), and Wanfang Data for studies published from January 2010 to November 2021. The Mesh terms and the synonyms were used as follows: “aging,” “aged,” “aged, 80 and over,” “cognitive aging,” “frail elderly,” “sarcopenia,” “sarcopenias,” “sarcopenic,” “muscle loss,” “muscle wasting,” “muscular atrophy,” “age-related muscle loss,” “muscle insufficiency,” “muscle depletion,” “skeletal muscle depletion,” “obesity,” “obese,” “overweight,” “sarcopenic obesity,” “exercise,” “motor activity,” “movement,” “movements,” “kinesiotherapy,” “physiotherapy,” “exercise therapy,” “training,” “physical therapy,” “physical therapy modalities,” “endurance training” and “resistance training.” All search strategies are shown in Supplementary Table S1.
Inclusion criteria
The inclusion criteria were as follows:
1) All subjects met the definition of sarcopenic obesity (according to a working group or clinical research);
2) Aged 60 and above;
3) Without diagnosed chronic diseases, such as cardiovascular disease, metabolic disease, chronic obstructive pulmonary disease (COPD), cancer, and stroke;
4) Had at least one PA intervention group;
5) the control group did not receive any PA intervention but could receive education intervention.
Exclusion criteria
The exclusion criteria were as follows:
1) The full text was unavailable;
2) Not in English or Chinese;
3) The studies failed to provide extractable data;
4) the intervention group received intervention combined with nutritional supplementation.
Data extraction
According to the inclusion and exclusion criteria, two authors (MZ and MJ) independently screened the title and abstract of all studies. Then the two authors (MZ and MJ) screened the remaining full text according to inclusion and exclusion criteria. If there were disagreements about the studies, the third author (NC) participated in the discussion to resolve it. The two authors (MZ and MJ) recorded the following information in Microsoft Excel 2019: 1) the study’s first author and year of publication; 2) the characteristics of the subjects, for example, sample size, gender, and age; 3) the diagnostic criteria for sarcopenic obesity; 4) the characteristics of the intervention group, such as mode, training movement, intensity, and duration days/weeks; 4) control group intervention; 5) outcomes (e.g., body composition, muscle mass, muscle strength, physical performance, and hematological parameters). One author (MZ) was responsible for extracting the data, while the other (MJ) was responsible for checking the accuracy of the data. If the study was a multi-arm intervention, the two authors (MZ and MJ) extracted only data related to the exercise and the control group. When raw data was missing, we contacted the authors by email to request the data. We excluded the article data if the author failed to reply or would not share the raw data.
Quality assessment
The two authors (MZ and MJ) assessed the methodological quality of each included study independently, using the Physiotherapy Evidence Database (PEDro) Scale (Maher et al., 2003), which assesses the following 11 categories: 1) eligibility criteria and source; 2) random allocation; 3) concealed allocation; 4) baseline comparability; 5) blinding of subjects; 6) blinding of therapists; 7) blinding of assessors; 8) adequate follow-up (>85%); 9) intention-to-treat analysis; 10) between-group statistical comparisons; 11) reporting of point measures and measures of variability.
If the item met the criteria, it was rated one point, and if it did not meet the criteria, it was rated 0 points. An overall score of less than four points was considered poor, and 9–10 was considered excellent. Two authors (MZ and MJ) evaluated each study independently, and if there were disagreements, the third author (YL) participated in the discussion and resolved it.
Outcome variables
Five categories of outcome variables were extracted. Body composition was measured as body weight (BW), body mass index (BMI), and body fat percent (BF%). Muscle mass was measured as appendicular skeletal muscle mass (ASM), skeletal muscle mass (SM), and appendicular skeletal muscle mass index (ASMI). Upper and lower muscle strength was measured as handgrip (HG) and knee extension strength (KES). Physical performance was measured as gait speed (GS). Hematological parameters were measured as Interleukin-6 (IL-6), c-reactive protein (CRP), Insulin-like growth factor 1 (IGF-1), and lipids for serum total cholesterol (TC), triglycerides (TG), high-density lipoprotein (HDL), and low-density lipoprotein (LDL).
Statistical analysis
All data included in the studies were analyzed using Review Manager (RevMan 5.4; Cochrane, Lindon, United Kingdom). We used the I2 statistic to assess the heterogeneity of the outcomes of the studies. When I2 < 50%, we used the fixed-effects model, and when I2 > 50%, we used the random-effects model. We calculated the pooled effect sizes using the inverse variances, the 95% confidence interval (95% CI), and the standardized mean differences (SMD). A p-value < 0.05 was considered statistically significant.
Results
Study selection
Figure 1 illustrates a flow chart of the study selection process and reasons for excluding studies. According to the Mesh and the synonyms published between 1 January 2010, and 30 November 2021, we identified 1712 studies from the databases. After removing 300 duplicates, 1412 studies remained. Screening the title and abstract resulted in the exclusion of 1336 studies. Of the remaining 76 studies, we excluded 64 following a full-text review according to the inclusion and exclusion criteria. The final sample included 12 studies.
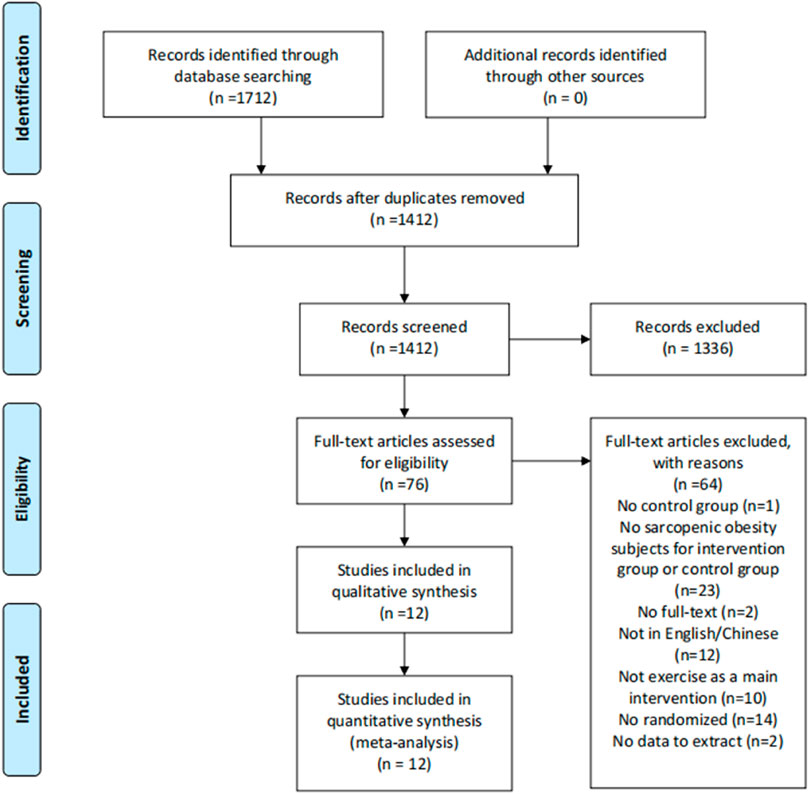
FIGURE 1. Flow of screening and selecting process according to preferred reporting items for systematic reviews and meta-analysis (PRISMA).
Study characteristics
Table 1 summarizes the characteristics, diagnostic criteria for SO, intervention and control group details, and the study outcomes. Subjects included 614 older people with sarcopenic obesity, aged from 58.4 to 88.4 years. Among them, 496 were female (84.93%). Eight studies (Kim et al., 2016; Vasconcelos et al., 2016; Huang et al., 2017; Liao et al., 2017; Park et al., 2017; Liao et al., 2018; Banitalebi et al., 2021; Lee et al., 2021) included women only, and none included men only. Four studies (Chen et al., 2017; Chiu et al., 2018; Wang et al., 2019; Li et al., 2020) included women and men. Diagnostic criteria for sarcopenia and obesity, the intervention and control group methods, and outcomes varied among the studies.
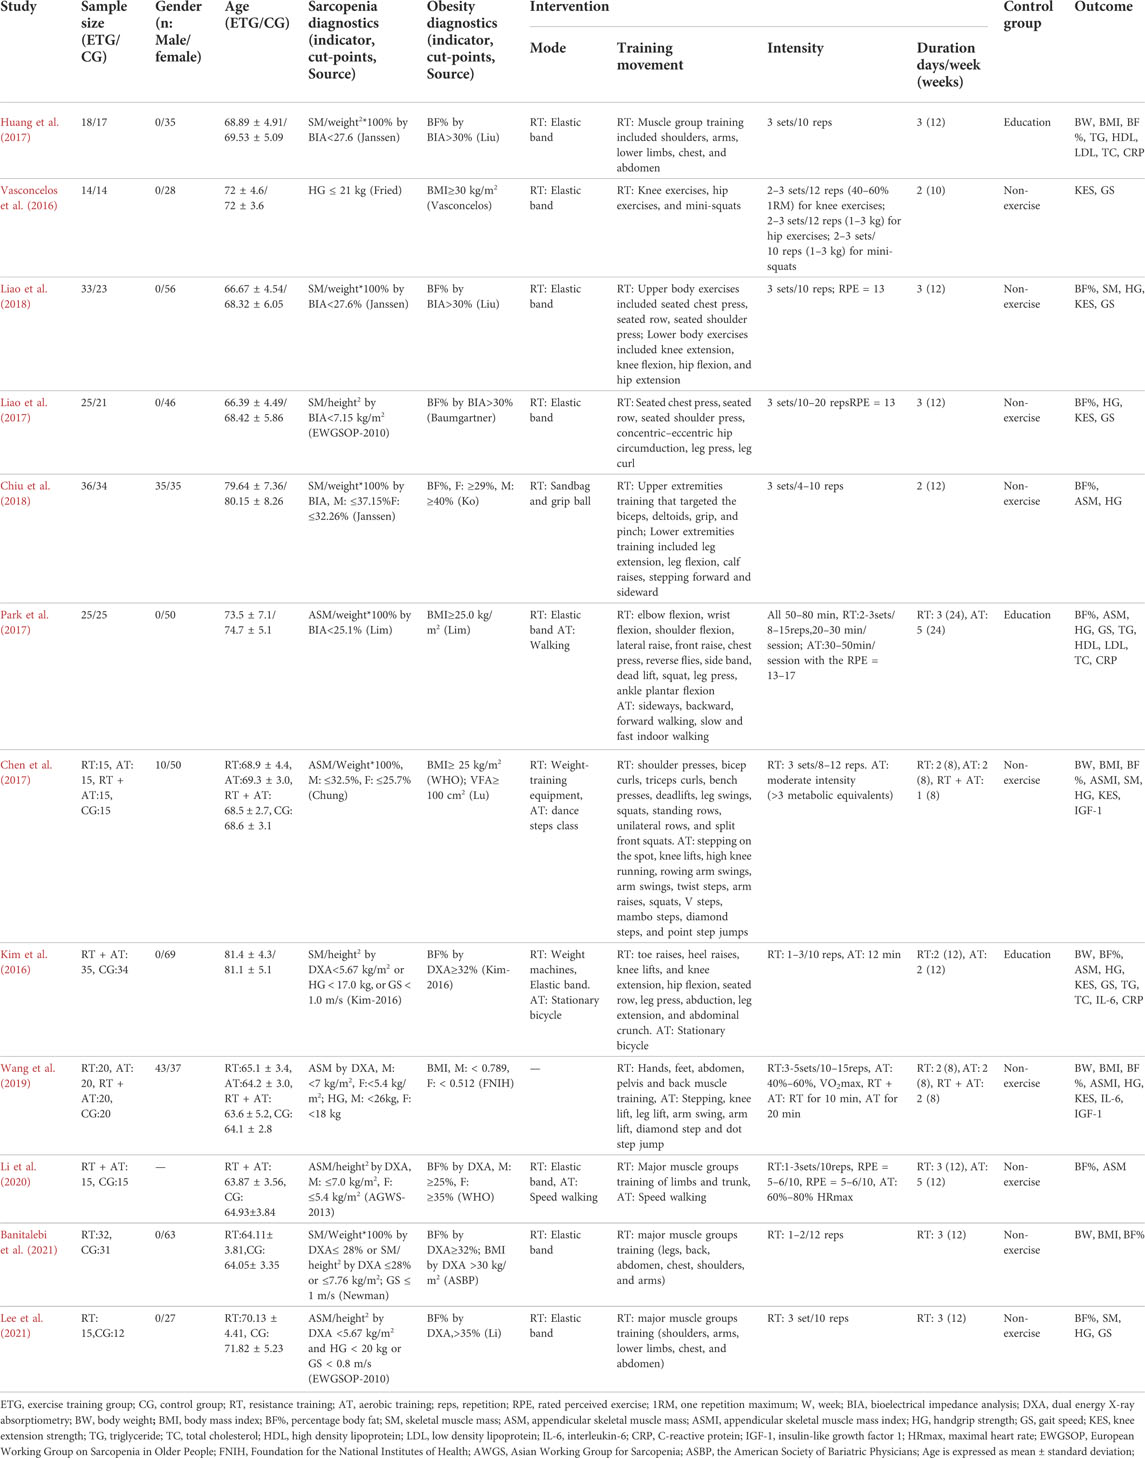
TABLE 1. Characteristics of included studies.
Diagnostic criteria for sarcopenia
Table 2 shows the diagnostic criteria for sarcopenia among studies in the meta-analysis. The diagnostic criteria came from the 2010 version of the European Working Group on Sarcopenia in Older People [EWGSOP-2010 (Cruz-Jentoft et al., 2010)], the 2013 version of the Asian Working Group for Sarcopenia criteria [AGWS-2013 (Chen et al., 2014)], the Foundation for the National Institutes of Health [FNIH (Studenski et al., 2014)], and diagnostic criteria from specific research groups [Janssen (Janssen et al., 2002), Chung (Chung et al., 2013), Newman (Newman et al., 2003), Lim (Lim et al., 2010), Kim (Kim et al., 2016), and Fried (Fried et al., 2001)]. The diagnostic criteria reflect the region-specific cut-off points for muscle mass consisting of Europe [EWGSOP-2010 (Cruz-Jentoft et al., 2010)], Asia [AWGS-2013 (Chen et al., 2014)], the United States [FNIH (Studenski et al., 2014), Janssen (Janssen et al., 2002), Newman (Newman et al., 2003) and Fried (Fried et al., 2001)], Korea [Chung (Chung et al., 2013) and Lim (Lim et al., 2010)] and Japan [Kim (Kim et al., 2016)].
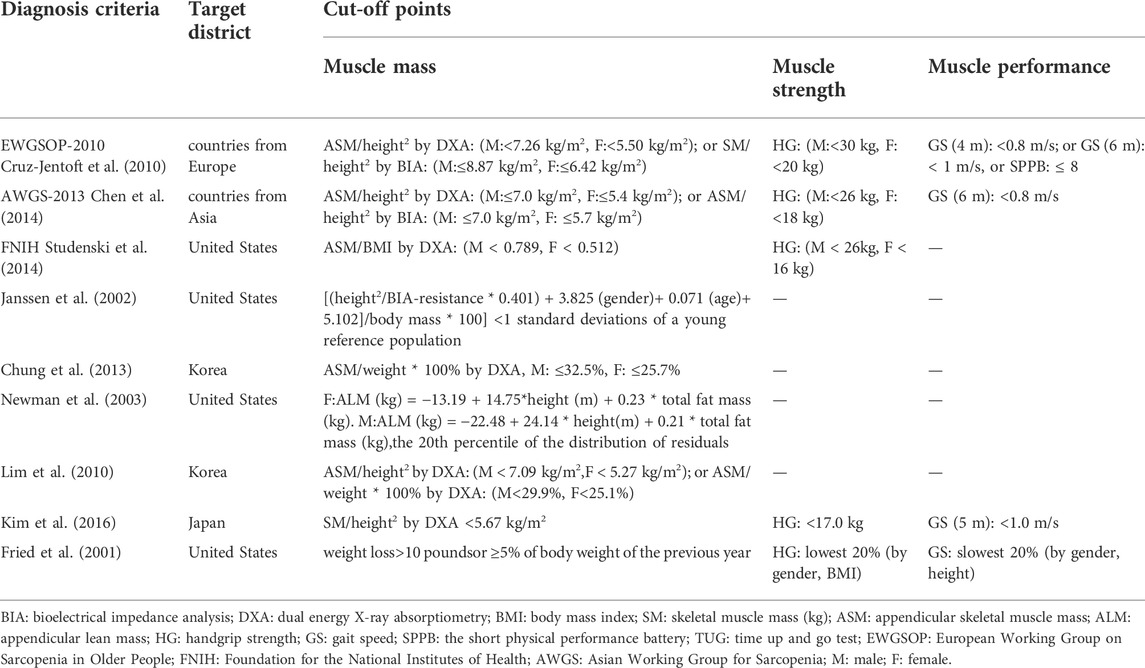
TABLE 2. Different indicators and cut-off points in defining sarcopenia.
The studies used various criteria to measure sarcopenia. Two studies used EWGSOP-2010 (Liao et al., 2017; Lee et al., 2021), one study used AGWS-2013 (Li et al., 2020), three studies used Janssen (Huang et al., 2017; Chiu et al., 2018; Liao et al., 2018), and one study each used criteria from FNIH (Wang et al., 2019), Chung (Chen et al., 2017), Newman (Banitalebi et al., 2021), Lim (Park et al., 2017), Kim (Kim et al., 2016), and Fried (Vasconcelos et al., 2016).
Diagnostic criteria for obesity
Table 3 shows the methods and cut-off points used to classify obesity, including the names of people and organizations creating the cut-off points to classify obesity in international locations. The methods included BF% measured by bioelectrical impedance analysis (BIA) and Dual Energy X-ray Absorptiometry (DXA), visceral fat area (VFA) measured by computed tomography (CT), and BMI calculated as weight kilogram/height meter2.
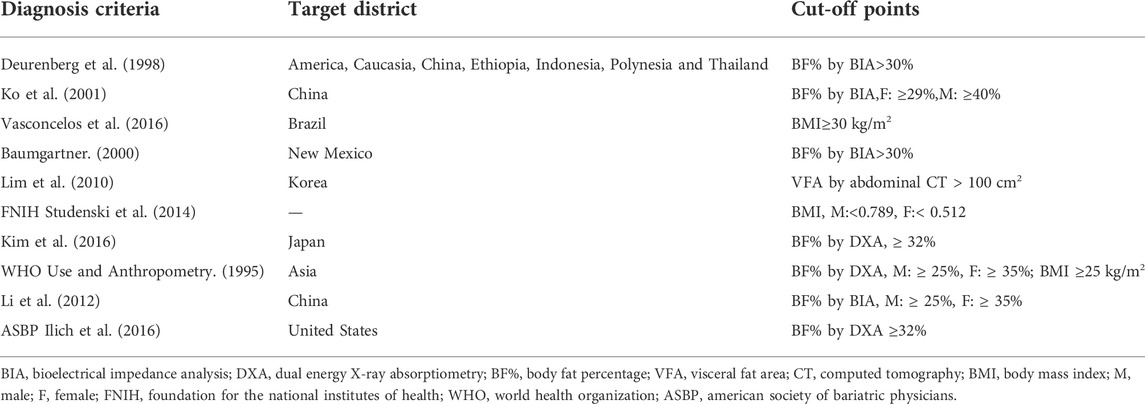
TABLE 3. Different indicators and cut-off points in defining obesity.
Seven studies measured obesity with BF% (Kim et al., 2016; Huang et al., 2017; Liao et al., 2017; Chiu et al., 2018; Liao et al., 2018; Li et al., 2020; Lee et al., 2021) three studies used BMI (Vasconcelos et al., 2016; Park et al., 2017; Wang et al., 2019), one study used BMI and VFA (Chen et al., 2017), and one study used BF% and BMI (Banitalebi et al., 2021). No studies only used VFA. Sources for the diagnostic criteria for obesity used in studies were Deurenberg (Huang et al., 2017; Liao et al., 2018), Ko (Chiu et al., 2018), Vasconcelos (Vasconcelos et al., 2016), Baumgartner (Liao et al., 2017), Lim (Park et al., 2017), World Health Organization (WHO) (Chen et al., 2017; Li et al., 2020), FNIH (Wang et al., 2019), Kim (Kim et al., 2016), American Society of Bariatric Physicians (ASBP) (Banitalebi et al., 2021) and Li (Lee et al., 2021). The diagnostic criteria for obesity vary, and the applications and cut-off points used to classify obesity may be regional. In general, most studies use the cut-off points for obesity of BF% ≥ 25% and BMI ≥30 kg/m2.
Quality assessment
Table 4 shows the PEDro scores of the 12 studies. One was rated 10, considered “excellent.” Nine were rated six to eight, considered “good.” Two were rated 5, considered “fair.” All studies met eligibility criteria for group comparison, point measures reporting, and measures of variability. Eleven studies were allocated randomly. Nine studies had concealed allocation. The baselines were similar for the 12 studies. Ten studies had adequate follow-up (>85%). Two studies blinded both participants and therapists. Seven studies blinded the assessors.
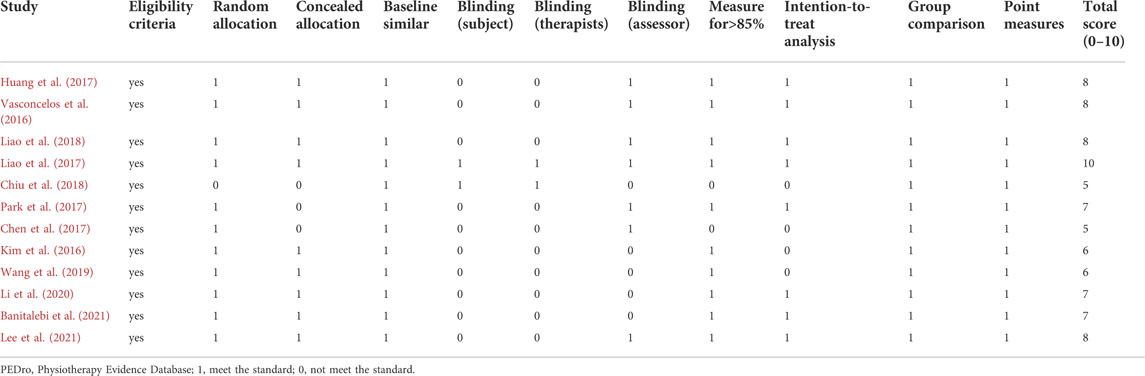
TABLE 4. PEDro criteria and scores of included studies.
Outcomes
Effects of different exercise modes for sarcopenic obesity on body composition
Eleven of the 12 studies assessed the effects of different exercise modes on body composition (BW, BMI, and BF%). Four explored the effects of different exercise modes on BW (Chen et al., 2017; Huang et al., 2017; Wang et al., 2019; Banitalebi et al., 2021) (Figure 2). Two studies included all three exercise modes (Chen et al., 2017; Wang et al., 2019). AT improved BW compared with the control group (SMD = −0.64, 95% CI: −1.13 to −0.16, p = 0.009, I2 = 0%) (Chen et al., 2017; Wang et al., 2019). RT showed no significant difference in BW compared with the control group (SMD = −0.02, 95% CI: −0.32 to 0.28, p = 0.89, I2 = 0%) (Chen et al., 2017; Huang et al., 2017; Wang et al., 2019; Banitalebi et al., 2021). MT showed no significant difference in BW compared with the control group (SMD = −0.44, 95% CI: −0.91 to 0.04, p = 0.07, I2 = 0%) (Chen et al., 2017; Wang et al., 2019). Collectively, the three exercise modes showed a significant decrease in BW compared with the control group (SMD = −0.25, 95% CI: −0.48 to −0.03, p = 0.03, I2 = 17%).
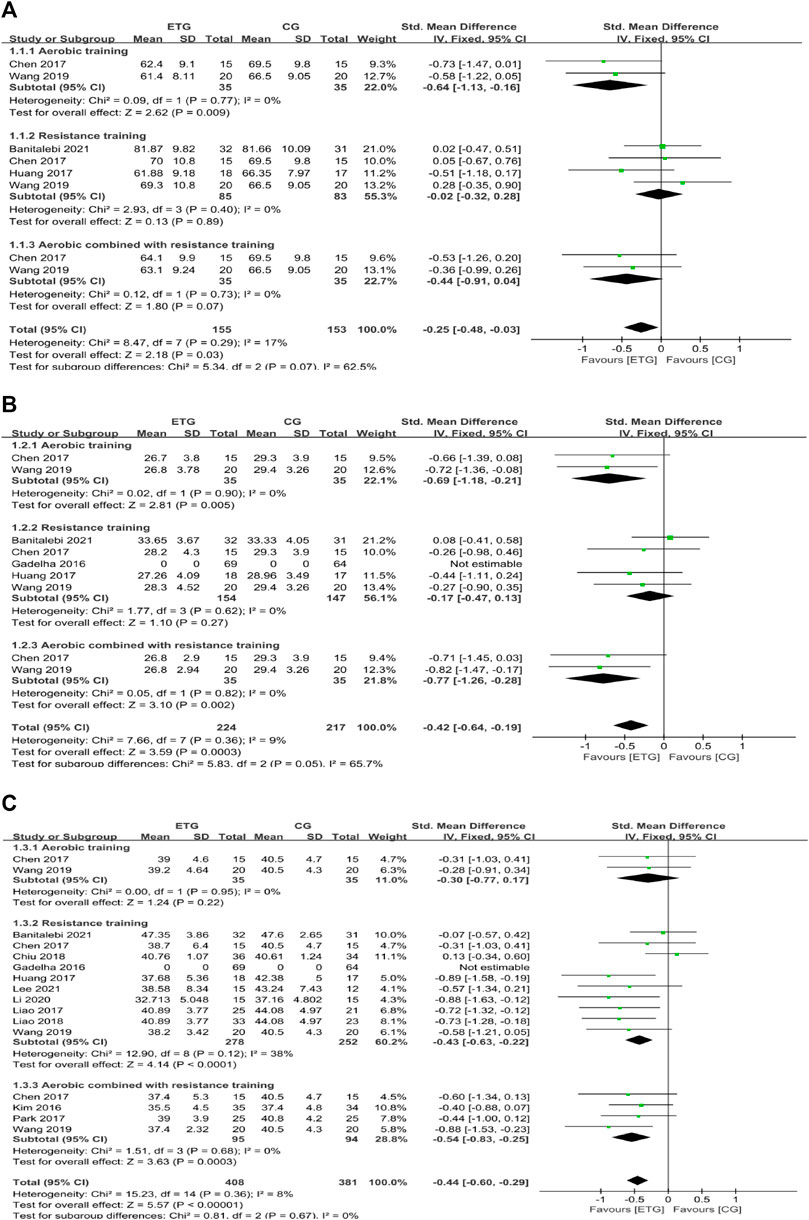
FIGURE 2. Forest plots of the comparison of the exercise training group (ETG) versus the control group (CG) on (A) body weight (BW); (B) body mass index (BMI); (C) percentage of body fat (BF%); CI: confidence interval; SD: standard deviation.
Four of the 12 studies explored the effects of different exercise modes on BMI (Chen et al., 2017; Huang et al., 2017; Wang et al., 2019; Banitalebi et al., 2021). Two studies included all three exercise modes (Chen et al., 2017; Wang et al., 2019). AT improved BMI compared with the control group (SMD = −0.69, 95% CI: −1.18 to −0.21, p = 0.005, I2 = 0%) (Chen et al., 2017; Wang et al., 2019). RT showed no significant difference in BMI compared with the control group (SMD = −0.17, 95% CI: −0.47 to 0.13, p = 0.27, I2 = 0%) (Chen et al., 2017; Huang et al., 2017; Wang et al., 2019; Banitalebi et al., 2021). MT improved BMI compared with the control group (SMD = −0.77, 95% CI: −1.26 to −0.28, p = 0.002, I2 = 0%) (Chen et al., 2017; Wang et al., 2019). Collectively, all exercise modes showed a significant decrease in BMI compared with the control group (SMD = −0.42, 95% CI: −0.64 to −0.19, p = 0.0003, I2 = 9%).
Eleven of the 12 studies explored the effects of different exercise modes on BF% (Kim et al., 2016; Chen et al., 2017; Huang et al., 2017; Liao et al., 2017; Park et al., 2017; Chiu et al., 2018; Liao et al., 2018; Wang et al., 2019; Li et al., 2020; Banitalebi et al., 2021; Lee et al., 2021). Two studies included all three exercise modes (Chen et al., 2017; Wang et al., 2019). AT showed no significant difference in BF% compared with the control group (SMD = −0.30, 95% CI: −0.77 to 0.17, p = 0.22, I2 = 0%) (Chen et al., 2017; Wang et al., 2019). RT improved BF% compared with the control group (SMD = −0.43, 95% CI: −0.63 to −0.22, p < 0.0001, I2 = 38%) (Chen et al., 2017; Huang et al., 2017; Liao et al., 2017; Chiu et al., 2018; Liao et al., 2018; Wang et al., 2019; Li et al., 2020; Banitalebi et al., 2021; Lee et al., 2021). MT improved BF% compared with the control group (SMD = −0.54, 95% CI: −0.83 to −0.25, p = 0.0003, I2 = 0%) (Kim et al., 2016; Chen et al., 2017; Park et al., 2017; Wang et al., 2019). Collectively, different exercise modes showed a significant decrease in BF% compared with the control group (SMD = −0.44, 95% CI: −0.60 to −0.29, p < 0.00001, I2 = 8%).
Effects of different exercise modes on muscle mass
There were three outcomes of muscle mass: SM, ASM, and ASMI.
Three of the 12 studies explored the effects of different exercise modes on SM (Chen et al., 2017; Liao et al., 2018; Lee et al., 2021) (Figure 3). One study included all three exercise modes (Chen et al., 2017) and two studies included only RT (Liao et al., 2018; Lee et al., 2021). Results showed no significant difference between exercise groups and control group (AT, SMD = −0.28, 95% CI: −1.00 to 0.44, p = 0.45; RT, SMD = 0.07, 95% CI: −0.30 to 0.45, p = 0.71, I2 = 9%; MT, SMD = 0.05, 95% CI: −0.66 to 0.77, p = 0.89). Collectively, different exercise modes showed no significant difference in SM compared with the control group (SMD = 0.01, 95% CI: −0.29 to 0.31, p = 0.96, I2 = 0%).
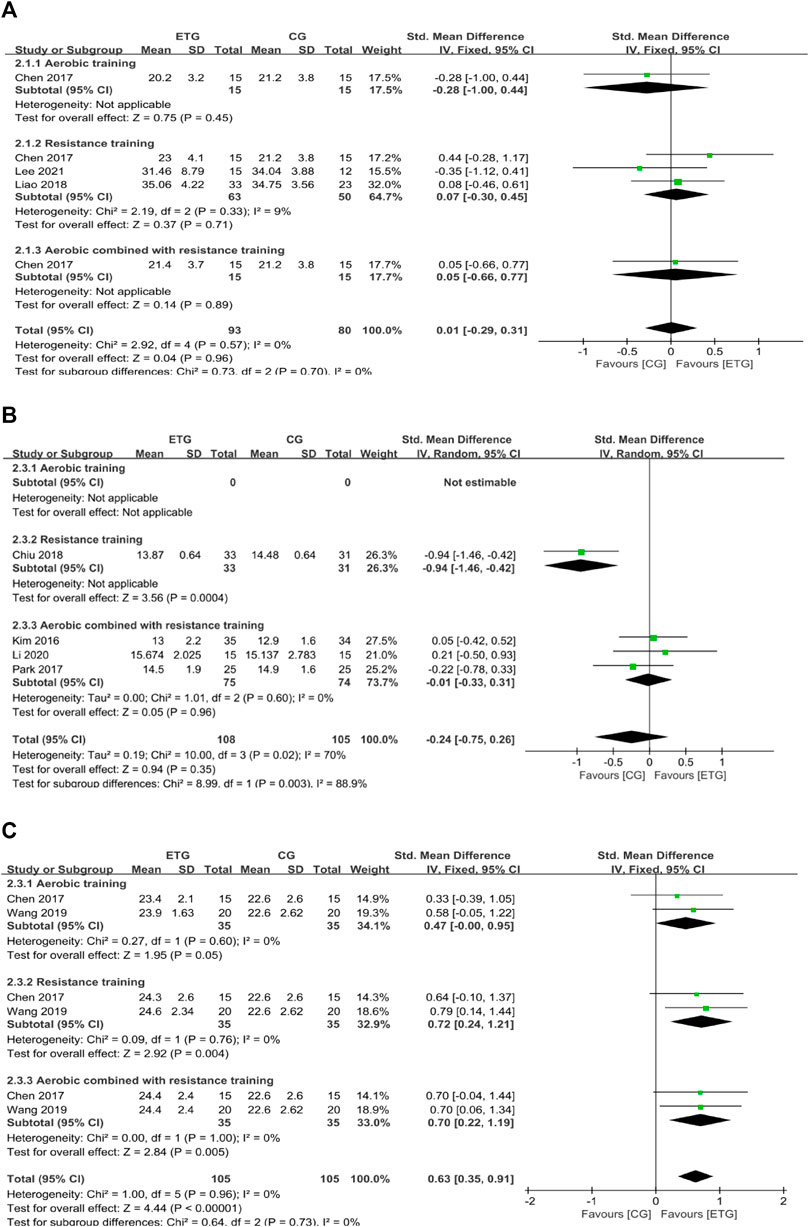
FIGURE 3. Forest plots of the comparison of the exercise training group (ETG) versus the control group (CG) on (A) skeletal muscle mass (SM); (B) appendicular skeletal muscle mass (ASM); and (C) appendicular skeletal muscle mass index (ASMI); CI, confidence interval; SD, standard deviation.
Four of the 12 studies explored the effects of different exercise modes on ASM (Kim et al., 2016; Park et al., 2017; Chiu et al., 2018; Li et al., 2020). RT improved ASM compared with the control group (SMD = −0.94, 95% CI: −1.46 to −0.42, p = 0.0004) (Chiu et al., 2018). MT showed no significant differences between exercise modes with the control groups (SMD = −0.01, 95% CI: −0.33 to 0.31, p = 0.96, I2 = 0%) (Kim et al., 2016; Park et al., 2017; Li et al., 2020). Collectively, the different exercise modes showed no significant difference in ASM compared with the control group (SMD = −0.24, 95% CI: −0.75 to 0.26, p = 0.35, I2 = 70%).
Two of the 12 studies explored the effects of different exercise modes on ASMI (Chen et al., 2017; Wang et al., 2019). Two studies included all three exercise modes (Chen et al., 2017; Wang et al., 2019). AT showed no significant difference in ASMI compared with the control group (SMD = 0.47, 95% CI: −0.00 to 0.95, p = 0.05, I2 = 0%) (Chen et al., 2017; Wang et al., 2019). RT showed a significant increase in ASMI compared with the control group (SMD = 0.72, 95% CI: 0.24 to 1.21, p = 0.004, I2 = 0%) (Chen et al., 2017; Wang et al., 2019). MT showed a significant increase in ASMI compared with the control group (SMD = 0.70, 95% CI: 0.22 to 1.19, p = 0.005, I2 = 0%) (Chen et al., 2017; Wang et al., 2019). Collectively, different exercise modes showed a significant increase in ASMI compared with the control group (SMD = 0.63, 95% CI: 0.35 to 0.91, p < 0.00001, I2 = 0%).
Effects of different exercise modes on muscle strength
There were two outcomes of muscle strength: HG and KES. Eight of the 12 studies explored the effects of different exercise modes on HG (Kim et al., 2016; Chen et al., 2017; Liao et al., 2017; Park et al., 2017; Chiu et al., 2018; Liao et al., 2018; Wang et al., 2019; Lee et al., 2021) (Figure 4). AT showed no significant difference in HG compared with the control group (SMD = −0.09, 95% CI: −0.56 to 0.38, p = 0.70, I2 = 0%) (Chen et al., 2017; Wang et al., 2019). RT showed a significant increase in HG compared with the control group (SMD = 1.06, 95% CI: 0.22 to 1.91, p = 0.01, I2 = 90%) (Chen et al., 2017; Liao et al., 2017; Chiu et al., 2018; Liao et al., 2018; Wang et al., 2019; Lee et al., 2021). MT showed no significant difference in HG compared with the control group (SMD = 0.59, 95% CI: -0.16 to 1.34, p = 0.12, I2 = 84%) (Kim et al., 2016; Chen et al., 2017; Park et al., 2017; Wang et al., 2019). Collectively, different exercise modes showed a significant increase in HG compared with the control group (SMD = 0.71, 95% CI: 0.20 to 1.22, p = 0.006, I2 = 87%).
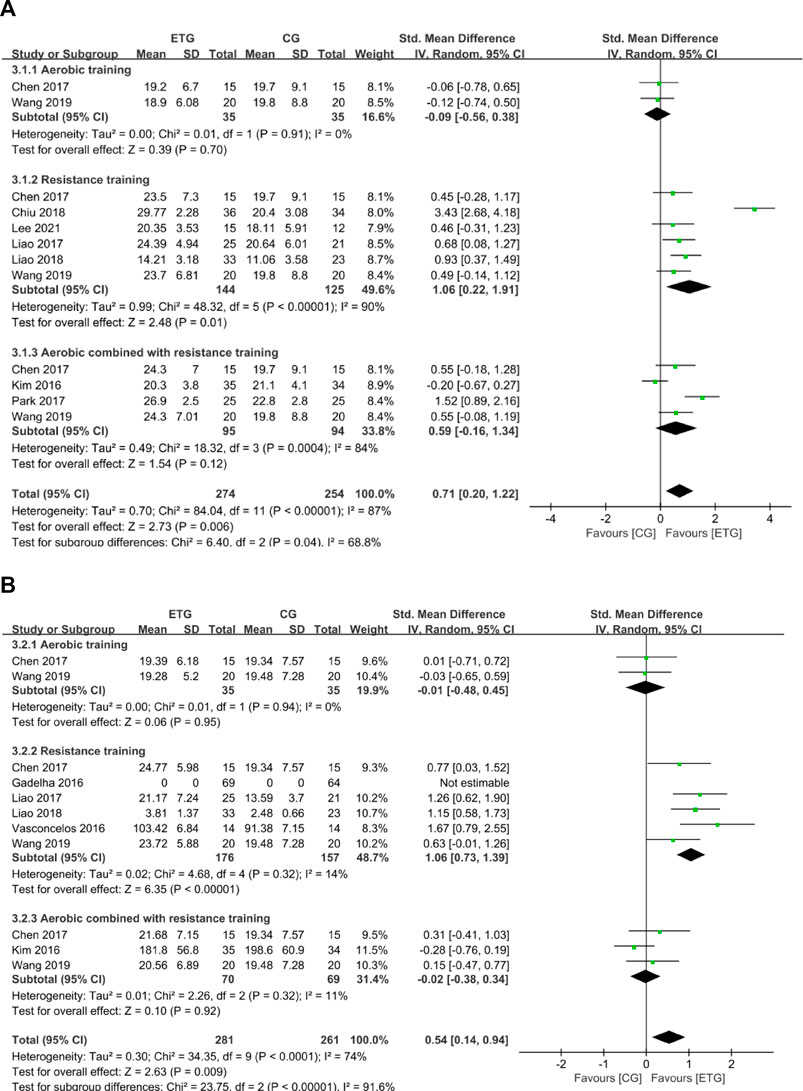
FIGURE 4. Forest plots of the comparison of the exercise training group (ETG) versus the control group (CG) on (A) handgrip strength (HG); (B) knee extension strength (KES); CI, confidence interval; SD, standard deviation.
Six of the twelve studies explored the effects of different exercise modes on KES (Kim et al., 2016; Vasconcelos et al., 2016; Chen et al., 2017; Liao et al., 2017; Liao et al., 2018; Wang et al., 2019). Two studies included all three exercise modes (Chen et al., 2017; Wang et al., 2019). AT showed no significant difference in KES compared with the control group (SMD = -0.01, 95% CI: −0.48 to 0.45, p = 0.95, I2 = 0%) (Chen et al., 2017; Wang et al., 2019). RT showed a significant increase in KES compared with the control group (SMD = 1.06, 95% CI: 0.73 to 1.39, p < 0.00001, I2 = 14%) (Vasconcelos et al., 2016; Chen et al., 2017; Liao et al., 2017; Liao et al., 2018; Wang et al., 2019). MT showed no significant difference in KES compared with the control group (SMD = -0.02, 95% CI: −0.38 to 0.34, p = 0.92, I2 = 11%) (Kim et al., 2016; Chen et al., 2017; Wang et al., 2019). Collectively, different exercise modes showed a significant increase in KES compared with the control group (SMD = 0.54, 95% CI: 0.14 to 0.94, p = 0.009, I2 = 74%).
Effects of different exercise modes for sarcopenic obesity on the physical performance
Six of the 12 studies explored the effects of different exercise modes on GS (Kim et al., 2016; Vasconcelos et al., 2016; Liao et al., 2017; Park et al., 2017; Liao et al., 2018; Lee et al., 2021) (Figure 5). No studies explored the effect of AT on GS. RT showed no significant difference in GS compared with the control group (SMD = 0.62, 95% CI: −0.47 to 1.71, p = 0.27, I2 = 90%) (Vasconcelos et al., 2016; Liao et al., 2017; Liao et al., 2018; Lee et al., 2021). MT showed a significant increase in GS compared with the control group (SMD = 0.71, 95% CI: 0.23 to 1.18, p = 0.004, I2 = 37%) (Kim et al., 2016; Park et al., 2017). Collectively, different exercise modes showed a significant increase in GS compared with the control group (SMD = 0.67, 95% CI: 0.03 to 1.31, p = 0.04, I2 = 84%).
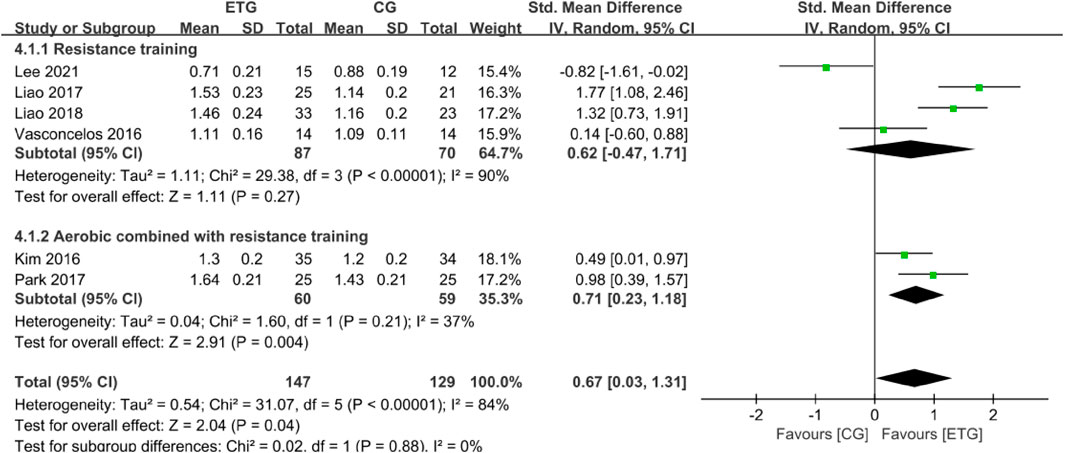
FIGURE 5. Forest plots of the comparison of the exercise training group (ETG) versus the control group (CG) on gait speed (GS); CI, confidence interval; SD, standard deviation.
Effects of different exercise modes on hematological parameters
Seven outcomes of hematological parameters included inflammatory markers (IL-6 and CRP), IGF-1, and lipid profile measures (TG, TC, HDL, and LDL). For the inflammatory markers, two of the studies explored the effects of different exercise modes on IL-6 (Kim et al., 2016; Wang et al., 2019) (Figure 6). One study included all three exercise modes (Wang et al., 2019). The other study explored the effect of MT on IL-6 (Kim et al., 2016). None of the exercise modes showed a significant difference in IL-6 compared with the control group (SMD = 0.07, 95% CI: −0.22 to 0.35, p = 0.64, I2 = 0%). Three studies explored the effects of different exercise modes on CRP (Kim et al., 2016; Huang et al., 2017; Park et al., 2017). One study explored the effect of RT on CRP (Huang et al., 2017). Two studies explored the effect of MT on CRP (Kim et al., 2016; Park et al., 2017). No studies explored the effect of AT on CRP. None of the exercise modes showed a significant difference in CRP compared with the control group (SMD = 0.02, 95% CI: -0.31 to 0.36, p = 0.89, I2 = 0%).
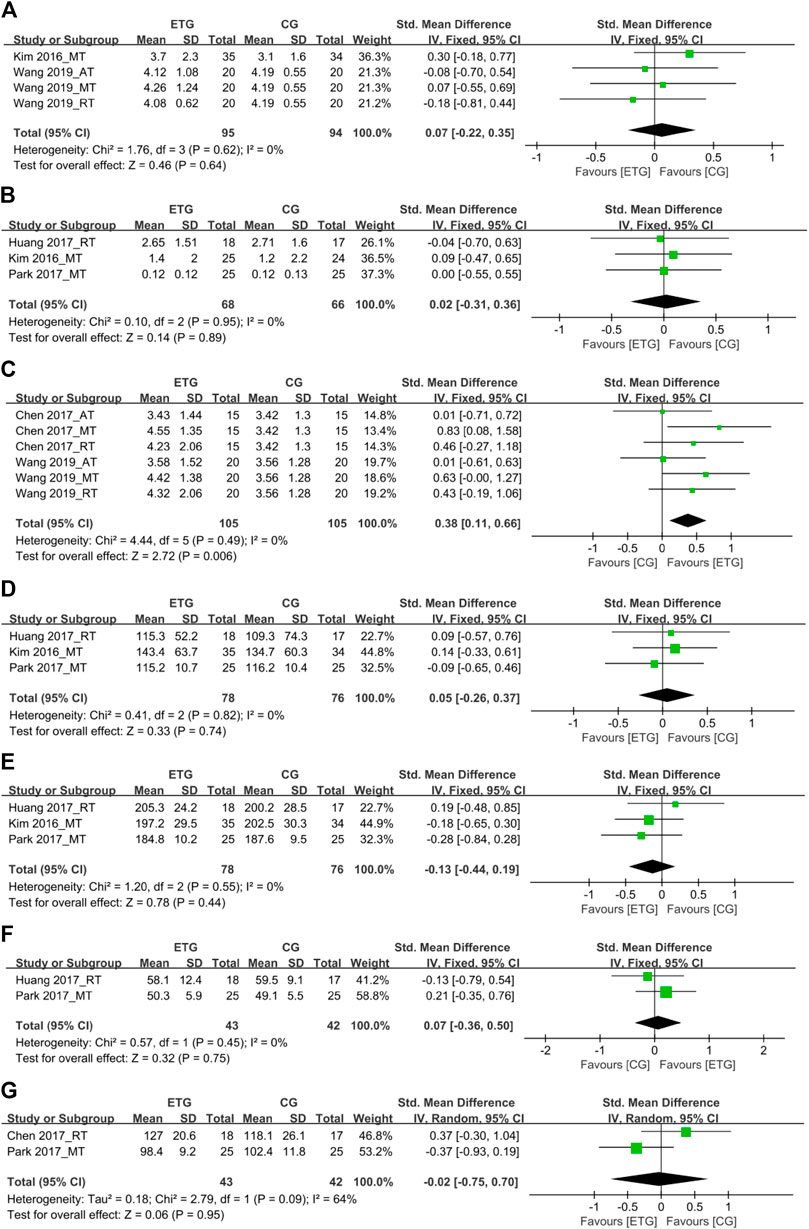
FIGURE 6. Forest plots of the comparison of the exercise training group (ETG) versus the control group (CG) on (A) interleukin-6 (IL-6); (B) C-reactive protein (CRP); (C) insulin-like growth factor 1 (IGF-1); (D) triglyceride (TG); (E) total cholesterol (TC); (F) high-density lipoprotein (HDL); (G) low-density lipoprotein (LDL); AT, aerobic training; RT, resistance training; MT, aerobic combined with resistance training; CI, confidence interval; SD, standard deviation.
Two studies explored the effects of different exercise modes on IGF-1 (Chen et al., 2017; Wang et al., 2019). Both studies included all three exercise modes (Chen et al., 2017; Wang et al., 2019). In total, all three exercise modes showed a significant increase in IGF-1 compared with the control group (SMD = 0.38, 95% CI: 0.11 to 0.66, p = 0.006, I2 = 0%).
Among the lipid profile markers, three studies explored the effects of RT and MT on TG (Kim et al., 2016; Huang et al., 2017; Park et al., 2017). One of the three studies explored the RT on TG (Huang et al., 2017). The other two studies explored the effect of MT on TG (Kim et al., 2016; Park et al., 2017). No studies explored the effect of AT on TG. None of the two exercise modes showed a significant difference in TG compared with the control group (SMD = 0.05, 95% CI: −0.26 to 0.37, p = 0.74, I2 = 0%). Three studies explored the effects of different exercise modes for SO on TC (Kim et al., 2016; Huang et al., 2017; Park et al., 2017). One of the three studies explored the RT on TC (Huang et al., 2017). The other two studies explored the effect of MT on TC (Kim et al., 2016; Park et al., 2017). No studies explored the effect of AT on TC. None of the two exercise modes showed a significant difference in TC compared with the control group (SMD = −0.13, 95% CI: −0.44 to 0.19, p = 0.44, I2 = 0%).
Two studies explored the effects of RT and MT for SO on HDL, respectively (Huang et al., 2017; Park et al., 2017). None of the exercise modes showed a significant difference in HDL compared with the control group (SMD = 0.07, 95% CI: −0.36 to 0.50, p = 0.75, I2 = 0%). Two studies explored the effects of RT and MT for SO on LDL, respectively (Chen et al., 2017; Park et al., 2017). None of the exercise modes showed a significant difference in LDL compared with the control group (SMD = −0.02, 95% CI: −0.75 to 0.70, p = 0.95, I2 = 64%).
Moderator variables
To explore the influence of different exercise modes on muscle mass, inflammatory markers, and lipid profiles, we performed subgroup analyses to assess the potential effects of different moderators on the outcomes. Table 5 illustrates the influence of moderator variables on muscle mass, inflammatory markers, and lipid profiles. The subgroup analysis included the moderator variables of sarcopenia and obesity diagnostic indicators (e.g., EWGSOP-2010, BF%), intervention duration, and intervention frequency.
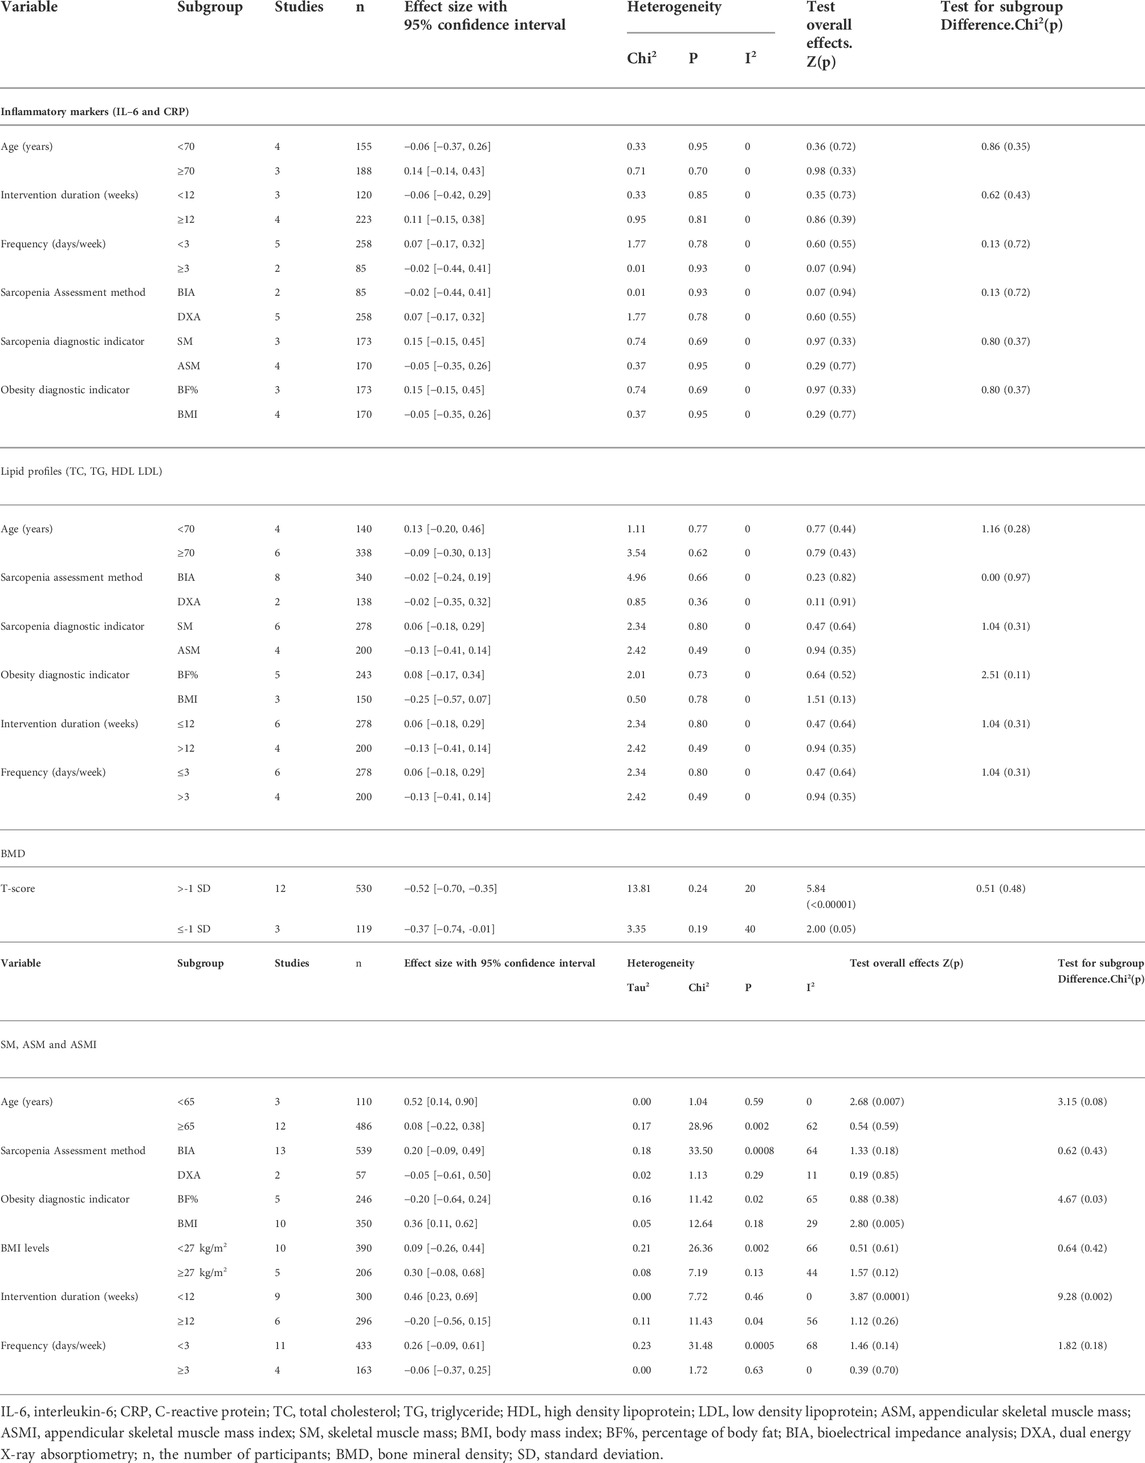
TABLE 5. Influence of moderator variables in the effect of physical activity on inflammatory markers, lipid profiles, BMD and muscle mass.
Inflammatory markers: There were no significant relationships between inflammatory markers and age, intervention duration, intervention frequency, sarcopenia and obesity diagnostic indicators, and sarcopenia assessment methods.
Lipid profiles: There were no significant relationships between lipid profiles and age, intervention duration, intervention frequency, sarcopenia assessment methods, and sarcopenia and obesity diagnostic indicators.
Muscle mass: Muscle mass increased significantly in people <65 years (SMD = 0.52, 95% CI: 0.14 to 0.90, p = 0.007, I2 = 0%). Muscle mass increased significantly when the obesity diagnostic indicator was BMI (SMD = 0.36, 95% CI: 0.11 to 0.62, p = 0.005, I2 = 29%). Concerning the training protocol, a greater effect on muscle mass was observed when intervention duration was less than 12 weeks as compared with longer durations (SMD = 0.46, 95% CI: 0.23 to 0.69, p = 0.0001, I2 = 0%).
Discussion
In this systematic review and meta-analysis, we analyzed 12 studies (including 11 randomized controlled trials and one non-randomized controlled trial) to compare the effects of three exercise modes (AT, RT, and MT) on body composition, muscle mass, muscle strength, physical performance and hematological parameters in older people with SO. Our results found that AT could significantly decrease BW and BMI. RT could improve BF%, ASMI, ASM, HG, and KES, and, MT could improve BMI, BF%, ASMI, and GS in older people with SO. PA could significantly increase IGF-1, but all exercise modes (AT, RT, and MT) had no effects on other inflammatory markers and lipids profile markers in older people with SO.
An epidemiological study showed that the decrease of skeletal muscle mass in middle-aged and elderly women over 50 years old was greater than that in men. The decrease in estrogen level was the most important physiological characteristic of postmenopausal women. This change would lead to secondary body composition changes (Wang et al., 2016). The fat mass of the human body would increase significantly after the age of 45, especially in the elderly stage of women, due to the influence of physiological factors and the reduction of physical activity, fat mass was easier to accumulate, and abdominal fat increases obviously, resulting in obesity (Bahrami et al., 2006). Therefore, it was recommended that older people with SO, especially women, improve their body composition and health through gradual and regular PA.
BW, BF%, and BMI are obesity-related indicators associated with insulin resistance (Kurniawan et al., 2018). Progression of SO is often accompanied by changes in body composition. Obesity accompanies a chronic inflammatory state and plays a negative role in SO progression (Wijesinghe et al., 2021). Therefore, improving body composition is crucial for older people with SO. Also, studies indicated that PA is an effective intervention component to ameliorate the adverse effects caused by aging and obesity (Vincent et al., 2012). Consistent with our results, previous studies have shown that AT decreases BW while RT and MT improve BF% in older people with SO (Hsu et al., 2019). Wang et al. (2019) and Chen et al. (2017) also showed that MT (aerobic combined with resistance training for 8 weeks, once or twice a week) significantly improved BMI and BF% in older people with SO.
SM and ASM are measures of lean muscle mass measured by BIA or DXA. Our findings agreed with Hsu et al. (2019) and Hita-Contreras et al. (2018), showing that none of the exercise modes changed the SM values. In our study, other exercise modes had no effect on ASM except RT. Although AT, RT, and MT may not completely reverse the loss of SM and ASM, regular PA helps slow down many age-related mitochondrial markers of muscle, potentially delaying the process of muscle loss (Koltai et al., 2012).
ASMI personalizes measures of muscle mass in older people with SO, adjusting ASM by height or weight. Our results found that RT and MT significantly improved ASMI. RT improves muscle strength, mass, and neuromuscular function (Cadore et al., 2014). Chelly et al. (2009) observed that the first 8 weeks of RT usually improves neural adaptation rather than changing muscle structure in novice weight lifters. Thus, we speculate that different training protocols might effect muscle mass differently. We found improved muscle mass of SO people when intervention duration lasted less than 12 weeks in a subsample of people aged <65 with obesity status determined by BMI. This finding persisted regardless of the sarcopenia assessment method, BMI levels, and intervention frequency. This finding was inconsistent with the study by Chen et al. (2021) found that RT 1–2 times per week for ≥12 weeks could improve muscle mass . Contrary to Chen et al. (2021) study, we speculated that duplicate inclusion of the subgroup analysis less than 12 weeks would affect the final results of the meta-analysis. We extracted subgroup data for different modes of PA and different indicators. For example, two studies with fewer than 12 weeks of exercise duration contained nine subgroup combinations (Chen et al., 2017; Wang et al., 2019). Six studies with more than 12 weeks duration (Kim et al., 2016; Park et al., 2017; Chiu et al., 2018; Liao et al., 2018; Li et al., 2020; Lee et al., 2021) contained six subgroup combinations. Eleven studies had an exercise frequency of fewer than three times per week, and four studies had more than three times per week. A significant imbalance in the number of studies analyzed by subgroups may affect the final results. Therefore, we suggest future studies of PA in older people with SO last longer than 12 weeks and with an exercise frequency of three or more times per week.
Muscle strength declines with age at an average rate of 2%–4% per year, 2–5 times faster than muscle mass loss (Mitchell et al., 2012). Muscle strength and physical performance are predictors of disability and hospitalization in older people (Legrand et al., 2014). Lu et al. (2020) showed that HG strength correlates with arm and leg strength and represents whole-body muscle strength. KES is a method for assessing lower limb strength and predicting falling risk (Bobowik and Wiszomirska, 2020). Consistent with Hsu et al. (2019), our study showed that RT significantly improved both HG and KES, and MT improved GS. MT combines the dual advantages of AT and RT and should have a better effect on muscle strength than RT in improving muscle strength. However, our results did not find that MT significantly improved the subjects’ muscle strength, which was inconsistent with previous studies. A meta-analysis by Lu et al. (2021) indicated that RT and MT had the same effect on muscle strength in people with sarcopenia. This increase in muscle strength may be due to the complex training in Lu et al.(2021) study was aerobic combined resistance exercise and balance and gait training. However, no studies have explored the comparison of RT and MT on muscle strength in older people with SO. Thus, researchers should conduct more research to compare these two modes of exercise in people with SO. Consistent with Lu et al.(2021) results, MT could improve GS, but inconsistent with our study, they also pointed out that RT could improve GS. This difference may be that the longest training time for RT on GS in Lu et al.(2021) study was 24 weeks, while in our study, the longest RT time for GS was 12 weeks. Increased neural activity in areas of the brain associated with cognition and memory was one of the potential mechanisms for action (Hansen, 2014). Therefore, we hypothesized that with longer training durations, the proficiency of the movement increases, and the training difficulty of MT becomes more complex than that of AT and RT. This effect causes the whole body to promote increases in GS.
IGF-1 positively effects the body as it mediates growth hormone and anabolic responses in many cells and tissues. Conversely, chronic inflammation and hyperlipidemia have adverse effects on various tissues and cellular functions, including CVD progression. Our study indicated that PA significantly improved IGF-1, and none of the exercise modes changed inflammatory markers and lipid profiles. As shown by Li et al. (2021), exercise induced the secretion of large amounts of IGF-1 from liver and skeletal muscle and triggered a series of downstream responses, such as activation of skeletal muscle satellite cells to promote myogenic cell proliferation and differentiation, and inhibition of cell expression of collagen to reduce skeletal muscle fibrosis. In conclusion, skeletal muscle cells could produce IGF-1 in response to exercise stimuli, which played a protective role in maintaining muscle mass and function. Wang et al. (2019) demonstrated that in older people with SO, 8-weeks of RT could reduce IL-6, and 8-weeks of RT and MT increased IGF-1. Park et al. (2017) found that 24 weeks of MT significantly improved TC and LDL in older people with SO. By contrast, Hsu et al. (2019) showed that PA, regardless of exercise mode, did not affect CRP, TC, TG, and HDL in older people with SO. Therefore, the effect of PA on inflammatory markers and lipids profiles in people with SO is equivocal. We speculate that differences in subject characteristics and training protocols are responsible for these findings. In subgroup analyses, we expected to see the positive effects of different moderators on inflammatory markers and lipid profiles.
Contrary to expectations, we did not find a significant relationship between moderators, inflammatory markers, and lipid profiles. We infer that this may be related to the limited number of studies included in the meta-analyses reviewed. Thus, more research should explore different exercise modes on inflammatory markers and lipid profiles in older people with SO.
In the subgroup analysis, some of the results showed high heterogeneity. The reasons for this may be composed of the following points. First, the diagnostic criteria for SO varied by region, race, age, and measurement tools, and the diagnostic criteria for SO were a combination of diagnostic criteria for sarcopenia and diagnostic criteria for obesity, but the prevalence of the SO varied widely using different combinations. Second, the inconsistent baseline characteristics of the older people with SO in the included studies may have led to differences in the improvement effect of different exercise modes on various indicators. Finally, the diversity of exercise intervention protocols and the inconsistency of quality monitoring during the intervention resulted in high heterogeneity.
Strengths and limitations
This systematic review and meta-analysis comprehensively assessed the effects of different modes of PA (AT, RT, and MT) in older people with SO. The strength of this study is the rigorous screening where we excluded studies of subjects without SO, studies where SO subjects were treated with nutritional supplements, and studies where SO subjects were diagnosed with chronic diseases. Our findings were comprehensive and consisted of the changes in body composition, muscle mass, muscle strength, physical performance, and hematological parameters, including the effect of PA on IGF-1 in older people with SO.
This study also had some limitations. We included studies that recruited older people with osteosarcopenic obesity. However, researchers know little about how osteoporosis may affect PA in older people with SO. In our subgroup analysis, after PA intervention, people without osteoporosis significantly decreased BF% compared with older people with osteoporosis. Postmenopausal women lost the protective effect of estrogen, osteoclasts, and bone absorption were enhanced, resulting in sparse trabecular bone and reduced bone mass, which increased the difficulty of PA intervention when co-occurring with SO (Li et al., 2020). Therefore, osteoporosis can affect the effect of exercise on SO. Limited to the number of included studies, we only explored the influence of the efficacy of exercise on BF%. More RCTs are needed to study this relationship in the future. The intervention duration for studies in this systematic review and meta-analysis was shorter than 24 weeks, which may limit changes in muscle mass and hematological parameters. More studies are needed to investigate the effects of long-term PA on SO. Based on strict inclusion and exclusion criteria, the number of eligible studies was small, and the subjects were predominantly female, limiting the general applicability of the meta-analysis results.
Conclusion
Our results illustrated the importance of PA in the management of SO in older people. Different modes of exercise selectively improve body composition (BW, BMI, and BF%), muscle mass (ASMI and ASM), muscle strength (HG and KES), physical performance (GS), and hematological parameters (IGF-1) in older people with SO. In particular, AT decreases BW and BMI; RT improves BF%, ASMI, ASM, HG, and KES; and MT improves BMI, BF%, ASMI, and GS. PA increased IGF-1. These findings require additional high-quality RCTs with longer intervention duration to confirm these benefits of PA in older people with SO.
Data availability statement
The original contributions presented in the study are included in the article/Supplementary Material, further inquiries can be directed to the corresponding authors.
Author contributions
MZ, MJ, and TL participated in protocol design, data extraction, quality assessment, statistical analyses, and manuscript preparation. LL and BA participated in manuscript revision. NC and YL participated in protocol design, quality assessment, and manuscript revision. All authors have read and approved the final manuscript.
Funding
This meta-analysis is funded by a special health research project of Shanghai Municipal Health Commission on the Health of Ageing, Woman and Children, “Exploration on the Screening and Rehabilitation Intervention Model for Sarcopenia among Community-dwelling Older people in Chongming District under the Medical Union Model” (No. 2020YJZX0137) and the project of National Natural Science Foundation of China “Mechanism of the Regulation of Skeletal Muscle Cell AMPK Pathway by Intestinal P. merdae in the Progression of Sarcopenia” (No.82102651).
Conflict of interest
The authors declare that the research was conducted in the absence of any commercial or financial relationships that could be construed as a potential conflict of interest.
Publisher’s note
All claims expressed in this article are solely those of the authors and do not necessarily represent those of their affiliated organizations, or those of the publisher, the editors and the reviewers. Any product that may be evaluated in this article, or claim that may be made by its manufacturer, is not guaranteed or endorsed by the publisher.
Supplementary material
The Supplementary Material for this article can be found online at: https://www.frontiersin.org/articles/10.3389/fphys.2022.917525/full#supplementary-material
References
Bahrami H., Sadatsafavi M., Pourshams A., Kamangar F., Nouraei M., Semnani S., et al. (2006). Obesity and hypertension in an Iranian cohort study; Iranian women experience higher rates of obesity and hypertension than American women. BMC Public Health 6, 158. doi:10.1186/1471-2458-6-158
Banitalebi E., Ghahfarrokhi M. M., Dehghan M. (2021). Effect of 12-weeks elastic band resistance training on MyomiRs and osteoporosis markers in elderly women with osteosarcopenic obesity: A randomized controlled trial. BMC Geriatr. 21 (1), 433. doi:10.1186/s12877-021-02374-9
Batsis J., Villareal D. (2018). Sarcopenic obesity in older adults: Aetiology, epidemiology and treatment strategies. Nat. Rev. Endocrinol. 14 (9), 513–537. doi:10.1038/s41574-018-0062-9
Baumgartner R. (2000). Body composition in healthy aging. Ann. N. Y. Acad. Sci. 904, 437–448. doi:10.1111/j.1749-6632.2000.tb06498.x
Bobowik P., Wiszomirska I. (2020). Diagnostic dependence of muscle strength measurements and the risk of falls in the elderly. Int. J. Rehabil. Res. 43 (4), 330–336. doi:10.1097/mrr.0000000000000430
Bull F., Al-Ansari S., Biddle S., Borodulin K., Buman M., Cardon G., et al. (2020). World Health Organization 2020 guidelines on physical activity and sedentary behaviour. Br. J. Sports Med. 54 (24), 1451–1462. doi:10.1136/bjsports-2020-102955
Cadore E., Pinto R., Bottaro M., Izquierdo M. (2014). Strength and endurance training prescription in healthy and frail elderly. Aging Dis. 5 (3), 183–195. doi:10.14336/ad.2014.0500183
Chelly M., Fathloun M., Cherif N., Ben Amar M., Tabka Z., Van Praagh E. (2009). Effects of a back squat training program on leg power, jump, and sprint performances in junior soccer players. J. Strength Cond. Res. 23 (8), 2241–2249. doi:10.1519/JSC.0b013e3181b86c40
Chen H. T., Chung Y. C., Chen Y. J., Ho S. Y., Wu H. J. (2017). Effects of different types of exercise on body composition, muscle strength, and IGF-1 in the elderly with sarcopenic obesity. J. Am. Geriatr. Soc. 65 (4), 827–832. doi:10.1111/jgs.14722
Chen L. K., Liu L. K., Woo J., Assantachai P., Auyeung T. W., Bahyah K. S., et al. (2014). Sarcopenia in Asia: Consensus Report of the asian working group for sarcopenia. J. Am. Med. Dir. Assoc. 15 (2), 95–101. doi:10.1016/j.jamda.2013.11.025
Chen L., Woo J., Assantachai P., Auyeung T., Chou M., Iijima K., et al. (2020). Asian working group for sarcopenia: 2019 consensus update on sarcopenia diagnosis and treatment. J. Am. Med. Dir. Assoc. 21 (3), 300300–300307.e2. doi:10.1016/j.jamda.2019.12.012
Chen N., He X., Feng Y., Ainsworth B., Liu Y. (2021). Effects of resistance training in healthy older people with sarcopenia: A systematic review and meta-analysis of randomized controlled trials. Eur. Rev. Aging Phys. Act. 18 (1), 23. doi:10.1186/s11556-021-00277-7
Chiu S. C., Yang R. S., Yang R. J., Chang S. F. (2018). Effects of resistance training on body composition and functional capacity among sarcopenic obese residents in long-term care facilities: A preliminary study. BMC Geriatr. 18 (1), 21. doi:10.1186/s12877-018-0714-6
Chodzko-Zajko W., Proctor D., Fiatarone Singh M., Minson C., Nigg C., Salem G., et al. (2009). American College of Sports Medicine position stand. Exercise and physical activity for older adults. Med. Sci. Sports Exerc. 41 (7), 1510–1530. doi:10.1249/MSS.0b013e3181a0c95c
Chung J., Kang H., Lee D., Lee H., Lee Y. (2013). Body composition and its association with cardiometabolic risk factors in the elderly: A focus on sarcopenic obesity. Arch. Gerontol. Geriatr. 56 (1), 270–278. doi:10.1016/j.archger.2012.09.007
Cruz-Jentoft A., Baeyens J., Bauer J., Boirie Y., Cederholm T., Landi F., et al. (2010). Sarcopenia: European consensus on definition and diagnosis: Report of the European working group on sarcopenia in older people. Age Ageing 39 (4), 412–423. doi:10.1093/ageing/afq034
Deurenberg P., Yap M., van Staveren W. (1998). Body mass index and percent body fat: A meta analysis among different ethnic groups. Int. J. Obes. Relat. metabolic Disord. J. Int. Assoc. Study Obes. 22 (12), 1164–1171. doi:10.1038/sj.ijo.0800741
Evans K., Abdelhafiz D., Abdelhafiz A. (2021). Sarcopenic obesity as a determinant of cardiovascular disease risk in older people: A systematic review. Postgrad. Med. 133, 831–842. doi:10.1080/00325481.2021.1942934
Fiuza-Luces C., Santos-Lozano A., Joyner M., Carrera-Bastos P., Picazo O., Zugaza J., et al. (2018). Exercise benefits in cardiovascular disease: Beyond attenuation of traditional risk factors. Nat. Rev. Cardiol. 15 (12), 731–743. doi:10.1038/s41569-018-0065-1
Fried L., Tangen C., Walston J., Newman A., Hirsch C., Gottdiener J., et al. (2001). Frailty in older adults: Evidence for a phenotype. J. Gerontol. A Biol. Sci. Med. Sci. 56 (3), M146–M156. doi:10.1093/gerona/56.3.m146
Gao Q., Mei F., Shang Y., Hu K., Chen F., Zhao L., et al. (2021). Global prevalence of sarcopenic obesity in older adults: A systematic review and meta-analysis. Clin. Nutr. 40 (7), 4633–4641. doi:10.1016/j.clnu.2021.06.009
García-Fernández M., Delgado G., Puche J., González-Barón S., Castilla Cortázar I. (2008). Low doses of insulin-like growth factor I improve insulin resistance, lipid metabolism, and oxidative damage in aging rats. Endocrinology 149 (5), 2433–2442. doi:10.1210/en.2007-1190
Gielen S., Adams V., Möbius-Winkler S., Linke A., Erbs S., Yu J., et al. (2003). Anti-inflammatory effects of exercise training in the skeletal muscle of patients with chronic heart failure. J. Am. Coll. Cardiol. 42 (5), 861–868. doi:10.1016/s0735-1097(03)00848-9
Habib S., Alkahtani S., Alhussain M., Aljuhani O. (2020). Sarcopenia coexisting with high adiposity exacerbates insulin resistance and dyslipidemia in Saudi adult men. Diabetes Metab. Syndr. Obes. 13, 3089–3097. doi:10.2147/dmso.s260382
Hansen N. (2014). Brain stimulation for combating Alzheimer's disease. Front. Neurol. 5, 80. doi:10.3389/fneur.2014.00080
Hita-Contreras F., Bueno-Notivol J., Martínez-Amat A., Cruz-Díaz D., Hernandez A., Pérez-López F. (2018). Effect of exercise alone or combined with dietary supplements on anthropometric and physical performance measures in community-dwelling elderly people with sarcopenic obesity: A meta-analysis of randomized controlled trials. Maturitas 116, 24–35. doi:10.1016/j.maturitas.2018.07.007
Hsu K., Liao C., Tsai M., Chen C. (2019). Effects of exercise and nutritional intervention on body composition, metabolic health, and physical performance in adults with sarcopenic obesity: A meta-analysis. Nutrients 11 (9), E2163. doi:10.3390/nu11092163
Huang S. W., Ku J. W., Lin L. F., Liao C. D., Chou L. C., Liou T. H. (2017). Body composition influenced by progressive elastic band resistance exercise of sarcopenic obesity elderly women: A pilot randomized controlled trial. Eur. J. Phys. Rehabil. Med. 53 (4), 556–563. doi:10.23736/s1973-9087.17.04443-4
Ilich J., Kelly O., Inglis J. (2016). Osteosarcopenic obesity syndrome: What is it and how can it Be identified and diagnosed? Curr. gerontology geriatrics Res. 2016, 7325973. doi:10.1155/2016/7325973
Izquierdo M., Merchant R., Morley J., Anker S., Aprahamian I., Arai H., et al. (2021). International exercise recommendations in older adults (ICFSR): Expert consensus guidelines. J. Nutr. Health Aging 25 (7), 824–853. doi:10.1007/s12603-021-1665-8
Janssen I., Heymsfield S., Ross R. (2002). Low relative skeletal muscle mass (sarcopenia) in older persons is associated with functional impairment and physical disability. J. Am. Geriatr. Soc. 50 (5), 889–896. doi:10.1046/j.1532-5415.2002.50216.x
Janssen I., Shepard D., Katzmarzyk P., Roubenoff R. (2004). The healthcare costs of sarcopenia in the United States. J. Am. Geriatr. Soc. 52 (1), 80–85. doi:10.1111/j.1532-5415.2004.52014.x
Katzmarzyk P. T., Leon A. S., Rankinen T., Gagnon J., Skinner J. S., Wilmore J. H., et al. (2001). Changes in blood lipids consequent to aerobic exercise training related to changes in body fatness and aerobic fitness. Metabolism. 50 (7), 841–848. doi:10.1053/meta.2001.24190
Kim H., Kim M., Kojima N., Fujino K., Hosoi E., Kobayashi H., et al. (2016). Exercise and nutritional supplementation on community-dwelling elderly Japanese women with sarcopenic obesity: A randomized controlled trial. J. Am. Med. Dir. Assoc. 17 (11), 1011–1019. doi:10.1016/j.jamda.2016.06.016
Ko G., Tang J., Chan J., Sung R., Wu M., Wai H., et al. (2001). Lower BMI cut-off value to define obesity in Hong Kong Chinese: An analysis based on body fat assessment by bioelectrical impedance. Br. J. Nutr. 85 (2), 239–242. doi:10.1079/bjn2000251
Koltai E., Hart N., Taylor A., Goto S., Ngo J., Davies K., et al. (2012). Age-associated declines in mitochondrial biogenesis and protein quality control factors are minimized by exercise training. Am. J. Physiol. Regul. Integr. Comp. Physiol. 303 (2), R127–R134. doi:10.1152/ajpregu.00337.2011
Kurniawan L., Bahrun U., Hatta M., Arif M. (2018). Body mass, total body fat percentage, and visceral fat level predict insulin resistance better than waist circumference and body mass index in healthy young male adults in Indonesia. J. Clin. Med. 7 (5), E96. doi:10.3390/jcm7050096
Lee D., Shook R., Drenowatz C., Blair S. (2016). Physical activity and sarcopenic obesity: Definition, assessment, prevalence and mechanism. Future Sci. OA 2 (3), FSO127. doi:10.4155/fsoa-2016-0028
Lee Y. H., Lee P. H., Lin L. F., Liao C. D., Liou T. H., Huang S. W. (2021). Effects of progressive elastic band resistance exercise for aged osteosarcopenic adiposity women. Exp. Gerontol. 147, 111272. doi:10.1016/j.exger.2021.111272
Legrand D., Vaes B., Matheï C., Adriaensen W., Van Pottelbergh G., Degryse J. (2014). Muscle strength and physical performance as predictors of mortality, hospitalization, and disability in the oldest old. J. Am. Geriatr. Soc. 62 (6), 1030–1038. doi:10.1111/jgs.12840
Li B. W., Feng L. L., Tian Z. J. (2021). Research progress of the role of IGF-1 in metabolic diseases and the effect of exercise intervention. Acta Physiol. Sin. 73 (02), 342–352. doi:10.13294/j.aps.2021.0014
Li L., Wang C., Bao Y., Peng L., Gu H., Jia W. (2012). Optimal body fat percentage cut-offs for obesity in Chinese adults. Clin. Exp. Pharmacol. physiology 39 (4), 393–398. doi:10.1111/j.1440-1681.2012.05684.x
Li S., Huang L. P., Wang L., Chen Y. W., Li L. K., Zhang L., et al. (2020). Effects of 12 weeks aerobic exercise combined with high speed strength training on old adults with osteosarcopenic obesity syndrome. Chin. J. Rehabilitation Med. 35 (4), 420–426. doi:10.3969/j.issn.1001-1242.2020.04.007
Liao C. D., Tsauo J. Y., Huang S. W., Ku J. W., Hsiao D. J., Liou T. H. (2018). Effects of elastic band exercise on lean mass and physical capacity in older women with sarcopenic obesity: A randomized controlled trial. Sci. Rep. 8 (1), 2317. doi:10.1038/s41598-018-20677-7
Liao C. D., Tsauo J. Y., Lin L. F., Huang S. W., Ku J. W., Chou L. C., et al. (2017). Effects of elastic resistance exercise on body composition and physical capacity in older women with sarcopenic obesity: A CONSORT-compliant prospective randomized controlled trial. Med. (United States) 96 (23), e7115. doi:10.1097/MD.0000000000007115
Lim H., Park Y., Suh K., Yoo M., Park H., Kim H., et al. (2018). Association between sarcopenia, sarcopenic obesity, and chronic disease in Korean elderly. J. Bone Metab. 25 (3), 187–193. doi:10.11005/jbm.2018.25.3.187
Lim S., Kim J., Yoon J., Kang S., Choi S., Park Y., et al. (2010). Sarcopenic obesity: Prevalence and association with metabolic syndrome in the Korean longitudinal study on health and aging (KLoSHA). Diabetes care 33 (7), 1652–1654. doi:10.2337/dc10-0107
Lu L., Mao L., Feng Y., Ainsworth B., Liu Y., Chen N. (2021). Effects of different exercise training modes on muscle strength and physical performance in older people with sarcopenia: A systematic review and meta-analysis. BMC Geriatr. 21 (1), 708. doi:10.1186/s12877-021-02642-8
Lu X., Chu H., Wang L., Yang R., Li Y., Sun W., et al. (2020). Age- and sex-related differences in muscle strength and physical performance in older Chinese. Aging Clin. Exp. Res. 32 (5), 877–883. doi:10.1007/s40520-019-01263-x
Maher C. G., Catherine S., Herbert R. D., Moseley A. M., Mark E. (2003). Reliability of the PEDro Scale for rating quality of randomized controlled trials. Phys. Ther. 83 (8), 713–721. doi:10.1093/ptj/83.8.713
Mak R. H., Cheung W. W., Zhan J. Y., Shen Q., Foster B. J. (2011). Cachexia and protein-energy wasting in children with chronic kidney disease. Pediatr. Nephrol. 27 (2), 173–181. doi:10.1007/s00467-011-1765-5
Martínez-Amat A., Aibar-Almazán A., Fábrega-Cuadros R., Cruz-Díaz D., Jiménez-García J., Pérez-López F., et al. (2018). Exercise alone or combined with dietary supplements for sarcopenic obesity in community-dwelling older people: A systematic review of randomized controlled trials. Maturitas 110, 92–103. doi:10.1016/j.maturitas.2018.02.005
Mitchell W., Williams J., Atherton P., Larvin M., Lund J., Narici M. (2012). Sarcopenia, dynapenia, and the impact of advancing age on human skeletal muscle size and strength; a quantitative review. Front. Physiol. 3, 260. doi:10.3389/fphys.2012.00260
Nelson R. H. (2013). Hyperlipidemia as a risk factor for cardiovascular disease. Prim. Care 40 (1), 195–211. doi:10.1016/j.pop.2012.11.003
Newman A., Kupelian V., Visser M., Simonsick E., Goodpaster B., Nevitt M., et al. (2003). Sarcopenia: Alternative definitions and associations with lower extremity function. J. Am. Geriatr. Soc. 51 (11), 1602–1609. doi:10.1046/j.1532-5415.2003.51534.x
Park J., Kwon Y., Park H. (2017). Effects of 24-week aerobic and resistance training on Carotid Artery intima-media thickness and flow velocity in elderly women with sarcopenic obesity. J. Atheroscler. Thromb. 24 (11), 1117–1124. doi:10.5551/jat.39065
Rosen E., Spiegelman B. (2006). Adipocytes as regulators of energy balance and glucose homeostasis. Nature 444 (7121), 847–853. doi:10.1038/nature05483
Rossi A., Bianchi L., Volpato S., Bandinelli S., Guralnik J., Zamboni M., et al. (2017). Dynapenic abdominal obesity as a predictor of worsening disability, hospitalization, and mortality in older adults: Results from the InCHIANTI study. J. Gerontol. A Biol. Sci. Med. Sci. 72 (8), 1098–1104. doi:10.1093/gerona/glw203
Sáinz N., Rodríguez A., Catalán V., Becerril S., Ramírez B., Gómez-Ambrosi J., et al. (2010). Leptin administration downregulates the increased expression levels of genes related to oxidative stress and inflammation in the skeletal muscle of ob/ob mice. Mediat. Inflamm. 2010, 784343. doi:10.1155/2010/784343
Schaap L., Pluijm S., Deeg D., Visser M. (2006). Inflammatory markers and loss of muscle mass (sarcopenia) and strength. Am. J. Med. 119 (6), 526.e9–526.17. doi:10.1016/j.amjmed.2005.10.049
Schrager M., Metter E., Simonsick E., Ble A., Bandinelli S., Lauretani F., et al. (2007). Sarcopenic obesity and inflammation in the InCHIANTI study. J. Appl. Physiol. 102 (3), 919–925. doi:10.1152/japplphysiol.00627.2006
Studenski S., Peters K., Alley D., Cawthon P., McLean R., Harris T., et al. (2014). The FNIH sarcopenia project: Rationale, study description, conference recommendations, and final estimates. J. Gerontol. A Biol. Sci. Med. Sci. 69 (5), 547–558. doi:10.1093/gerona/glu010
Theodorakopoulos C., Jones J., Bannerman E., Greig C. (2017). Effectiveness of nutritional and exercise interventions to improve body composition and muscle strength or function in sarcopenic obese older adults: A systematic review. Nutr. Res. 43, 3–15. doi:10.1016/j.nutres.2017.05.002
Tian S., Xu Y. (2016). Association of sarcopenic obesity with the risk of all-cause mortality: A meta-analysis of prospective cohort studies. Geriatr. Gerontol. Int. 16 (2), 155–166. doi:10.1111/ggi.12579
United Nations, D.o.E.a.S.A., Population Division (2019). World population Prospects: The 2019 revision. www.un.org.
Use W. H. O. E. C. o. P. S. t., Anthropometry I. o. (1995). Physical status: The use and interpretation of anthropometry. Report of a WHO Expert committee. Geneva, Switz. WHO 1995 (8546), 1–452. doi:10.1002/(SICI)1520-6300(1996)8
Vasconcelos K. S. S., Dias J. M. D., Araujo M. C., Pinheiro A. C., Moreira B. S., Dias R. C. (2016). Effects of a progressive resistance exercise program with high-speed component on the physical function of older women with sarcopenic obesity: A randomized controlled trial. Braz. J. Phys. Ther. 20 (5), 432–440. doi:10.1590/bjpt-rbf.2014.0174
Vincent H., Raiser S., Vincent K. (2012). The aging musculoskeletal system and obesity-related considerations with exercise. Ageing Res. Rev. 11 (3), 361–373. doi:10.1016/j.arr.2012.03.002
Vrabel M. (2015). Preferred reporting items for systematic reviews and meta-analyses. Oncol. Nurs. Forum 42 (5), 552–554. doi:10.1188/15.onf.552-554
Wang L. Z., Guo Y. B., Lou J. H. (2019). Effects of home exercise on sarcopenia obesity for aging people. Chin. J. Rehabil. Theory Pract. 25 (1), 90–96. doi:10.3969/j.issn.1006⁃9771.2019.01.012
Wang Y., Song Y. L., Meng L. P., Chen Z. G., Zhang Y., Chen Y. H., et al. (2016). Study on skeletal muscle mass of 1 836 check-up adults and its association with age in Qiqihar. Zhonghua Yu Fang. Yi Xue Za Zhi 50 (03), 235–238. doi:10.3760/cma.j.issn.0253-9624.2016.03.009
Wijesinghe S., Nicholson T., Tsintzas K., Jones S. (2021). Involvements of long noncoding RNAs in obesity-associated inflammatory diseases. Obes. Rev. 22 (4), e13156. doi:10.1111/obr.13156
Withrow D., Alter D. (2011). The economic burden of obesity worldwide: A systematic review of the direct costs of obesity. Obes. Rev. 12 (2), 131–141. doi:10.1111/j.1467-789X.2009.00712.x
Keywords: exercise, body composition, muscle mass, muscle strength, physical performance, inflammation, insulin-like growth factor 1, lipids profiles
Citation: Zhuang M, Jin M, Lu T, Lu L, Ainsworth BE, Liu Y and Chen N (2022) Effects of three modes of physical activity on physical fitness and hematological parameters in older people with sarcopenic obesity: A systematic review and meta-analysis. Front. Physiol. 13:917525. doi: 10.3389/fphys.2022.917525
Received: 13 April 2022; Accepted: 20 July 2022;
Published: 25 August 2022.
Edited by:
Giuseppe D'Antona, University of Pavia, ItalyReviewed by:
Tiziana Pietrangelo, University of Studies G. d'Annunzio Chieti and Pescara, ItalyXu Yan, Victoria University, Australia
Copyright © 2022 Zhuang, Jin, Lu, Lu, Ainsworth, Liu and Chen. This is an open-access article distributed under the terms of the Creative Commons Attribution License (CC BY). The use, distribution or reproduction in other forums is permitted, provided the original author(s) and the copyright owner(s) are credited and that the original publication in this journal is cited, in accordance with accepted academic practice. No use, distribution or reproduction is permitted which does not comply with these terms.
*Correspondence: Yu Liu, eXVsaXVAc3VzLmVkdS5jbg==; Nan Chen, Y2hlbm5hbnJlaDIwMjBAMTI2LmNvbQ==
†These authors have contributed equally to this work and shared the first authorship