 Yu Zhu
 Saeed Mirsadraee2,3
 John Pepper
 Xiao Yun Xu
95% of researchers rate our articles as excellent or good
Learn more about the work of our research integrity team to safeguard the quality of each article we publish.
Find out more
ORIGINAL RESEARCH article
Front. Physiol. , 14 June 2022
Sec. Computational Physiology and Medicine
Volume 13 - 2022 | https://doi.org/10.3389/fphys.2022.913457
This article is part of the Research Topic Modeling of Cardiovascular Systems View all 9 articles
This study aimed to evaluate the effect of aortic wall compliance on intraluminal hemodynamics within surgically repaired type A aortic dissection (TAAD). Fully coupled two-way fluid-structure interaction (FSI) simulations were performed on two patient-specific post-surgery TAAD models reconstructed from computed tomography angiography images. Our FSI model incorporated prestress and different material properties for the aorta and graft. Computational results, including velocity, wall shear stress (WSS) and pressure difference between the true and false lumen, were compared between the FSI and rigid wall simulations. It was found that the FSI model predicted lower blood velocities and WSS along the dissected aorta. In particular, the area exposed to low time-averaged WSS (
Aortic dissection (AD) occurs when the inner layer of the aortic wall tears and blood flows in between the inner and outer layers of the wall, developing a false lumen (FL) in the aortic wall alongside the original true lumen (TL). Based on the most widely used Standford classification system, AD can be divided into type A and B, depending on the location of primary entry tear: type A if the entry tear is located in the ascending aorta and the arch, whilst type B when the entry tear is situated in the descending aorta. Type A aortic dissection (TAAD) represents a more lethal condition than type B aortic dissection (TBAD), which requires urgent surgical intervention to reduce its life-threatening complications. An established surgical technique for the treatment of TAAD is to replace the ascending aorta that involves the primary entry tear with a synthetic graft. In spite of having the lowest reported perioperative risk and overall mortality (Westaby et al., 2002), this conservative surgical approach usually results in incomplete resection of re-entry tears in the arch and descending aorta, which increases the risk of late complications such as aneurysmal dilatation of the remaining dissected aorta (Halstead et al., 2007). With a persistent patent FL, 29.3% of patients were reported to die from rupture of the residual dissected aorta (DeBakey et al., 1982).
To prevent sudden aortic rupture and late death, efforts have been made to identify risk factors for aortic dilatation following TAAD repair. In addition to anatomical features, such as maximum aortic diameter and FL patency (Fattori et al., 2000; Halstead et al., 2007; Zierer et al., 2007; Rylski et al., 2017), certain hemodynamic parameters have been reported to correlate with progressive aortic dilatation, including luminal pressure difference between TL and FL (Zhu et al., 2021; Zhu et al., 2022) and flow velocities through tears (Shad et al., 2021). However, these hemodynamic parameters were obtained from computational fluid dynamics (CFD) simulations with a rigid wall assumption. In reality, the aorta expands and contracts in response to the pulsation of blood pressure, and recent computational studies of TBAD have shown the influence of wall compliance on predicted luminal pressure and volumetric flow rate (Bonfanti et al., 2017; Chong et al., 2020). Therefore, it is necessary to evaluate the dynamic effects of moving wall on blood flow in the surgically repaired TAAD by fluid-structure interaction (FSI) simulation.
Building an FSI model of AD is very challenging since the wall thickness and material properties vary in different components of the vessel wall and are difficult to measure in vivo. Additionally, the complexity of the model will demand extensive computational resources for FSI simulation. In the last decade, only a few FSI simulations of TBAD have been reported, either by using simplified and idealized models (Chen et al., 2016; Ryzhakov et al., 2019; Chong et al., 2020) or patient-specific geometries (Alimohammadi et al., 2015; Qiao et al., 2015; Qiao et al., 2019; Zimmermann et al., 2021). Chong et al. (2020) assessed the effect of intimal flap motion on flow in TBAD. Despite using an idealized model, the maximum flap motion reached 4.6 mm and thus significantly altered the predicted hemodynamic parameters as compared to the rigid wall models. In two patient-specific TBAD FSI studies, the obtained results were also compared with those from rigid wall models (Alimohammadi et al., 2015; Qiao et al., 2019). These studies demonstrated that although spatial distributions of time-averaged wall shear stress (TAWSS) obtained with FSI and rigid wall models had similar trend, there were marked differences in the predicted oscillatory shear index.
The aforementioned FSI studies focused on TBAD. Only two studies were found that involved FSI simulations of residual TBAD patients with the ascending aortas being replaced with synthetic grafts (Bäumler et al., 2020; Khannous et al., 2020). Bäumler et al. (2020) developed a sophisticated FSI model by including pre-stress, external tissue support, geometry tethering, as well as a regionally defined flap elasticity with variable values. Their results showed an overall good agreement with 4-D magnetic resonance imaging (MRI) data. However, the synthetic graft, which is much stiffer than the aortic wall, was not modelled in their study. Moreover, comparison with the corresponding rigid wall CFD simulation results was not reported, which is in fact of great interest.
In this study, to gain more knowledge of how wall compliance may influence intraluminal hemodynamics, FSI simulations have been performed on two repaired TAAD models. Our FSI model not only incorporates pre-stress but also applies different material properties and wall thickness for the aorta and graft. Additional simulations have been carried out to evaluate the effects of dissection wall stiffness. The obtained results are compared with those from the rigid wall models of the same patients, with particular attention to pressure difference between the TL and FL.
Two patients with repaired TAAD were retrospectively selected from the validated database of patients at the Royal Brompton and Harefield hospitals, United Kingdom. The first patient was a 44-year-old male who underwent graft replacement of the ascending aorta. Computed tomography angiography (CTA) in this patient was performed on a Sensation 64 scanner (Siemens Medical Solutions, Germany), where the slice thickness and increment of CTA images were 1-mm. The second patient was a 51-year-old male, who underwent replacement of the aortic valve and ascending aorta for TAAD 4 years prior to CTA scan. This patient was examined by a SOMATOM Definition Flash scanner (Siemens Medical Solutions, Germany), and the images were reconstructed with 0.75-mm slice thickness and 0.5-mm slice increment. All medical data included in this study complied with the Declaration of Helsinki and were approved by the Institutional committee of Health Research Authority (HRA) and Health and Care Research Wales (HCRW). Need for patients’ informed consent was waived.
The patient-specific geometries of post-surgical TAAD were reconstructed from the CTA images using Mimics 20.0 (Materialise, Leuven, Belgium). For each patient, the computational model was created from the aortic sinotubular junction to the level of diaphragm. Three main arch branches were also included in the reconstructions, as shown in Figure 1A. The reconstructed geometry was not only used as the 3-D fluid domain but also provided the inner surface of the wall in the FSI model. The wall structural domain was created by uniformly extruding the undissected equivalent of the inner wall by 1.4 mm for the aorta and the intimal flap (van Puyvelde et al., 2016) and by 0.65 mm for the Dacron graft (Nagano et al., 2007), as shown in Figure 1B.
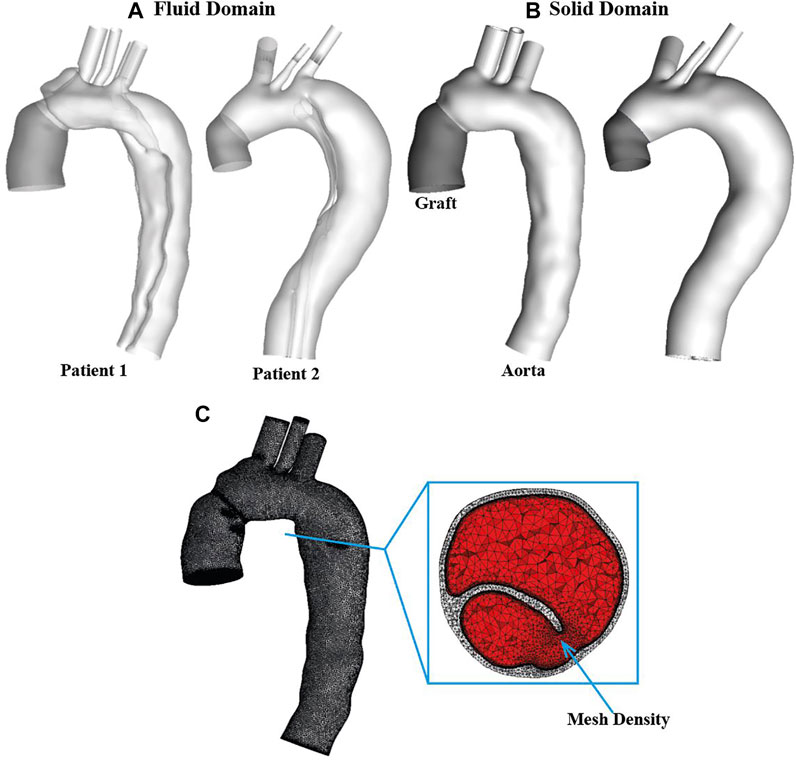
FIGURE 1. Two patient-specific type A aortic dissection models for reconstructed for (A) fluid domain and (B) structural domain. Graft is shown in dark grey while the aorta is shown in light grey. Detailed mesh elements are shown for (C) fluid-structure interaction model. It can be seen clearly that the solid domain (light grey) was discretized into tetrahedral elements, while the fluid domain (red) was meshed with a tetrahedral core and prismatic layers at the wall. Moreover, a region with mesh density is indicated by arrow.
The fluid and solid domains were then meshed separately using ANSYS ICEM CFD 19.2 (ANSYS, Canonsburg, PA, United States). As shown in Figure 1C, for each geometry, the structural domain was discretized into unstructured tetrahedral meshes comprising approximately 0.85 and 0.1 million elements for the aorta and graft, respectively, whereas the fluid domain was meshed with a tetrahedral core and 10 prismatic layers at the wall comprising of around 1.5 million elements. Mesh sensitivity tests were carried out for both fluid and solid domains and the corresponding results are summarized in Supplementary Material S1A.
At the inlet of fluid domain, a scaled patient-specific flow waveform was imposed along with the assumption of a flat velocity profile. A 3-element windkessel model (3-EWM) was imposed at each outlet. Details of the applied boundary conditions for flow analysis can be found in our previous study (Zhu et al., 2021). Blood was assumed to be incompressible and Newtonian with a constant density of 1,060 kg/m3 and dynamic viscosity of 0.004 Pa.s. Flow in a dissected aorta is likely to become transitional or turbulent induced by geometric features, such as a narrow tear or highly compressed TL. To account for possible turbulence behavior, the hybrid
Both the graft and aortic walls were modelled as isotropic, homogenous and linear elastic materials. The Dacron graft used to replace the ascending aorta is made of polyethylene terephthalate (PET), with a reported Poisson’s ratio of 0.3 and Young’s modulus of 7.8 MPa (Weltert et al., 2009). A Young’s modulus of 1.3 MPa was found to be comparable to in vivo aortic wall compliance (Zimmermann et al., 2021) and thus adopted for the dissected aortic wall and intimal flap in this study. To assess the impact of aortic stiffness on the predicted results, additional FSI simulations were run for patient 1 with different Young’s moduli: 1.08 and 2 MPa, representing more compliant (Patient 1A) and stiffer (Patient 1B) aortic wall behaviors, respectively. Both values were used in previous FSI studies of aorta (Wang and Li, 2011; Chen et al., 2016; Ryzhakov et al., 2019; Qiao et al., 2021). Moreover, a Poisson’s ratio of 0.49 was applied to the aortic wall, even though it is usually considered incompressible (Bäumler et al., 2020). The aortic root motion was neglected in this study. Therefore, zero-displacement constraints were applied at the inlet, at the distal ends of three arch vessels, as well as at the mid-descending aorta of the structural domain. Rayleigh damping
The CTA images of both patients were obtained at diastole and thus the reconstructed geometries represented the aorta configurations under a diastolic intraluminal blood pressure, necessitating the estimation of prestress to account for physiological initial loading state. The prestress was calculated using Ansys Static Structural solver (ANSYS, Canonsburg, PA, United States), based on the method described by Votta et al. (2017) and modified by Kan et al. (2021). Briefly, pressure distributions from the last time-step of the rigid wall CFD simulation were exported and then mapped onto the internal surface of the aortic wall model. The structural domain was deformed, and the corresponding Cauchy stress tensor was exported, which was then prescribed as initial stress state for the next simulation. This procedure was repeated until the maximum deformation of the structural domain was less than 0.5 mm under a diastolic pressure loading. Therefore, the prestress tensor equivalent to the diastolic phase was obtained and applied in the FSI simulation. It should be mentioned that the same material property and setups as the final FSI simulation were used for prestress calculation.
The wall models of both patients were solved using ANSYS Transient Structure solver, while the pulsatile blood flow was solved using ANSYS CFX 19.2. The two-way FSI simulation was then performed using ANSYS system coupling (ANSYS, Canonsburg, PA, United States), which couples ANSYS Structure and ANSYS CFX through a partitioned approach.
The arbitrary Lagrangian-Eulerian (ALE) method was applied for FSI, which utilizes the best features of both, Lagrangian and Eulerian approaches, and combines them into one. The Lagrangian approach is typically adopted in solid mechanics to define the structural domain as each node of the computational element follows the associated material particle during motion. The Eulerian method is widely used in fluid dynamics as the computational element in the fluid domain is fixed in space and the continuum moves with respect to the grid. A FSI model can be considered as a combination of three coupled sub-problems: a geometry problem that defines a new reference configuration, namely, the ALE map; and fluid and solid problems which comprise the conservation equations for the fluid and solid, respectively (Crosetto et al., 2011).
In the ALE configuration, the continuity and momentum equations governing the blood flow are given as:
where
The governing equation for the structural domain is given by the following momentum conservation equation:
where
where
To maintain the quality of the fluid mesh, the mesh was smoothed using displacement diffusion method with mesh stiffness being blended with distance and small volumes. A coupled time-step of 0.005 s was specified. Within each coupled time-step, the iterations were repeated until a maximum number of iterations was reached or until the data transferred between solvers and all field equations were converged. In the fluid model, the maximum root mean square (RMS) residual of 10−5 was specified, whereas in the structural model, the maximum RMS residual was set as 10−3. The simulation results were and analysed using CEI Ensight 10 (CEI Inc., Apex, NC, United States).
The displacement contours of the aortic wall are shown in Figure 2 for all simulated FSI models at the time point when maximum displacement occurred, together with the corresponding maximum displacement waveforms over a cardiac cycle. In all cases, the aorta segment replaced by the synthetic graft and supra-aortic branches show very limited deformation, whereas noticeable displacements could be observed throughout the aortic arch and descending aorta. The maximum wall displacement occurred in the proximal descending aorta of both patients, with the values being 1.34 mm for patient 1 and 1.05 mm for patient 2. Multiple re-entry tears might result in less deformation in patient 2. Increasing aortic wall stiffness significantly reduced displacements over the entire cardiac cycle. The maximum displacement decreased from 1.46 to 0.97 mm when the Young’s modulus was doubled.
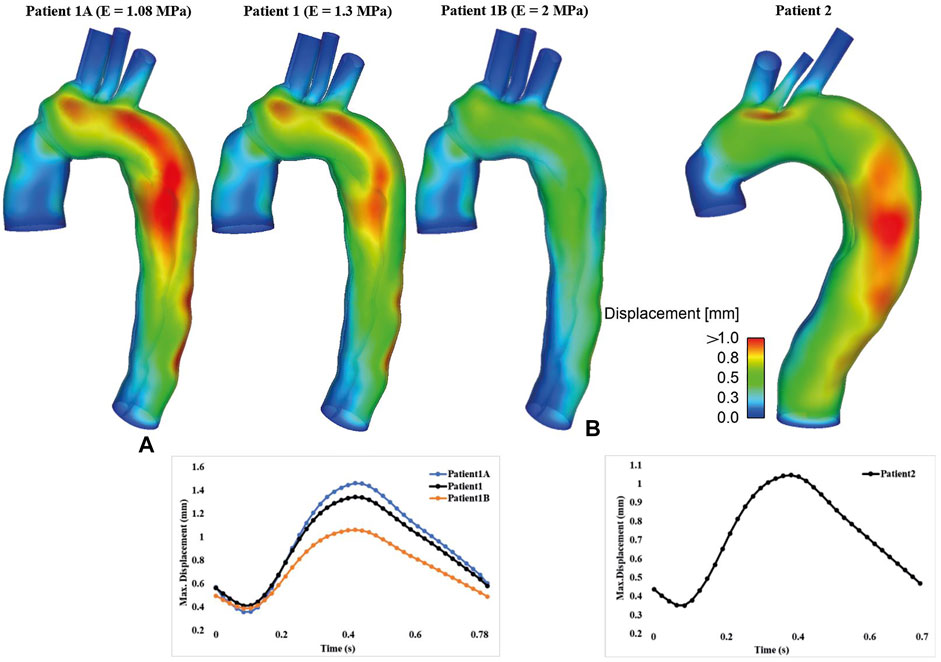
FIGURE 2. Spatial distribution of displacement (Top) and the corresponding temporal variations of maximum displacement (Bottom) are shown for (A) patient 1 and (B) patient 2. Moreover, displacement results for FSI models with different Young’s moduli were compared for patient 1.
Figure 3 shows instantaneous velocity streamlines obtained with the FSI simulations and the corresponding rigid wall models. In general, flow patterns at the systolic and maximum flow deceleration time points were similar, with high velocities through the tears and in regions with narrowed lumen, such as the distal descending TL of patient 1. Flow patterns obtained from the FSI and rigid wall models were qualitatively the same and quantitatively comparable, where the FSI models produced slightly lower blood velocities in the distal thoracic aorta compared to the rigid wall models.
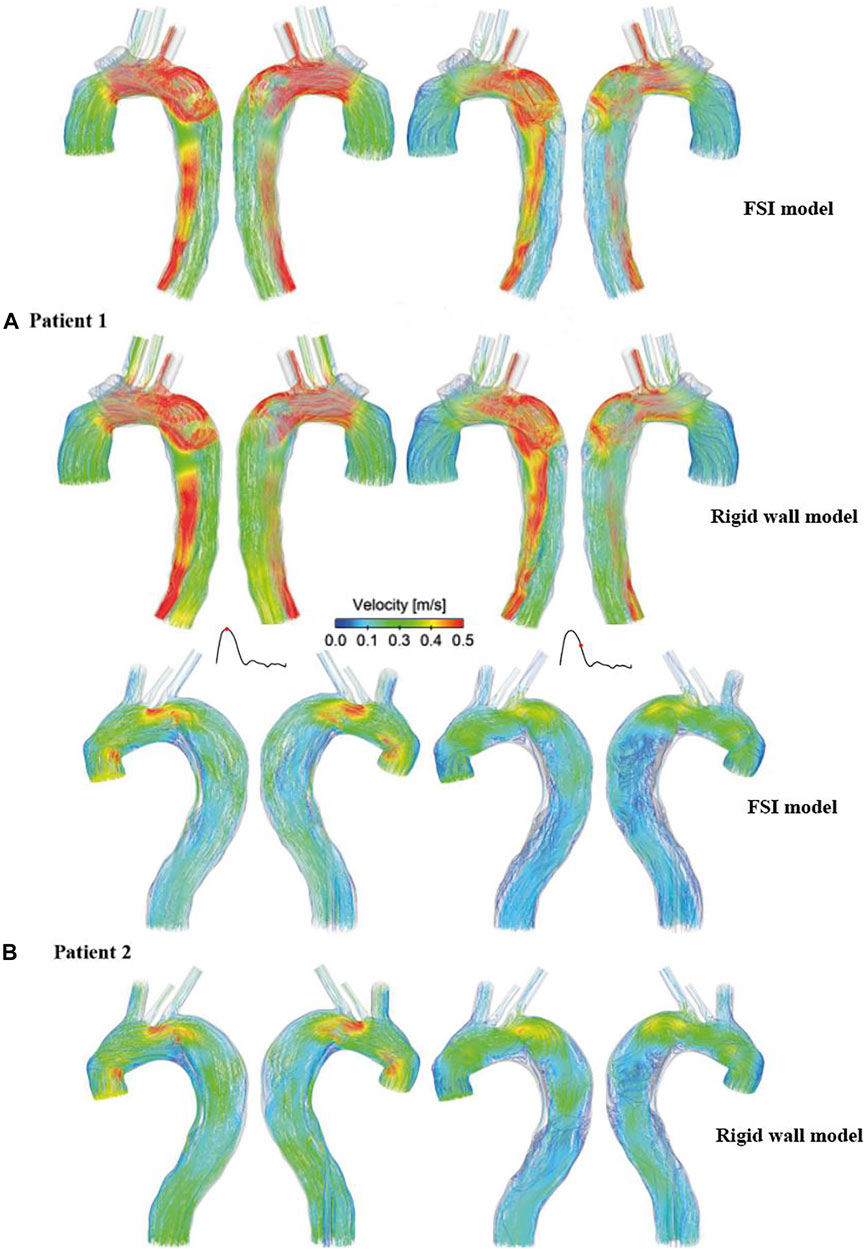
FIGURE 3. Comparison of instantaneous velocity streamlines obtained from the rigid wall models and FSI models of (A) patient 1 and (B) patient 2, at peak systole (left) and mid-systolic deceleration (right).
A more detailed quantitative comparison of velocity magnitudes was made between the rigid and FSI models. As shown in Figure 4, multiple cross-sectional planes were selected along the centerlines of the dissected aorta (six for patient 1 and seven for patient 2 depending on the aortic length), in order to calculate spatial-mean velocities, which were then averaged over a cardiac cycle and compared between different models. Quantitative comparisons revealed that FSI models generally predicted lower velocity magnitudes. This is expected since the aortic wall expands during systole, leading to an increase in lumen volume hence a reduction in velocities. Comparing FSI models of patient 1 with different Young’s moduli, a more compliant model produced lower velocity magnitudes, resulting from larger wall deformations, as shown in Figure 2.
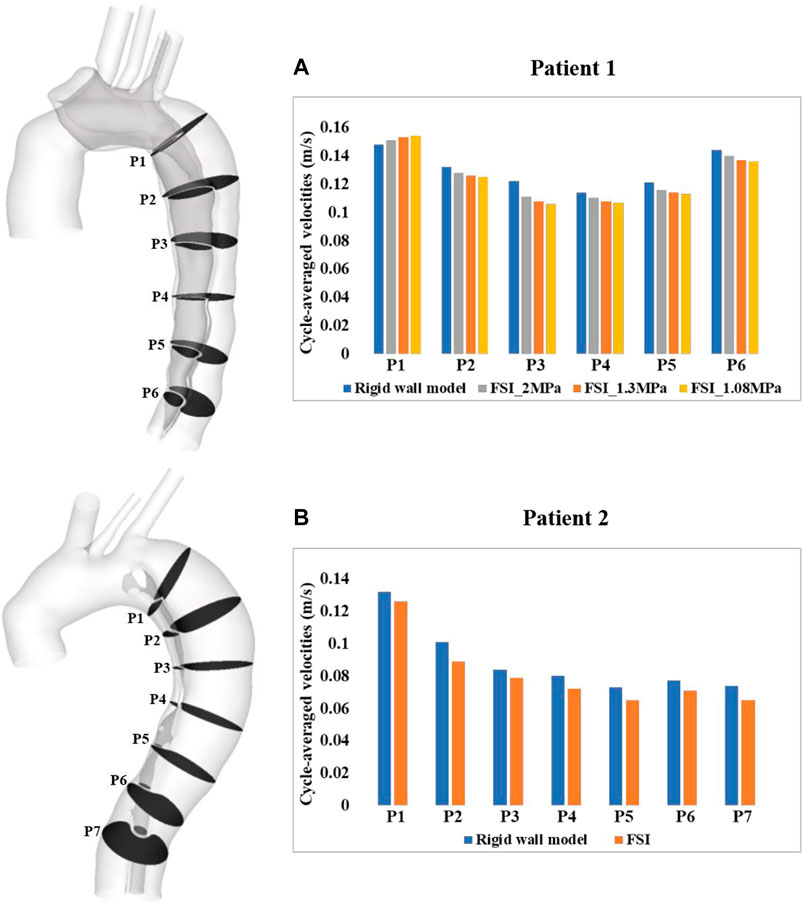
FIGURE 4. Quantitative comparison of cycle-averaged velocities at the selected cross-sectional planes along the aorta of (A) patient 1 and (B) patient 2. P1-P6/7 refer to cross-sectional planes along the centerlines of the dissected aorta. P1 is 2 cm distal from the origin of LSCA and P2-P6/7 are evenly spaced below P1 with an interval of 3 cm. Velocity magnitudes were also compared between the FSI models with different Young’s moduli in patient 1.
Figure 5 shows the comparison of volumetric flow rate at the primary entry tear and re-entry tear of patient 1, and at all re-entry tears of patient 2. Although FSI and rigid wall models displayed qualitatively similar trends in both patients, quantitative differences were observed. Over a cardiac cycle, the percentage of inflow passing through the primary entry tear and re-entry tear was 25.4% and 5.6%, respectively, in the FSI model of patient 1, and 28.5% and 6.1% for the rigid wall model. It was not possible to calculate the volumetric flow rate at the primary entry tear of patient 2 owing to its irregular shape. Nevertheless, −2.6%, 0.63%, 0.44%, and −0.06% of inflow passed through re-entry tears 1 to 4, respectively, in the FSI model, with the corresponding values being −2.6%, 0.6%, 0.83%, and −0.02% in the rigid wall model. It should also be noted that a positive value represents flow from the TL to FL, whereas a negative value indicates flow from the FL to TL. Moreover, increasing the aortic wall Young’s modulus from 1.08 to 2 MPa resulted in 6.9% and 5.1% increase in mean flow rate at the primary entry tear and re-entry tear, respectively.
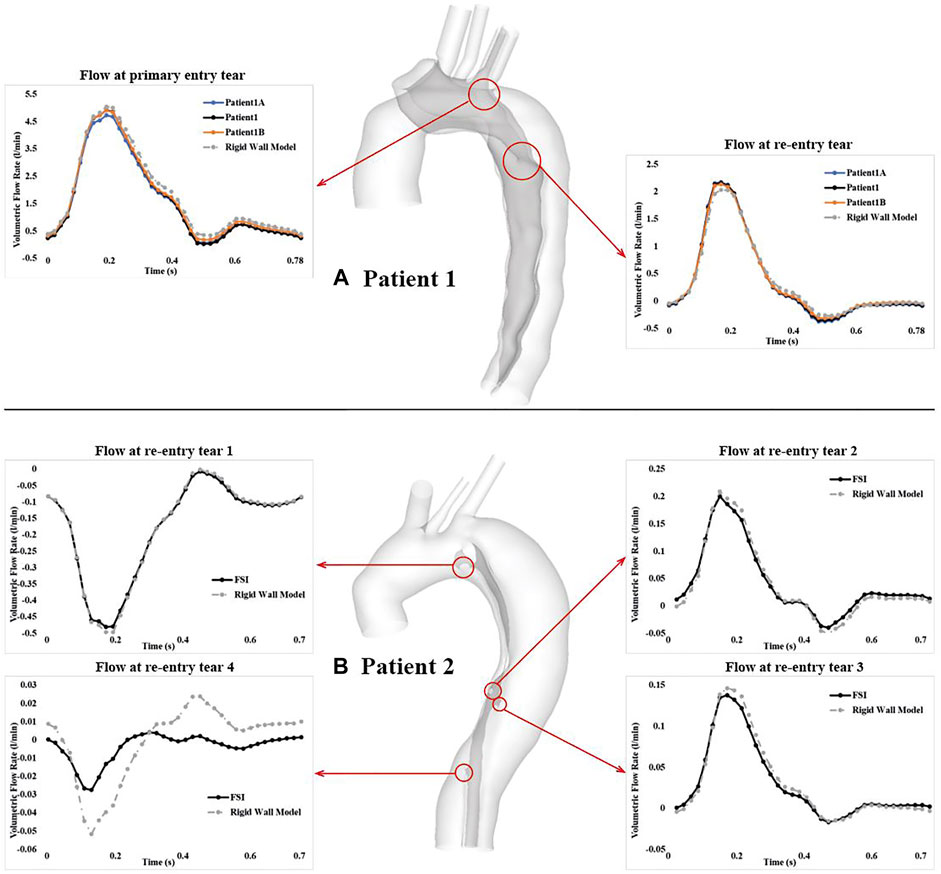
FIGURE 5. Comparison of volumetric flow rate over a cardiac cycle at the primary entry tear and re-entry tear of (A) patient 1, and at all 4 re-entry tears of (B) patient 2. Locations of all the tears are highlighted by the red cycles. Tear flows were also compared between the FSI models with different Young’s moduli in patient 1.
TAWSS was calculated using Eq. 7.
where
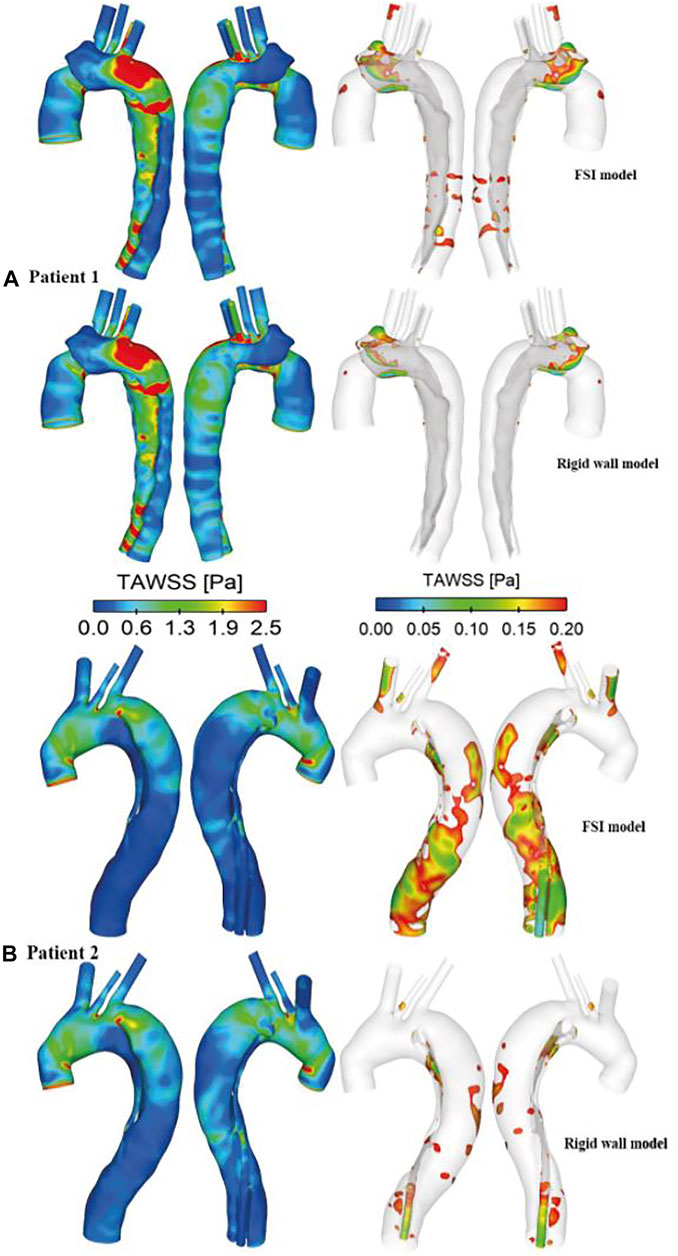
FIGURE 6. Comparison of time-averaged wall shear stress (TAWSS) distributions between the rigid wall and FSI models of (A) patient 1 and (B) patient 2. TAWSS distributions are displayed in different views to identify regions with high (>2.5 Pa, left) and low (<0.2 Pa, right) values.
A more detailed quantitative comparison of circumferential-averaged WSS (CWSS) was made between the rigid and FSI models, and the results are illustrated in Figure 7. The CWSS was evaluated as the spatial-averaged WSS along the intersection lines between the cross-sectional planes and the aortic walls including the flap, after which the cycle-averaged CWSS magnitudes were evaluated and compared for all the simulated models. Again, similar to velocity magnitudes, the FSI models of both patients produced lower CWSS values as a result of aorta expansion. Moreover, stiffer aortic wall led to slightly higher CWSS values, while the maximum difference among all cross-sectional clips between patient 1A (E = 1.08 MPa) and 1B (E = 2 MPa) is only 5.6%.
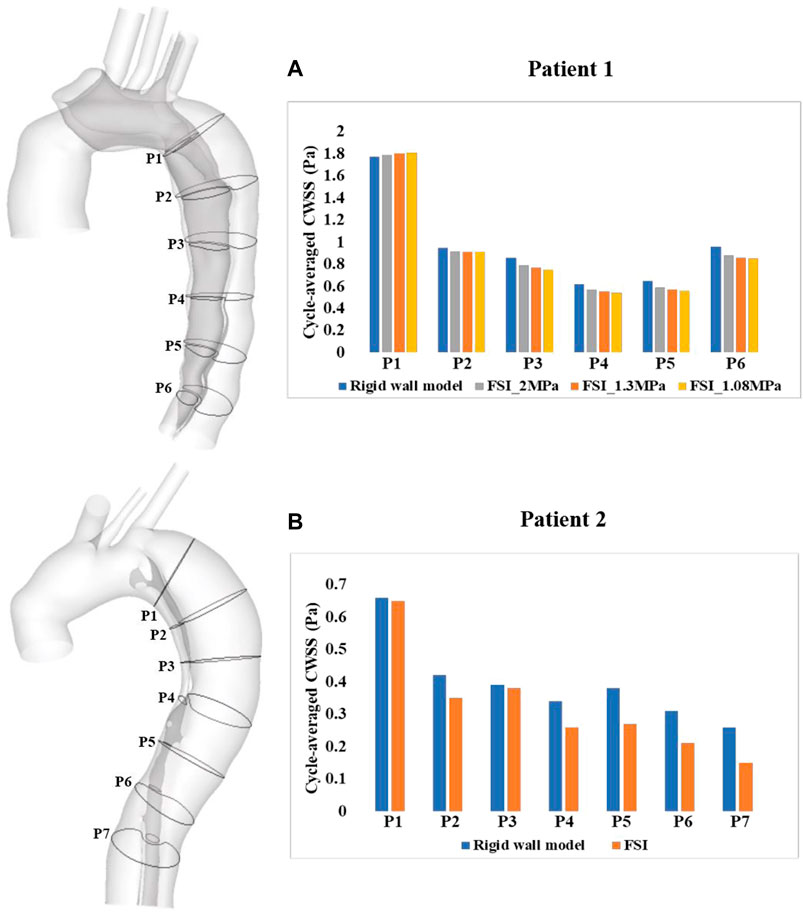
FIGURE 7. Quantitative comparison of cycle-averaged circumferential wall shear stress (CWSS), at the selected clips along the aorta of (A) patient 1 and (B) patient 2. P1-P6/7 refer to clips (intersection lines) between cross-sectional planes and the aortic walls. CWSS magnitudes were also compared between the FSI models with different Young’s moduli in patient 1.
Pressure distributions at two time points are shown in Figure 8. At peak systole, higher TL pressure can be observed throughout the descending aorta, especially in the proximal segment, while almost equal TL and FL pressures were found at end systole. Again, pressure distributions predicted by the FSI and rigid wall models were qualitatively comparable but quantitively different, where FSI models predicted higher wall pressures than the rigid wall models.
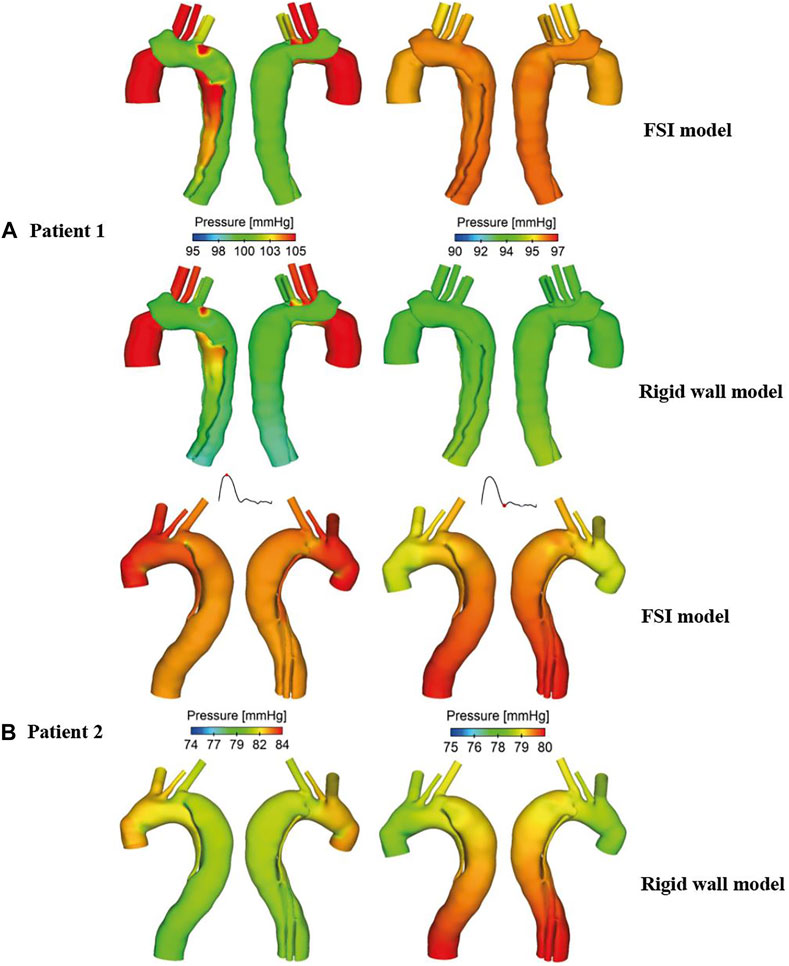
FIGURE 8. Comparison of pressure contours obtained from the rigid wall and FSI models of (A) patient 1 and (B) patient 2, at peak systole (left) and end systole (right).
Spatial mean pressures over a cardiac cycle were evaluated separately for the TL and FL at each cross-sectional plane. Then, differences between TL and FL pressures (PDTL-FL = PTL–PFL) were calculated, and within each cross-sectional plane, the maximum PDTL-FL over a cardiac cycle was determined. Figure 9 shows the quantitative comparison of the maximum luminal pressure differences predicted by different models. Irrespective of the location, incorporating wall compliance resulted in slightly increased pressure difference values in patient 1. The results are more comparable for patient 2. Although the maximum luminal pressure difference values were almost doubled in the distal descending aorta (e.g., P6 and P7), the absolute difference between the rigid wall and FSI models was small at approximately 0.2 mmHg. Furthermore, a more compliant aortic wall of patient 1 caused higher pressure difference between two lumens, though not significant.
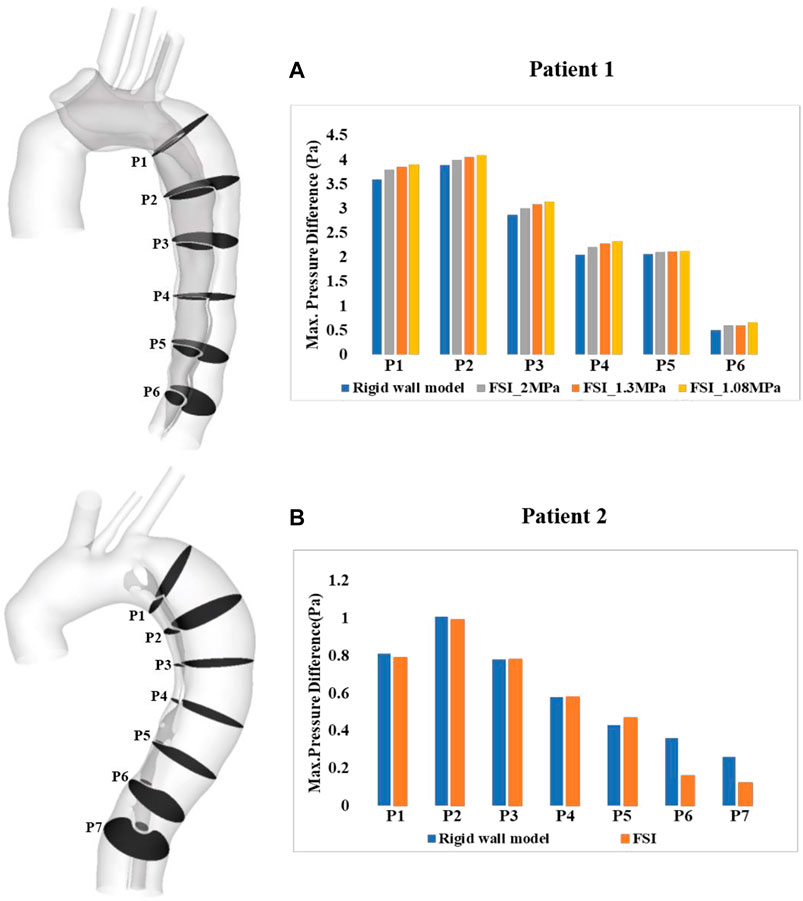
FIGURE 9. Quantitative comparison of pressure difference between the true and false lumen (PTL–PFL) at the selected cross-sectional planes along the aorta of (A) patient 1 and (B) patient 2. PTL–PFL values were also compared between the FSI models with different Young’s modulus in patient 1.
The level of turbulence, measured in terms of turbulence intensity, was also evaluated. This is defined as
where
where
Iso-surfaces of the turbulence intensity (
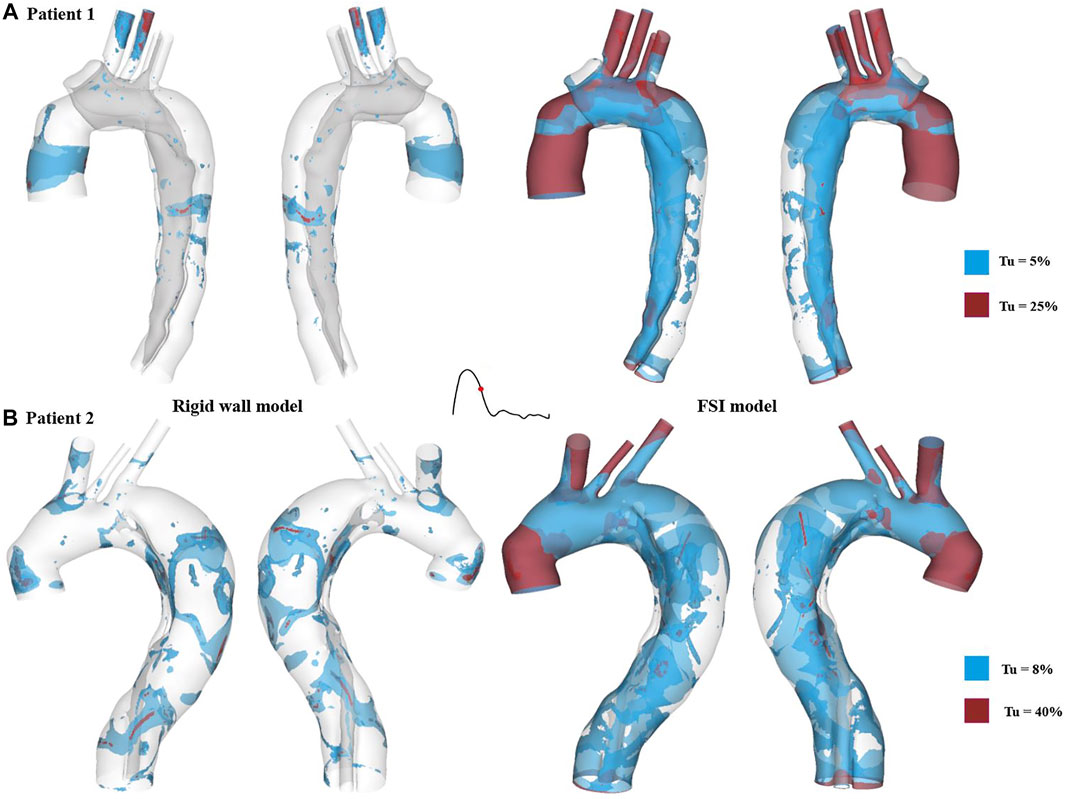
FIGURE 10. Turbulence intensity (Tu) iso-surfaces at mid-systolic deceleration for (A) patient 1 and (B) patient 2. Tu levels of approximately 5 % and 8% are shown in blue for patient 1 and patient 2, respectively, while much higher Tu levels are displayed in red (25% for patient 1 and 40% for patient 2).
Spatial distributions of von Mises stress obtained with the FSI models are shown in Figure 11, at the time point of peak systole. In both cases, peak stress values were found at the anastomosis between the graft and the aorta (as indicated by the black arrow), which could be attributed to the mismatch in material properties. Away from the graft, stress levels were much lower except at a few isolated high stress concentration spots (indicated by the red arrow) on the edge of tears and at sharp corners. The peak von Mises stress values at the graft-aorta interface increased from 1.05 to 1.15 MPa when the aortic wall Young’s modulus was reduced from 1.3 to 1.08 MPa, owing to larger difference in material properties between the graft and aortic wall.
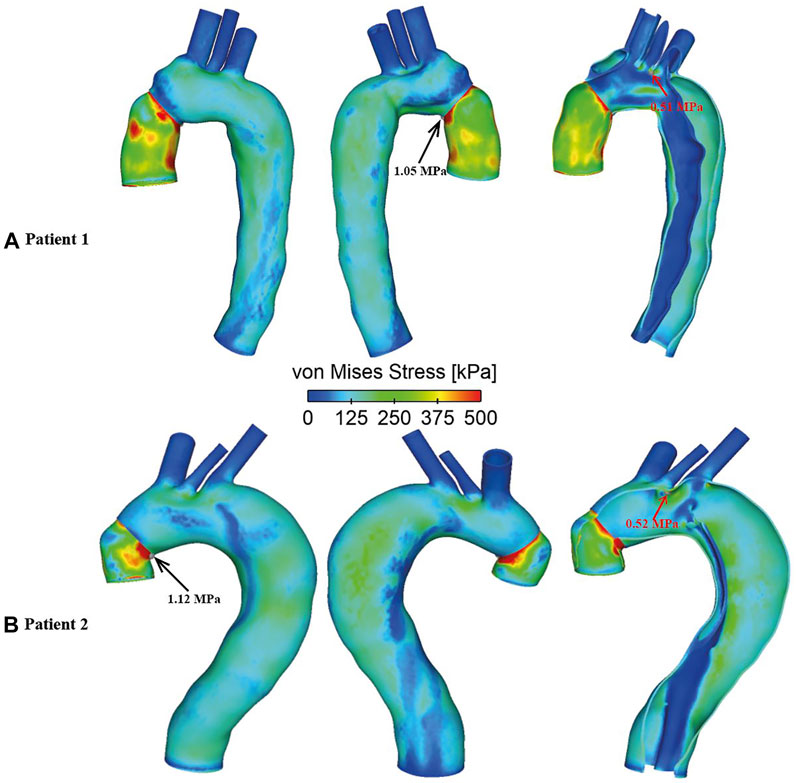
FIGURE 11. Spatial distributions of von Mises stress in FSI models for (A) Patient 1 and (B) Patient 2. Black arrows indicate the peak von Mises stress values observed at the graft-aorta interface, while red arrows indicate isolated hot spots of high von Mises stress in regions away from the graft.
Re-intervention in patients with progressive aortic dilatation after surgical repair of TAAD is typically based on aortic size and the rate of expansion. In our previous studies, a systematic examination of the flow patterns and hemodynamic factors in dissected aortas was performed, and possible links were identified between luminal pressure difference and the progression of aneurysmal dilatation (Zhu et al., 2021; Zhu et al., 2022). This study presents FSI simulations of two repaired TAAD patients, and the results from the FSI simulations are comprehensively compared with the corresponding CFD results to evaluate the assumption of rigid aortic wall. Moreover, the effect of aortic stiffness was assessed by applying various Young’s moduli to the aortic wall model of one patient.
Several studies have been published in recent years on FSI simulations of TBAD (Alimohammadi et al., 2015; Qiao et al., 2015; Chen et al., 2016; Qiao et al., 2019; Ryzhakov et al., 2019; Chong et al., 2020), in an attempt to understand the effect of wall motion on flow related parameters. Unfortunately, there were large variations in the extent of intimal flap movement incorporated in these models. Qiao et al. (2015) and Ryzhakov et al. (2019) predicted small flap displacements of up to 0.15 and 0.13 mm, respectively. In another FSI study conducted by Qiao et al. (2019), the maximum flap displacement was slightly larger than 0.6 mm, which was consistent with in vivo measurements of approximately 0.68 ± 0.2 mm in chronic dissections (Karmonik et al., 2012). Using an idealized model for acute dissections, Chong et al. (2020) simulated a more drastic flap motion of up to 4.6 mm. In a recent paper on residual TBAD, Bäumler et al. (2020) simulated much larger flap displacements of up to 13.4 mm, and they found that flap motion could be reduced from 13.4 to 1.4 mm by increasing the Young’s modulus from 20 to 800 kPa. The present study produced a maximum flap displacement of approximately 1 mm (Figure 2) in both patients. Decreasing aortic wall stiffness from E = 1.3 MPa to E = 1.08 MPa in patient 1 increased the maximum flap displacement from 1 mm to around 1.2 mm, which is comparable to the results reported by Bäumler et al. (2020) with the stiffest model (Eflap = 800 kPa).
Although the effect of wall compliance on flow patterns was negligible (Figure 3), its quantitative effect on velocity magnitudes was not trivial. In general, FSI models predicted lower blood velocities as compared to the rigid wall models, with the maximum difference among all cross-sectional planes reaching 11.5% and 11.9%, respectively, for patient 1 and 2. As mentioned above, aorta expansion during systole was responsible for reduced velocities. As shown in Figure 4A, although blood velocities were slightly increased by increasing aortic wall stiffness, the maximum difference between patient 1A (E = 1.08 MPa) and 1B (E = 2 MPa) was only 4.7%. In the rigid wall model, flow distribution to the innominate artery, left common carotid artery, and left subclavian artery was 8%, 3%, and 6%, respectively for patient 1, and 12%, 2%, and 4% for patient 2. Accounting for wall compliance did not alter the flow split among the model outlets. However, quantitative comparisons of tear flow in patient 1 revealed that blood flow entering the FL was reduced by 10.9% and 2.9%, through the primary entry tear and re-entry tear, respectively, in the FSI model. Decreasing wall stiffness from E = 1.3 MPa to E = 1.08 MPa further reduced mean flow rate at the primary entry tear and re-entry tear by 2.5% and 1.7%, respectively. Bäumler et al. (2020) reported opposite results where a more compliant flap model caused greater reduction in TL flow. However, they simulated a much wider range of flap mobility with a maximum flap displacement being almost 10 times of the displacement presented in our study. Moreover, at some cross-sectional locations, their flow split results obtained with the stiffest flap model showed better agreements with 4-D MRI data. In terms of patient 2, the amount of flow passing through all 4 re-entry tears were relatively small because of the small re-entry tear areas. Accounting for wall compliance had a notable influence on tear flow, especially at re-entry tear 4, where the mean flow rate was almost increased by three times. However, the absolute difference between the rigid wall and FSI models was only around 0.003 L/min.
Comparison of TAWSS between the rigid wall models and FSI models revealed little difference in its spatial distribution, but the magnitude of peak TAWSS predicted by the FSI model was slightly higher than (3.9%) that predicted by the rigid wall model in patient 1. In contrast to patient 1, the FSI model of patient 2 reduced the peak TAWSS magnitude by 3.6%, similar to the results reported by Alimohammadi et al. (2015) on TBAD. High WSS values have been associated with platelet activation in blood (Nobili et al., 2008), activity of which can potentially promote local thrombus formation. High WSS has also been related to degenerative lesions of the vessel wall and subsequent vessel enlargement (Ekaterinaris et al., 2006). On the other hand, Alimohammadi et al. (2015) observed that rigid wall assumption appeared to have a notable impact on the regions with low TAWSS values. In these regions, the TAWSS values were underestimated by more than 50% due to the near zero velocity values obtained by the rigid wall simulation. Therefore, regions with low TAWSS (
Blood flow was found to be highly disturbed with varying extent of flow recirculation in both true and false lumens, especially in regions surrounding the tears. Therefore, turbulence is likely to occur in the flow jet through a tear, where the peak Reynolds number can exceed 8,200 (Cheng et al., 2010). Turbulent flow within aortic aneurysms has been reported to cause extra stresses on the aneurysmal wall, increasing the rate of wall dilatation (Berguer et al., 2006; Khanafer et al., 2007). In order to capture potential turbulent flow in the post-surgery TAAD models, the SST-Tran model was adopted which allowed turbulence intensities (
von Mises stress is an index commonly used to identify high stress concentration spots and to assess the maximum wall stress in the aorta. The present FSI models revealed higher stress levels on the aortic wall concentrated near the tears and in highly tortuous regions, which coincided with some regions experiencing high TAWSS, indicating potential vulnerability of these regions to further increase in size. Yield stress of the dilated ascending aorta was reported to be approximately 1.2 ± 0.1 MPa in either circumferential or longitudinal directions (Vorp et al., 2003). Except a few isolated spots where extremely high stress values were found (as indicated by the red arrows in Figure 11), the aortic walls experienced wall stresses well below the threshold for rupture. Moreover, the spatial distribution of von Mises stress followed the same pattern for all simulated FSI cases with high stress concentration at the anastomosis between the graft and the native aorta, indicating a potential risk for future tear or rupture at this site.
Our previous studies have shown that higher pressure difference between TL and FL (PDTL-FL) may be associated with progressive aortic dilatation in repaired TAAD (Zhu et al., 2021; Zhu et al., 2022). However, one major limitation of these studies was that the CFD simulations were based on rigid wall assumptions and thereby assessing the effect of wall compliance on PDTL-FL is of particular interest in this study. Most of the previous FSI studies on TBAD did not investigate the influence of wall compliance on intraluminal pressure, for example, Alimohammadi et al. (2015) and Qiao et al. (2019) analyzed wall pressure distributions and they found that TL pressure was higher than the FL pressure in the proximal region but lower in the distal region. These findings were consistent with the early numerical studies based on rigid wall assumptions (Tse et al., 2011; Cheng et al., 2015). Bäumler et al. (2020) evaluated the mean pressure difference between the TL and FL with various flap elasticities and they found that the pressure difference decreased as the flap became more compliant. However, we cannot make a direct comparison with their results because they focused on evaluating the effect of flap stiffness while keeping the aortic wall Young’s modulus constant. In our model, the aortic wall and dissection flap were assumed to have the same elastic property, so the observed differences between simulations with different Young’s moduli was most likely attributed to different wall compliance than flap mobility. Comparing the results with the rigid wall models, FSI model increased luminal pressure differences in patient 1 but decreased pressure differences in patient 2. Nevertheless, among all cross-sectional planes, the maximum difference between the FSI and rigid wall models was 0.25 and 0.2 mmHg for patient 1 and 2, respectively. This was trivial considering that unstable aortic growth was found to occur in patients with a luminal pressure difference greater than 5 mmHg (Zhu et al., 2022).
It is well known that the mechanical behavior of aortic wall is anisotropic and nonlinear, and the material properties of a dissected wall would vary in different components of the vessel wall, such as in TL side, FL side and intimal flap. However, for simplicity, as well as due to the lack of available data in the literature, the current study assumed the aortic wall and intimal flap to be isotropic and linear elastic with the same material property. In a recently published finite element study on TBAD, Kan et al. (2021) fitted a hyperelastic material model to their tensile testing data on dissected aortic tissues and used the hyperelastic model in finite element simulations of stent-graft deployment in TBAD. A more realistic anisotropic constitutive model has been developed by Holzapfel et al. (2000) and applied in previous finite-element studies of abdominal aortic aneurysms to analyze the wall stress distribution and rupture risks (e.g., Roy et al., 2014). However, no such study has been reported for AD since there are very limited data available regarding the material parameters for the constitutive model. A similar approach as described by Kan et al. (2021) could be adopted in the future if more relevant tensile testing data becomes available, followed by applying the anisotropic model. In addition, a constant wall thickness was assumed for the aortic wall. This was another major assumption but unavoidable because CT images do not contain sufficient information for extraction of wall thickness. Furthermore, the aortic root motion was neglected, which can influence both hemodynamic and biomechanics in different parts of the aorta. For example, Jin et al. (2003) incorporated in their CFD model both radial expansion-contraction and translational motion of the aorta at the inlet, and their results showed best agreement with the in vivo MR data by capturing the clockwise migration of the peak velocity zone during systole, whereas the results obtained without accounting for the root motion failed to reproduce this behaviour. On the other hand, finite element analysis of the aorta also revealed that the aortic root downward motion could significantly increase the longitudinal stress in the ascending aorta (Singh et al., 2016). Therefore, aortic root motion should be included in future simulations. Finally, although our results are comparable with relevant data in the literature, a direct validation of the numerical results with 4D-flow MRI was absent, as CT is the standard imaging modality for diagnosis of TAAD.
Fully coupled two-way FSI simulations incorporating prestress were performed on two patient-specific TAAD models with surgically replaced ascending aorta. The flow patterns and TAWSS distributions were qualitatively comparable with those obtained from the rigid wall simulations, but quantitatively, FSI models reduced blood velocities and WSS magnitudes in both patients. The most notable effect of wall compliance on hemodynamic was regions with low TAWSS, which areas were increased with the FSI models by 81% and 311%, for patient 1 and 2, respectively. In addition, turbulence was significantly amplified with the FSI models, as presented by a great increase in regions with higher levels of turbulence intensity (
The original contribution presented in the study are included in the article/Supplementary Material, further inquiries can be directed to the corresponding author.
All medical data included in this study complied with the Declaration of Helsinki. This study was approved by the institutional committee of Health Research Authority (HRA) and Health and Care Research Wales (HCRW), on 04 May 2020. The REC reference is 20/WM/0145, and need for informed consent was waived.
YZ and SM: image acquisition and processing. YZ: simulation model design, data analysis, and manuscript preparation. SM, UR, and JP: clinical data collection and supervision. XX: supervision of the simulation work and data analysis. XX: critical revision of the manuscript. All authors contributed to the study design, revised the manuscript and approved the final submitted version.
This work was supported by the Royal Brompton and Harefield Hospitals Charity.
The authors declare that the research was conducted in the absence of any commercial or financial relationships that could be construed as a potential conflict of interest.
All claims expressed in this article are solely those of the authors and do not necessarily represent those of their affiliated organizations, or those of the publisher, the editors and the reviewers. Any product that may be evaluated in this article, or claim that may be made by its manufacturer, is not guaranteed or endorsed by the publisher.
The Supplementary Material for this article can be found online at: https://www.frontiersin.org/articles/10.3389/fphys.2022.913457/full#supplementary-material
Alimohammadi M., Sherwood J. M., Karimpour M., Agu O., Balabani S., Díaz-Zuccarini V. (2015). Aortic Dissection Simulation Models for Clinical Support: Fluid-Structure Interaction vs. Rigid Wall Models. Biomed. Eng. Online. 14, 34–16. doi:10.1186/s12938-015-0032-6
Bäumler K., Vedula V., Sailer A. M., Seo J., Chiu P., Mistelbauer G., et al. (2020). Fluid-structure Interaction Simulations of Patient-specific Aortic Dissection. Biomech. Model. Mechanobiol. 19, 1607–1628. doi:10.1007/s10237-020-01294-8
Berguer R., Bull J. L., Khanafer K. (2006). Refinements in Mathematical Models to Predict Aneurysm Growth and Rupture. Ann. N. Y. Acad. Sci. 1085, 110–116. doi:10.1196/annals.1383.033
Bonfanti M., Balabani S., Greenwood J. P., Puppala S., Homer-Vanniasinkam S., Díaz-Zuccarini V. (2017). Computational Tools for Clinical Support: a Multi-Scale Compliant Model for Haemodynamic Simulations in an Aortic Dissection Based on Multi-Modal Imaging Data. J. R. Soc. Interface. 14, 20170632. doi:10.1098/rsif.2017.0632
Chen D., Müller-Eschner M., Kotelis D., Böckler D., Ventikos Y., von Tengg-Kobligk H. (2013). A Longitudinal Study of Type-B Aortic Dissection and Endovascular Repair Scenarios: Computational Analyses. Med. Eng. Phys. 35, 1321–1330. doi:10.1016/j.medengphy.2013.02.006
Chen H. Y., Peelukhana S. V., Berwick Z. C., Kratzberg J., Krieger J. F., Roeder B., et al. (2016). Fluid-Structure Interaction Simulations of Aortic Dissection with Bench Validation. J. Vasc. Surg. 64, 1892. doi:10.1016/j.jvs.2016.10.006
Cheng Z., Tan F. P., Riga C. V., Bicknell C. D., Hamady M. S., Gibbs R. G., et al. (2010). Analysis of Flow Patterns in a Patient-specific Aortic Dissection Model. J. Biomech. Eng. 132, 051007. doi:10.1115/1.4000964
Cheng Z., Wood N. B., Gibbs R. G. J., Xu X. Y. (2015). Geometric and Flow Features of Type B Aortic Dissection: Initial Findings and Comparison of Medically Treated and Stented Cases. Ann. Biomed. Eng. 43, 177–189. doi:10.1007/s10439-014-1075-8
Chong M. Y., Gu B., Chan B. T., Ong Z. C., Xu X. Y., Lim E. (2020). Effect of Intimal Flap Motion on Flow in Acute Type B Aortic Dissection by Using Fluid-Structure Interaction. Int. J. Numer. Method Biomed. Eng. 36, e3399. doi:10.1002/cnm.3399
Crosetto P., Reymond P., Deparis S., Kontaxakis D., Stergiopulos N., Quarteroni A. (2011). Fluid-Structure Interaction Simulation of Aortic Blood Flow. Comput. Fluids 43, 46–57. doi:10.1016/j.compfluid.2010.11.032
DeBakey M. E., McCollum C. H., Crawford E. S., Morris G. C., Howell J., Noon G. P., et al. (1982). Dissection and Dissecting Aneurysms of the Aorta: Twenty-Year Follow-Up of Five Hundred Twenty-Seven Patients Treated Surgically. Surgery 92, 1118–1134.
Ekaterinaris J. A., Ioannou C. V., Katsamouris A. N. (2006). Flow Dynamics in Expansions Characterizing Abdominal Aorta Aneurysms. Ann. Vasc. Surg. 20, 351–359. doi:10.1007/s10016-006-9031-1
Fattori R., Bacchi-Reggiani L., Bertaccini P., Napoli G., Fusco F., Longo M., et al. (2000). Evolution of Aortic Dissection after Surgical Repair. Am. J. Cardiol. 86, 868–872. doi:10.1016/s0002-9149(00)01108-5
Halstead J. C., Meier M., Etz C., Spielvogel D., Bodian C., Wurm M., et al. (2007). The Fate of the Distal Aorta after Repair of Acute Type A Aortic Dissection. J. Thorac. Cardiovasc. Surg. 133, 127–135. doi:10.1016/j.jtcvs.2006.07.043
Holzapfel G. A., Gasser T. C., Ogden R. W. (2000). A New Constitutive Framework for Arterial Wall Mechanics and a Comparative Study of Material Models. J. Elast. 61, 1–48.
Jin S., Oshinski J., Giddens D. P. (2003). Effects of Wall Motion and Compliance on Flow Patterns in the Ascending Aorta. J. Biomech. Eng. 125, 347–354. doi:10.1115/1.1574332
Kan X., Ma T., Lin J., Wang L., Dong Z., Xu X. Y. (2021). Patient-specific Simulation of Stent-Graft Deployment in Type B Aortic Dissection: Model Development and Validation. Biomech. Model. Mechanobiol. 20, 2247–2258. doi:10.1007/s10237-021-01504-x
Karmonik C., Duran C., Shah D. J., Anaya-Ayala J. E., Davies M. G., Lumsden A. B., et al. (2012). Preliminary Findings in Quantification of Changes in Septal Motion during Follow-Up of Type B Aortic Dissections. J. Vasc. Surg. 55, 1419–1426. doi:10.1016/j.jvs.2011.10.127
Khanafer K. M., Bull J. L., Upchurch G. R., Berguer R. (2007). Turbulence Significantly Increases Pressure and Fluid Shear Stress in an Aortic Aneurysm Model under Resting and Exercise Flow Conditions. Ann. Vasc. Surg. 21, 67–74. doi:10.1016/j.avsg.2006.10.009
Khannous F., Guivier-Curien C., Gaudry M., Piquet P., Deplano V. (2020). Residual Type B Aortic Dissection FSI Modeling. Comput. Methods Biomechanics Biomed. Eng. 23, S153–S155. doi:10.1080/10255842.2020.1812165
Menichini C., Cheng Z., Gibbs R. G. J., Xu X. Y. (2016). Predicting False Lumen Thrombosis in Patient-specific Models of Aortic Dissection. J. R. Soc. Interface. 13, 20160759. doi:10.1098/rsif.2016.0759
Menter F. R., Langtry R. B., Likki S. R., Suzen Y. B., Huang P. G., Volker S. (2006). A Correlation-Based Transition Model Using Local Variables-Part I: Model Formulation. J. Turbomach. 128, 413–422. doi:10.1115/1.2184352
Nagano N., Cartier R., Zigras T., Mongrain R., Leask R. L. (2007). Mechanical Properties and Microscopic Findings of a Dacron Graft Explanted 27 Years after Coarctation Repair. J. Thorac. Cardiovasc. Surg. 134, 1577–1578. doi:10.1016/j.jtcvs.2007.08.005
Nobili M., Sheriff J., Morbiducci U., Redaelli A., Bluestein D. (2008). Platelet Activation Due to Hemodynamic Shear Stresses: Damage Accumulation Model and Comparison to In Vitro Measurements. ASAIO J. 54, 64–72. doi:10.1097/mat.0b013e31815d6898
Qiao A., Yin W., Chu B. (2015). Numerical Simulation of Fluid-Structure Interaction in Bypassed DeBakey III Aortic Dissection. Comput. Methods Biomechanics Biomed. Eng. 18, 1173–1180. doi:10.1080/10255842.2014.881806
Qiao Y., Mao L., Ding Y., Zhu T., Luo K., Fan J. (2021). Fluid‐structure Interaction: Insights into Biomechanical Implications of Endograft after Thoracic Endovascular Aortic Repair. Comput. Biol. Med. 138, 104882. doi:10.1016/j.compbiomed.2021.104882
Qiao Y., Zeng Y., Ding Y., Fan J., Luo K., Zhu T. (2019). Numerical Simulation of Two-phase Non-newtonian Blood Flow with Fluid-Structure Interaction in Aortic Dissection. Comput. Methods Biomechanics Biomed. Eng. 22, 620–630. doi:10.1080/10255842.2019.1577398
Roy D., Holzapfel G. A., Kauffmann C., Soulez G. (2014). Finite Element Analysis of Abdominal Aortic Aneurysms: Geometrical and Structural Reconstruction with Application of an Anisotropic Material Model. IMA J. Appl. Math. 79, 1011–1026. doi:10.1093/imamat/hxu037
Rylski B., Hahn N., Beyersdorf F., Kondov S., Wolkewitz M., Blanke P., et al. (2017). Fate of the Dissected Aortic Arch after Ascending Replacement in Type A Aortic Dissection†. Eur. J. Cardiothorac. Surg. 51, 1127–1134. doi:10.1093/ejcts/ezx062
Ryzhakov P., Soudah E., Dialami N. (2019). Computational Modeling of the Fluid Flow and the Flexible Intimal Flap in Type B Aortic Dissection via a Monolithic Arbitrary Lagrangian/Eulerian Fluid-Structure Interaction Model. Int. J. Numer. Method Biomed. Eng. 35, e3239–8. doi:10.1002/cnm.3239
Shad R., Kong S., Fong R., Quach N., Kasinpila P., Bowles C., et al. (2021). Computational Fluid Dynamics Simulations to Predict False Lumen Enlargement after Surgical Repair of Type-A Aortic Dissection. Semin. Thorac. Cardiovasc. Surg. 3, S1043–S0679. doi:10.1053/j.semtcvs.2021.05.012
Singh S. D., Xu X. Y., Pepper J. R., Izgi C., Treasure T., Mohiaddin R. H. (2016). Effects of Aortic Root Motion on Wall Stress in the Marfan Aorta before and after Personalised Aortic Root Support (PEARS) Surgery. J. Biomechanics 49, 2076–2084. doi:10.1016/j.jbiomech.2016.05.011
Tan F. P. P., Torii R., Borghi A., Mohiaddin R. H., Wood N. B., Xu X. Y. (2009). Fluid-Structure Interaction Analysis of Wall Stress and Flow Patterns in a Thoracic Aortic Aneurysm. Int. J. Appl. Mech. 01, 179–199. doi:10.1142/s1758825109000095
Tse K. M., Chiu P., Lee H. P., Ho P. (2011). Investigation of Hemodynamics in the Development of Dissecting Aneurysm within Patient-specific Dissecting Aneurismal Aortas Using Computational Fluid Dynamics (CFD) Simulations. J. Biomechanics 44, 827–836. doi:10.1016/j.jbiomech.2010.12.014
van Puyvelde J., Verbeken E., Verbrugghe P., Herijgers P., Meuris B. (2016). Aortic Wall Thickness in Patients with Ascending Aortic Aneurysm versus Acute Aortic Dissection. Eur. J. Cardiothorac. Surg. 49, 756–762. doi:10.1093/ejcts/ezv197
Vorp D. A., Schiro B. J., Ehrlich M. P., Juvonen T. S., Ergin M. A., Griffith B. P. (2003). Effect of Aneurysm on the Tensile Strength and Biomechanical Behavior of the Ascending Thoracic Aorta. Ann. Thorac. Surg. 75, 1210–1214. doi:10.1016/s0003-4975(02)04711-2
Votta E., Presicce M., Della Corte A., Dellegrottaglie S., Bancone C., Sturla F., et al. (2017). A Novel Approach to the Quantification of Aortic Root In Vivo Structural Mechanics. Int. J. Numer. Meth. Biomed. Engng. 33, e2849. doi:10.1002/cnm.2849
Wang X., Li X. (2011). Computational Simulation of Aortic Aneurysm Using FSI Method: Influence of Blood Viscosity on Aneurismal Dynamic Behaviors. Comput. Biol. Med. 41, 812–821. doi:10.1016/j.compbiomed.2011.06.017
Weltert L., De Paulis R., Scaffa R., Maselli D., Bellisario A., D'Alessandro S. (2009). Re-Creation of a Sinuslike Graft Expansion in Bentall Procedure Reduces Stress at the Coronary Button Anastomoses: A Finite Element Study. J. Thorac. Cardiovasc. Surg. 137, 1082–1087. doi:10.1016/j.jtcvs.2008.10.013
Westaby S., Saito S., Katsumata T. (2002). Acute Type A Dissection: Conservative Methods Provide Consistently Low Mortality. Ann. Thorac. Surg. 73, 707–713. doi:10.1016/S0003-4975(01)03449-X
Zhu Y., Mirsadraee S., Asimakopoulos G., Gambaro A., Rosendahl U., Pepper J., et al. (2021). Association of Hemodynamic Factors and Progressive Aortic Dilatation Following Type A Aortic Dissection Surgical Repair. Sci. Rep. 11, 1–13. doi:10.1038/s41598-021-91079-5
Zhu Y., Xu X. Y., Rosendahl U., Pepper J., Mirsadraee S. (2022). Prediction of Aortic Dilatation in Surgically Repaired Type A Dissection: A Longitudinal Study Using Computational Fluid Dynamics. JTCVS Open 9, 11–27. doi:10.1016/j.xjon.2022.01.019
Zierer A., Voeller R. K., Hill K. E., Kouchoukos N. T., Damiano R. J., Moon M. R. (2007). Aortic Enlargement and Late Reoperation after Repair of Acute Type A Aortic Dissection. Ann. Thorac. Surg. 84, 479–487. doi:10.1016/j.athoracsur.2007.03.084
Zimmermann J., Bäumler K., Loecher M., Cork T. E., Kolawole F. O., Gifford K., et al. (2021). “Quantitative Hemodynamics in Aortic Dissection: Comparing In Vitro MRI with FSI Simulation in a Compliant Model,” in International Conference on Functional Imaging and Modeling of the Heart, Cham (Springer), 575–586. doi:10.1007/978-3-030-78710-3_55
Keywords: fluid-structure interaction, repaired type A aortic dissection, hemodynamics, luminal pressure difference, wall shear stress
Citation: Zhu Y, Mirsadraee S, Rosendahl U, Pepper J and Xu XY (2022) Fluid-Structure Interaction Simulations of Repaired Type A Aortic Dissection: a Comprehensive Comparison With Rigid Wall Models. Front. Physiol. 13:913457. doi: 10.3389/fphys.2022.913457
Received: 05 April 2022; Accepted: 17 May 2022;
Published: 14 June 2022.
Edited by:
Yong Wang, Max Planck Society, GermanyReviewed by:
Diego Gallo, Politecnico di Torino, ItalyCopyright © 2022 Zhu, Mirsadraee, Rosendahl, Pepper and Xu. This is an open-access article distributed under the terms of the Creative Commons Attribution License (CC BY). The use, distribution or reproduction in other forums is permitted, provided the original author(s) and the copyright owner(s) are credited and that the original publication in this journal is cited, in accordance with accepted academic practice. No use, distribution or reproduction is permitted which does not comply with these terms.
*Correspondence: Xiao Yun Xu, eXVuLnh1QGltcGVyaWFsLmFjLnVr
Disclaimer: All claims expressed in this article are solely those of the authors and do not necessarily represent those of their affiliated organizations, or those of the publisher, the editors and the reviewers. Any product that may be evaluated in this article or claim that may be made by its manufacturer is not guaranteed or endorsed by the publisher.
Research integrity at Frontiers
Learn more about the work of our research integrity team to safeguard the quality of each article we publish.